Prenatal development of neonatal vocalizations
- Princeton Neuroscience Institute, Princeton University, United States
- Department of Psychology , Princeton University, United States
- Department of Ecology and Evolutionary Biology, Princeton University, United States
- Department of Computer Science and Engineering, The University of Texas at Arlington, United States
Figures
Figure 1
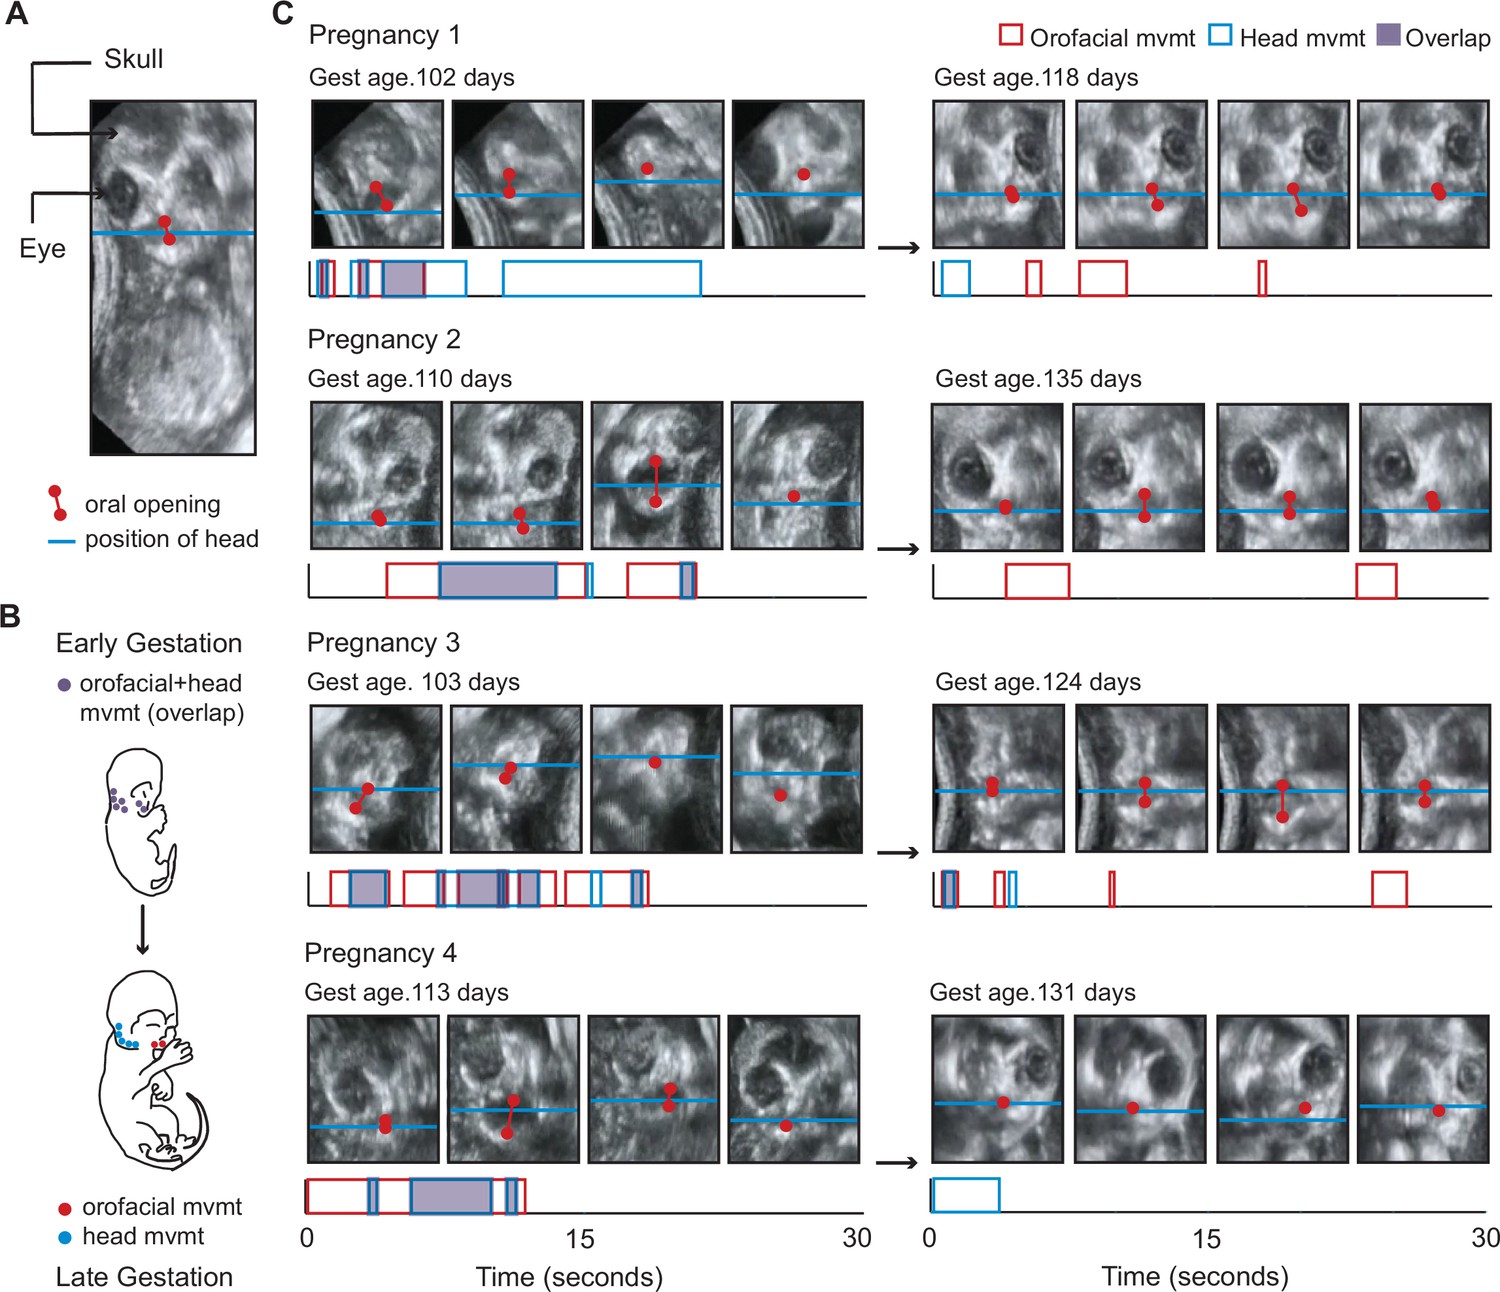
Fetal orofacial movements undergo striking changes through gestation, observable using ultrasound imaging.
(A) Still frame from fetal ultrasound. Red is used to mark the upper and lower jaws and indicate oral opening. The blue line marks the position of the head, tracked using the jaw joint. (B) Illustration of the expected developmental change in orofacial and head movements. The top image depicts a young fetus with orofacial and head regions often moving together. The bottom image illustrates a late-stage fetus, with orofacial and head regions moving in isolation. (C) Developmental change in orofacial and head movements for each pregnancy. Top: still frames from representative ultrasound clips. Gestational day is indicated in the upper left of each panel. Below: time stamps of the orofacial and head movements in the clip. Durations of orofacial (red) and head (blue) movements, and regions of overlap (purple) are indicated. The amplitude of movement has no bearing on our analysis. This developmental change can be observed by comparing Videos 1 and 2.
Figure 2

Fetal orofacial movements differentiate from a larger movement pattern that includes the head, leading to an increase in ‘order’ in the motor behavior of the fetus.
(A) Proportion of behavioral states per session. A total of 5 states are represented in red (isolated orofacial movements), blue (isolated head movements), purple (overlap: orofacial followed by head), green (overlap: head followed by orofacial) and yellow (synchronous movements). (B) Transition diagrams visualizing the behavioral states in four sessions chosen from different stages of gestation of a single pregnancy. The widths of the arrows indicate the transition frequencies between states. (C) Developmental change in the behavioral variability per session. Points represent entropy measures for single sessions, and the curve represents optimal polynomial fit based on Akaike’s information criterion (AIC). 2.32 bits is the maximum entropy for a behavior with 5 possible states. (n=64 sessions; p<0.001 in the test of nullity of the relation between gestational day and entropy) (D) Kullback-Leibler (KL) divergence of behavioral state distributions. Points represent the relative entropy measures for every session compared to the first testing session, and the curve represents optimal polynomial fit. (n=64 sessions; p<0.001 for linear fit with a positive slope) (E) Developmental change in the rates of orofacial and head movements. Points represent the rate of orofacial (red) and head (blue) movements in each session (n=1977 for orofacial movements and n=1216 for head movements, in 64 sessions), the curves represent the optimal polynomial fits. (F) Same as (E), for each pregnancy. (G) Developmental change in overlap of orofacial and head movements. Points represent the percentage of overlap in each session (n=64 sessions), curves represent optimal polynomial fits for overlap and permutation test, shaded regions denote the 95% confidence interval for the fits. (p<0.001 for linear fit with negative slope, p=0.057 for the mean regression line in the permutation test) (H) Same as (G), for each pregnancy.
Figure 3
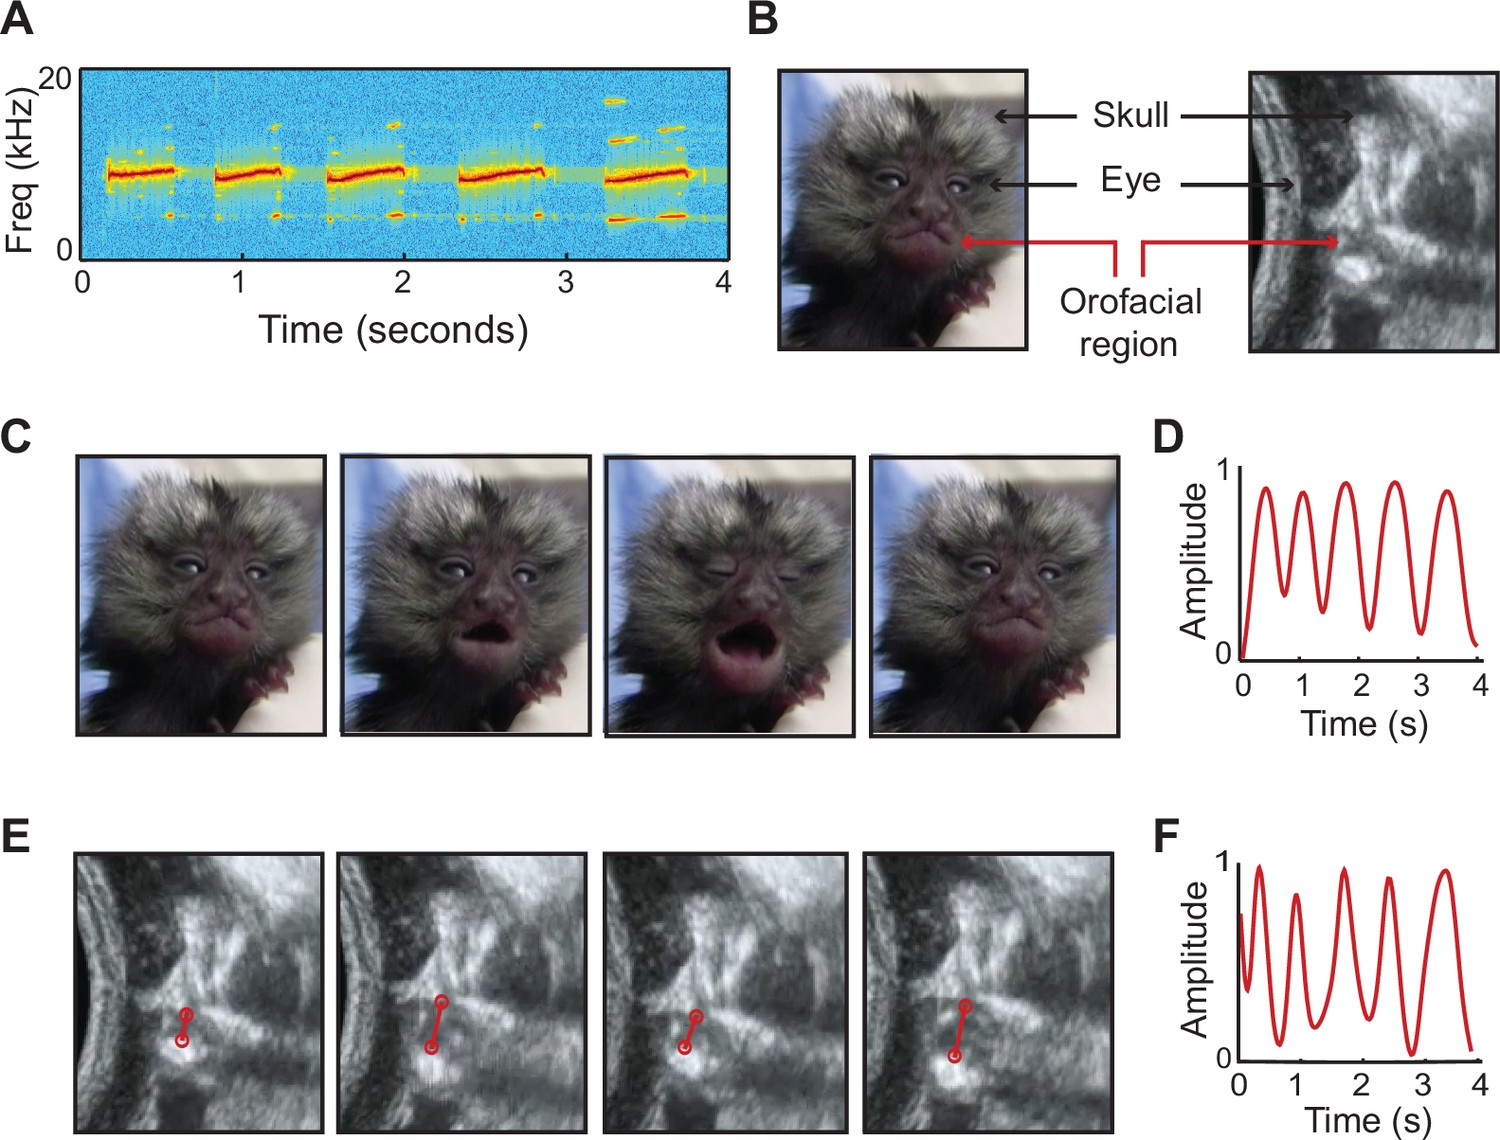
Signature features of marmoset infant calls observed in fetal movements.
(A) Spectrogram of a five-syllable infant contact call from postnatal week 1. (B) Stills of marmoset infant and fetus, indicating orofacial region. (C) Video stills of week 1 infant producing a five-syllable contact call. (D) Temporal profile of the infant contact call in (C), generated by tracking orofacial movements. (E) Ultrasound stills of the orofacial movements of a late-stage marmoset fetus. (F) Temporal profile of the fetal orofacial movements in (E). The match between infant and fetal orofacial movements can be observed in Video 3.
Figure 4
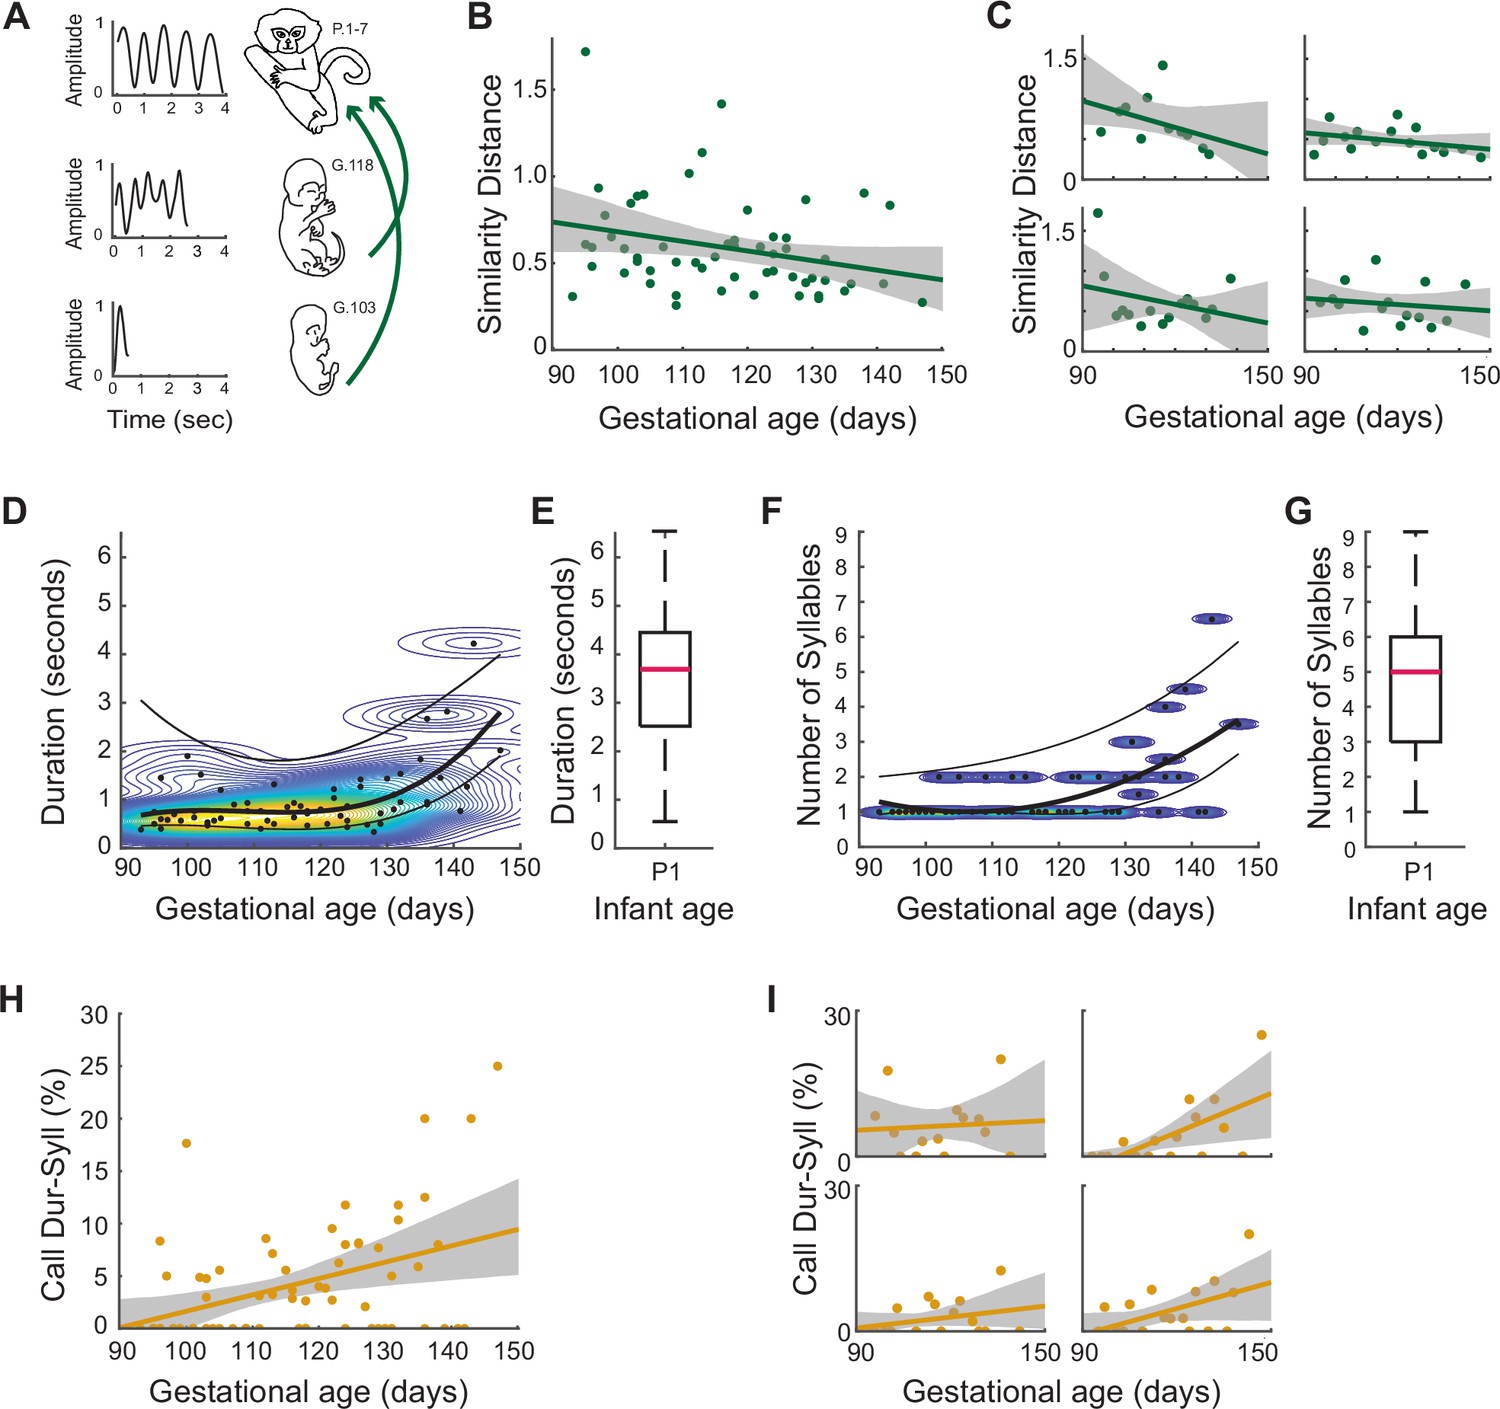
Signature features of marmoset infant calls on P1-7, emerge prenatally as distinct patterns of orofacial movements.
(A) Illustration of the gestational change in the temporal profiles of fetal orofacial movements. On the left are the temporal profiles generated by tracking orofacial movements. On the right are the ages of the animals. (B) Matching temporal profiles of fetal orofacial movements to that of week 1 infant contact calls. Points represent the DTW similarity distance (lower the similarity distance, higher the matching), and the line represents the regression fit. (β±SE = –0.005±0.003, t=–1.97; F[1,56]=4.60; p=.037, multiple linear regression analysis controlling for the different pregnancies) (C) Same as (B), for each pregnancy. (D) Gestational change in the durations of fetal orofacial movements. Points represent the median movement duration per session (n=1845 total movements, 64 sessions). The curves are fit to the median, 75th and 25th percentile values. The curves were generated by calculating the optimal polynomial degree for the median values. The background contour map indicates durations with the highest density of movements (red: high density; blue: low density). (E) Infant contact call durations on P1. The pink bar marks the median contact call duration (n=120; median duration = 3.69s; SE = 0.14). (F) Gestational change in the syllable number of fetal orofacial movements. Points represent the median syllable number per session (n=1845 total movements, 64 sessions) . The curves are fit to the median, 75th and 25th percentile values. The curves were generated by first calculating the optimal polynomial degree for the median values. The background contour map indicates syllable numbers with the highest density of movements (yellow: high density; blue: low density). (G) Infant contact call syllable numbers on P1. The pink bar marks the median syllable number (n=120; median = 5 syllables; SE = 0.18). (H) Fetal orofacial movements matching infant contact call duration+syllable number signatures. Points represent the match percentage per session, and the line represents the regression fit (β±SE = 0.15±0.04, t=3.44; F(1, 63)=12.09, p=0.001, in the multiple linear regression analysis controlling for the different pregnancies). (I) Same as (H), for each pregnancy.
Figure 5
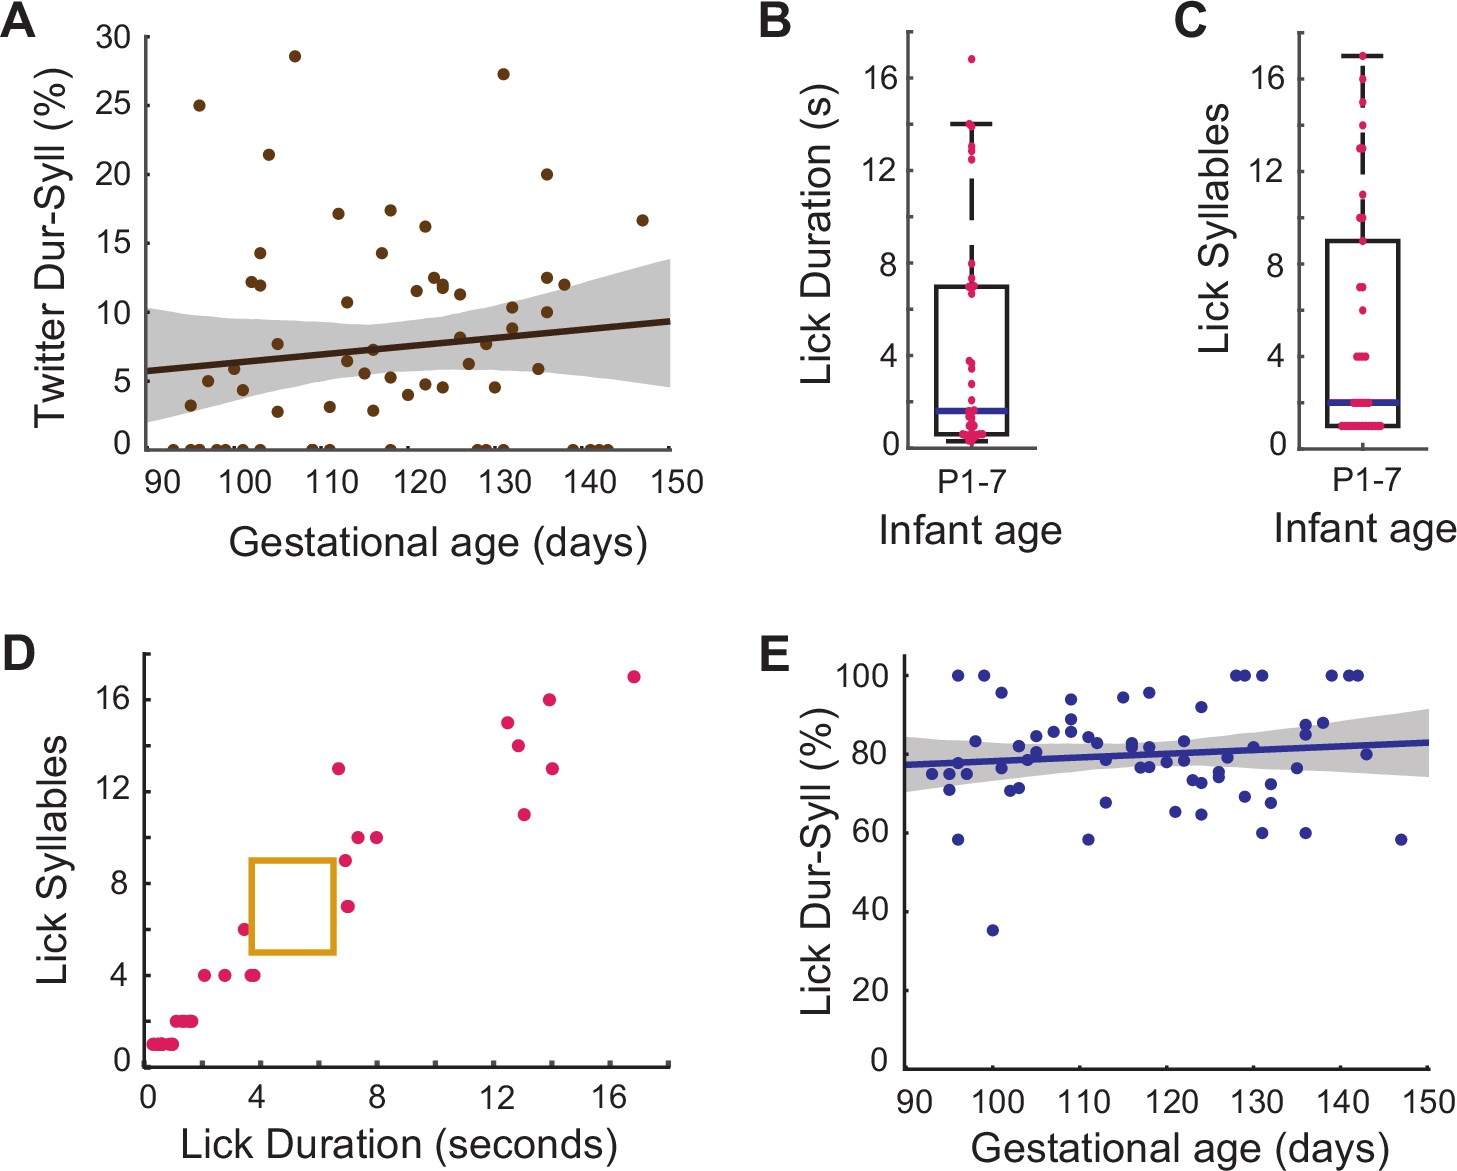
Prenatal developmental change specific to contact calls.
(A) Fetal orofacial movements matching infant twitter call duration +syllable number signatures. Points represent the match percentage per session, and the line represents the regression fit ( β±SE = 0.06±0.06, t=0.99; F(1, 63)=0.87, p=0.35, multiple linear regression analysis controlling for the different pregnancies). (B) Infant lick durations on P1-7. Points represent the durations of individual movements. The blue bar marks the median lick duration (median = 1.6s; SE = 0.83). (C) Infant lick call syllable numbers on P1-7. Points represent the syllable numbers of individual movements. The blue bar marks the median syllable number (median = 2; SE = 0.85). (D) Infant lick call duration +syllable number signatures distinct from contact calls. Points represent the duration and syllable number features of individual licks. The yellow box represents the contact call duration and syllable number profile. (E) Fetal orofacial movements matching infant lick call duration +syllable number signatures. Points represent the match percentage per session, and the line represents the regression fit (β±SE = 0.10±0.11, t=0.97; F(1, 63)=0.78, p=0.38, multiple linear regression analysis controlling for the different pregnancies).
Author response image 1
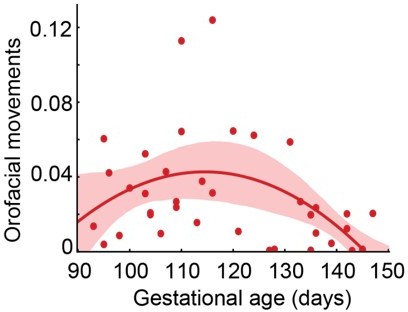
Developmental profile of orofacial movements using duration as the measure.
Y axis: total duration of orofacial movements per session / total duration fetal face is visible per session; X axis: gestational age.
Author response image 2
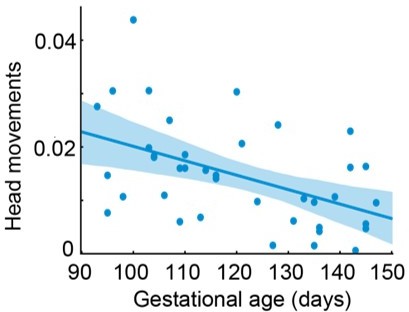
Developmental profile of head movements using duration as the measure.
Y axis: total duration of head movements per session / total duration fetal face is visible per session; X axis: gestational age.
Author response image 3
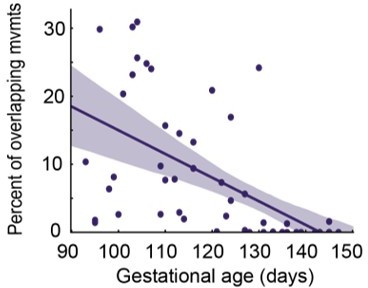
Overlap decline.
Y axis: total overlap duration of orofacial and head movements per session / total duration of orofacial and head movements per session; X axis: gestational age.
Videos
Video 1
Young fetus with orofacial and head regions moving together.
Video 2
Late-stage fetus with orofacial region moving in isolation.
Video 3
Fetal orofacial movements matching the infant contact call.
Additional files
-
Supplementary file 1
Statistics for each individual pregnancies for the case of matching spatiotemporal profiles of fetal and neonatal orofacial movements.
- https://cdn.elifesciences.org/articles/78485/elife-78485-supp1-v2.docx
-
MDAR checklist
- https://cdn.elifesciences.org/articles/78485/elife-78485-mdarchecklist1-v2.pdf
Download links
A two-part list of links to download the article, or parts of the article, in various formats.
Downloads (link to download the article as PDF)
Open citations (links to open the citations from this article in various online reference manager services)
Cite this article (links to download the citations from this article in formats compatible with various reference manager tools)
Prenatal development of neonatal vocalizations
eLife 11:e78485.
https://doi.org/10.7554/eLife.78485


