Anopheles homing suppression drive candidates exhibit unexpected performance differences in simulations with spatial structure
- Department of Computational Biology, Cornell University, United States
- Department of Molecular Biology and Genetics, Cornell University, United States
- Center for Bioinformatics, School of Life Sciences, Peking-Tsinghua Center for Life Sciences, Peking University, China
Figures
Figure 1

Drive mechanisms and effect of drive parameters.
(A) Germline resistance allele formation occurs first in drive heterozygotes during reproduction. Remaining alleles can undergo drive conversion. If the mother has a drive allele, wild-type alleles in the offspring can be converted to resistance alleles in the early embryo, regardless of whether the offspring inherited a drive allele. Because all resistance alleles are assumed to be nonfunctional, any female genotype lacking at least one wild-type allele is sterile. (B) The fecundity of female drive heterozygotes is directly reduced by female somatic fitness costs. (C) The fecundity of any female is reduced if she mates with a nos male heterozygote. (D) Female progeny from male zpg or zpgX carriers may be sterile if paternal deposition occurs. (E) If the male parent has the zpgX or zpg2X drive, then X-shredding will result in an increased fraction of male progeny.
Figure 2
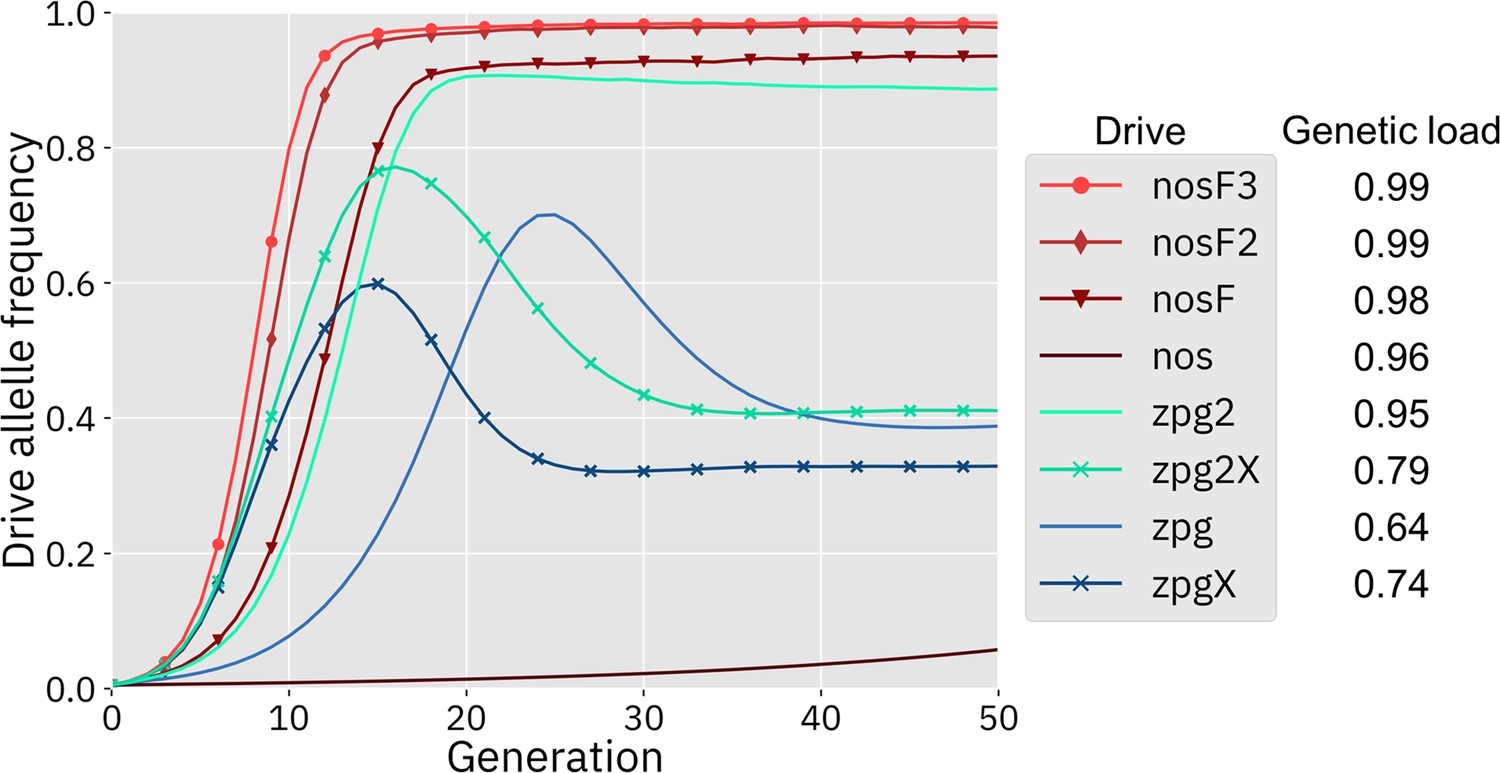
Drive allele frequency trajectories in the panmictic discrete-generation model.
Using default parameters, each drive was released into a panmictic population at 0.5% initial frequency (1% heterozygote release). The average allele frequency as estimated over 100 replicates per drive is plotted per generation. Offspring were artificially generated from fertile individuals at high rates to prevent complete population suppression even at high drive frequencies and genetic loads. For a description of this method for measuring genetic load, see the Supplemental Methods.
Figure 3
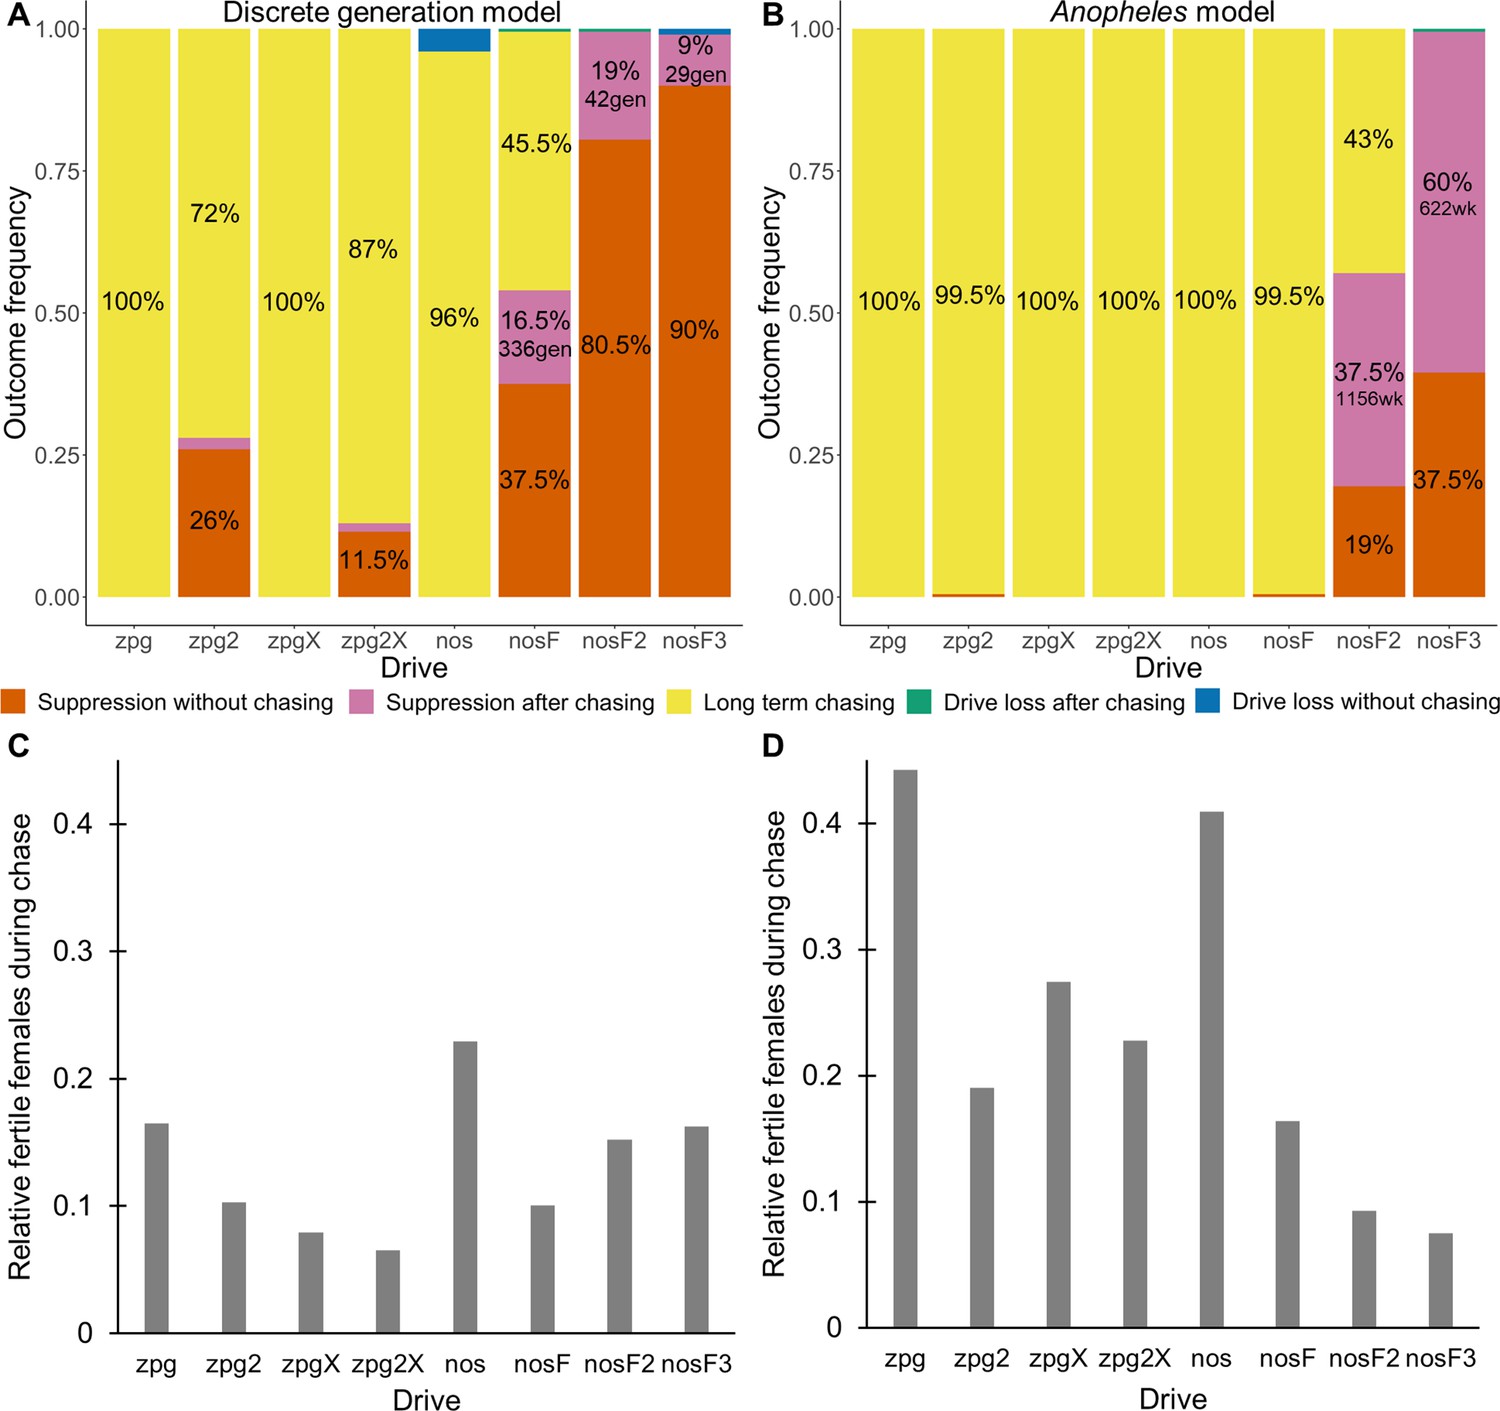
Outcomes in the spatial models.
Using default parameters, a low-density growth rate of 10, and with 200 replicates per drive, each drive was released into the middle of a wild-type population. The outcome was recorded after 1000 generations or when the population was eliminated for the discrete-generation (A) and Anopheles-specific (B) models. In outcomes involving chasing followed by suppression, the number of generations (gen) or weeks (wk) between the start of chasing and population elimination is shown. Also displayed is the relative number of fertile females during periods of chasing (including both long-term and short-term chases) compared to the starting amount prior to release of the drive for the discrete-generation (C) and Anopheles-specific (D) models. Due to the high number of replicates, the error for each data point is negligible, except for the nosF2 and nosF3 drives in the discrete-generation model due to the short duration of chasing.
Figure 4
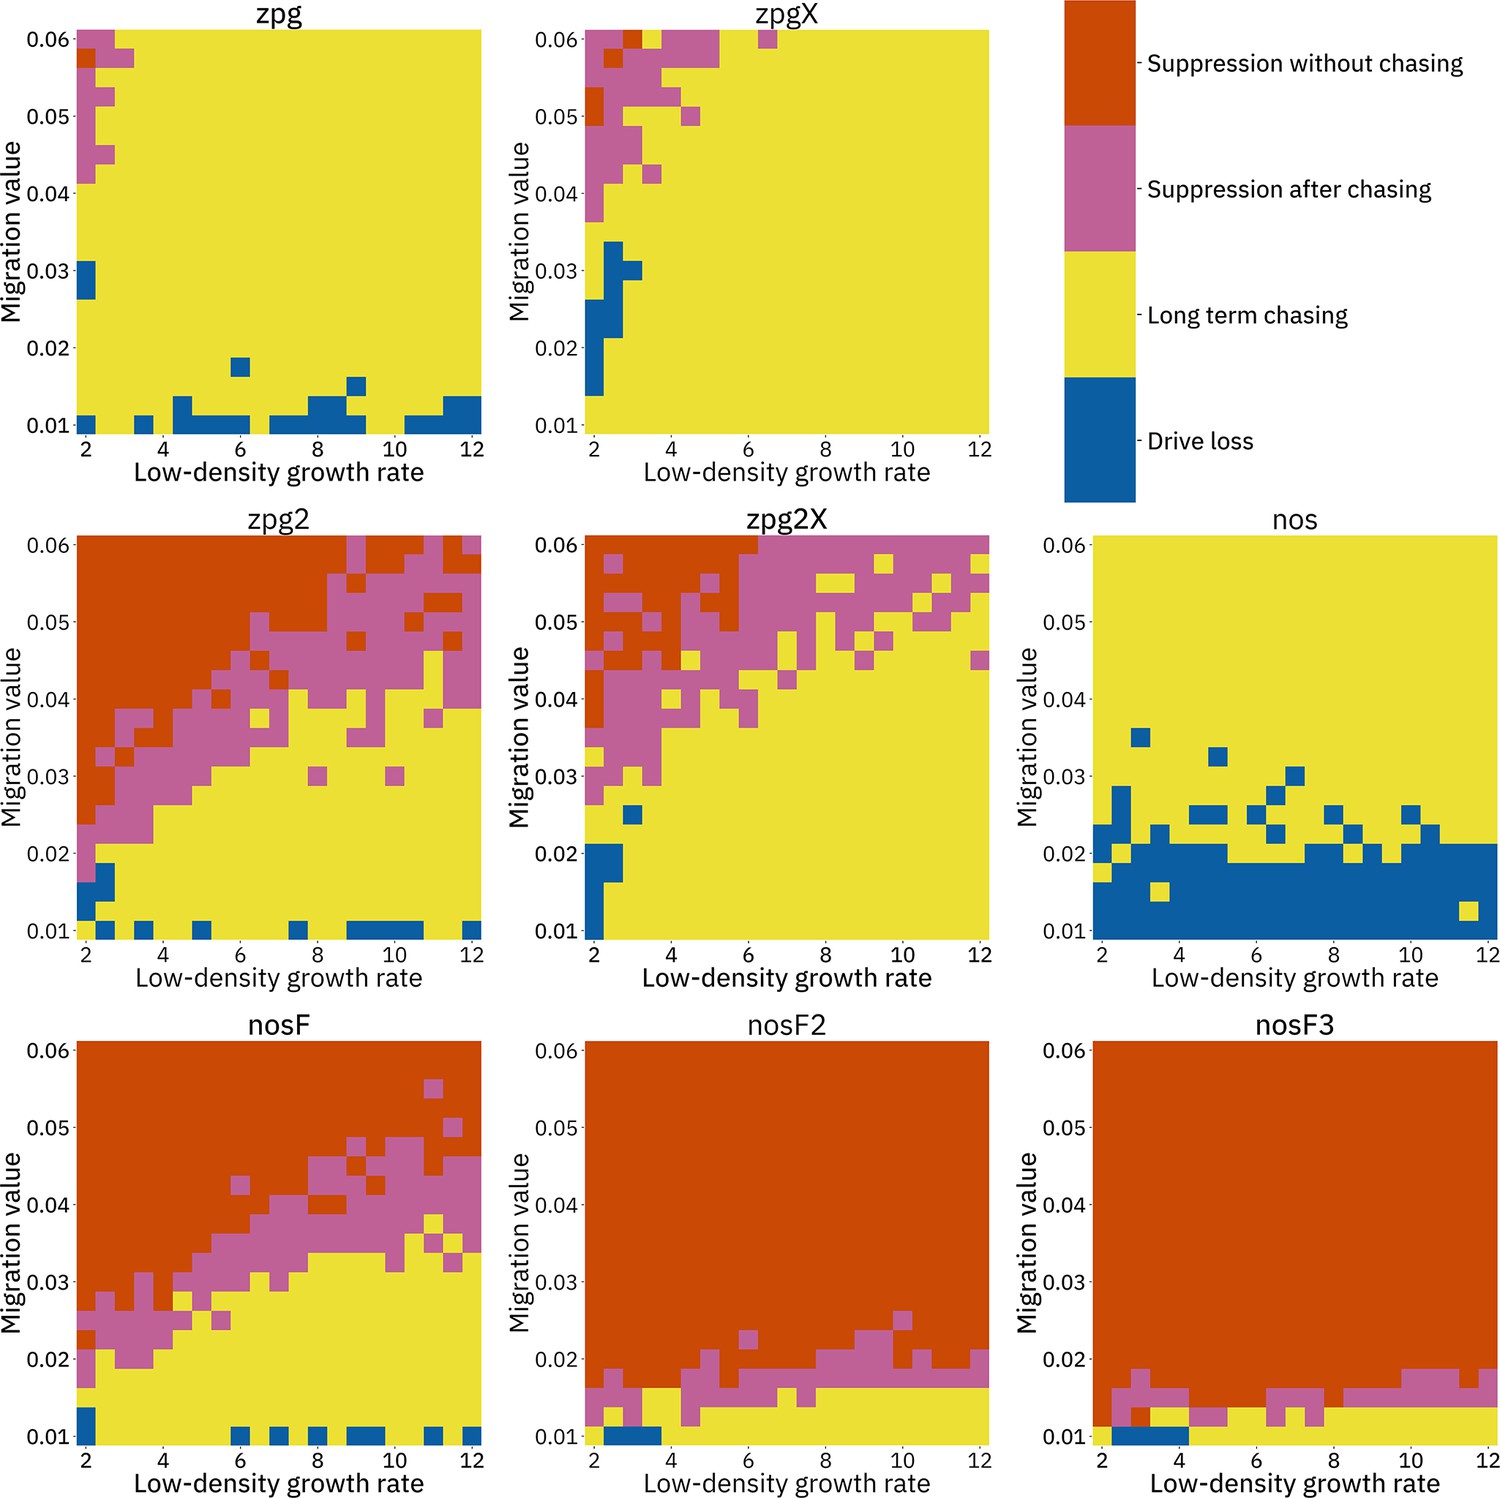
Impact of low-density growth rate and migration on outcomes in the discrete-generation model.
The color of each square represents the outcome from among 20 simulations, after adjustment to show the most representative outcome. The adjustment counts pairs of ‘suppression without chasing’ and ‘long-term chasing’ outcomes as two instances of ‘suppression after chasing’.
Figure 5
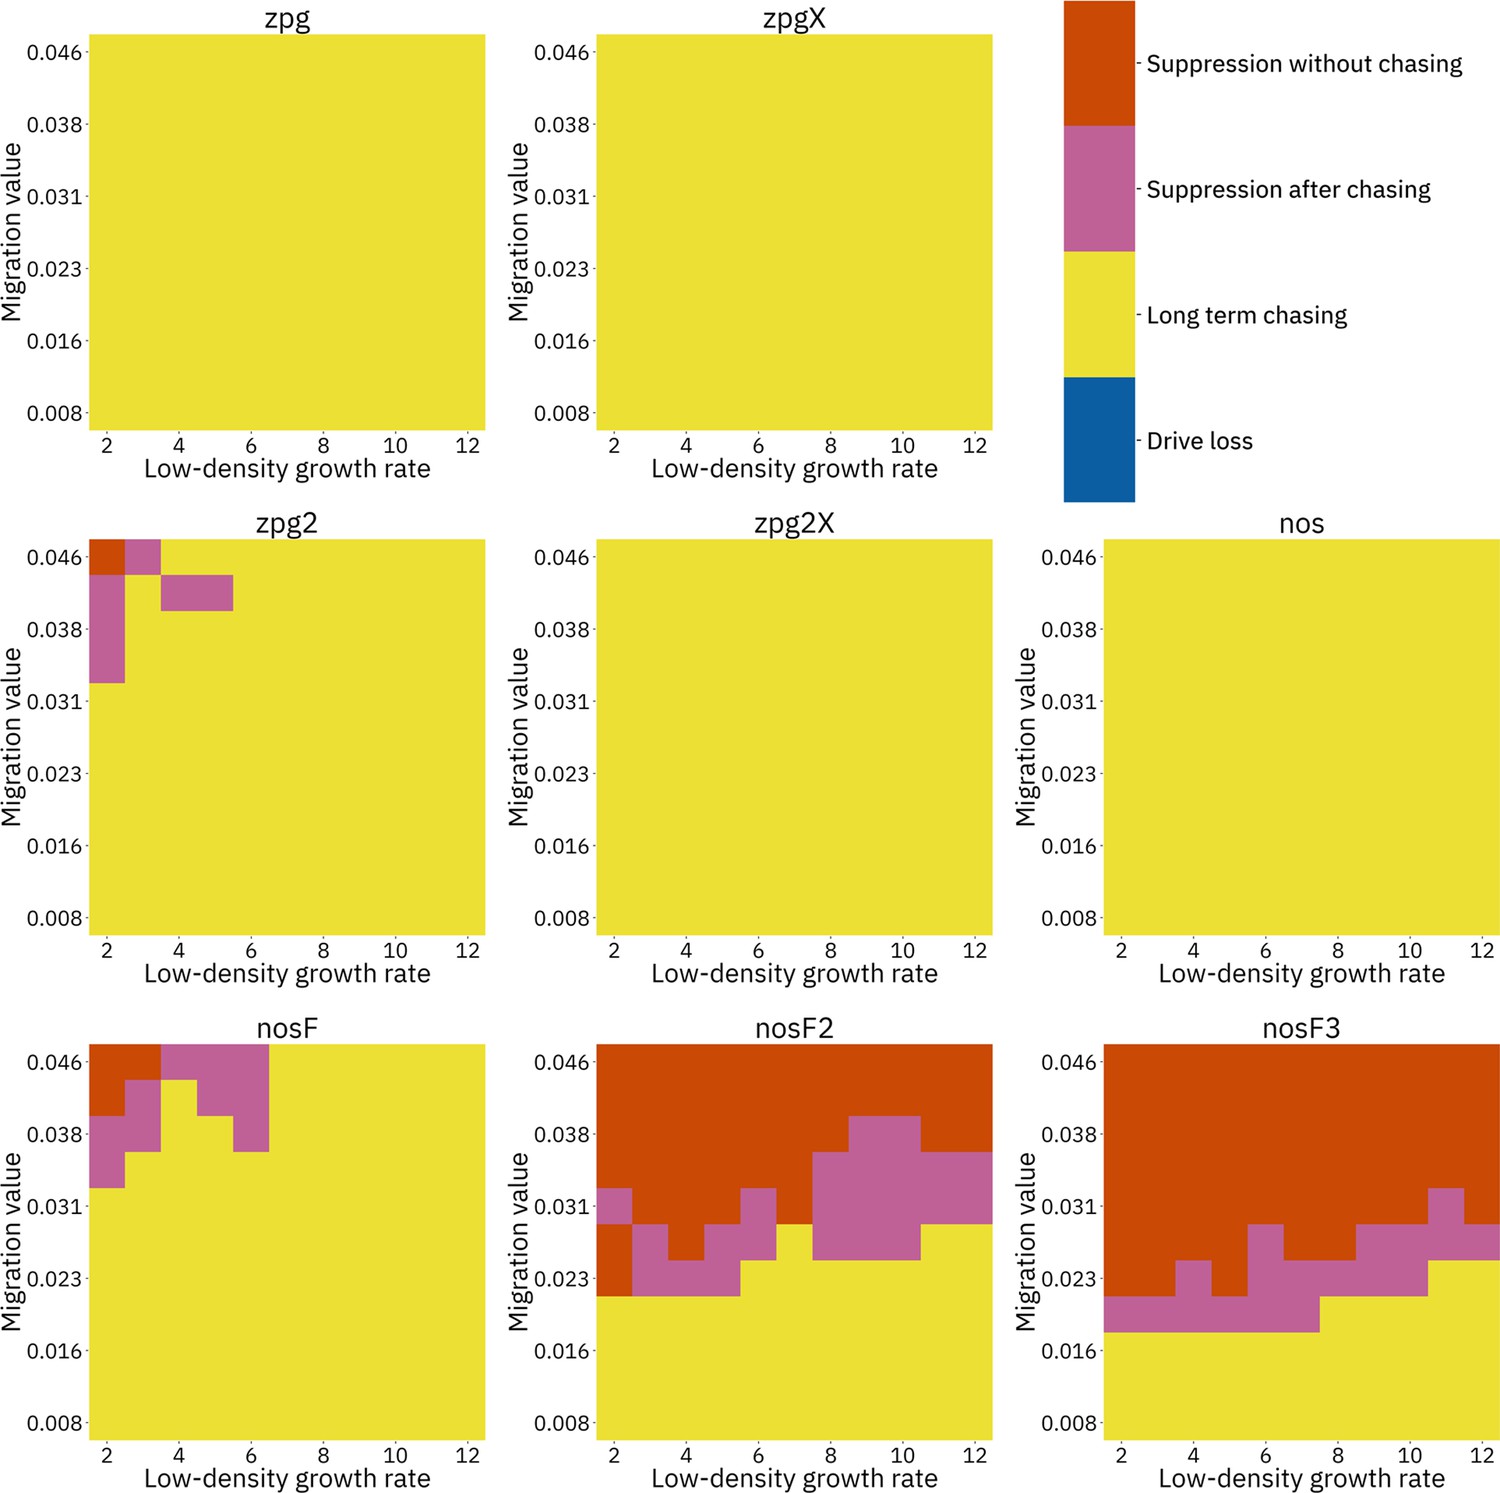
Impact of low-density growth rate and migration on outcomes in the Anopheles-specific model.
The color of each square represents the outcome from among 20 simulations after adjustment to show the most representative outcome. The adjustment counts pairs of ‘suppression without chasing’ and ‘long-term chasing’ outcomes as two instances of ‘suppression after chasing’. Note that the range of migration values in this model corresponds to the same net migration per generation as the range in Figure 4 (see methods).
Appendix 1—figure 1
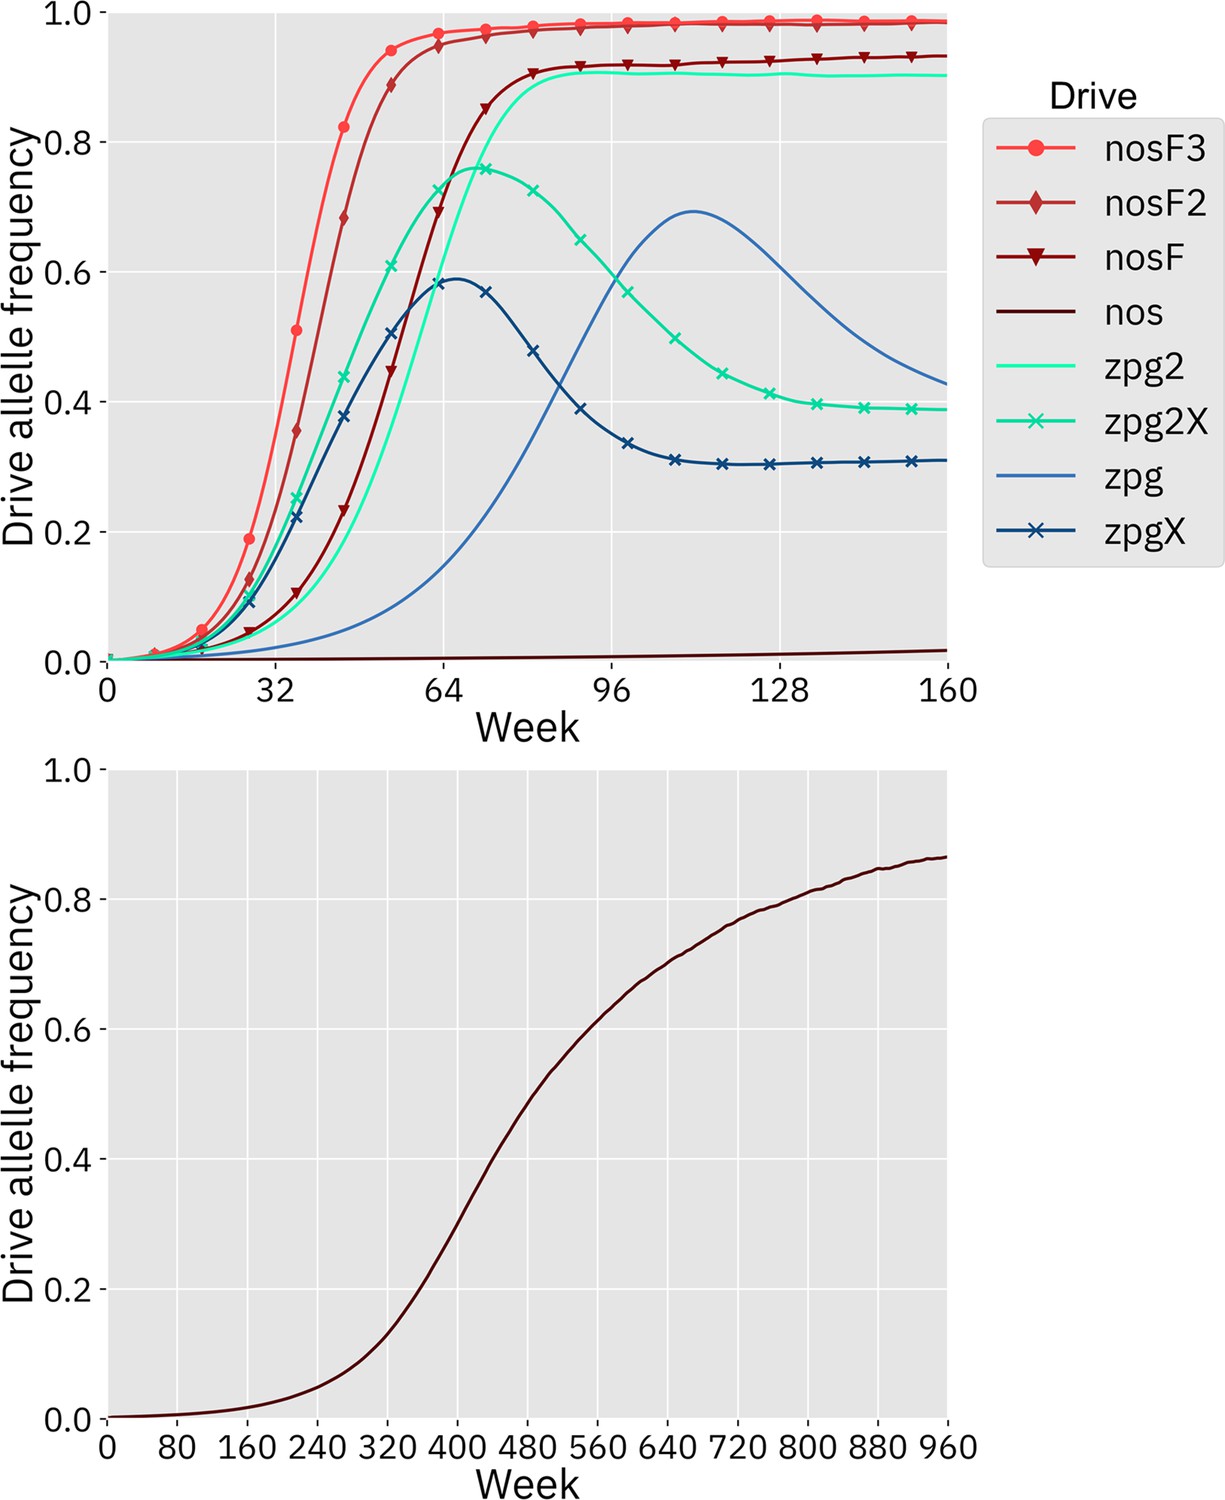
Drive allele frequency trajectories in the Anopheles-specific model.
Using default parameters and with 20 replicates per drive, each drive was released into a panmictic population. The average allele frequency for each week is displayed. Offspring were artificially generated from fertile individuals at high rates to prevent complete population suppression even at high drive frequencies and genetic loads (see Supplemental Methods). The nos drive increases more slowly at low frequency, but eventually reaches a high equilibrium frequency, as seen in the lower panel.
Appendix 1—figure 2

Outcomes in the spatial models with reduced low-density growth rate.
Using default parameters, a low-density growth rate of 6, and with 200 replicates per drive, each drive was released into the middle of a wild-type population. The outcome was recorded after 1000 generations or when the population was eliminated for the discrete-generation (A) and Anopheles-specific (B) models. In outcomes involving chasing followed by suppression, the number of generations (gen) or weeks (wk) between the start of chasing and population elimination is shown. Also displayed is the relative number of fertile females during periods of chasing (including both long-term and short-term chasing outcomes) compared to the starting amount prior to release of the drive for the discrete-generation (C) and Anopheles-specific (D) models. Due to the high number of replicates, the error for each data point is negligible, except for the nosF2 and nosF3 drives in the discrete-generation model due to the short duration of chasing.
Appendix 1—figure 3
The rate of suppression without chasing in the discrete-generation model.
Drive-carrying individuals were released into the middle of a wild-type population. The proportion of simulations in which suppression occurred either before a chase or within 10 generations of the start of chasing is shown. Each point represents the average of 20 simulations.
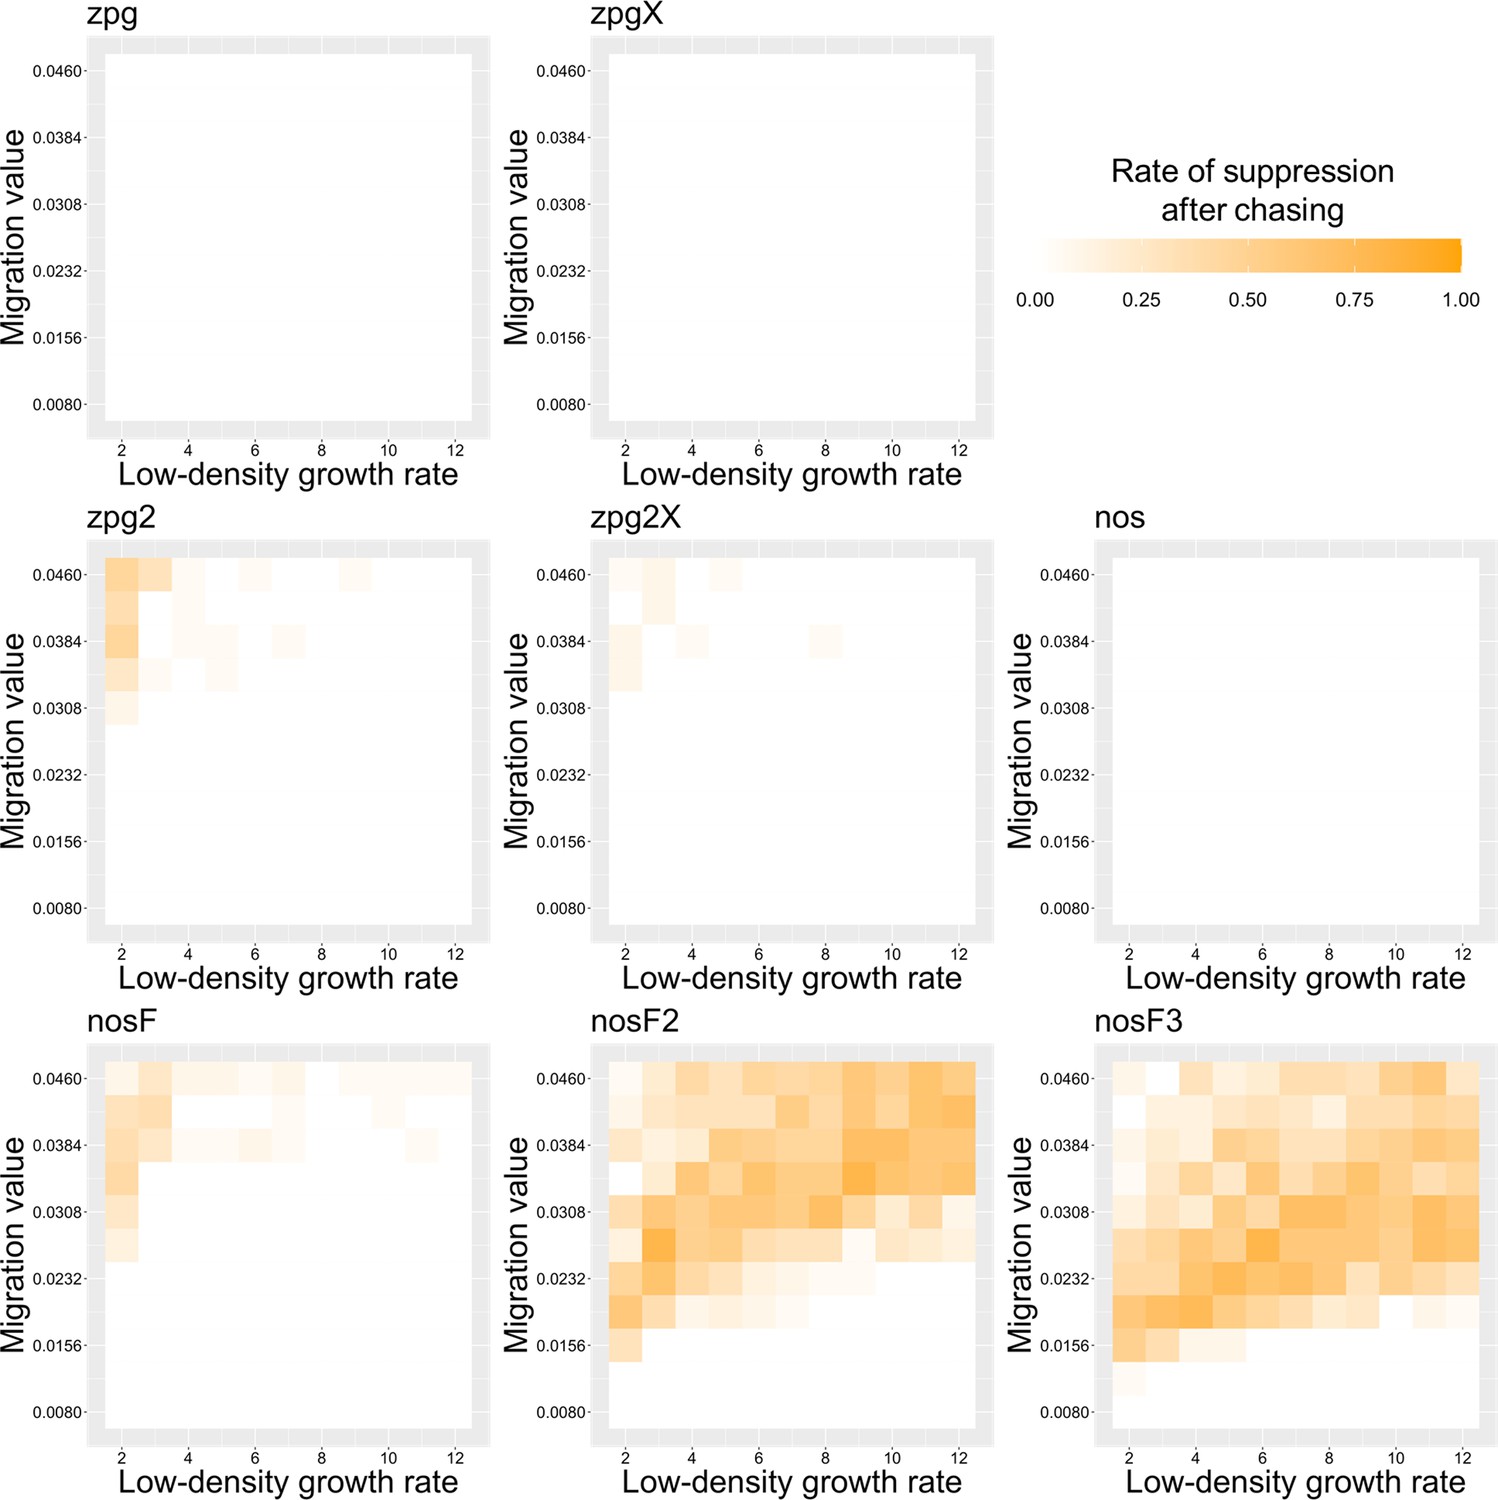
Appendix 1—figure 4
The rate of suppression after chasing in the discrete-generation model.
Drive-carrying individuals were released into the middle of a wild-type population. The proportion of simulations in which suppression occurred after a chase that lasted a minimum of 10 generations is shown. Each point represents the average of 20 simulations.
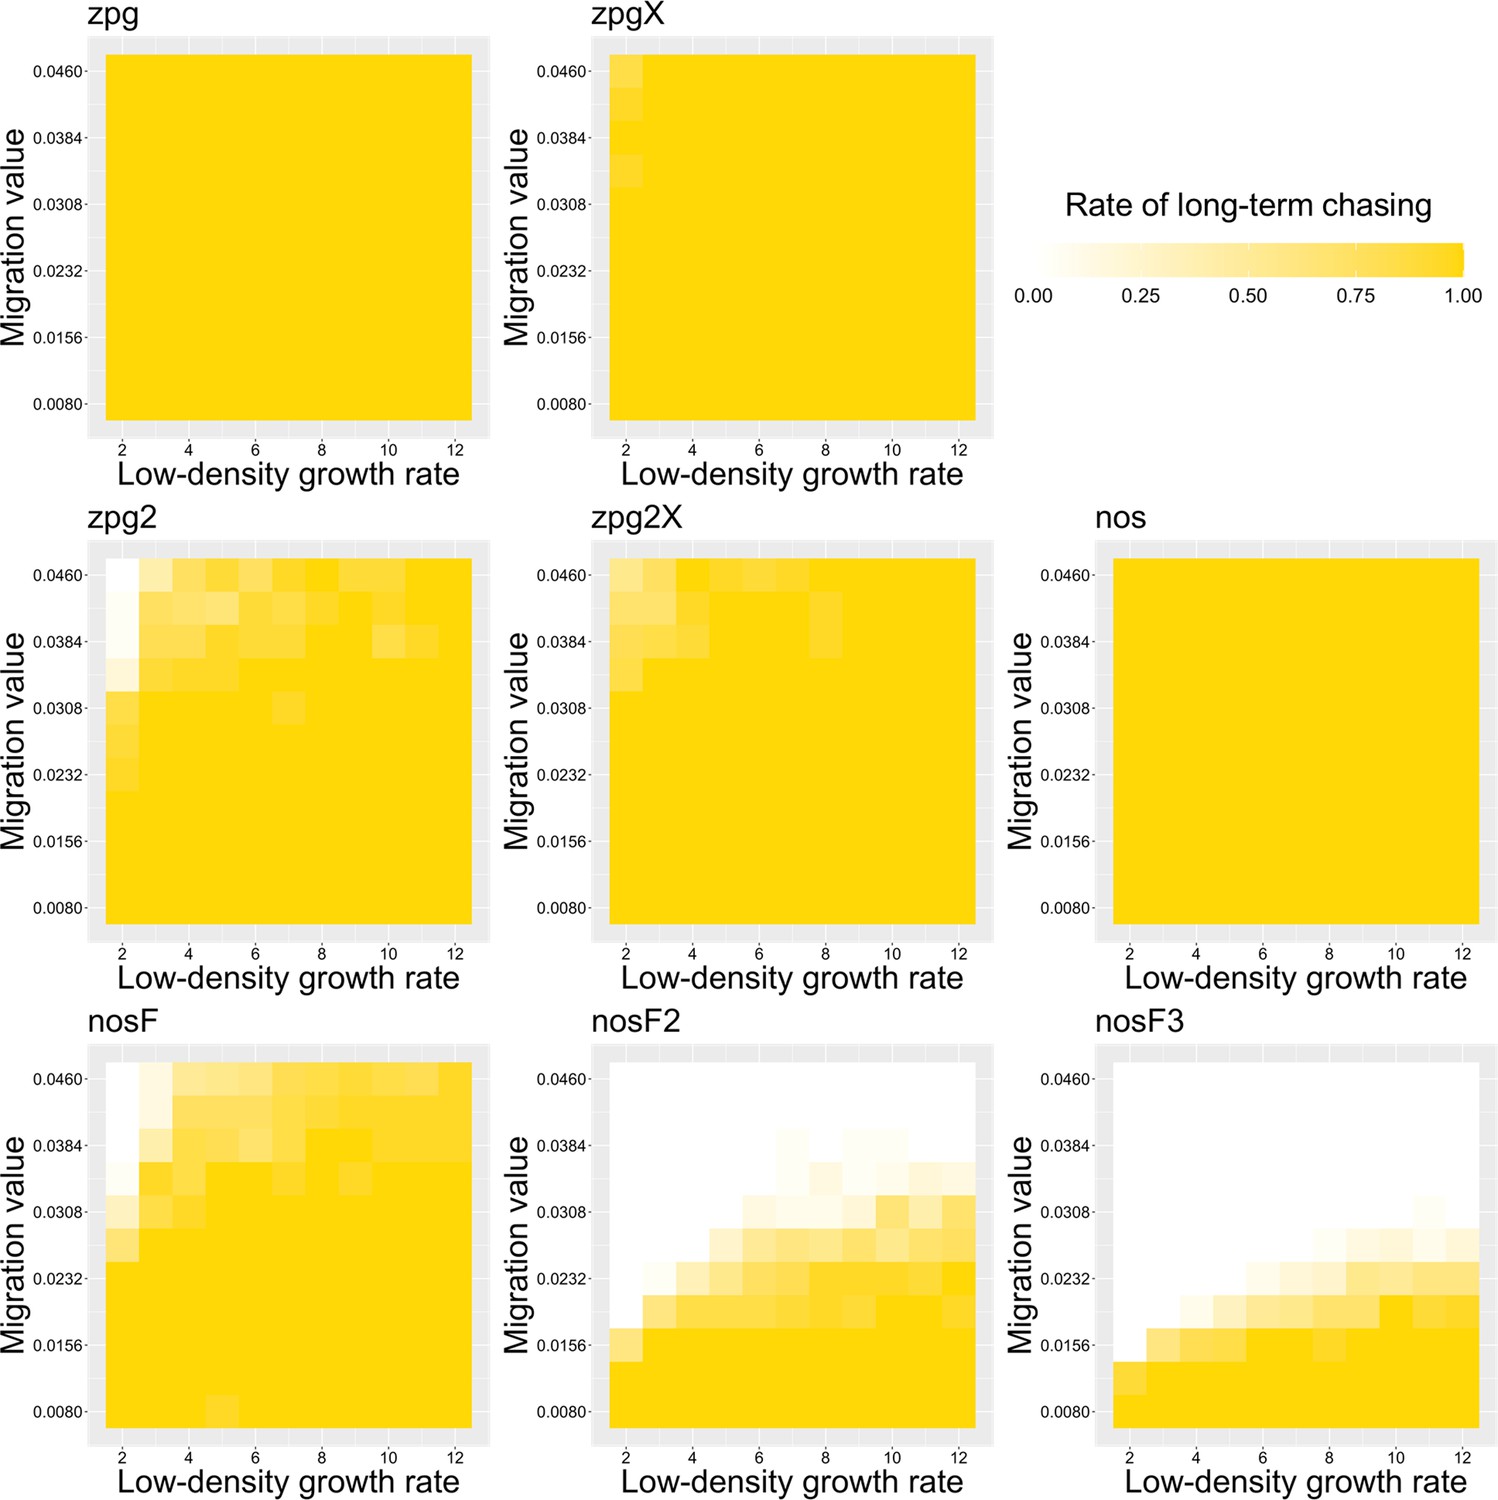
Appendix 1—figure 5
The rate of long-term chasing in the discrete-generation model.
Drive-carrying individuals were released into the middle of a wild-type population. The proportion of simulations in which a long-term chasing outcome (defined by a chase continuing for 1000 generations after drive release) occurred is shown. Each point represents the average of 20 simulations.
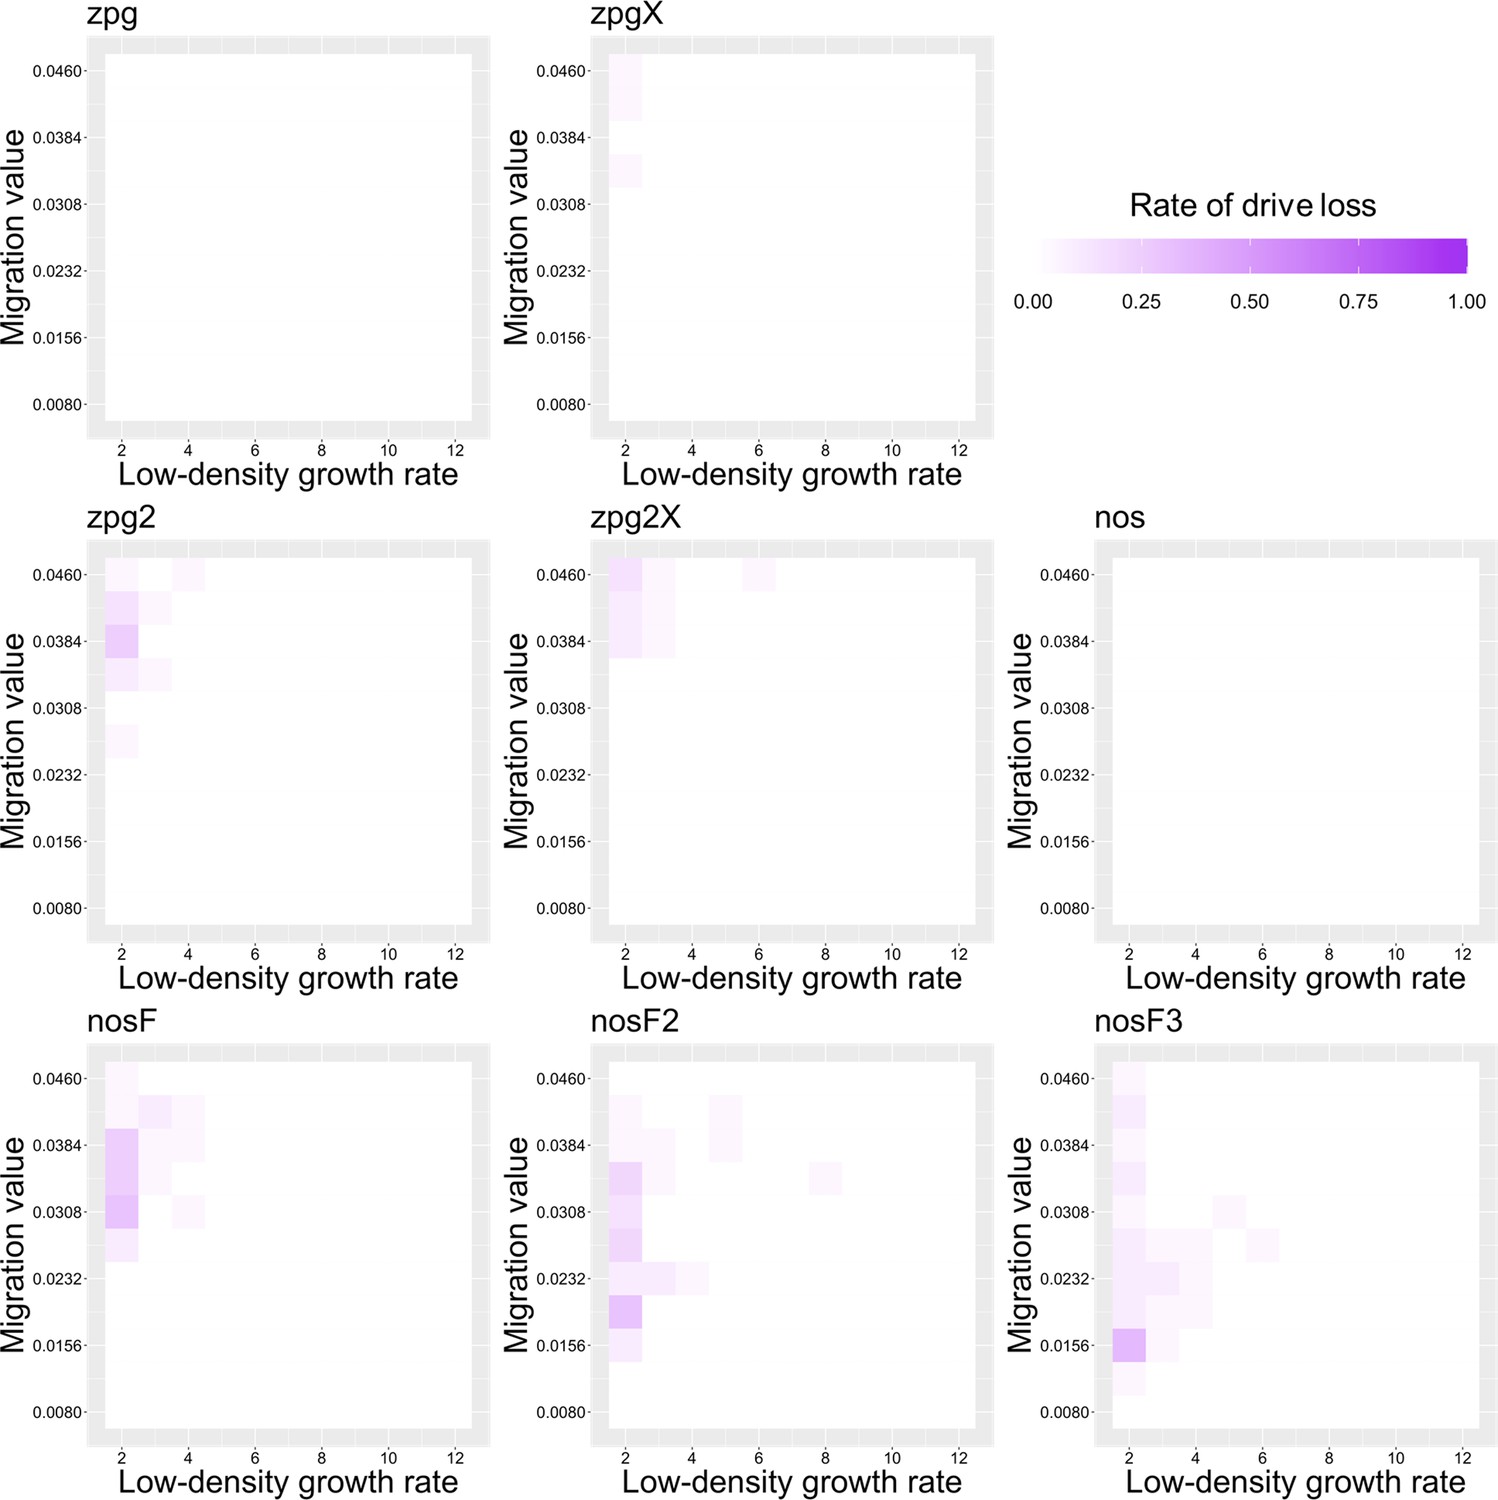
Appendix 1—figure 6
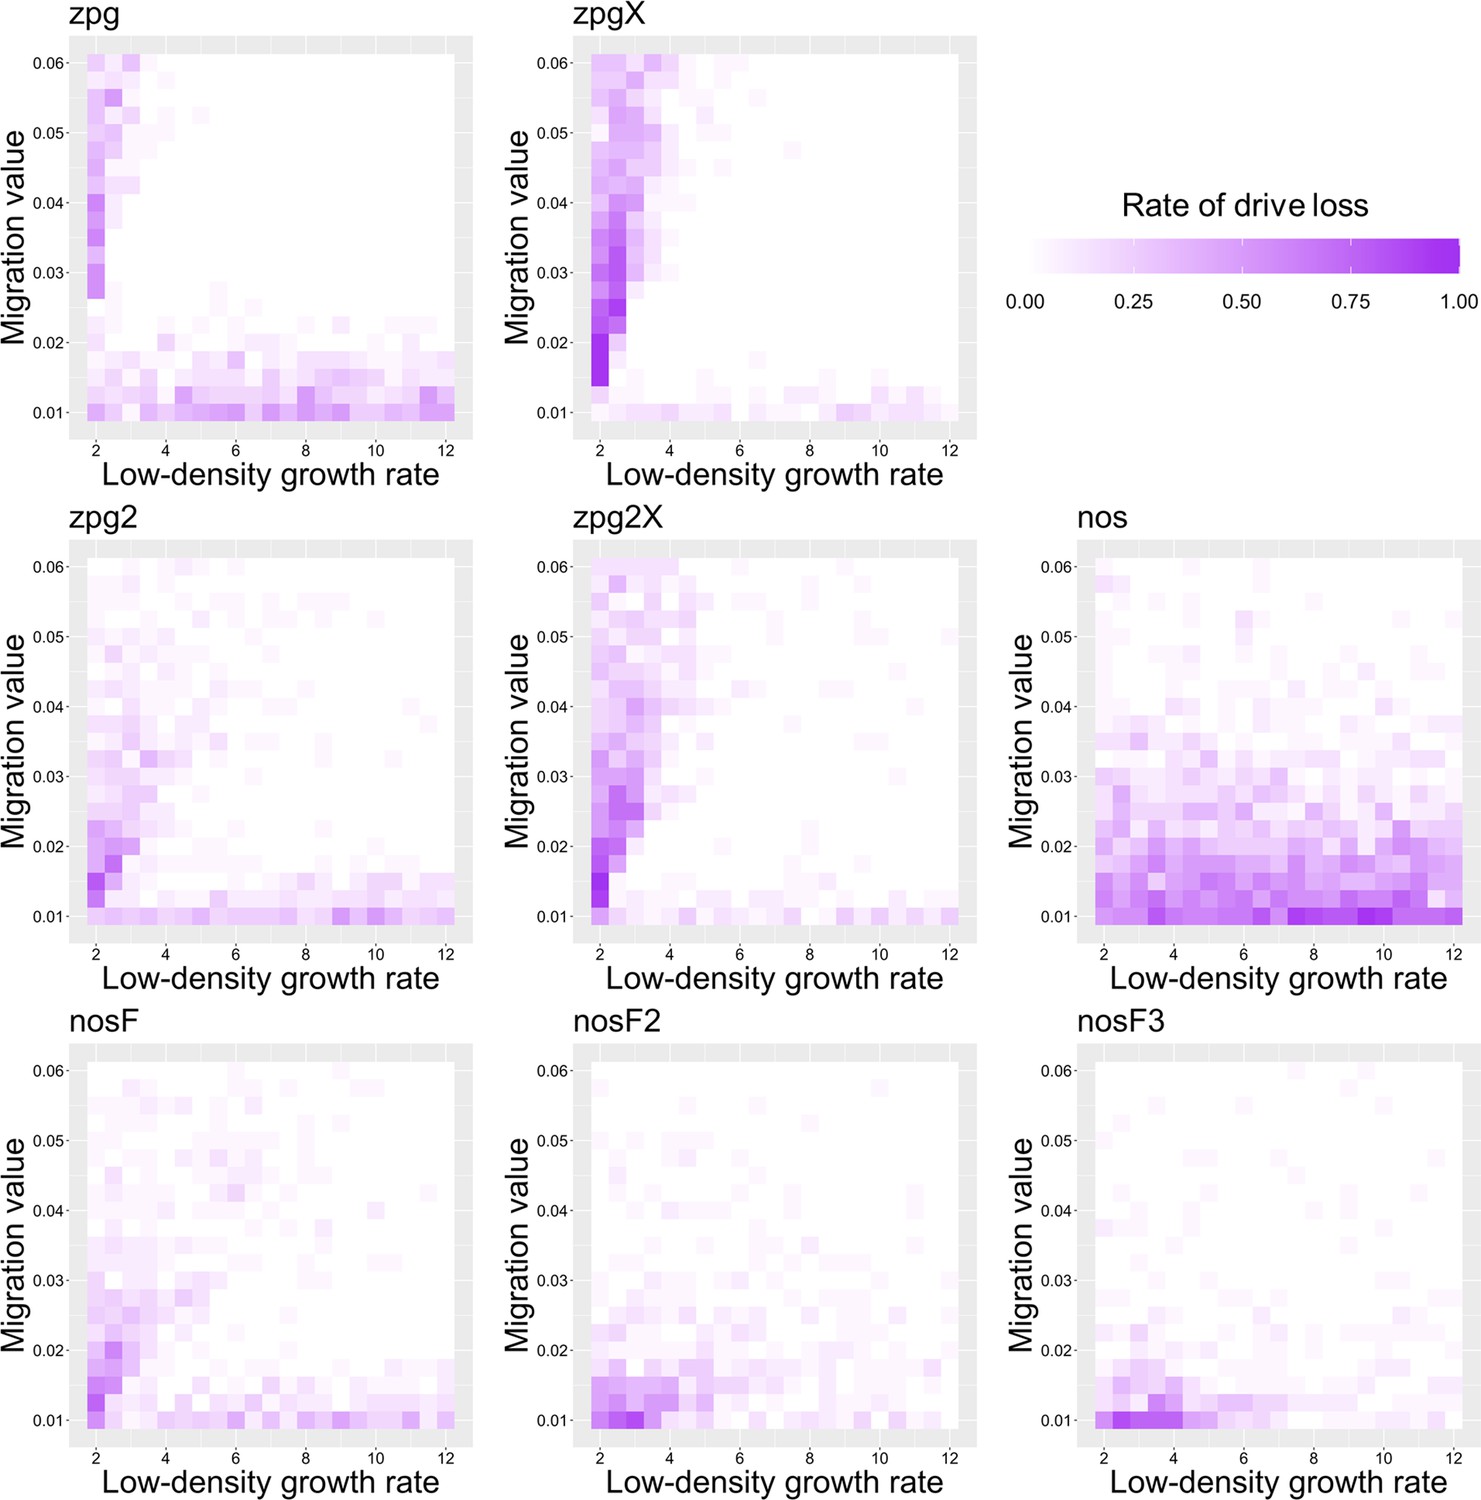
The rate of drive loss in the discrete-generation model.
Drive-carrying individuals were released into the middle of a wild-type population. The proportion of simulations in which the drive was lost from the population is shown. Each point represents the average of 20 simulations.
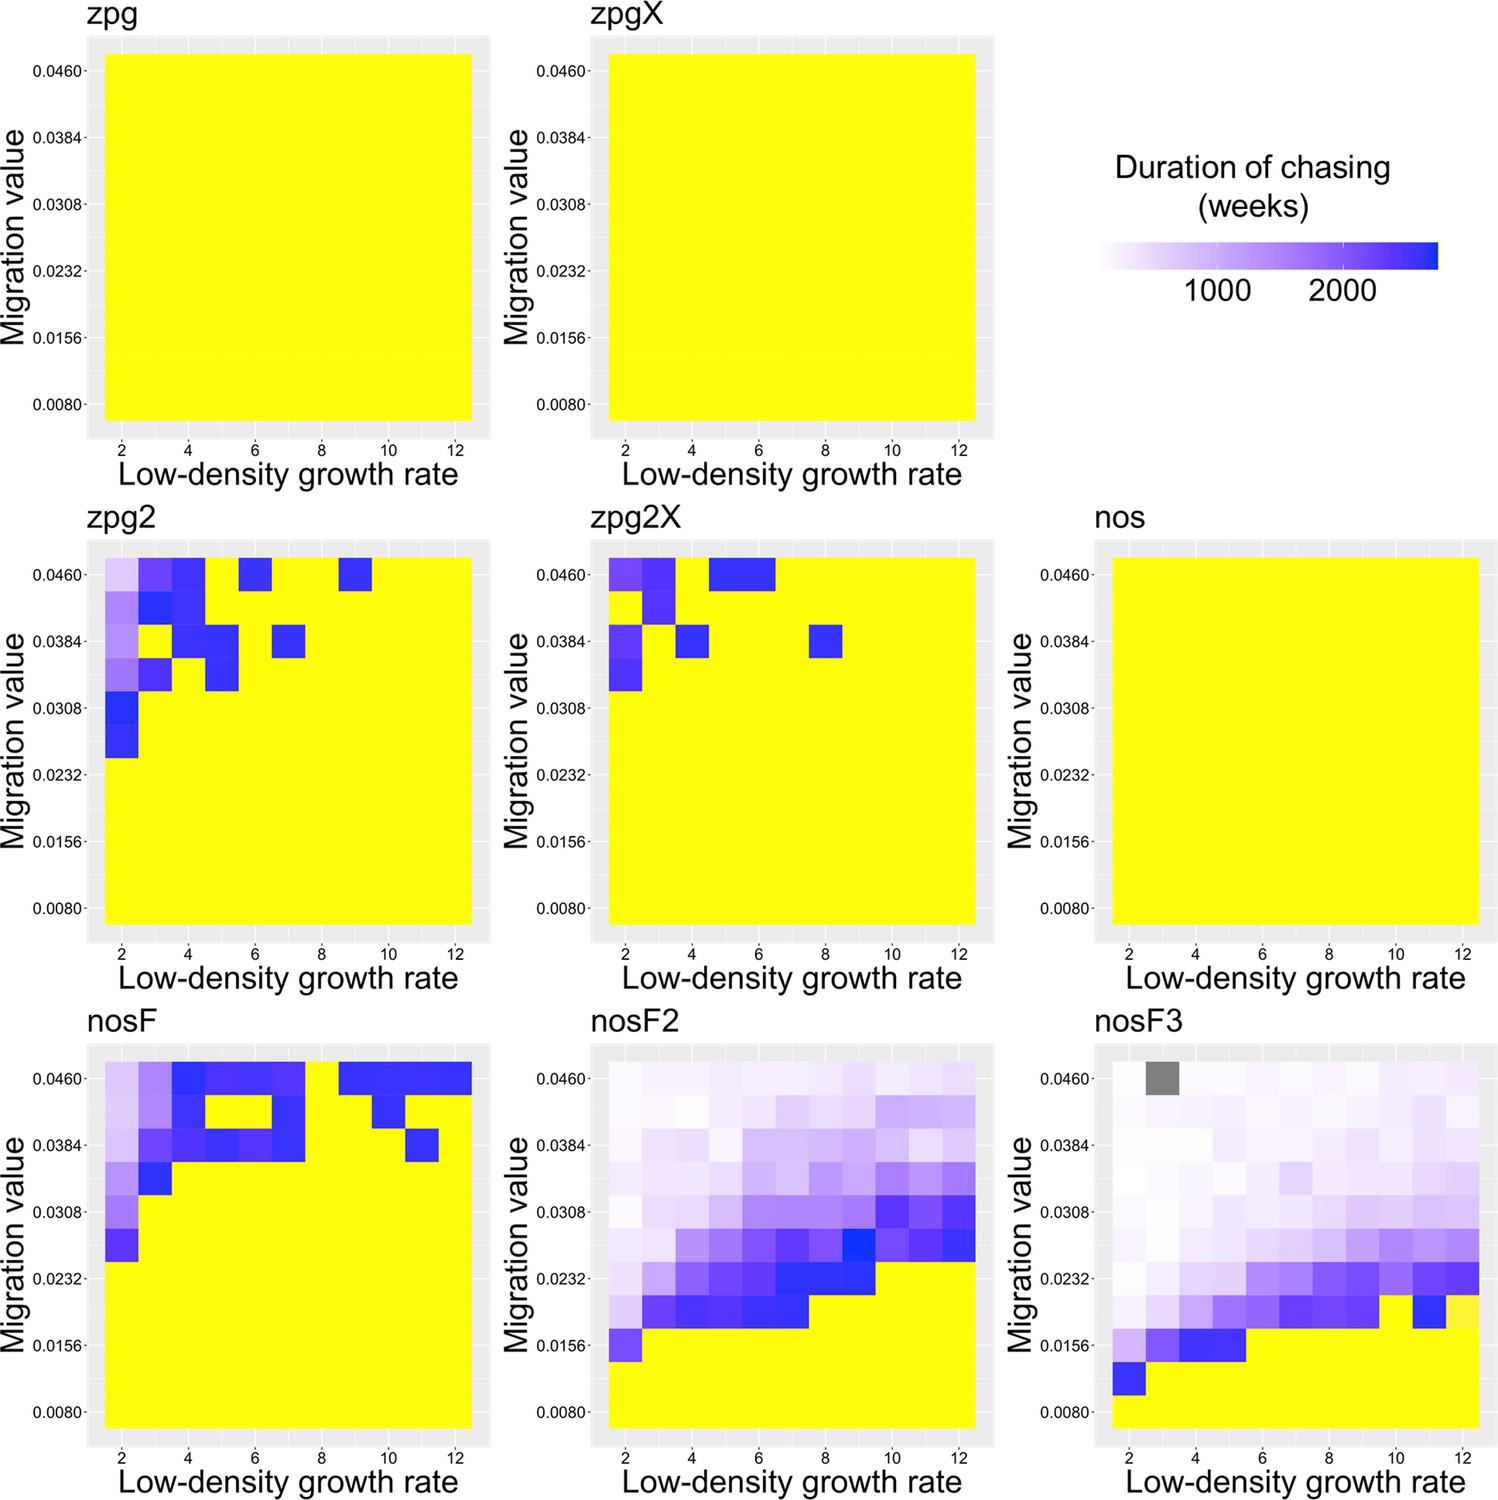
Appendix 1—figure 7
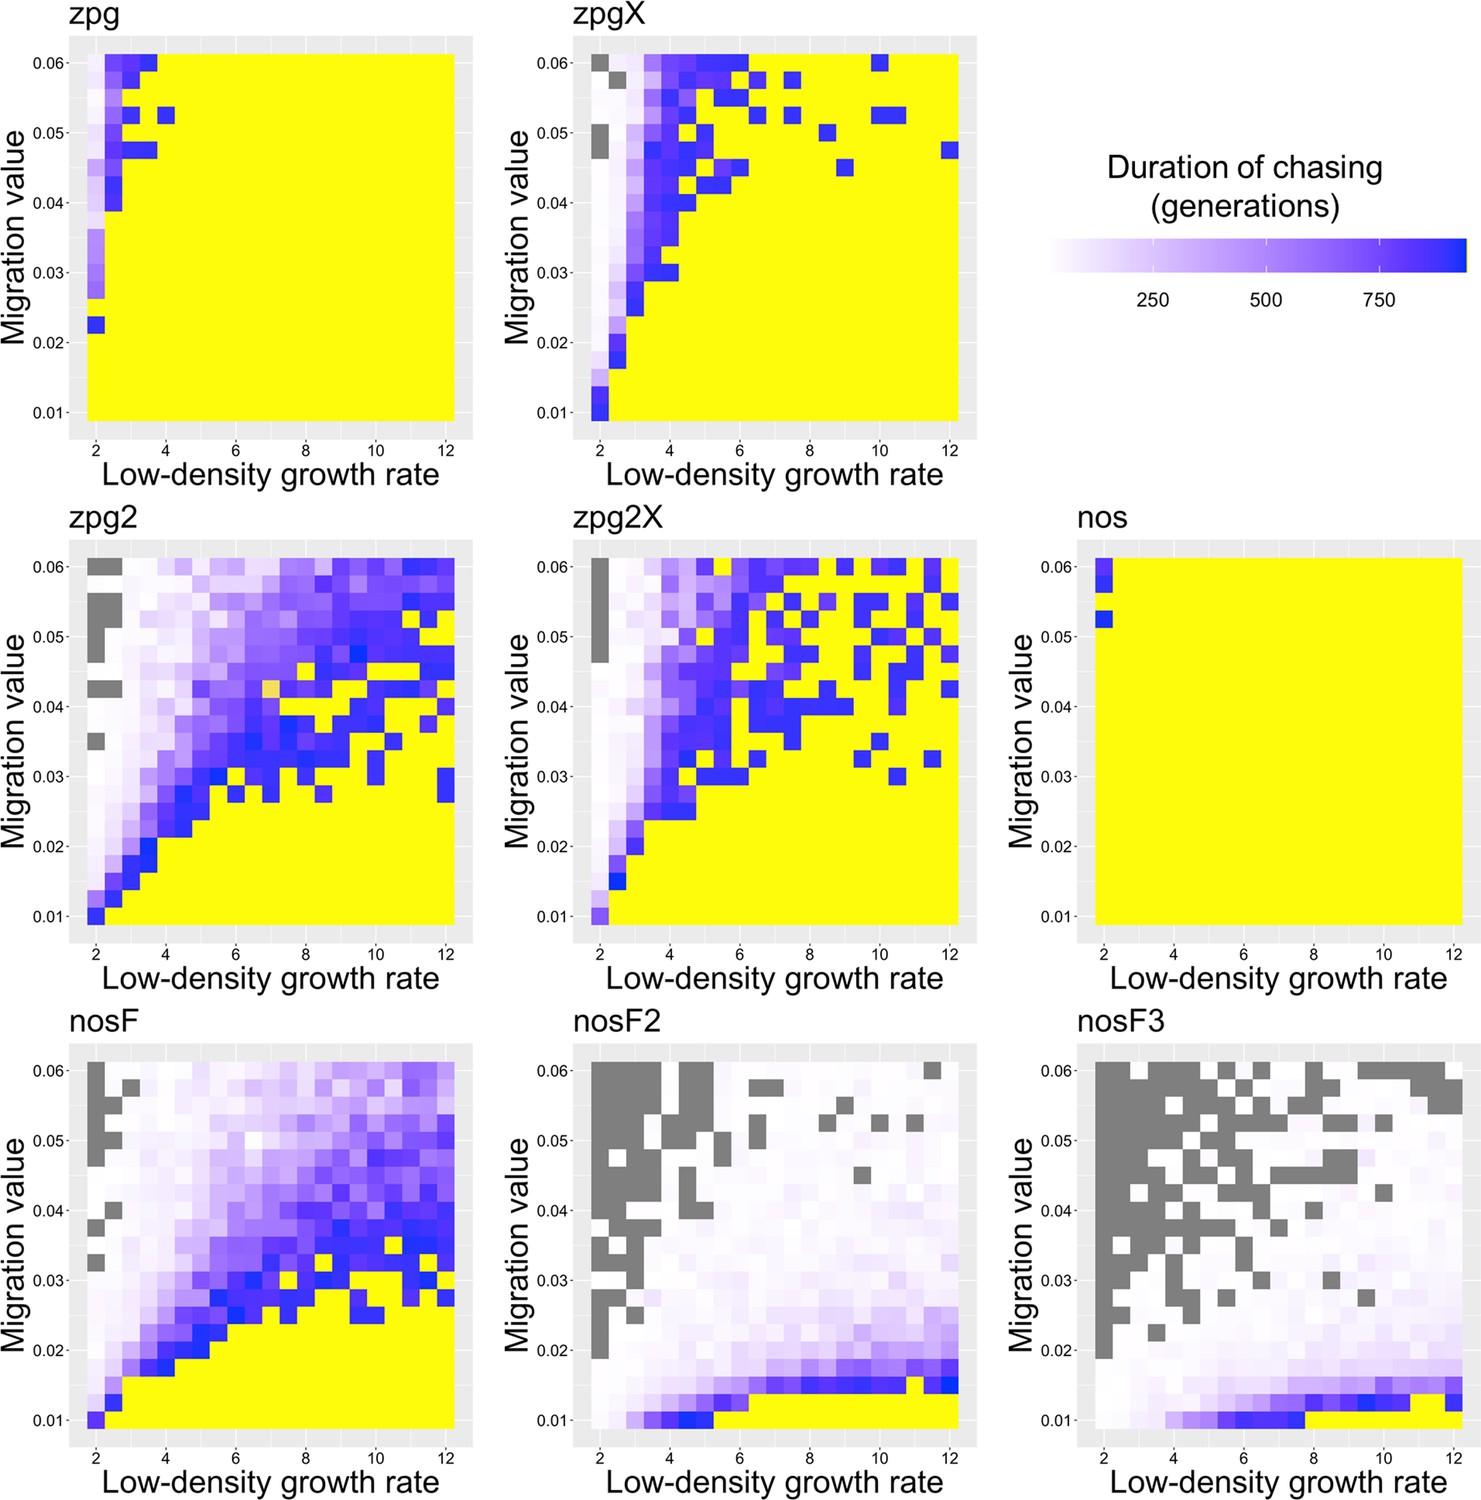
The duration of chasing prior to suppression in the discrete-generation model.
Drive-carrying individuals were released into the middle of a wild-type population. The number of generations between the start of chasing and population elimination is shown. Each point represents the average of 20 simulations. Grey represents parameter combinations in which chasing did not occur in any simulation, and yellow represents parameter combinations in which chasing occurred but did not end in suppression in any simulation.
Appendix 1—figure 8

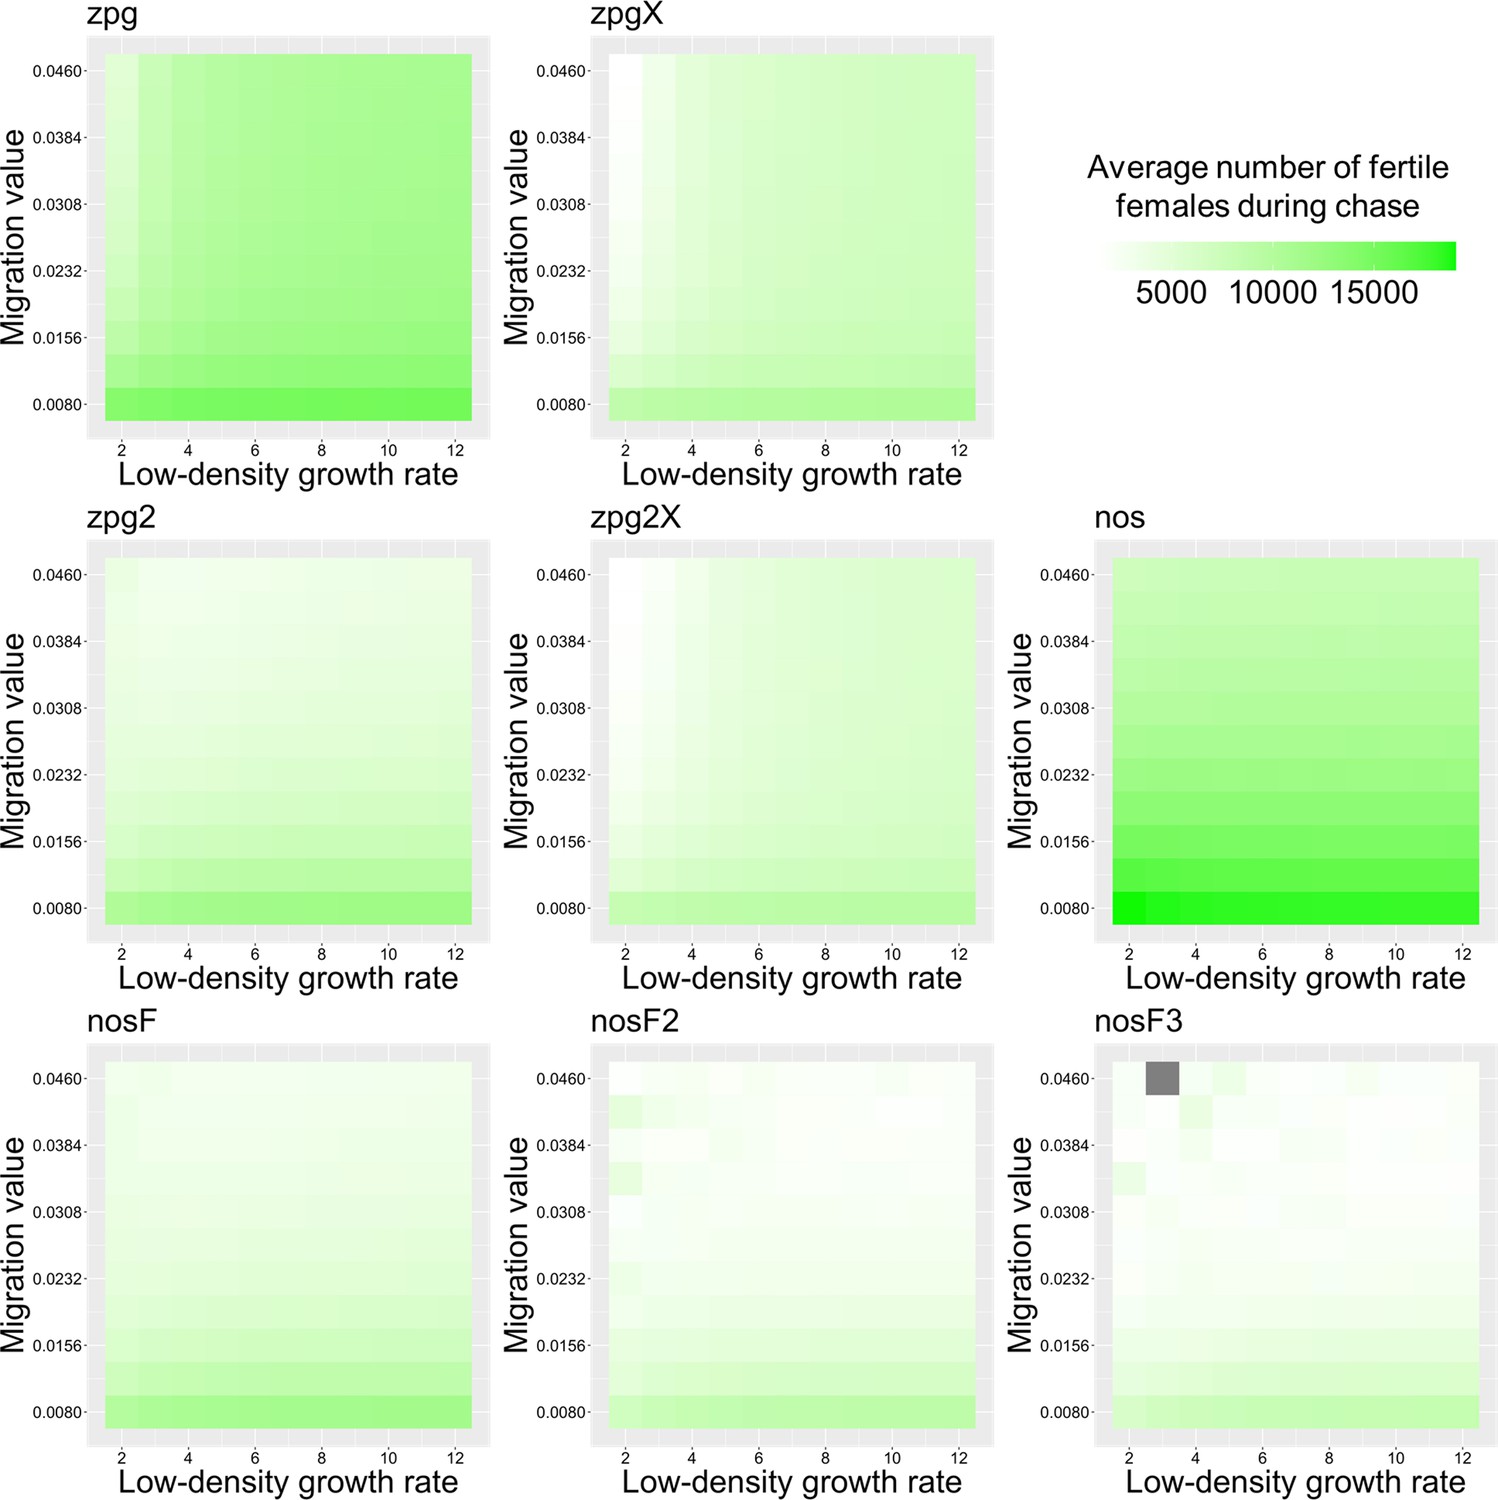
The average number of fertile females during chasing in the discrete-generation model.
Drive-carrying individuals were released into the middle of a wild-type population consisting of an average of 25,000 females when at equilibrium. The average number of fertile females during periods of chasing is shown. Each point represents the average of 20 simulations. Grey represents parameter combinations in which chasing did not occur in any simulation.
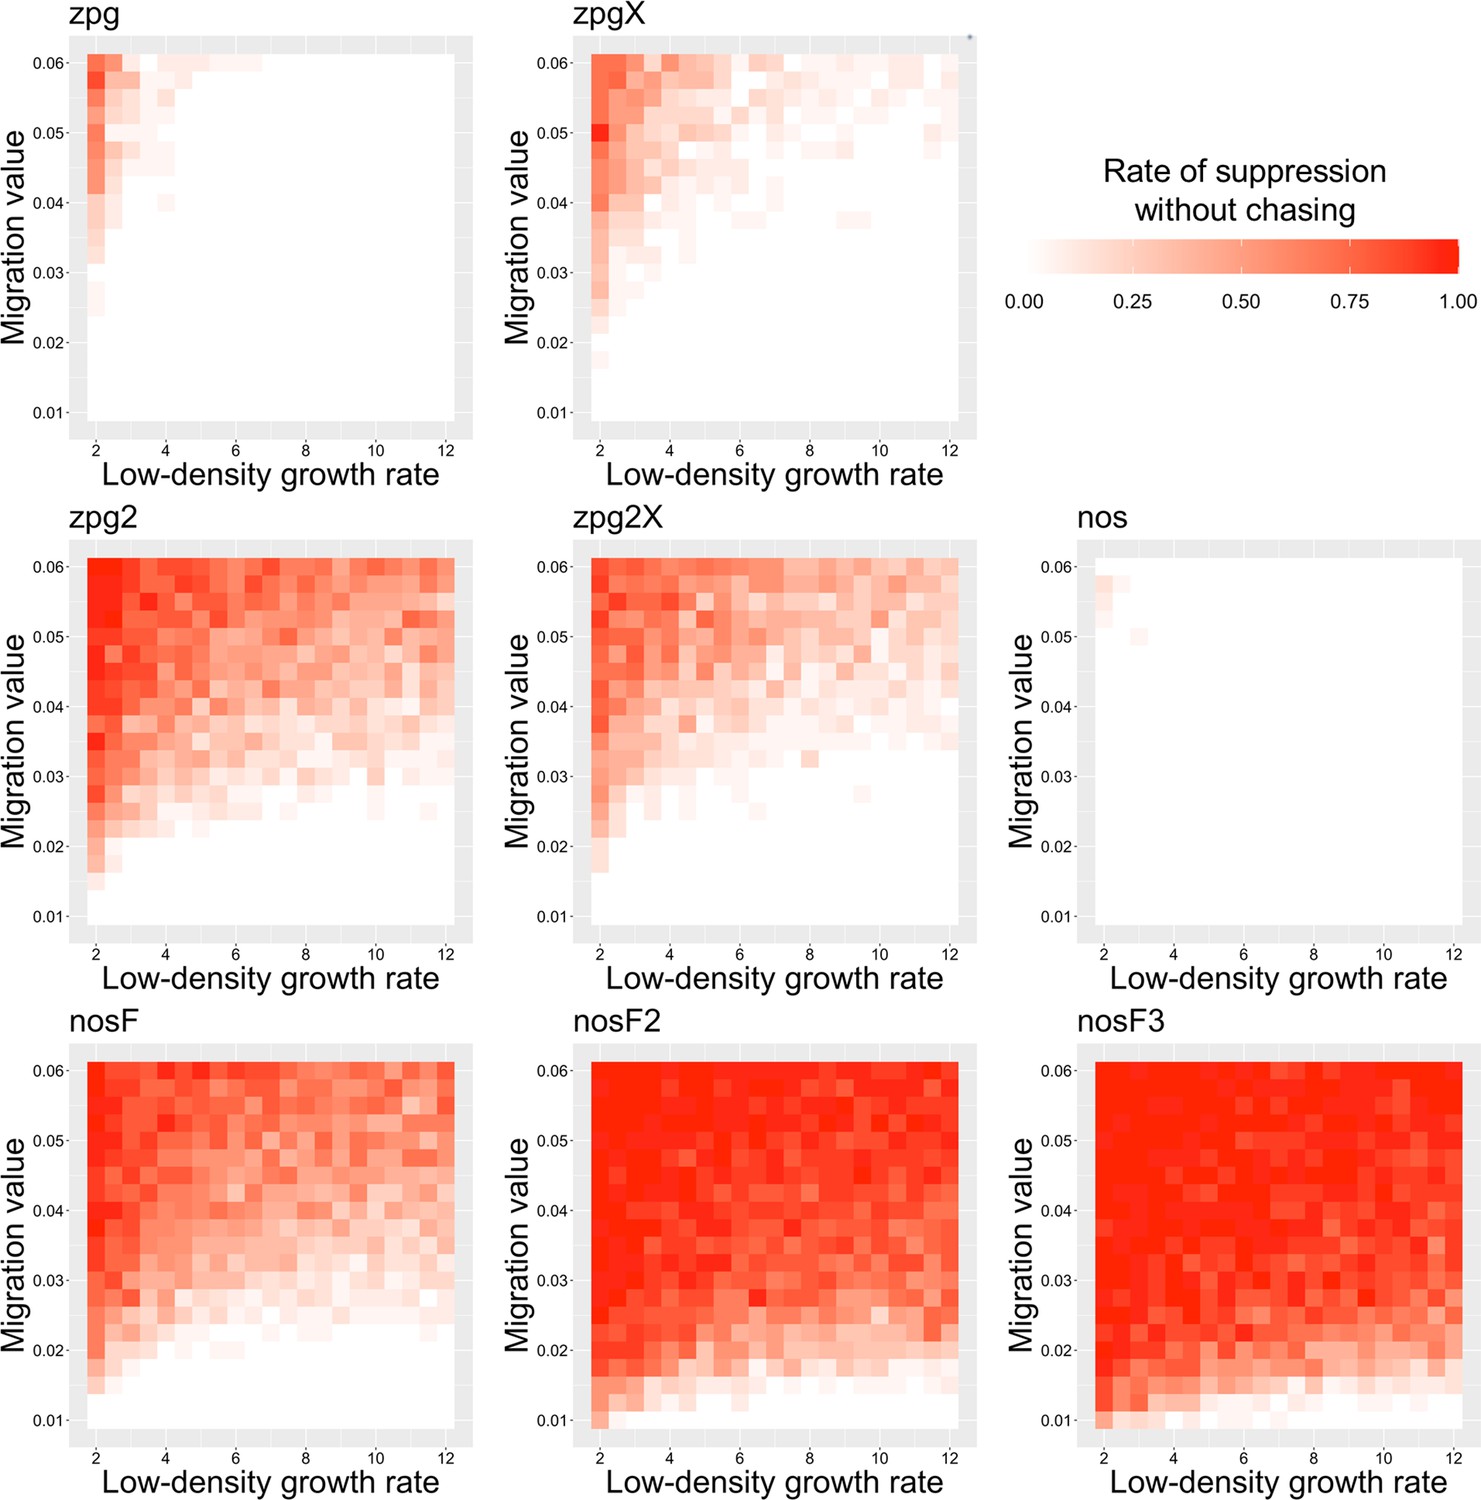
Appendix 1—figure 9

The rate of suppression without chasing in the Anopheles model.
Drive-carrying mosquitoes were released into the middle of a wild-type population. The proportion of simulations in which suppression occurred either before a chase or within 32 weeks of the start of chasing is shown. Each point represents the average of 20 simulations.
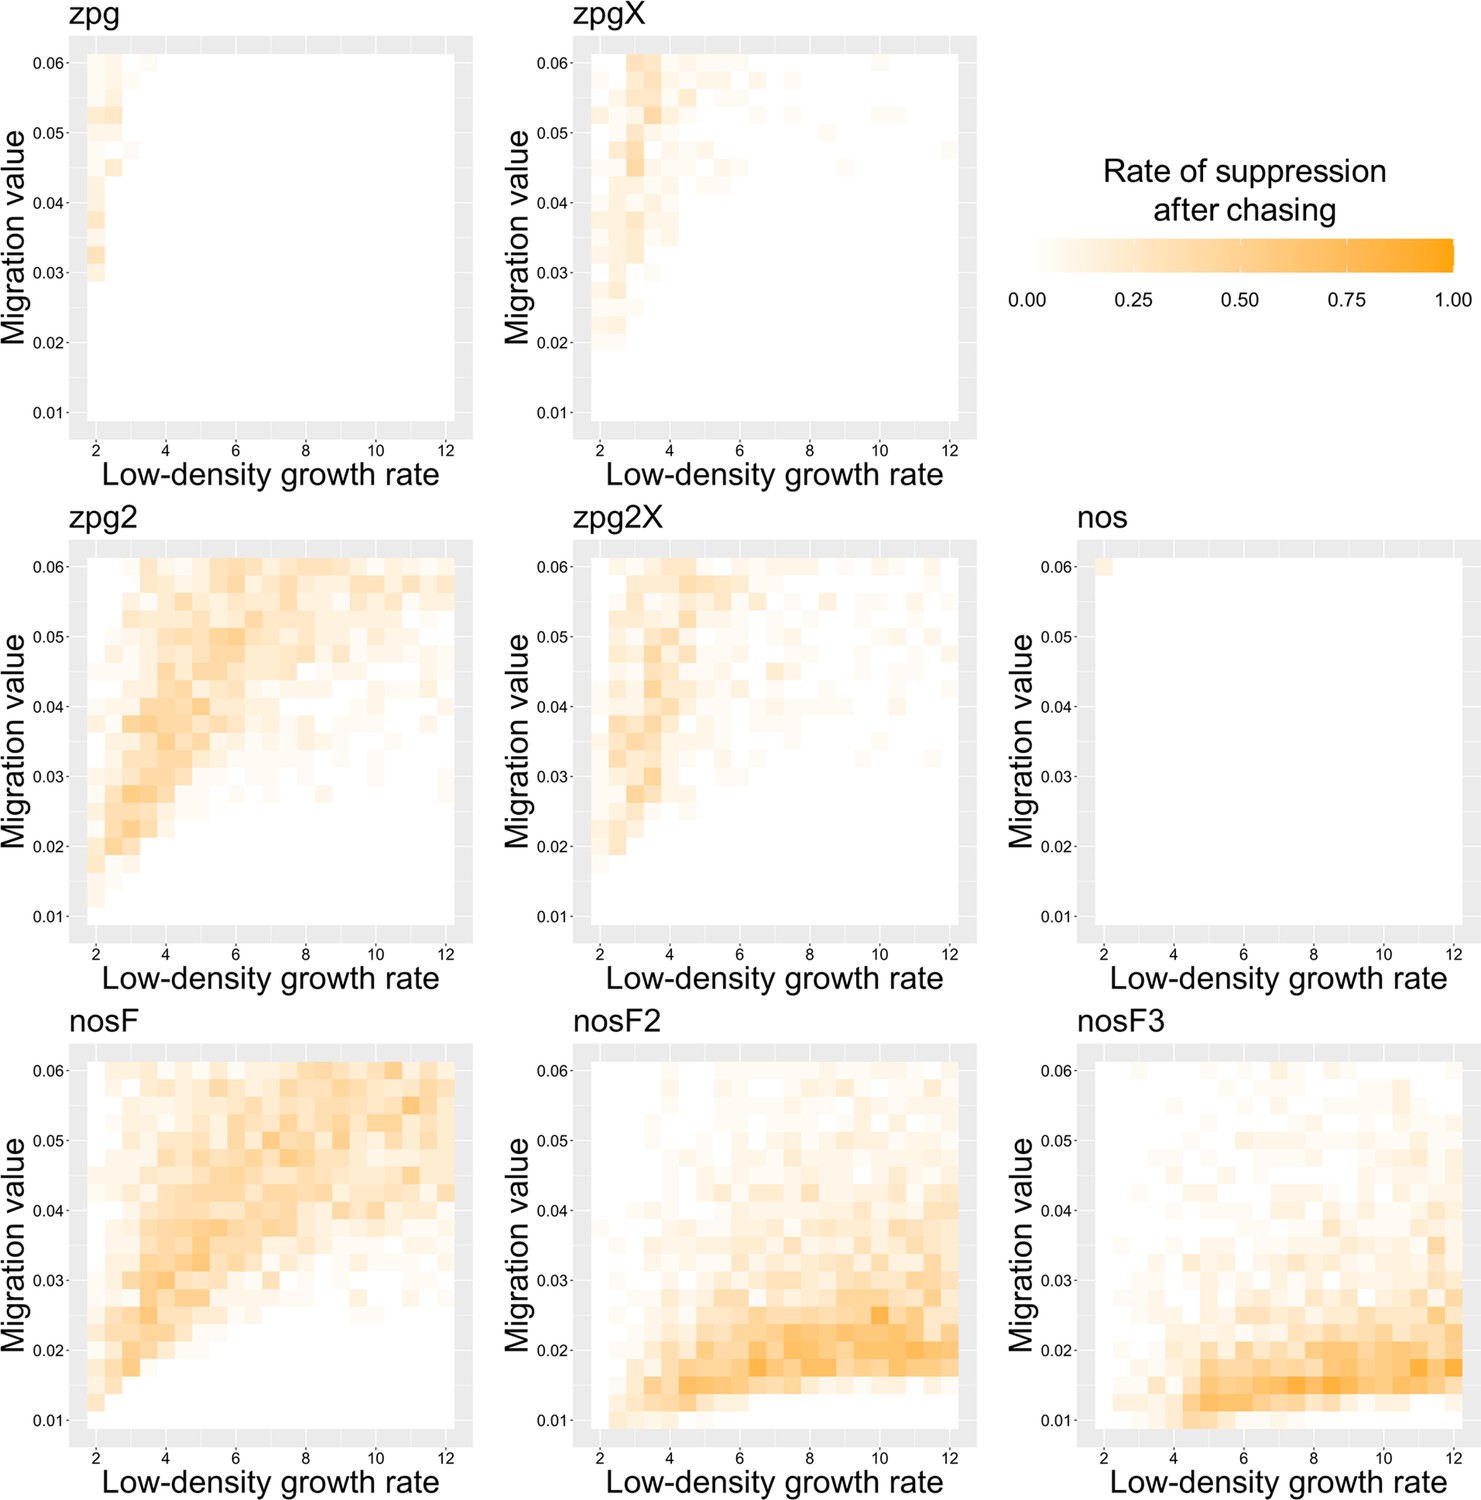
Appendix 1—figure 10
The rate of suppression after chasing in the Anopheles model.
Drive-carrying mosquitoes were released into the middle of a wild-type population. The proportion of simulations in which suppression occurred after a chase that lasted a minimum of 32 weeks is shown. Each point represents the average of 20 simulations.
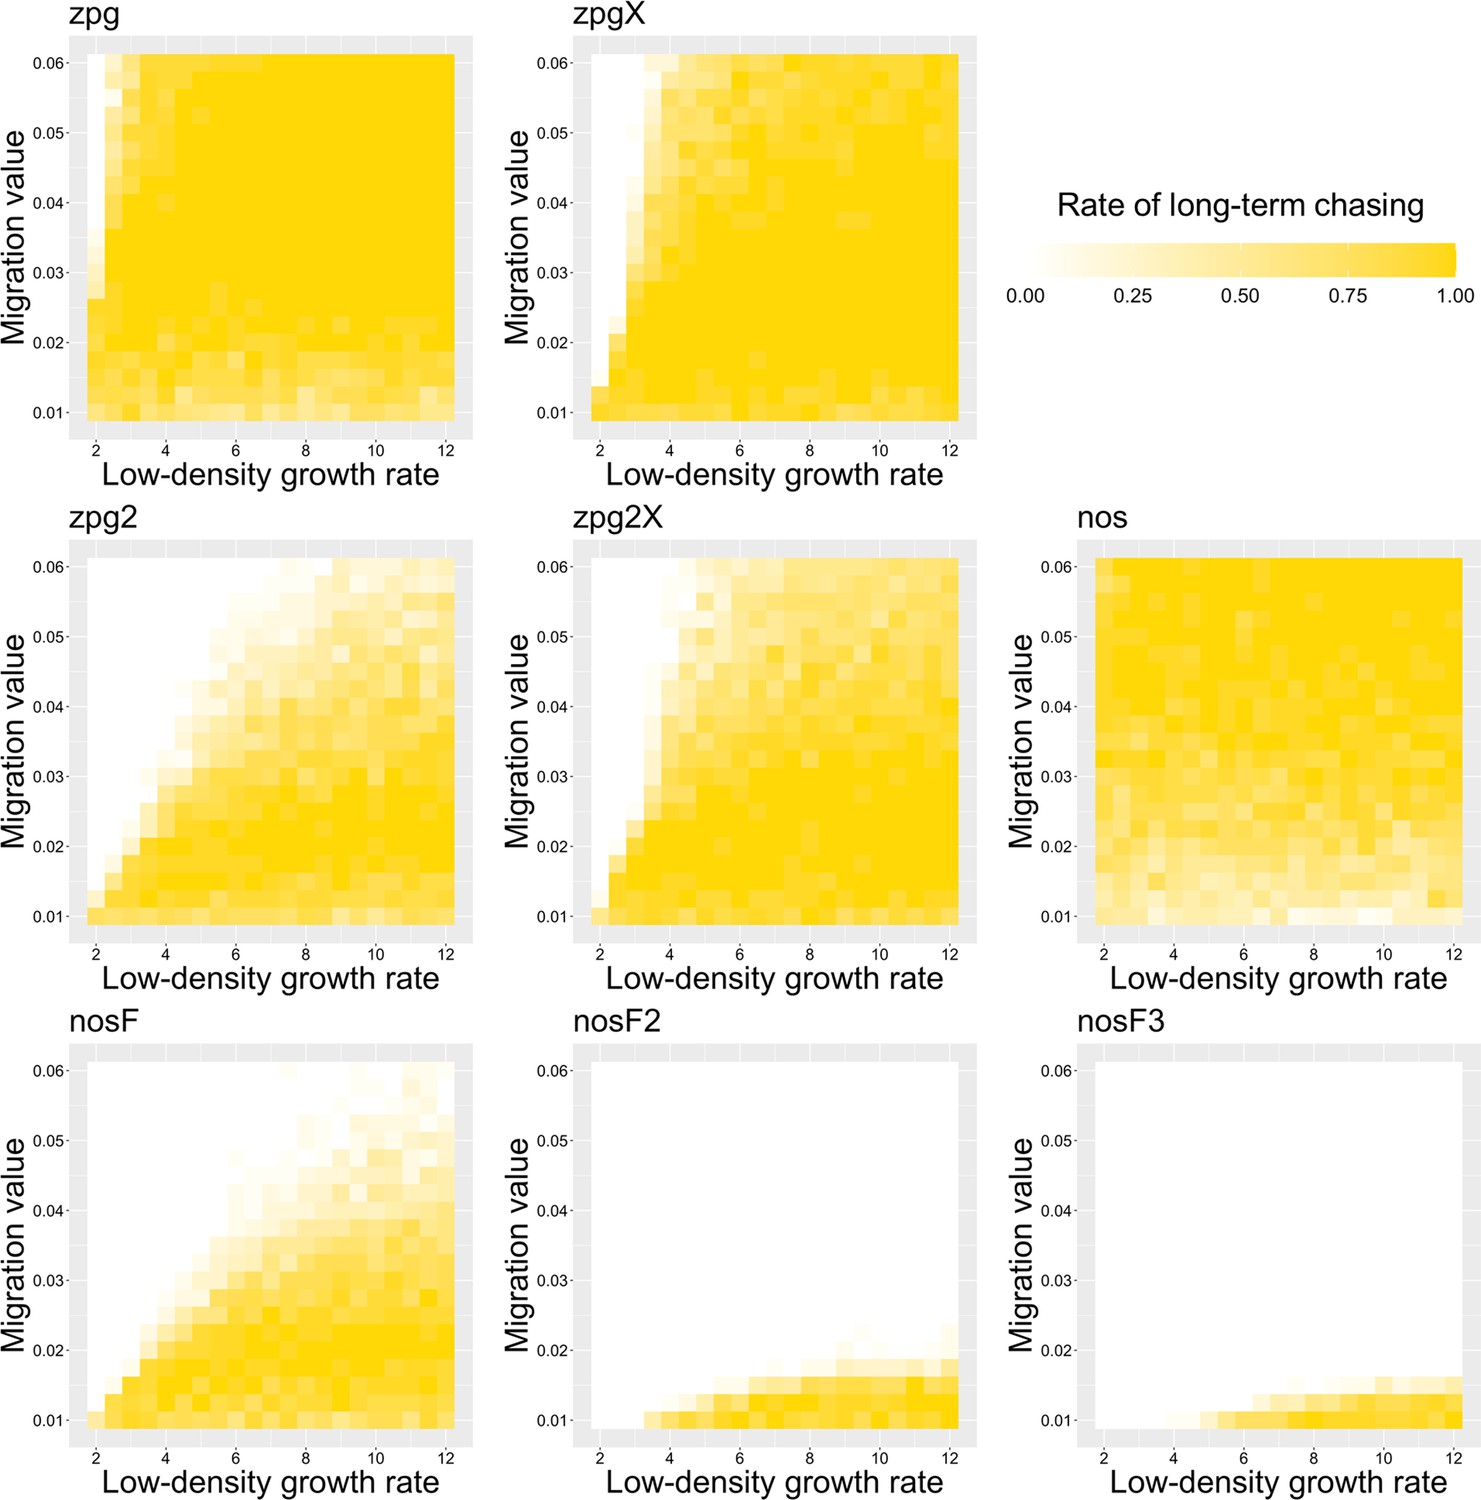
Appendix 1—figure 11
The rate of long-term chasing in the Anopheles model.
Drive-carrying mosquitoes were released into the middle of a wild-type population. The proportion of simulations in which a long-term chasing outcome (defined by a chase continuing for 3167 weeks after drive release) occurred is shown. Each point represents the average of 20 simulations.
Appendix 1—figure 12
The rate of drive loss in the Anopheles model.
Drive-carrying mosquitoes were released into the middle of a wild-type population. The proportion of simulations in which the drive was lost from the population is shown. Each point represents the average of 20 simulations.
Appendix 1—figure 13
The duration of chasing prior to suppression in the Anopheles model.
Drive-carrying mosquitoes were released into the middle of a wild-type population. The number of generations between the start of chasing and population elimination is shown. Each point represents the average of 20 simulations. Grey represents parameter combinations in which chasing did not occur in any simulation, and yellow represents parameter combinations in which chasing occurred but did not end in suppression in any simulation.
Appendix 1—figure 14
The average number of fertile females during chasing in the Anopheles model.
Drive-carrying mosquitoes were released into the middle of a wild-type population consisting of an average of 25,000 females when at equilibrium. The average number of fertile females during periods of chasing is shown. Each point represents the average of 20 simulations. Grey represents parameter combinations in which chasing did not occur in any simulation.
Tables
Table 1
Drive characteristics.
| zpg promoter Shared characteristics: Female HDR cut rate = 0.99 Male HDR cut rate = 0.96 Female germline resistance rate = 0.01 Male germline resistance rate = 0.02 Maternal embryo resistance rate = 0.08 | nos promoter Shared characteristics: Female HDR cut rate = 0.99 Male HDR cut rate = 0.98 Female germline resistance rate = 0.01 Male germline resistance rate = 0.01 Maternal embryo resistance rate = 0.14 |
| zpg drive Paternal Cas9 deposition rate = 0.69 Female somatic fitness cost = 0.3 | nos drive Female somatic fitness cost = 0.45 Male somatic fitness cost = 0.45 |
| zpg2 drive Female somatic fitness cost = 0.5 | nosF drive Female somatic fitness cost = 0.45 |
| zpgX drive Paternal Cas9 deposition rate = 0.69 Female somatic fitness cost = 0.3 X-shredding rate = 0.93 | nosF2 drive Female somatic fitness cost = 0.15 |
| zpg2X drive Female somatic fitness cost = 0.5 X-shredding rate = 0.93 | nosF3 drive No somatic fitness costs. |
Appendix 1—table 1
Model Demographical/Ecological Parameters.
| All models Low density growth rate = 6 or 10 (or varies from 2 to 12) Release amount = 500 new adult male heterozygotes Competition distance = 0.01 Drive release radius = 0.1 |
| Discrete generation model Time step = one generation Capacity = 50,000 Maximum offspring = 50 Migration and mating distance = 0.04 (or varies from 0.01 to 0.06) |
| Anopheles model Time step = one week Adult female capacity = 25,000 Female remate chance = 0.05 Fraction of females that reproduce per week = 0.5 Average offspring in one batch = 50 Old larva relative competition contribution = 5 Migration and mating distance = 0.0307 (or varies from 0.008 to 0.046) Adult female mortality rates (listed by age) = [5/6, 4/5, 3/4, 2/3, 1/2, 0] Adult male mortality rates (listed by age) = [2/3, 1/2, 0] |
Additional files
Download links
A two-part list of links to download the article, or parts of the article, in various formats.
Downloads (link to download the article as PDF)
Open citations (links to open the citations from this article in various online reference manager services)
Cite this article (links to download the citations from this article in formats compatible with various reference manager tools)
Anopheles homing suppression drive candidates exhibit unexpected performance differences in simulations with spatial structure
eLife 11:e79121.
https://doi.org/10.7554/eLife.79121


