Phosphoproteomic mapping reveals distinct signaling actions and activation of muscle protein synthesis by Isthmin-1
- Department of Pathology, Stanford University School of Medicine, United States
- Stanford Diabetes Research Center, Stanford University School of Medicine, United States
- Stanford Cardiovascular Institute, Stanford University School of Medicine, United States
- Duke Molecular Physiology Institute, Duke University School of Medicine, United States
- Department of Medicine, Duke University School of Medicine, United States
- Duke Center for the Study of Aging and Human Development, Duke University School of Medicine, United States
- Department of Laboratory Medicine, University of California, San Francisco, United States
- Diabetes Center, University of California, San Francisco, United States
- Division of Cardiovascular Medicine, Department of Medicine, Stanford University School of Medicine, United States
Figures
Figure 1 with 1 supplement
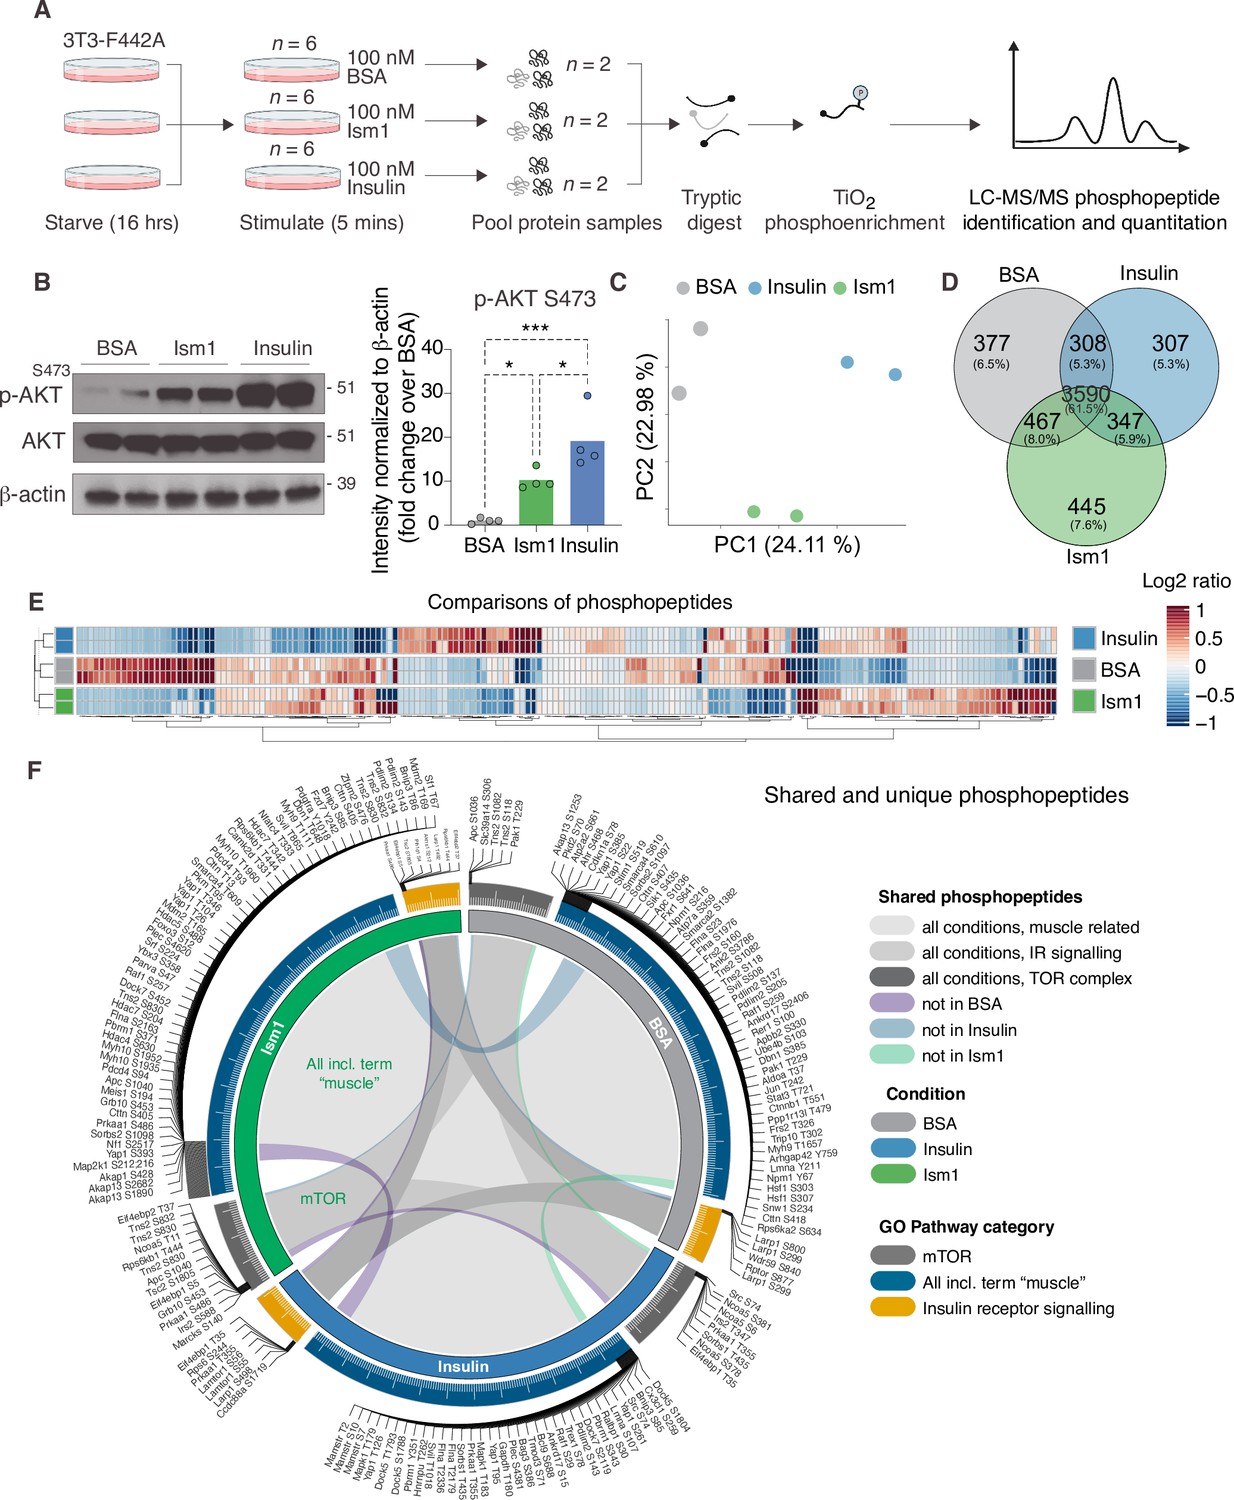
Phosphoproteomics reveals overlapping and distinct pathways of Ism1 and insulin.
(A) Experimental design of the untargeted phosphoproteomics analysis. 3T3-F442A cells were serum-starved for 16 hr and treated with 100 nM recombinant Ism1 or insulin for 5 min (n = 6 biological replicates per group were pooled and then divided into n = 2 technical replicates). Proteins were extracted, trypsin digested, and fractionated. Phosphopeptides were enriched using TiO2 chromatography, and phosphopeptides were analyzed with LC-MS/MS. (B) Western blot analysis of p-AKTS473, total AKT, and β-actin in cells treated with 100 nM bovine serum albumin (BSA), 100 nM Ism1, or 100 nM insulin for 5 min (Western blot n = 2 pooled from n = 6 per treatment group; quantification n = 4 combining three independent assays). p-Values are calculated by one-way ANOVA, *p<0.05, **p<0.01, ***Pp0.001. (C) Protein intensity-based principal component analysis (PCA) of the phosphoproteomic dataset. (D) Venn diagram of the phosphopeptides detected in both replicates after BSA-, Ism1-, or insulin treatment. (E) Heatmap of differentially phosphorylated peptides with 100 lowest significant p-values (adj. p<0.05) from three comparisons displayed as log2 ratio (BSA vs. Ism1, BSA vs. insulin, and insulin vs. Ism1). (F) Distribution diagram of shared and unique phosphosites (detected in at least one sample) between treatments for selected Gene Ontology (GO) pathways. Inner links in shades show phosphosites detected in two or more treatment conditions. Gray shows phosphosites detected in all samples; purple shows phosphosites detected in both Ism1 and insulin-treated cells; green shows phosphosites detected in both BSA and insulin-treated cells; blue shows phosphosites detected in both BSA- and Ism1-treated cells. The middle ring displays GO pathway/pathway group with ticks indicating the number of phosphopeptides. Large ticks indicate 50 phosphopeptides, and small ticks indicate 5 phosphopeptides. The outer ring displays gene symbols and the phosphosite exclusively detected in each treatment. See also Figure 1—figure supplement 1 and Figure 1—source data 1, Figure 1—source data 2, and Figure 1—source data 3.
-
Figure 1—source data 1
List of phosphosites significantly different between treatments for Figure 1E.
- https://cdn.elifesciences.org/articles/80014/elife-80014-fig1-data1-v2.xlsx
-
Figure 1—source data 2
List of shared and unique phosphosites between treatments for selected Gene Ontology (GO) pathways for Figure 1F.
- https://cdn.elifesciences.org/articles/80014/elife-80014-fig1-data2-v2.xlsx
-
Figure 1—source data 3
Uncropped Western blot images with relevant bands labeled.
- https://cdn.elifesciences.org/articles/80014/elife-80014-fig1-data3-v2.pdf
Figure 1—figure supplement 1
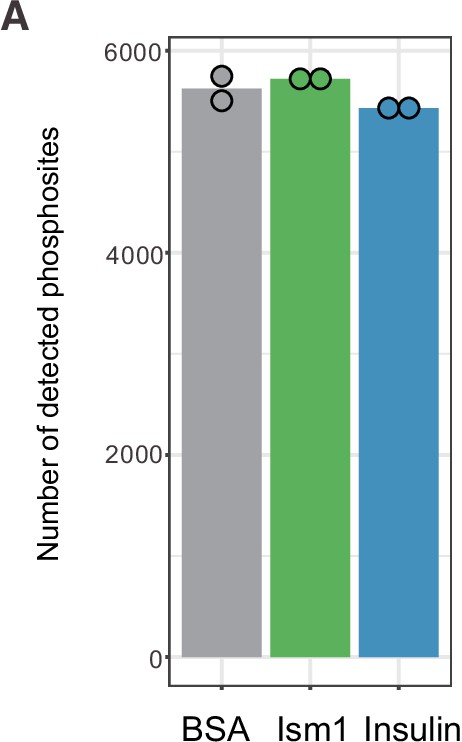
Quality controls for the phosphoproteomics analysis.
Figure 2 with 1 supplement
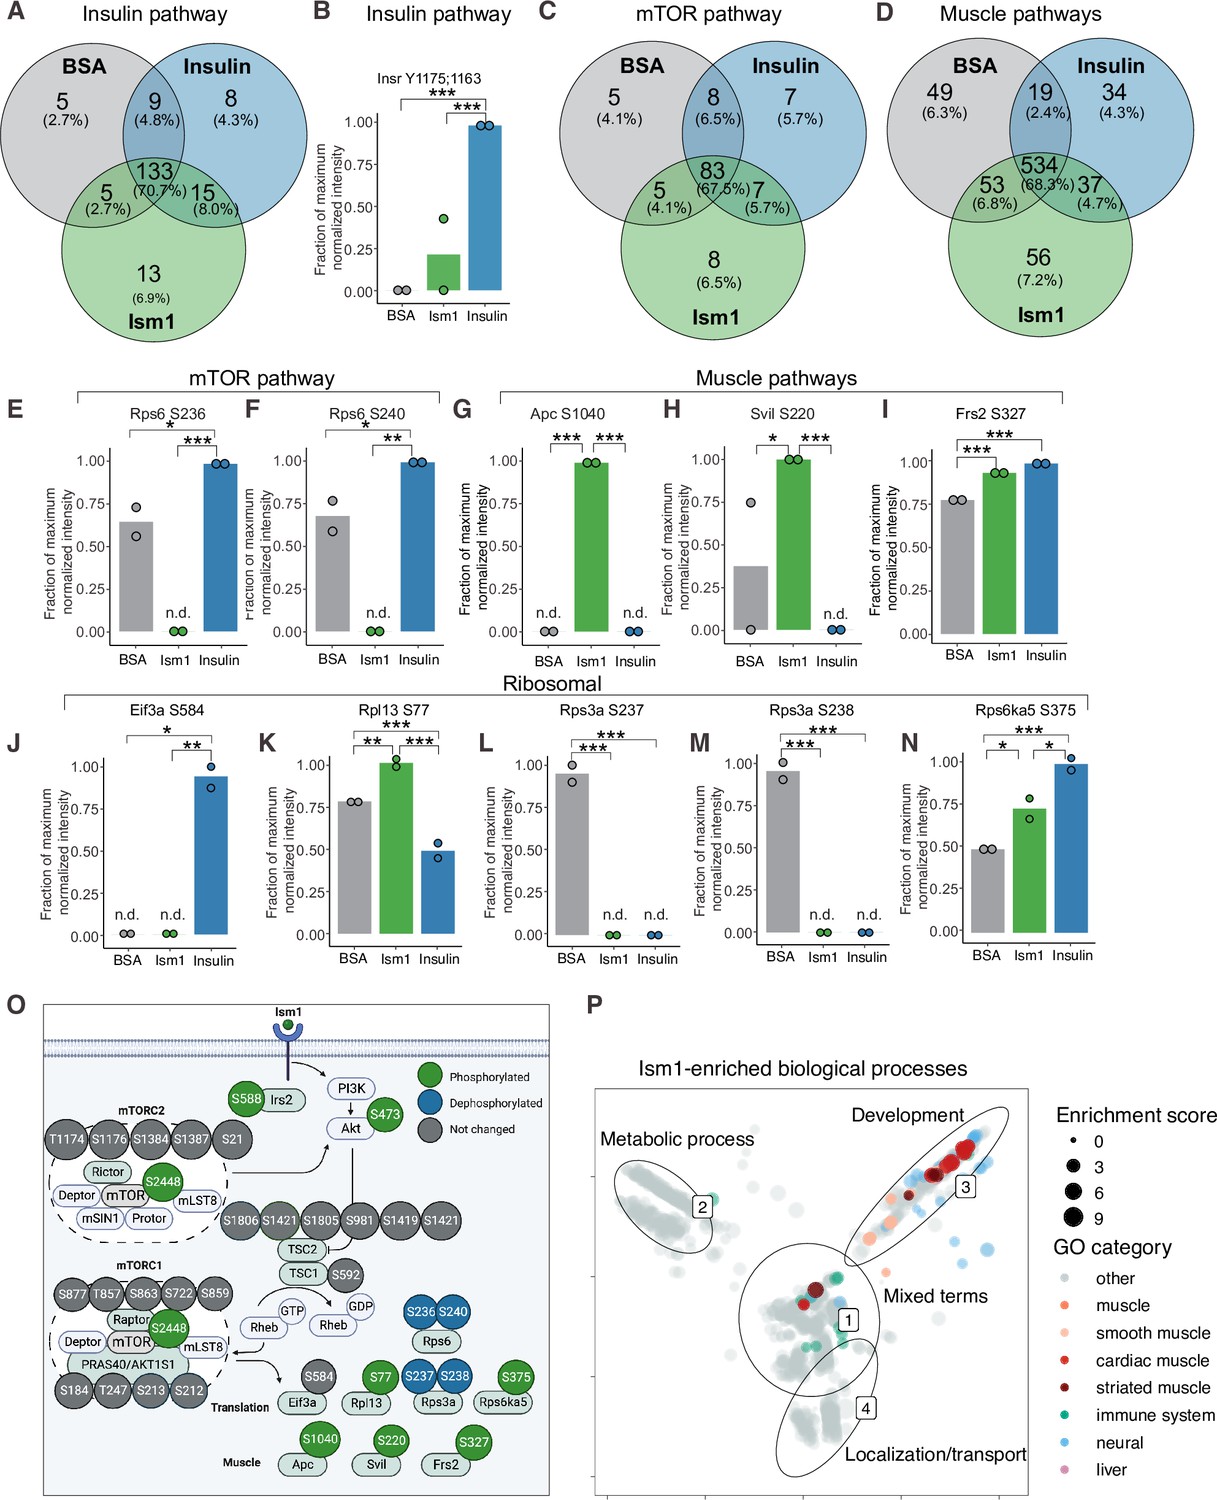
Phospho-specific mapping identifies an Ism1-induced signature consistent with protein translation and muscle function.
(A) Venn diagram of shared and unique phosphosites between treatments for the Gene Ontology (GO) pathways Insulin. (B) Abundance of InsR Y1175/1163 in cells treated with bovine serum albumin (BSA), Ism1, or insulin (n = 2). Individual comparisons between conditions across phosphopeptides were performed using empirical Bayes statistics followed by adjustment for multiple testing using false discovery rate, *p<0.05, **p<0.01, ***p<0.001. The minimum normalized intensity across the dataset was subtracted from each normalized data point, and phosphorylation was calculated as a fraction of the maximum value of all samples for each phosphopeptide. Bars show mean ± SEM. (C) Venn diagram of shared and unique phosphosites between treatments for the GO pathways Insulin mTOR. (D) Venn diagram of shared and unique phosphosites between treatments for the GO pathways and muscle. (E–N) Abundance of proteins with indicated phosphosite in cells treated with BSA, Ism1, or insulin (n = 2). Individual comparisons between conditions across phosphopeptides were performed using empirical Bayes statistics followed by adjustment for multiple testing using false discovery rate, *p<0.05, **p<0.01, ***p<0.001. The minimum normalized intensity across the dataset was subtracted from each normalized data point, and phosphorylation was calculated as a fraction of the maximum value of all samples for each phosphopeptide. Note that, in case of non-detectable phosphopeptides, significance testing was based on imputed values, n.d., non-detectable. Bars show mean ± SEM. (O) Ism1 signaling network in 3T3-F442A cells. Ism1 ligand stimulation triggers activation of the PI3K/AKT pathway and the mTORC1 pathway, which leads to changes in phosphorylation status of multiple proteins involved in protein translation and muscle function. (P) Pathway analysis of enriched GO pathways in the Ism1 group versus BSA. Clusters are dominated by (1) mixed terms, (2) metabolic process, (3) development, and (4) localization/transport. Plotted GO terms all have p-values <0.01 calculated using the classic Kolmogorov–Smirnov test. See also Figure 2—figure supplement 1, Figure 2—source data 1, and Figure 2—source data 2.
-
Figure 2—source data 1
Enriched pathways for proteins with phosphosites significantly different between Ism1 and bovine serum albumin (BSA) clustered by semantic similarity.
- https://cdn.elifesciences.org/articles/80014/elife-80014-fig2-data1-v2.xlsx
-
Figure 2—source data 2
Raw data related to Figure 2B,E–N.
- https://cdn.elifesciences.org/articles/80014/elife-80014-fig2-data2-v2.xlsx
Figure 2—figure supplement 1
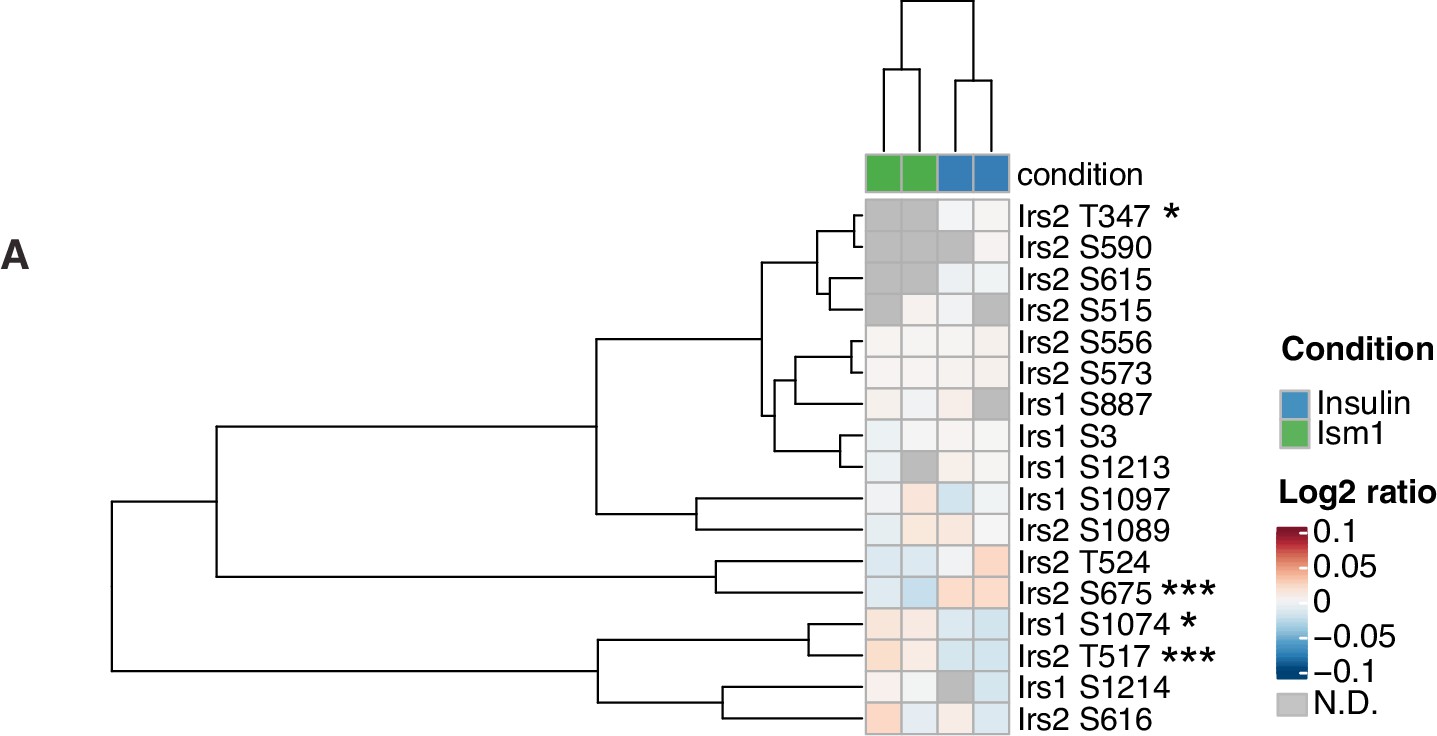
Insulin receptor substrate-1 and 2 (Irs1/2) phosphorylation status in response to Ism1 or insulin.
(A) Heatmap of differentially phosphorylated Irs1 and Irs2 phosphosites by Ism1 relative to insulin (n = 2, individual comparisons between conditions across phosphopeptides using empirical Bayes statistics followed by adjustment for multiple testing using false discovery rate, *p<0.05, **p<0.01, ***p<0.001).
Figure 3
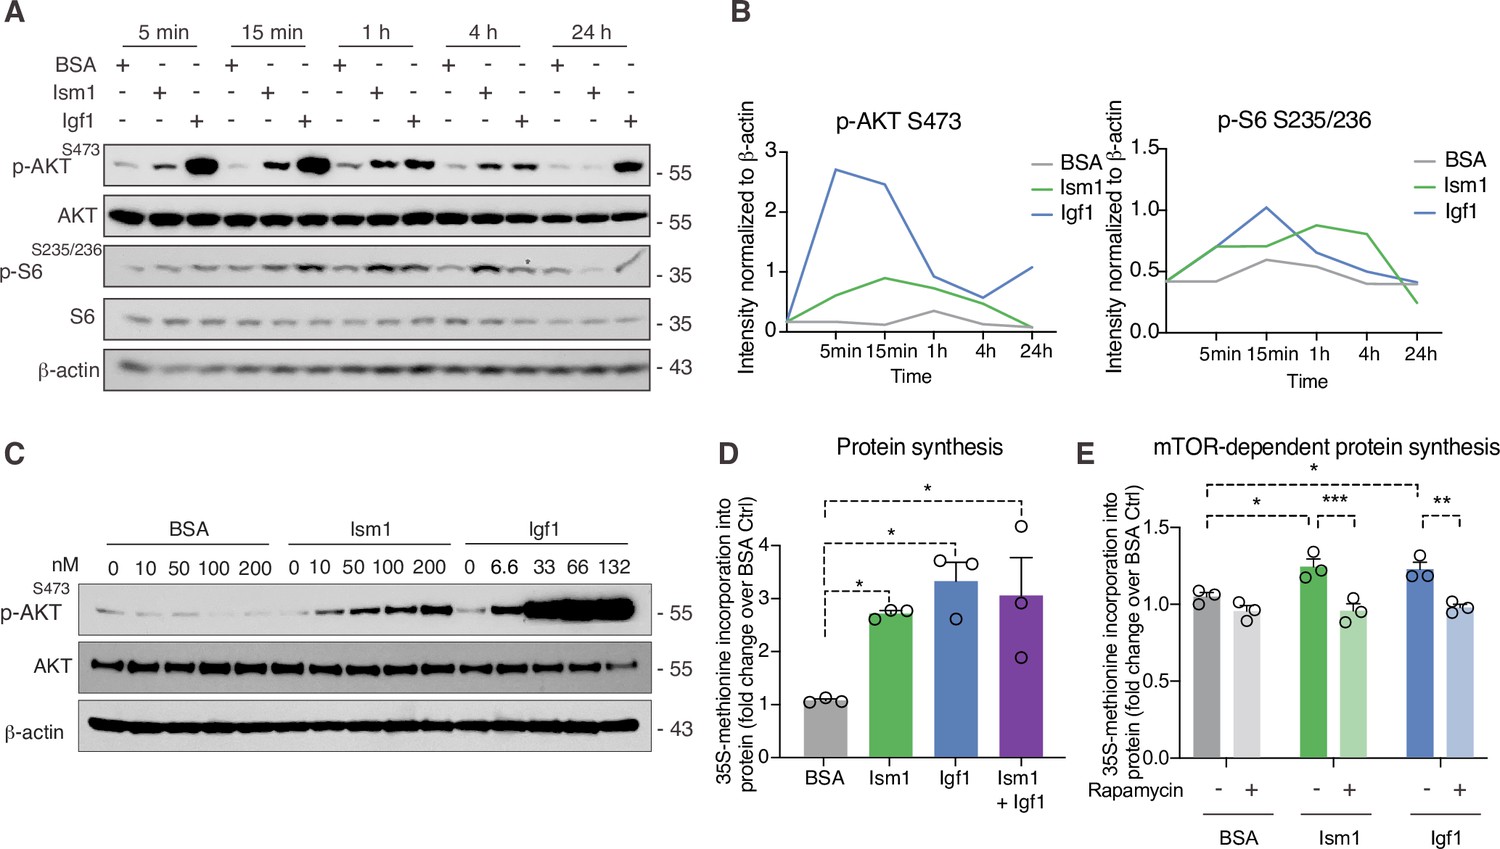
Ism1 induces mTOR-dependent protein synthesis in muscle cells.
(A) Western blot analysis of p-AKTS473, total AKT, p-S6S235/236, total S6, and β-actin in C2C12 myotubes treated with 100 nM bovine serum albumin (BSA), 100 nM Ism1, or 50 ng/ml Igf1. (B) Quantification of protein expression of p-AKT S473/β-actin and p-S6 S235/236/β-actin. (C) Western blot analysis of p-AKTS473, total AKT, and β-actin in C2C12 myoblasts treated with indicated concentrations of BSA, Ism1, or Igf1 for 5 min. (D) Levels of protein synthesis measured by [35S]-methionine incorporation in C2C12 myotubes after 48 hr of indicated treatments (n = 3, one-way ANOVA, *p<0.05, **p<0.01, ***p<0.001). (E) Levels of protein synthesis measured by [35S]-methionine incorporation in C2C12 myotubes with indicated treatments for 2 hr in the presence or absence of 100 nM of the mTOR inhibitor rapamycin (n = 3, two-way ANOVA, *p<0.05, **p<0.01, ***p<0.001). Bar graphs show mean ± SEM. See also Figure 3—source data 1 and Figure 3—source data 2.
-
Figure 3—source data 1
Raw data related to Figure 3B, D, and E.
- https://cdn.elifesciences.org/articles/80014/elife-80014-fig3-data1-v2.xlsx
-
Figure 3—source data 2
Uncropped Western blot images with relevant bands labeled.
- https://cdn.elifesciences.org/articles/80014/elife-80014-fig3-data2-v2.pdf
Figure 4 with 2 supplements
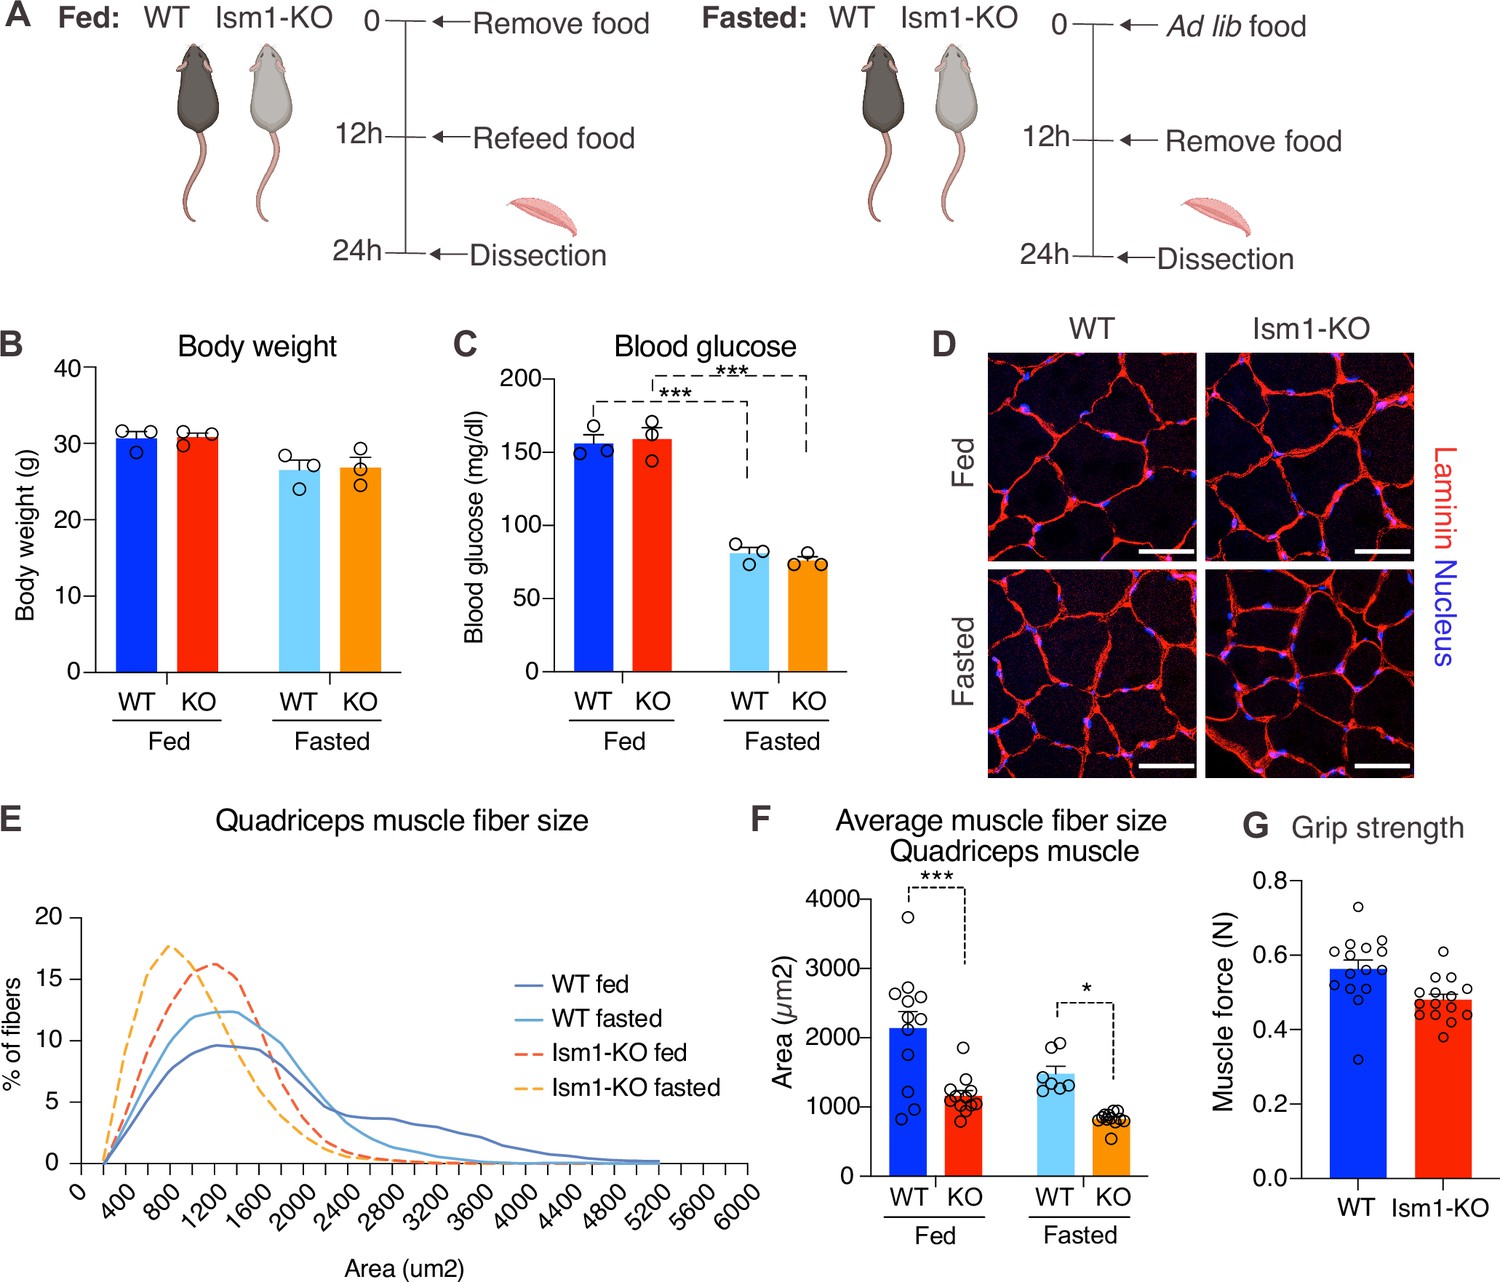
Ism1 ablation results in reduced skeletal muscle fiber size and muscle strength.
(A) Schematic description of the fasting and feeding protocol. (B) Body weights of WT and Ism1-KO mice in the fed or fasted groups (WT fed, n = 3; Ism1-KO fed, n = 3; WT fasted, n = 3; Ism1-KO fasted, n = 3, two-way ANOVA). (C) Blood glucose level in fed and fasted mice before dissection (WT fed, n = 3; Ism1-KO fed, n = 3; WT fasted, n = 3; Ism1-KO fasted, n = 3, two-way ANOVA, *p<0.05, **p<0.01, ***p<0.001). (D) Immunolabeling of laminin (red), staining of nucleus (blue) of mouse quadriceps muscles from WT and Ism1-KO mice in the fed or fasted groups (scale bars: 10 μm). Images are representative examples of three mice showing similar results. (E) Fiber size distribution of mouse quad muscles (WT fed, n = 3; Ism1-KO fed, n = 3; WT fasted, n = 3; Ism1-KO fasted, n = 3). Mean percentage of myofibers within the indicated range is shown. (F) Quantification of average muscle fiber area (WT fed, n = 3; Ism1-KO fed, n = 3; WT fasted, n = 3; Ism1-KO fasted, n = 3, one muscle tissue per mouse, 2–4 images per muscle tissue,~60–100 myofibers quantified per image; two-way ANOVA, *p<0.05, **p<0.01, ***p<0.001) performed in a blinded fashion by two independent investigators. This experiment was repeated using two independent cohorts of mice. (G) Grip strength measured by two-paw muscle force (N) on a grid in WT and Ism1-KO mice (WT, n = 15; Ism1-KO, n = 15). p-Values are calculated by two-tailed Student’s t-test, *p<0.05, **p<0.01, ***p<0.001. Bar graphs show mean ± SEM. See also Figure 4—figure supplements 1 and 2 and Figure 4—source data 1.
-
Figure 4—source data 1
Raw data related to Figure 4B, C,E–G.
- https://cdn.elifesciences.org/articles/80014/elife-80014-fig4-data1-v2.xlsx
Figure 4—figure supplement 1
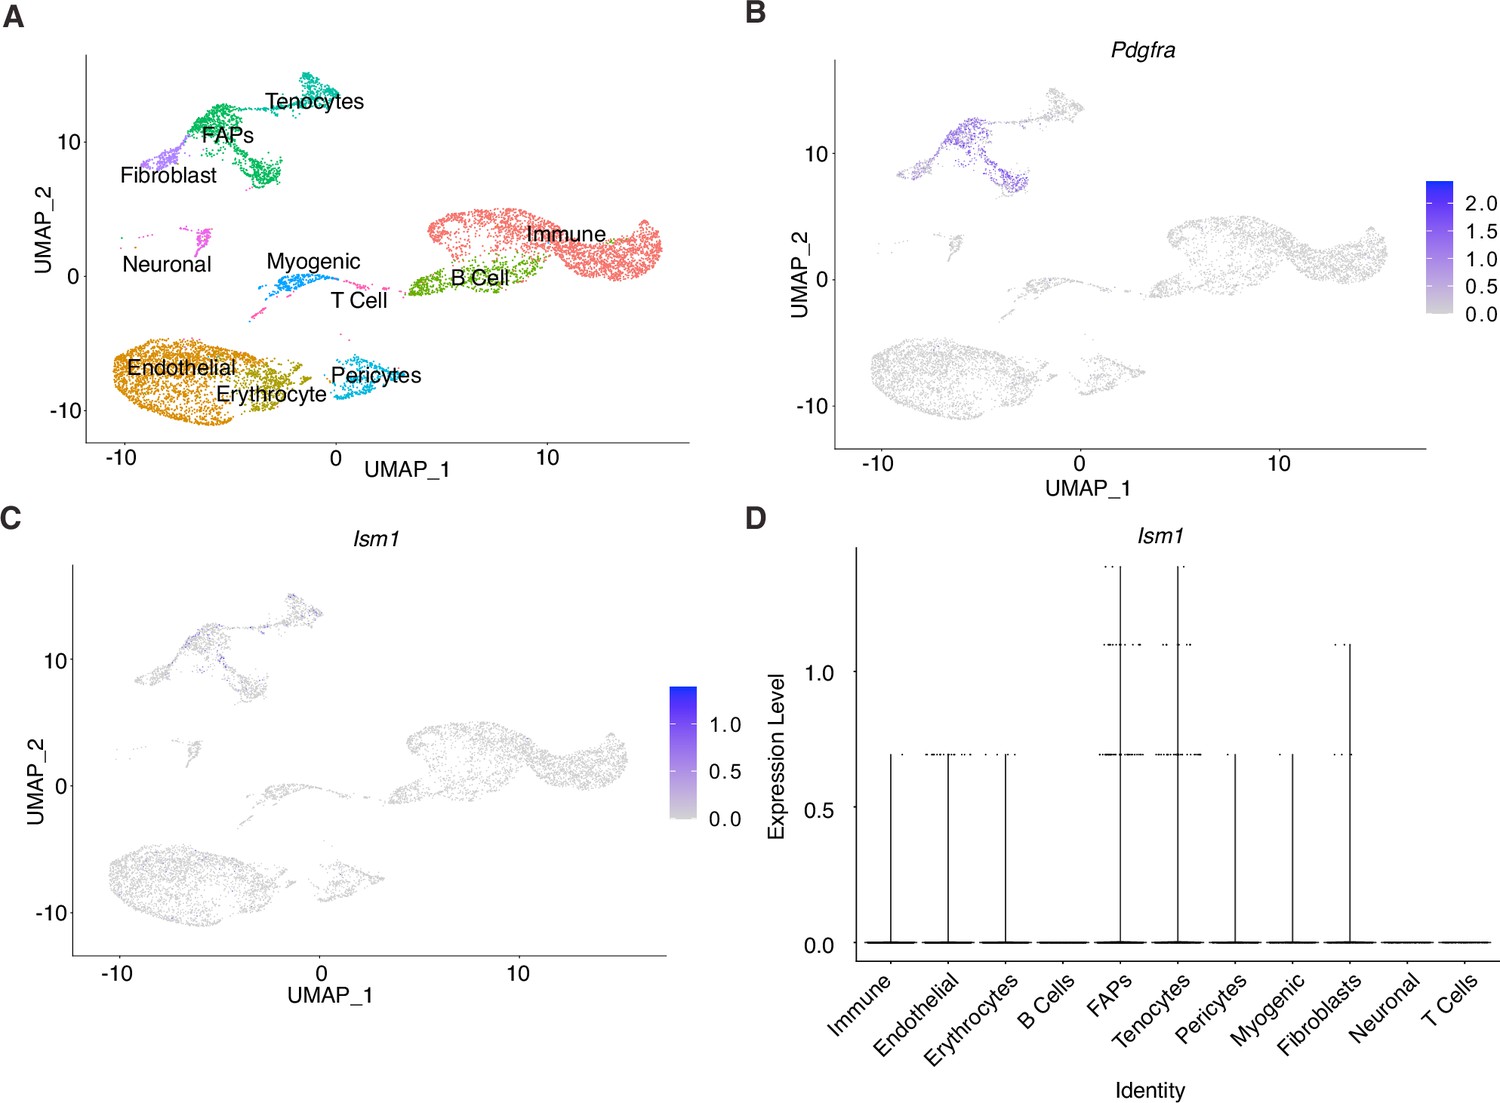
Ism1 acts non-cell-autonomously on muscle cells.
(A) UMAP plot of single-cell RNA sequencing of isolated cells from mouse skeletal muscle. (B) Expression of Pdgfra in fibro-adipose precursors within the muscle. (C) Low expression of Ism1 within the muscle tissue. (D) Low expression of Ism1 in myocytes and myoblasts.
Figure 4—figure supplement 2
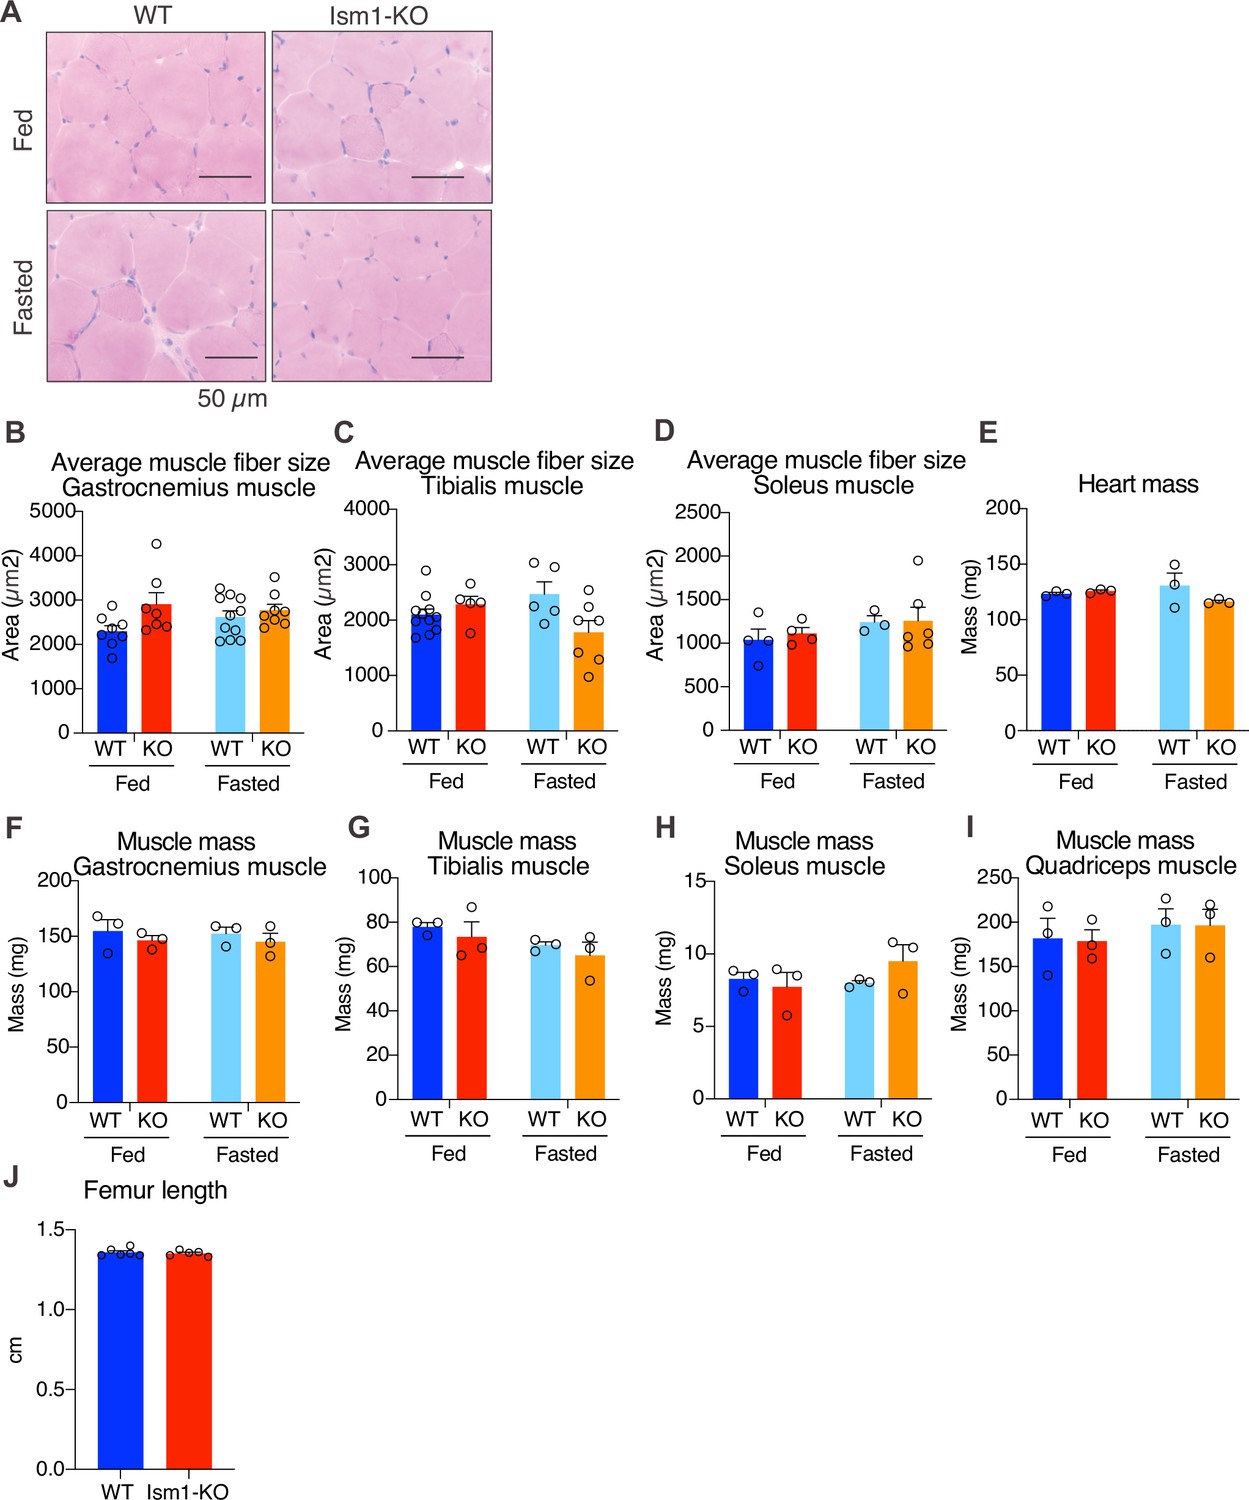
Ism1 ablation does not reduce muscle mass or muscle fiber size in all tissue locations.
(A) Hematoxylin and eosin (H&E) staining of mouse quadriceps muscles from WT and Ism1-KO mice in the fed or fasted groups (scale bars: 50 μm). Images are representative examples of three mice showing similar results. (B–D) Quantification of average muscle fiber area in gastrocnemius (B) tibialis (C), and soleus (D) in a blinded fashion by two independent investigators (WT fed, n = 3; Ism1-KO fed, n = 3, WT fasted, n = 3; Ism1-KO fasted, n = 3, two-way ANOVA, *p<0.05, **p<0.01, ***p<0.001). (E) Heart mass of WT and Ism1-KO mice in the fed or fasted groups (WT fed, n = 3; Ism1-KO fed, n = 3; WT fasted, n = 3; Ism1-KO fasted, n = 3, two-way ANOVA). (F–H) Muscle masses of gastrocnemius (F), tibialis (G), soleus (H), and quadriceps (I) of WT and Ism1-KO mice in the fed or fasted groups (WT fed, n = 3; Ism1-KO fed, n = 3; WT fasted, n = 3; Ism1-KO fasted, n = 3, two-way ANOVA). (J) Femur length measured in WT and Ism1-KO (WT, n = 6; Ism1-KO, n = 5, two-tailed Student’s t-test *p<0.05, **p<0.01, ***p<0.001). Bar graphs show mean ± SEM.
Figure 5
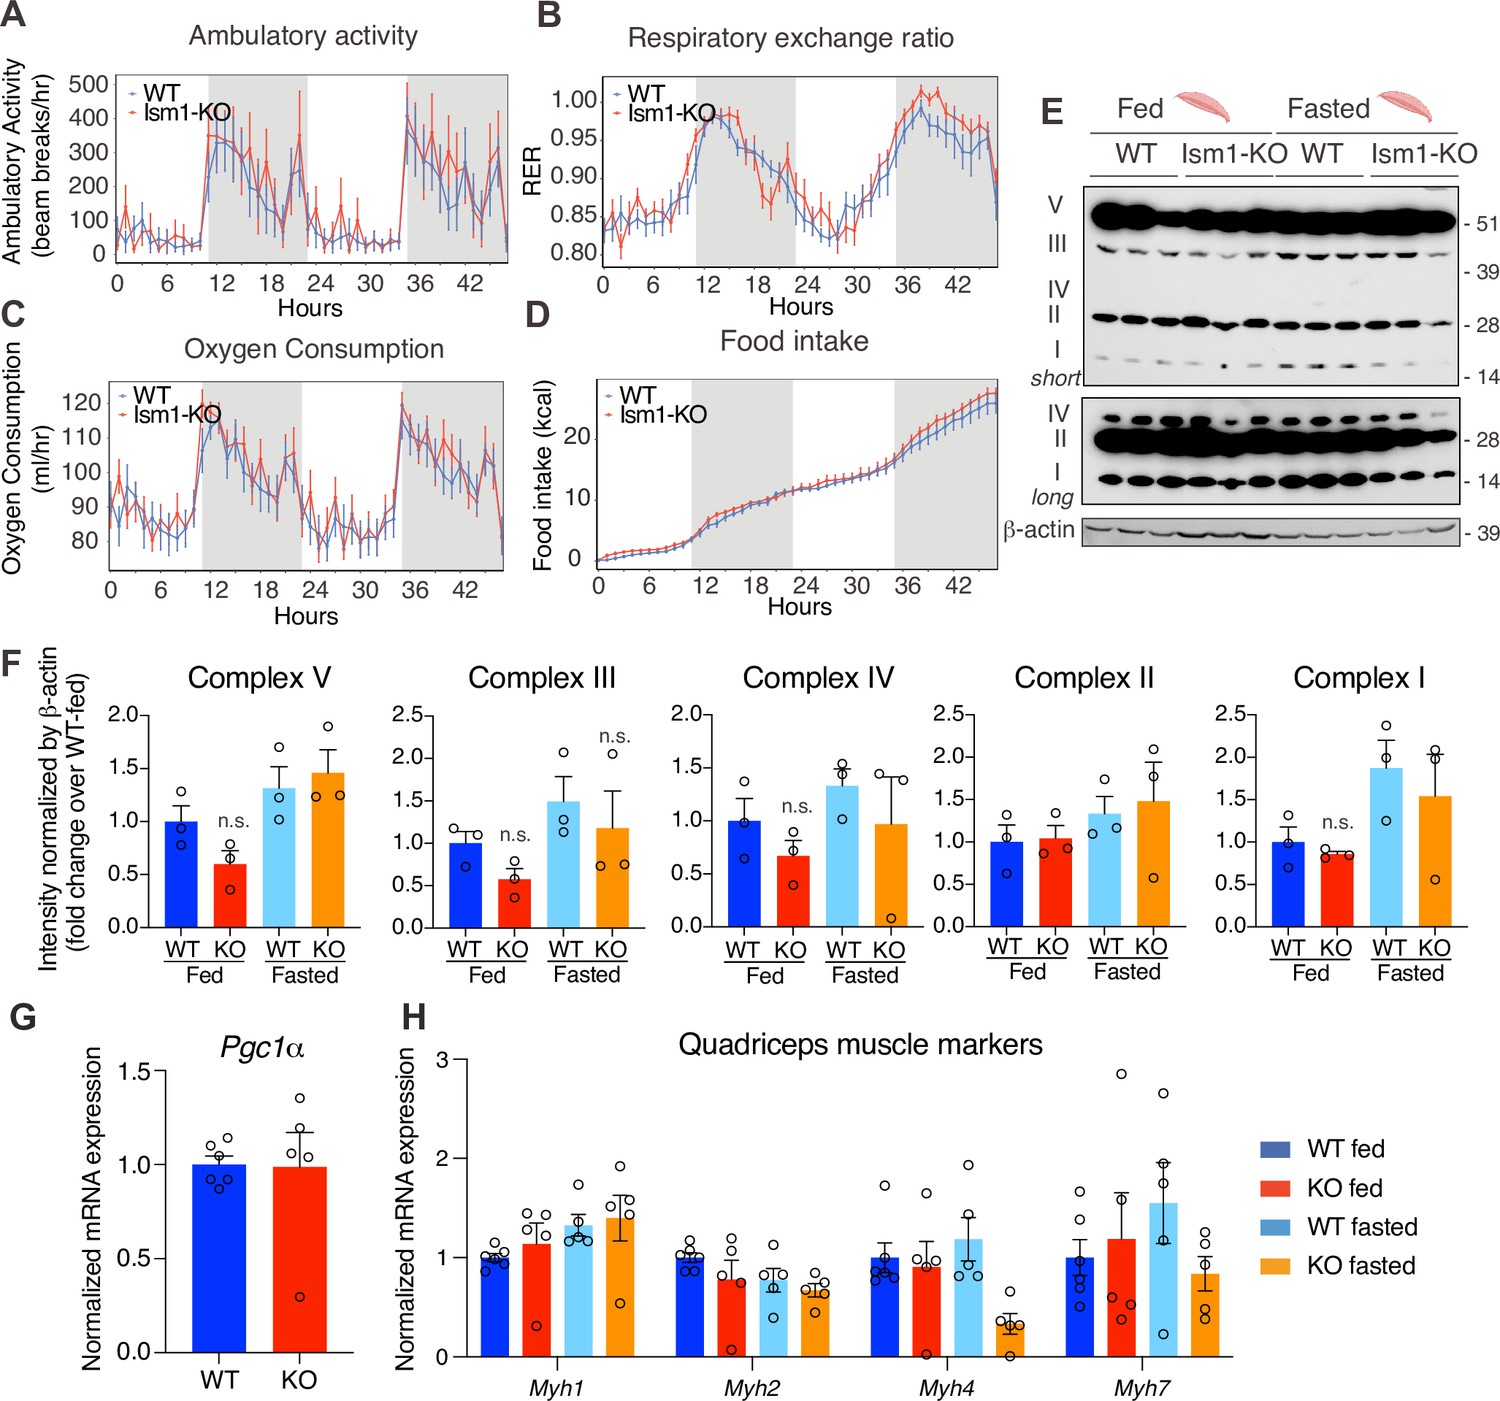
Ism1 ablation does not impair movement, mitochondrial biogenesis, or normal muscle development.
(A) Ambulatory activity (WT, n = 4; Ism1-KO, n = 4, ANOVA, *p<0.05). (B) Respiratory exchange ratio (RER) (WT, n = 4; Ism1-KO, n = 4, ANOVA, *p<0.05). (C) Oxygen consumption (WT, n = 4; Ism1-KO, n = 4, ANCOVA, *p<0.05). (D) Food intake (WT, n = 4; Ism1-KO, n = 4, ANCOVA, *p<0.05) in WT and Ism1-KO mice. Mice were habituated for 24 hr followed by 48 hr recordings of metabolic parameters. (E) Levels of mitochondrial oxidative phosphorylation proteins in ETC complexes (OXPHOS) from quadriceps muscles (WT fed, n = 3; Ism1-KO fed, n = 3; WT fasted, n = 3; Ism1-KO fasted, n = 3) analyzed by Western blot. (F) Quantification of OXPHOS complexes (two-way ANOVA, *p<0.05, **p<0.01, ***p<0.001). (G) Relative gene expression analysis of Pgc1α in quadriceps muscle from WT (n = 6) or Ism1-KO (n = 5) mice (two-tailed Student’s t-test, *p<0.05, **p<0.01, ***p<0.001). (H) Relative gene expression analysis of Myh1, Myh2, Myh4, and Myh7 in quadriceps muscle from WT fed (n = 6) or Ism1-KO fed (n = 5) vs. WT fasted (n = 5) or Ism1-KO fasted (n = 5) mice (two-way ANOVA, *p<0.05, **p<0.01, ***p<0.001). Bar graphs show mean ± SEM. See also Figure 5—source data 1 and Figure 5—source data 2.
-
Figure 5—source data 1
Raw data related to Figure 5A–D,F–H.
- https://cdn.elifesciences.org/articles/80014/elife-80014-fig5-data1-v2.xlsx
-
Figure 5—source data 2
Uncropped Western blot images with relevant bands labeled.
- https://cdn.elifesciences.org/articles/80014/elife-80014-fig5-data2-v2.pdf
Figure 6 with 1 supplement

Ism1-KO mice have defective skeletal muscle protein synthesis and AKT-mTOR signaling.
(A) Total protein content measured in WT and Ism1-KO quadriceps muscle expressed as mg protein/wet tissue weight in grams. (WT, n = 12; Ism1-KO, n = 9, two-tailed Student’s t-test, *p<0.05, **p<0.01, ***p<0.001). (B) Schematic description of the in vivo [35S]-methionine incorporation protocol. (C) In vivo protein synthesis measured by [35S]-methionine incorporation in WT and Ism1-KO mice (WT, n = 12; Ism1-KO, n = 9, two-tailed Student’s t-test, *p<0.05, **p<0.01, ***p<0.001). Relative gene expression analysis of (D) FoxO and (E) FoxO target genes Cdkn1b, Eif4ebp1, and Ctsl in quadriceps muscle from WT fed (n = 6) or Ism1-KO fed (n = 5) vs. WT fasted (n = 5) or Ism1-KO fasted (n = 5) mice (two-way ANOVA, *p<0.05, **p<0.01, ***p<0.001). (F) Western blot analysis and quantification of the levels of p27 and tubulin in the cytosolic fraction of quadriceps muscles of WT and Ism1-KO mice under fed and fasted conditions (WT fed, n = 3; Ism1-KO fed, n = 3, WT fasted, n = 3; Ism1-KO fasted, n = 3, two-way ANOVA, *p<0.05, **p<0.01, ***p<0.001). (G) Western blot analysis and quantification of the levels of pAKTS473, total AKT, p-mTORS2448, total mTOR, pS6S235/236, total S6, and β-actin in quadriceps muscles of WT and Ism1-KO mice under fed and fasted conditions (WT fed, n = 3; Ism1-KO fed, n = 3, WT fasted, n = 3; Ism1-KO fasted, n = 3, two-way ANOVA, *p<0.05, **p<0.01, ***p<0.001). Bar graphs show mean ± SEM. See also Figure 6—figure supplement 1, Figure 6—source data 1, and Figure 6—source data 2.
-
Figure 6—source data 1
Raw data related to Figure 6A,C–G.
- https://cdn.elifesciences.org/articles/80014/elife-80014-fig6-data1-v2.xlsx
-
Figure 6—source data 2
Uncropped Western blot images with relevant bands labeled.
- https://cdn.elifesciences.org/articles/80014/elife-80014-fig6-data2-v2.pdf
Figure 6—figure supplement 1
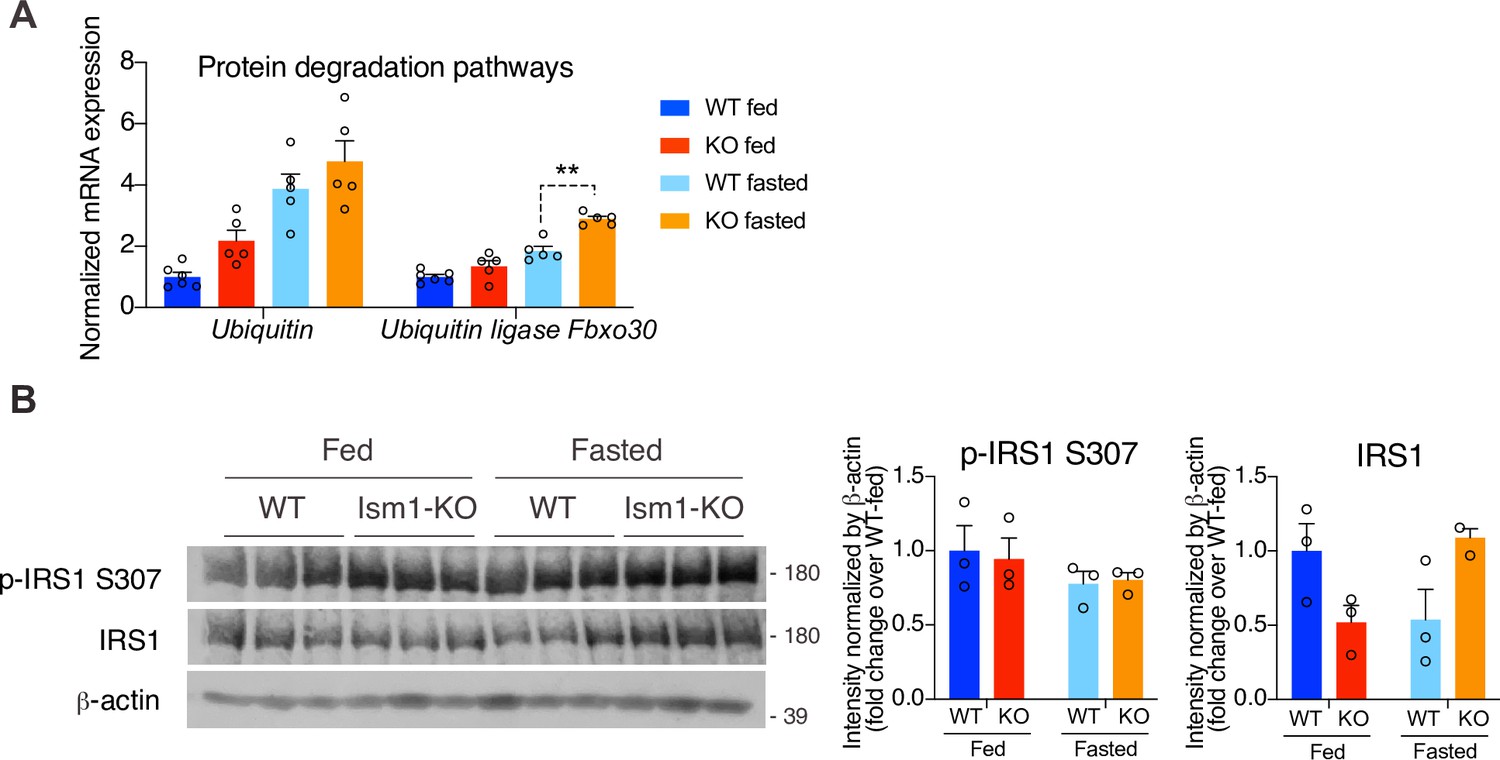
Ubiquitin expression and insulin receptor substrate-1 (Irs1/2) phosphorylation status in quadriceps muscles of WT and Ism1-KO mice.
(A) Relative gene expression analysis of Ubiquitin and the ubiquitin ligase Fbxo30 in quadriceps muscle from WT fed (n = 6) or Ism1-KO fed (n = 5) vs. WT fasted (n = 5) or Ism1-KO fasted (n = 5) mice. p-Values are calculated by two-way ANOVA, *p<0.05, **p<0.01, ***p<0.001. (B) Western blot analysis and quantification of the in vivo levels of p-IRS1 S307, IRS1, and β-actin in quadriceps muscles of WT and Ism1-KO mice under fed and fasted conditions (WT fed, n = 3, Ism1-KO fed, n = 3, WT fasted, n = 3, Ism1-KO fasted, n = 3, two-way ANOVA, *p<0.05, **p<0.01, ***p<0.001). Bar graphs show mean ± SEM.
Author response image 1
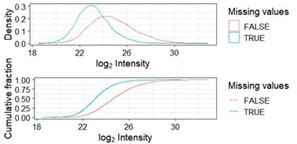
Distribution of missing values as a function of log2 transformed intensities.
Missing values (blue) are more abundant among phosphopeptides with a low intensity across samples. This is referred to as left-censored data.
Author response image 2

Overlap between significant phosphopeptides using the missing value imputation algorithms minProb, man and QRILC after running imputation, significance testing and adjustment for multiple testing once for each method.
Note that numbers may change slightly from run as imputation algorithms are based upon gaussians.
Tables
Appendix 1—key resources table
| Reagent type (species) or resource | Designation | Source or reference | Identifiers | Additional information |
|---|---|---|---|---|
| Strain, strain background (Mus musculus) | C57BL/6J | Jackson Laboratory | Cat# 000664; RRID:IMSR_JAX:000664 | |
| Strain, strain background (M. musculus) | C57BL/6J Ism1 whole-body knockout | Jiang et al., 2021 | Cat# 036776 | Generated from C57BL/6J-Ism1em1Kajs/J |
| Cell line (M. musculus) | C2C12 | ATCC | CRL-1772; RRID:CVCL_0188 | |
| Cell line (M. musculus) | 3T3-F442A | MilliporeSigma | Cat# 00070654; RRID:CVCL_0122 | |
| Cell line (Homo sapiens) | Expi293F | Thermo Fisher | Cat#: A14527; RRID:CVCL_D615 | |
| Antibody | Anti-p-AKT (Ser473) (rabbit monoclonal) | Cell Signaling Technology | Cat# 4060; RRID:AB_2315049 | (1:2000) |
| Antibody | Anti-Akt (pan) (rabbit monoclonal) | Cell Signaling Technology | Cat# 4691; RRID:AB_915783 | (1:1000) |
| Antibody | Anti-p-S6 ribosomal protein (Ser235/236) (rabbit polyclonal) | Cell Signaling Technology | Cat# 2211; RRID:AB_331679 | (1:1000) |
| Antibody | Anti-S6 ribosomal protein (rabbit monoclonal) | Cell Signaling Technology | Cat# 2217, RRID:AB_331355 | (1:1000) |
| Antibody | Anti-p-mTOR (Ser2448) (rabbit monoclonal) | Cell Signaling Technology | Cat# 5536; RRID:AB_10691552 | (1:1000) |
| Antibody | Anti-mTOR (rabbit monoclonal) | Cell Signaling Technology | Cat# 2983; RRID:AB_2105622 | (1:1000) |
| Antibody | Anti-beta actin [AC-15] (HRP) (mouse monoclonal) | Abcam | Cat# AB49900; RRID:AB_867494 | (1:25,000) |
| Antibody | Antibody cocktail: OXPHOS Rodent WB Antibody Cocktail (mouse monoclonal) | Thermo Fisher | Cat# 45-8099; RRID:AB_2533835 | (1:1000) |
| Antibody | Anti-phospho-IRS-1 (Ser307) antibody (rabbit polyclonal) | Cell Signaling Technology | Cat# 2381; RRID:AB_330342 | (1:1000) |
| Antibody | Anti-IRS-1 antibody (rabbit monoclonal) | Cell Signaling Technology | Cat# 3407; RRID:AB_2127860 | (1:1000) |
| Antibody | Anti-alpha tubulin antibody (rabbit polyclonal) | Abcam | Cat# ab4074; RRID:AB_2288001 | (1:1000) |
| Antibody | Anti-p27 Kip1 antibody (SX53G8.5) (mouse monoclonal) | Cell Signaling Technology | Cat# 3698; RRID:AB_2077832 | (1:1000) |
| Antibody | IgG HRP linked Ab (rabbit polyclonal) | MilliporeSigma | Cat# NA934; RRID:AB_2722659 | (1:1000) |
| Antibody | IgG HRP linked Ab (mouse monoclonal) | MilliporeSigma | Cat# NA931; RRID:AB_772210 | (1:1000) |
| Antibody | Anti-laminin B2 antibody, clone A5 (rat monoclonal) | MilliporeSigma | Cat# 05-206; RRID:AB_309655 | (1:200) |
| Antibody | Anti-rat IgG secondary antibody, Alexa Fluor 594 (goat polyclonal) | Thermo Fisher Scientific | Cat# A11007; RRID:AB_10561522 | (1:1000) |
| Sequence-based reagent | Myh1_F | This paper | PCR primer | GCGAATCGAGGCTCAGAACAA |
| Sequence-based reagent | Myh1_R | This paper | PCR primer | GTAGTTCCGCCTTCGGTCTTG |
| Sequence-based reagent | Myh2_F | This paper | PCR primer | AAGTGACTGTGAAAACAGAAGCA |
| Sequence-based reagent | Myh2_R | This paper | PCR primer | GCAGCCATTTGTAAGGGTTGAC |
| Sequence-based reagent | Myh4_F | This paper | PCR primer | TTGAAAAGACGAAGCAGCGAC |
| Sequence-based reagent | Myh4_R | This paper | PCR primer | AGAGAGCGGGACTCCTTCTG |
| Sequence-based reagent | Myh7_F | This paper | PCR primer | ACTGTCAACACTAAGAGGGTCA |
| Sequence-based reagent | Myh7_R | This paper | PCR primer | TTGGATGATTTGATCTTCCAGGG |
| Sequence-based reagent | Ppargc1a_F | This paper | PCR primer | TATGGAGTGACATAGAGTGTGCT |
| Sequence-based reagent | Ppargc1a_R | This paper | PCR primer | CCACTTCAATCCACCCAGAAAG |
| Sequence-based reagent | Foxo1_F | This paper | PCR primer | CCCAGGCCGGAGTTTAACC |
| Sequence-based reagent | Foxo1_R | This paper | PCR primer | GTTGCTCATAAAGTCGGTGCT |
| Sequence-based reagent | Foxo3_F | This paper | PCR primer | CTGGGGGAACCTGTCCTATG |
| Sequence-based reagent | Foxo3_R | This paper | PCR primer | TCATTCTGAACGCGCATGAAG |
| Sequence-based reagent | Foxo4_F | This paper | PCR primer | GGTGCCCTACTTCAAGGACA |
| Sequence-based reagent | Foxo4_R | This paper | PCR primer | AGCTTGCTGCTGCTATCCAT |
| Sequence-based reagent | Cdkn1b_F | This paper | PCR primer | TCAAACGTGAGAGTGTCTAACG |
| Sequence-based reagent | Cdkn1b_R | This paper | PCR primer | CCGGGCCGAAGAGATTTCTG |
| Sequence-based reagent | Eif4ebp1_F | This paper | PCR primer | GGGGACTACAGCACCACTC |
| Sequence-based reagent | Eif4ebp1_R | This paper | PCR primer | CTCATCGCTGGTAGGGCTA |
| Sequence-based reagent | Ctsl_F | This paper | PCR primer | TATCCCTCAGCAAGAGAAAGCCCT |
| Sequence-based reagent | Ctsl_R | This paper | PCR primer | TCCTTCATAGCCATAGCCCACCAA |
| Sequence-based reagent | Fbxo30_F | This paper | PCR primer | TCGTGGAATGGTAATCTTGC |
| Sequence-based reagent | Fbxo30_R | This paper | PCR primer | CCTCCCGTTTCTCTATCACG |
| Sequence-based reagent | UbC_F | This paper | PCR primer | CGTCGAGCCCAGTGTTACCACC |
| Sequence-based reagent | UbC_R | This paper | PCR primer | ACCTCCCCCATCACACCCAAGA |
| Peptide, recombinant protein | Mouse recombinant Ism1-his protein | This paper and PMID:34348115 | N/A | |
| Peptide, recombinant protein | Recombinant mouse IGF-I/IGF-1 protein | R&D Systems | Cat# 791-MG-050 | |
| Recombinant DNA reagent | Mouse Ism1 with C-terminal Myc-6X-his tag | Addgene and PMID:34348115 | Cat# 173046; RRID:Addgene_173046 | |
| Commercial assay or kit | Pierce BCA Protein Assay Kit | Thermo Fisher Scientific | Cat# 23225 | |
| Commercial assay or kit | Nuclear Cytoplasmic Extraction Reagent kit | Pierce | Cat# 78833 | |
| Chemical compound, drug | Bovine serum albumin | MilliporeSigma | Cat# A7906; CAS:9048-46-8 | |
| Chemical compound, drug | Rapamycin | Cell Signaling Technology | Cat# 9904 | |
| Chemical compound, drug | 2× SYBR Green qPCR master mix | Bimake | Cat# B21203 | |
| Chemical compound, drug | Trizol | Thermo Fisher | Cat# 15-596-026 | |
| Chemical compound, drug | High-capacity cDNA reverse transcription kit | Biosystems | Cat# 4368814 | |
| Chemical compound, drug | DMEM/F12 + GlutaMAX | Thermo Fisher | Cat# 10565-042 | |
| Chemical compound, drug | DMEM high glucose | Sigma | Cat# D6429 | |
| Chemical compound, drug | Trypsin/EDTA 0.25% | Gibco | Cat# 25200-056 | |
| Chemical compound, drug | Penicillin/streptomycin | Gibco | Cat# 15140-122 | |
| Chemical compound, drug | PBS | Gibco | Cat# 10010-023 | |
| Chemical compound, drug | Trypan Blue Stain (0.4%) | Invitrogen | Cat# T10282 | |
| Chemical compound, drug | Hoechst | Thermo Fisher | Cat# 33342 | |
| Chemical compound, drug | Immobilon Crescendo Western HRP substrate | MilliporeSigma | Catt# WBLUR0500 | |
| Chemical compound, drug | SuperSignal West Femto HRP substrate | Thermo Scientific | Cat# 34095 | |
| Chemical compound, drug | SeeBlue Plus2 prestained standard | Invitrogen | Cat# LC5925 | |
| Chemical compound, drug | RIPA buffer (10×) | Cell Signaling | Cat# 9806S | |
| Chemical compound, drug | NuPAGE LDS sample buffer (4×) | Invitrogen | Cat# NP0007 | |
| Chemical compound, drug | 2-Mercaptoethanol | Fisher Chemical | Cat# O3446I | |
| Chemical compound, drug | PhosSTOP | Roche | Cat# 04906837001 | |
| Chemical compound, drug | cOmplete Tablets | Roche | Cat# 04693124001 | |
| Chemical compound, drug | L-[35S]-Methionine | PerkinElmer | NEG009L005MC | |
| Software, algorithm | ImageJ | Schneider et al., 2012 | https://imagej.nih.gov/ij/; RRID:SCR_003070 | |
| Software, algorithm | GraphPad Prism version 8.0 | GraphPad Software, San Diego, CA | http://www.graphpad.com/; RRID:SCR_002798 | |
| Software, algorithm | Adobe Illustrator | Adobe Systems | RRID:SCR_010279 | |
| Software, algorithm | RStudio | https://rstudio.com/ | RRID:SCR_000432 |
Additional files
-
MDAR checklist
- https://cdn.elifesciences.org/articles/80014/elife-80014-mdarchecklist1-v2.docx
-
Source data 1
- https://cdn.elifesciences.org/articles/80014/elife-80014-data1-v2.zip
-
Source data 2
Source data for the phosphoproteomic analysis and quality control.
- https://cdn.elifesciences.org/articles/80014/elife-80014-data2-v2.zip
Download links
A two-part list of links to download the article, or parts of the article, in various formats.
Downloads (link to download the article as PDF)
Open citations (links to open the citations from this article in various online reference manager services)
Cite this article (links to download the citations from this article in formats compatible with various reference manager tools)
Phosphoproteomic mapping reveals distinct signaling actions and activation of muscle protein synthesis by Isthmin-1
eLife 11:e80014.
https://doi.org/10.7554/eLife.80014


