Deconstructing cold-induced brown adipocyte neogenesis in mice
- Center for Molecular Medicine and Genetics, Wayne State University, United States
- Center for Integrative Metabolic and Endocrine Research, Wayne State University, United States
Figures
Figure 1
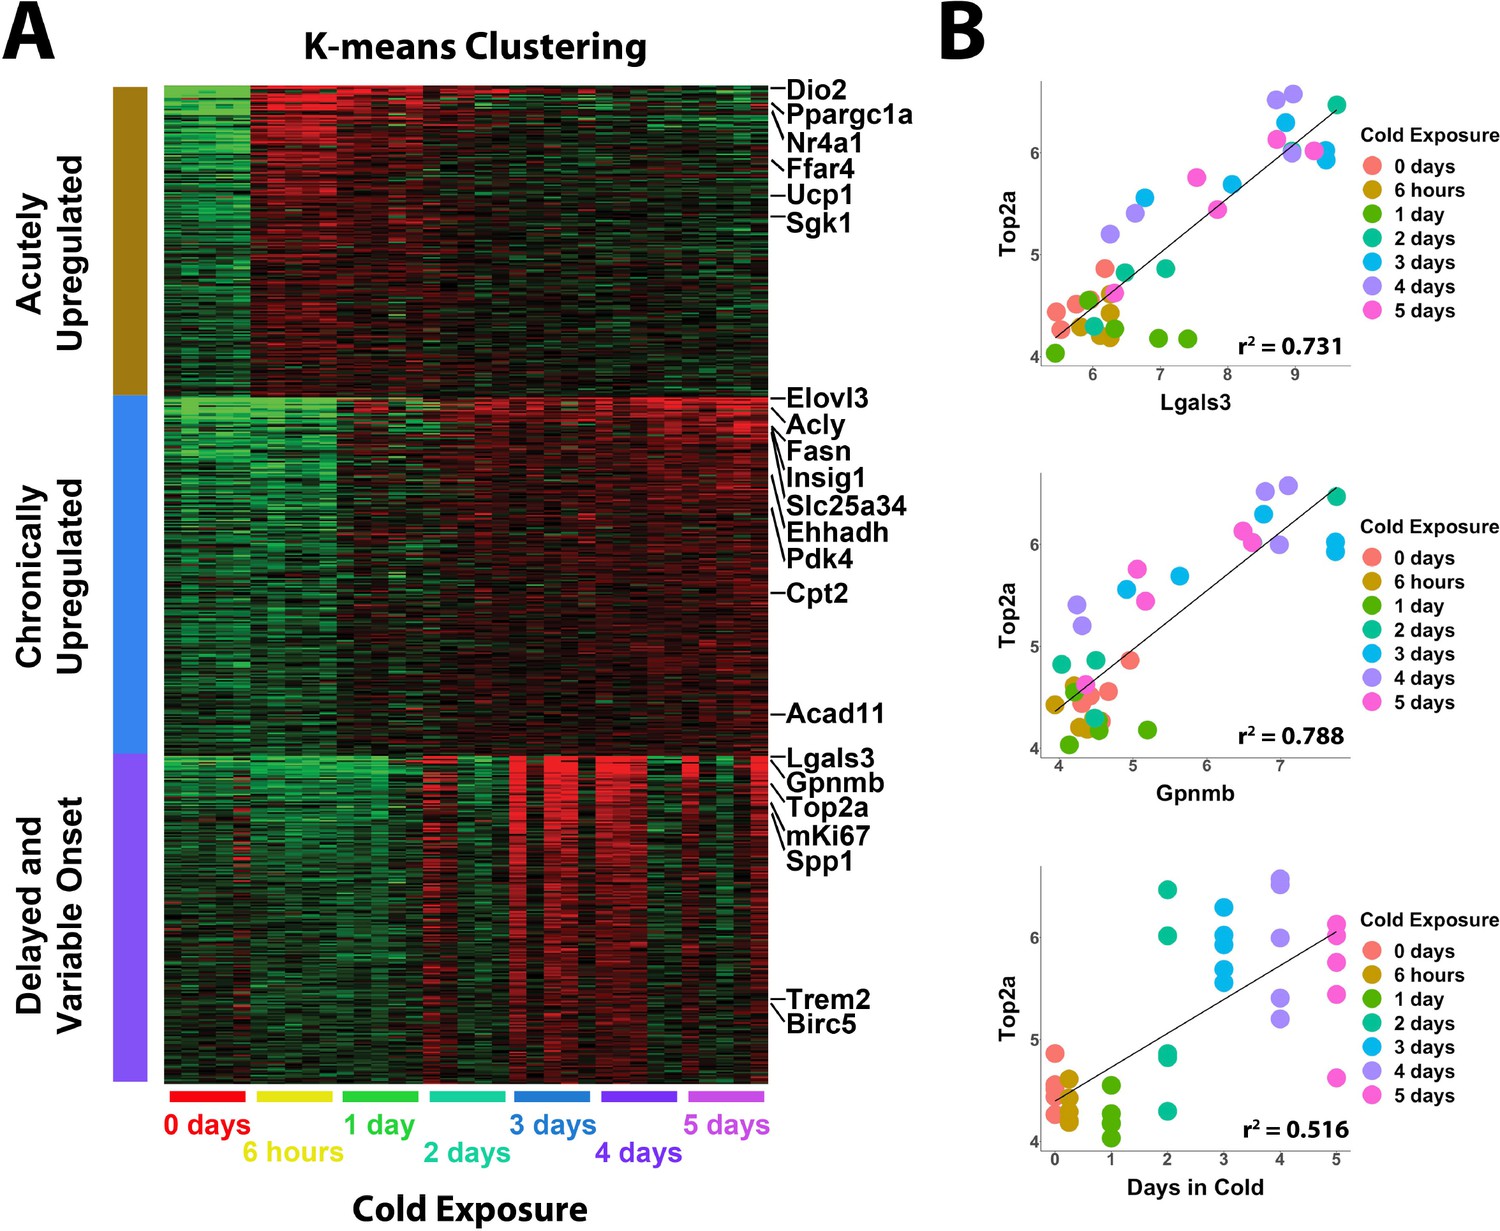
Whole tissue RNA-sequencing analysis reveals proliferation correlates with immune cell recruitment during cold exposure.
(A) Heatmap of K-means clustering of whole tissue RNA-sequencing data. Rows of the heatmap are genes, and columns are individual RNA-seq libraries. Red and green colors represent upregulation and downregulation, respectively. Analysis includes five replicates (individual mice) each from seven different cold exposure durations: room temperature controls, and 6 hr, 1 day, 2 days, 3 days, 4 days, or 5 days of cold exposure for a total of 35 RNA-seq libraries. (B) Correlation of specific variables in the RNA-seq data with Top2a expression by individual library. r2 values are displayed on the plot.
Figure 2 with 2 supplements
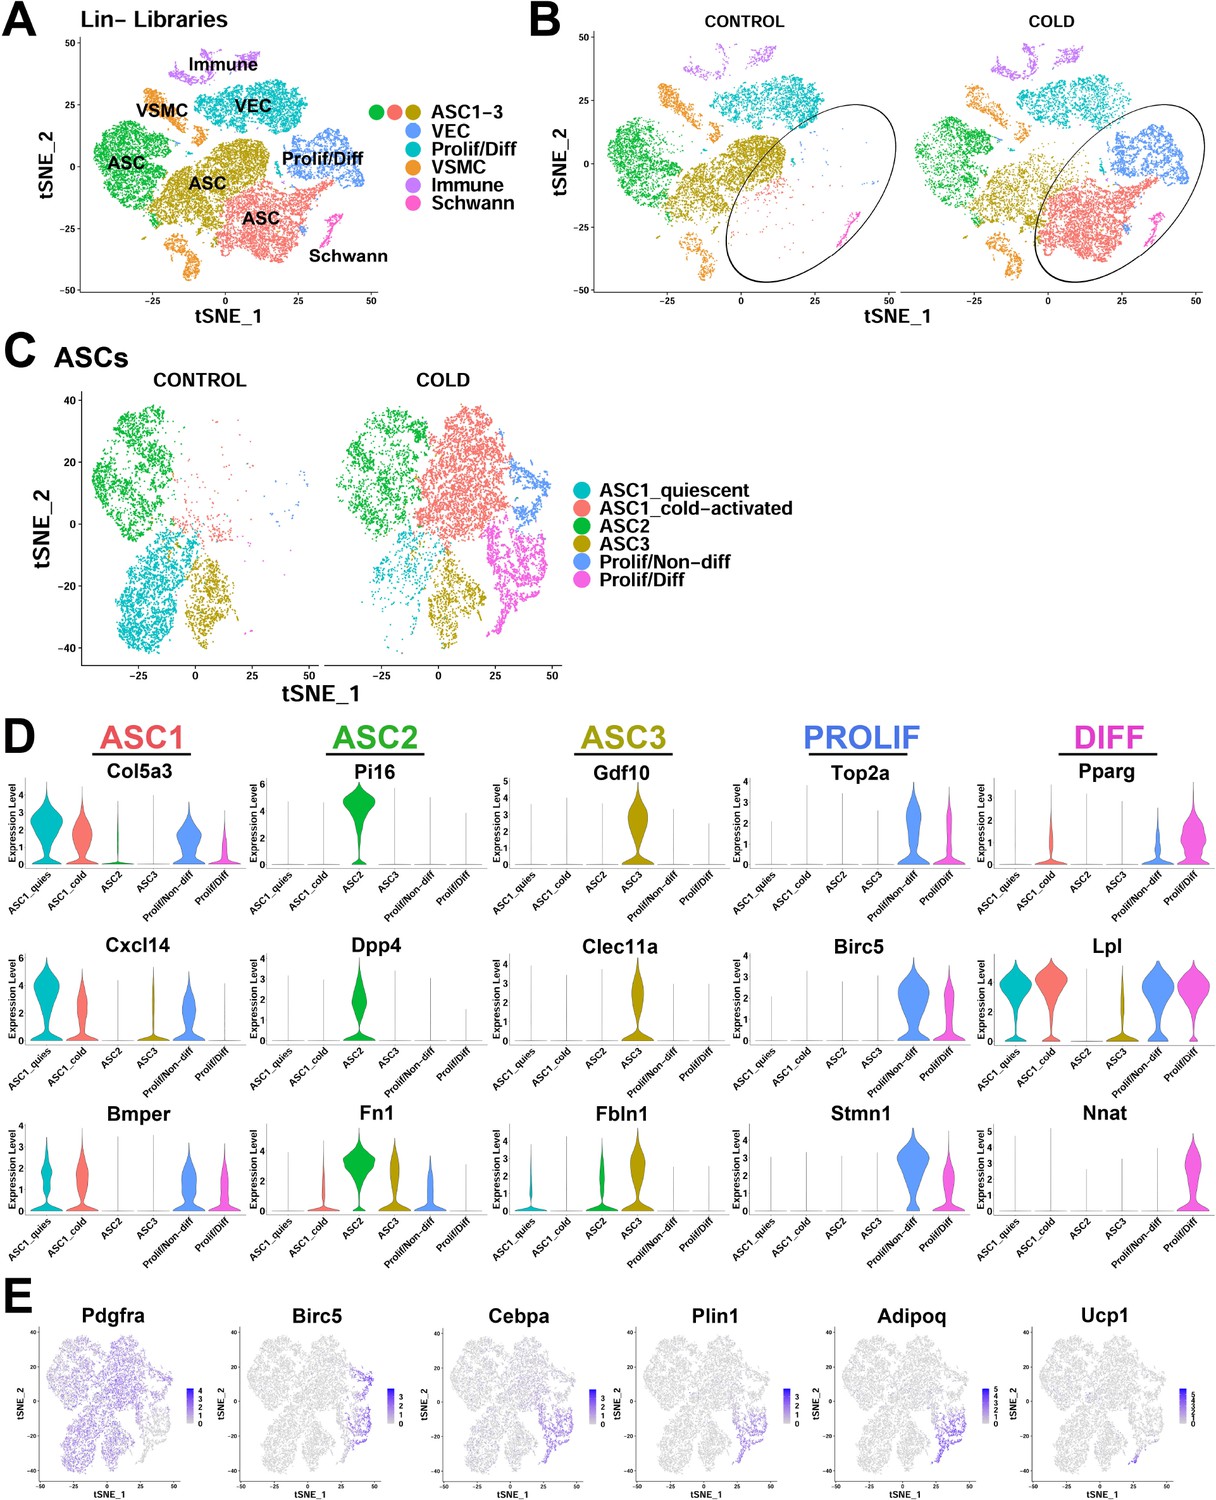
scRNA-seq reveals ASC heterogeneity and maps adipogenic trajectories in mouse iBAT.
(A) t-SNE plot of 28,691 lineage marker negative (Lin-) cells from iBAT of control mice and mice exposed to cold for four days. Clustering identified eight major clusters, highlighted in different colors. ASC, adipose tissue stromal cell; VEC, vascular endothelial cell; VSMC, vascular smooth muscle cells; Prolif/Diff, proliferating/differentiating cells. DEGs that define these clusters are in Supplementary file 1. (B) t-SNE plot from (A) split into cells from the separate treatments (CONTROL and COLD). Circles highlight cold-induced clusters. (C) t-SNE plot of 19,659 re-clustered ASC and Prolif/Diff cells from (A). The t-SNE plot and clustering identified six clusters. Prolif/Non-diff, proliferating/non-differentiating; Prolif/Diff, proliferating/differentiating. DEGs that define these clusters are in Supplementary file 2. (D) Violin plots of log2 expression levels of select marker genes for individual clusters from the CONTROL and COLD data presented in (C). (E) t-SNE plots displaying the log2 expression levels for genes involved in adipogenic differentiation from the CONTROL and COLD data presented in (C).
Figure 2—figure supplement 1
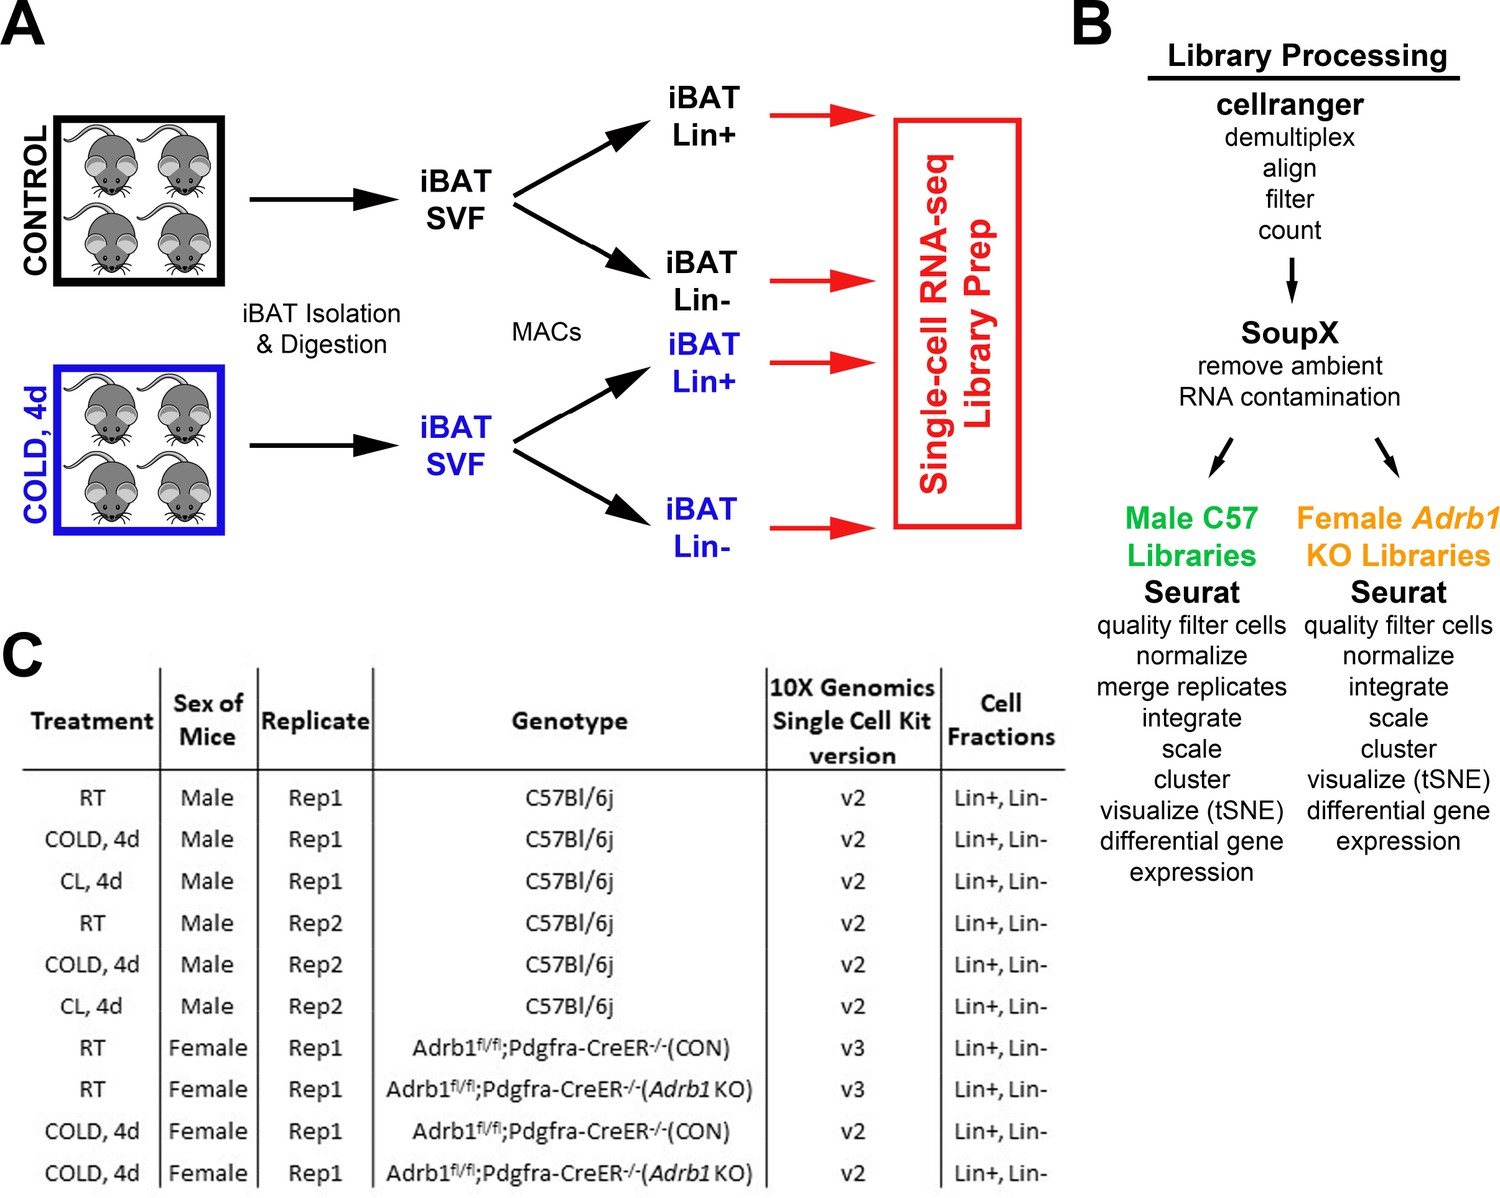
Schematic diagram of single-cell library generation and processing.
(A) Schematic of one single-cell experiment from cohorts of control and cold-exposed mice. Mouse iBAT was harvested and digested into the stomal vascular fraction (SVF). These cells were separated into lineage marker positive (Lin+) and negative (Lin-) cell fractions with magnetic bead cell separation (MACS). Single-cell libraries were prepared from these four cell fractions. (B) Method of demultiplexing and data analysis for the scRNA-seq libraries. Analysis for C57 and Adrb1 KO libraries differed slightly due to method of library generation. (C) Summary of the single-cell libraries presented in this paper. Note that each row of the table corresponds to two scRNA-seq libraries: Lin+ and Lin-.
Figure 2—figure supplement 2
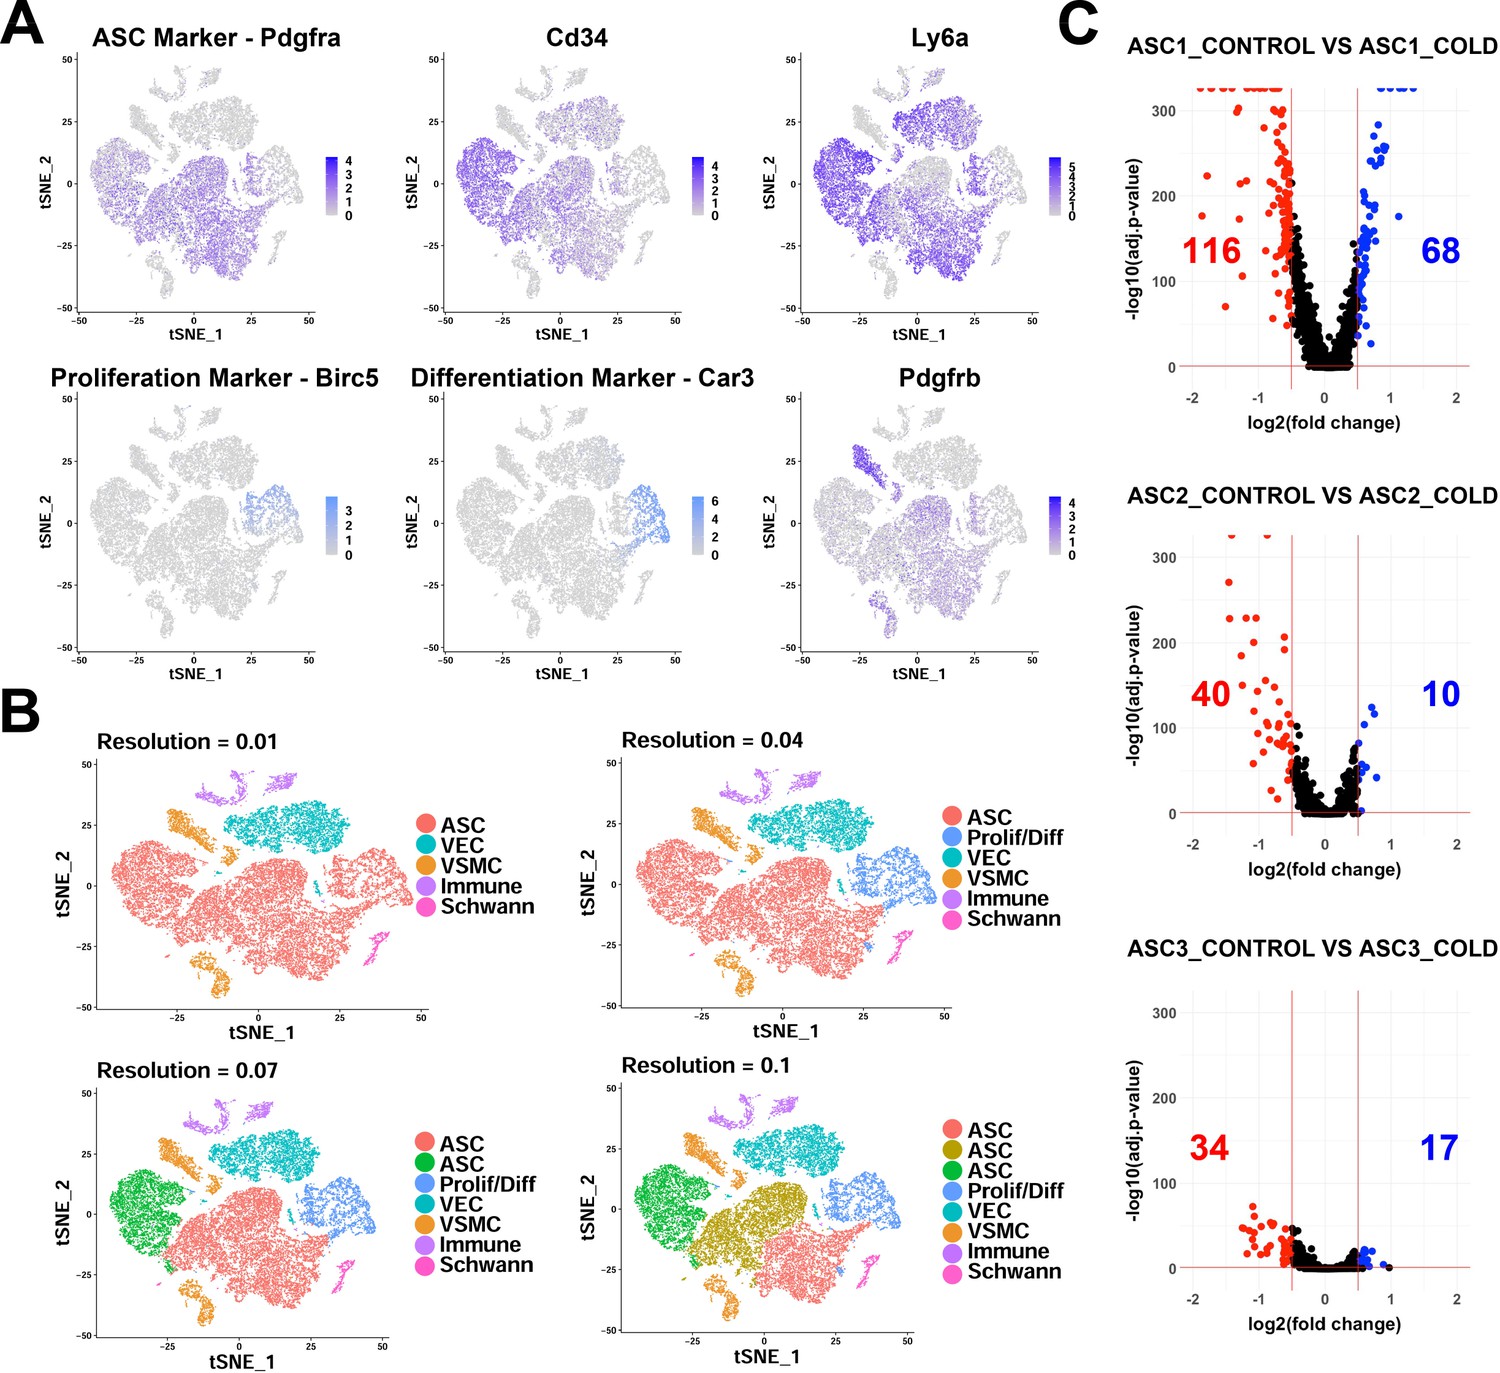
scRNA-seq analysis of Lin- cells from iBAT of control and cold-exposed mice.
Related to Figure 2. (A) t-SNE plot of Lin- data displaying the log2 expression levels for genes commonly used to isolate adipocyte precursors and markers for proliferating/differentiating cells. (B) t-SNE plot of Lin- data with clustering at different resolutions, resulting in different numbers of clusters. (C) Volcano plots of DEGs between cells from control and cold-exposed mice for the three ASC subtypes. Numbers displayed on the plot are the number of genes with an adjusted p-value less than 0.05 and the absolute value of the fold change greater than 0.5.
Figure 3
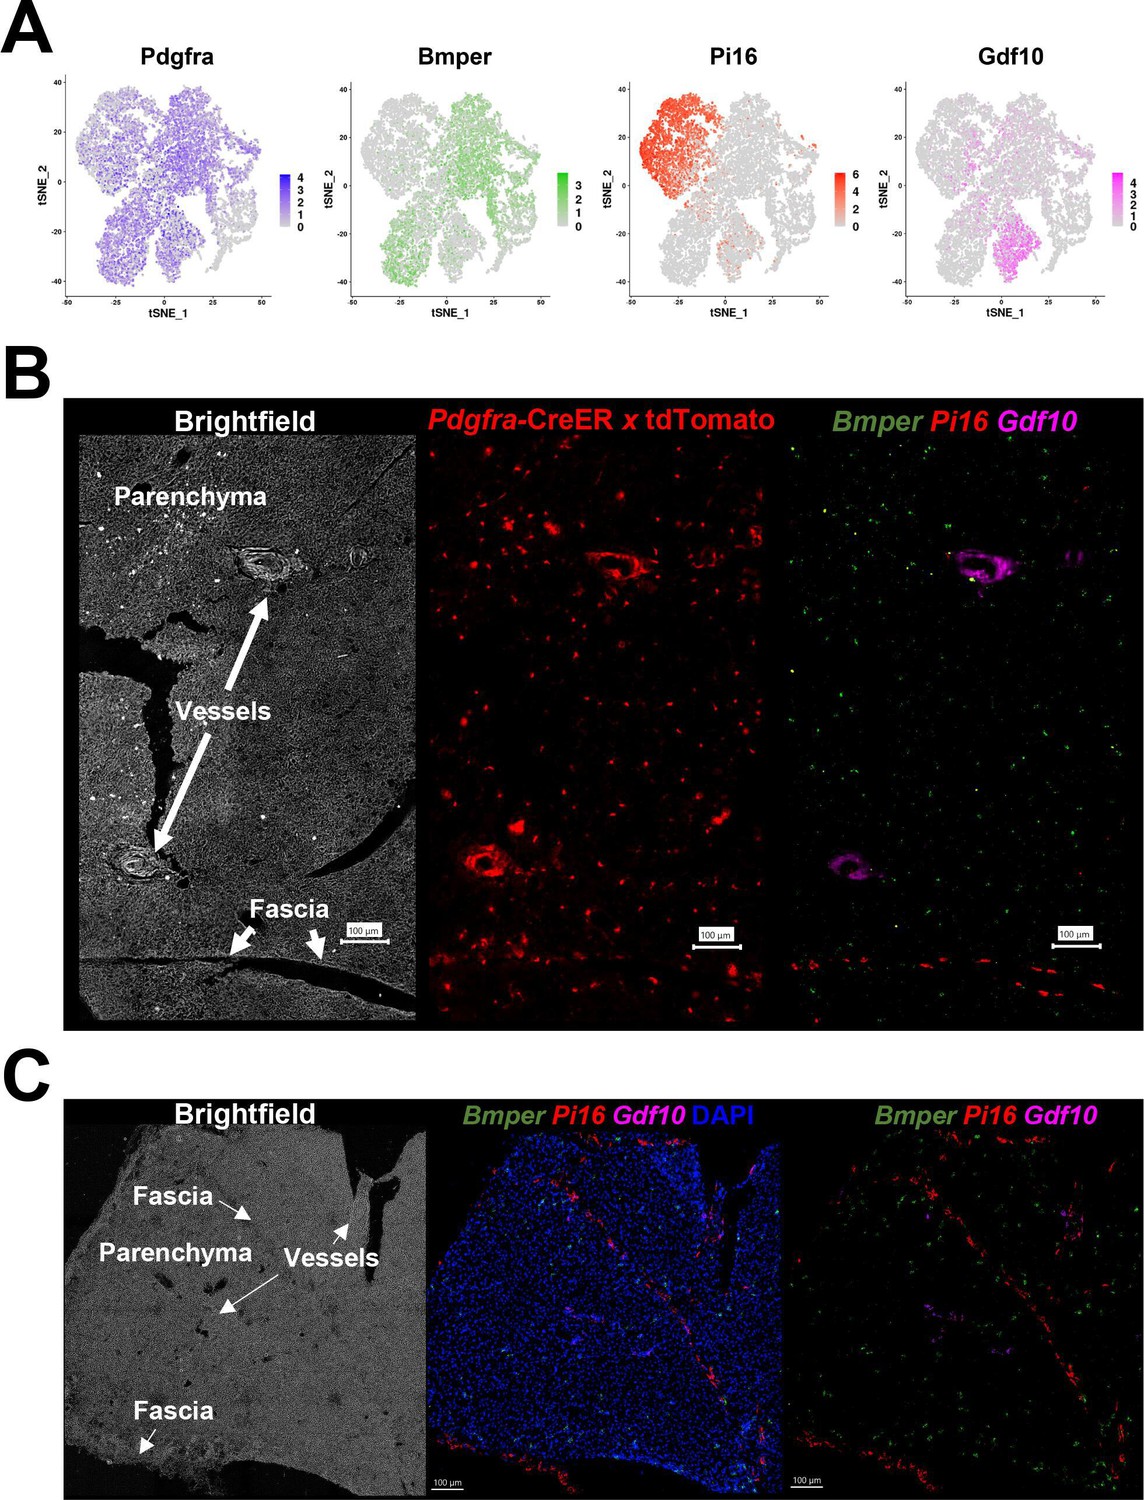
Pdgfra+ ASC subtypes occupy distinct areas of the tissue.
(A) t-SNE plot of log2 gene expression from Pdgfra genetic tracing and smFISH probes in scRNA-seq data. t-SNE plot is ASCs from iBAT of control and cold-exposed mice, as in Figure 2C. (B) Representative image of fixed frozen iBAT from Pdgfra-CreERT2 x LSL-tdTomato reporter mice. (Left) Brightfield image shows gross tissue structures, including the tissue fascia, parenchyma, and large vessels. (Center) TdTomato (red) native fluorescence. (Right) Tissue was bleached and stained with smFISH probes Bmper (green), Pi16 (red), and Gdf10 (pink). Bmper distinguishes ASC1, Pi16 ASC2, and Gdf10 ASC3. Scale bar, 100 μm. (C) Representative images of control fixed frozen iBAT stained with smFISH probes Bmper (green), Pi16 (red), and Gdf10 (pink) taken at higher resolution. Associated brightfield image shows gross tissue structures. Nuclei were counterstained with DAPI. Scale bar, 100 μm.
Figure 4 with 1 supplement
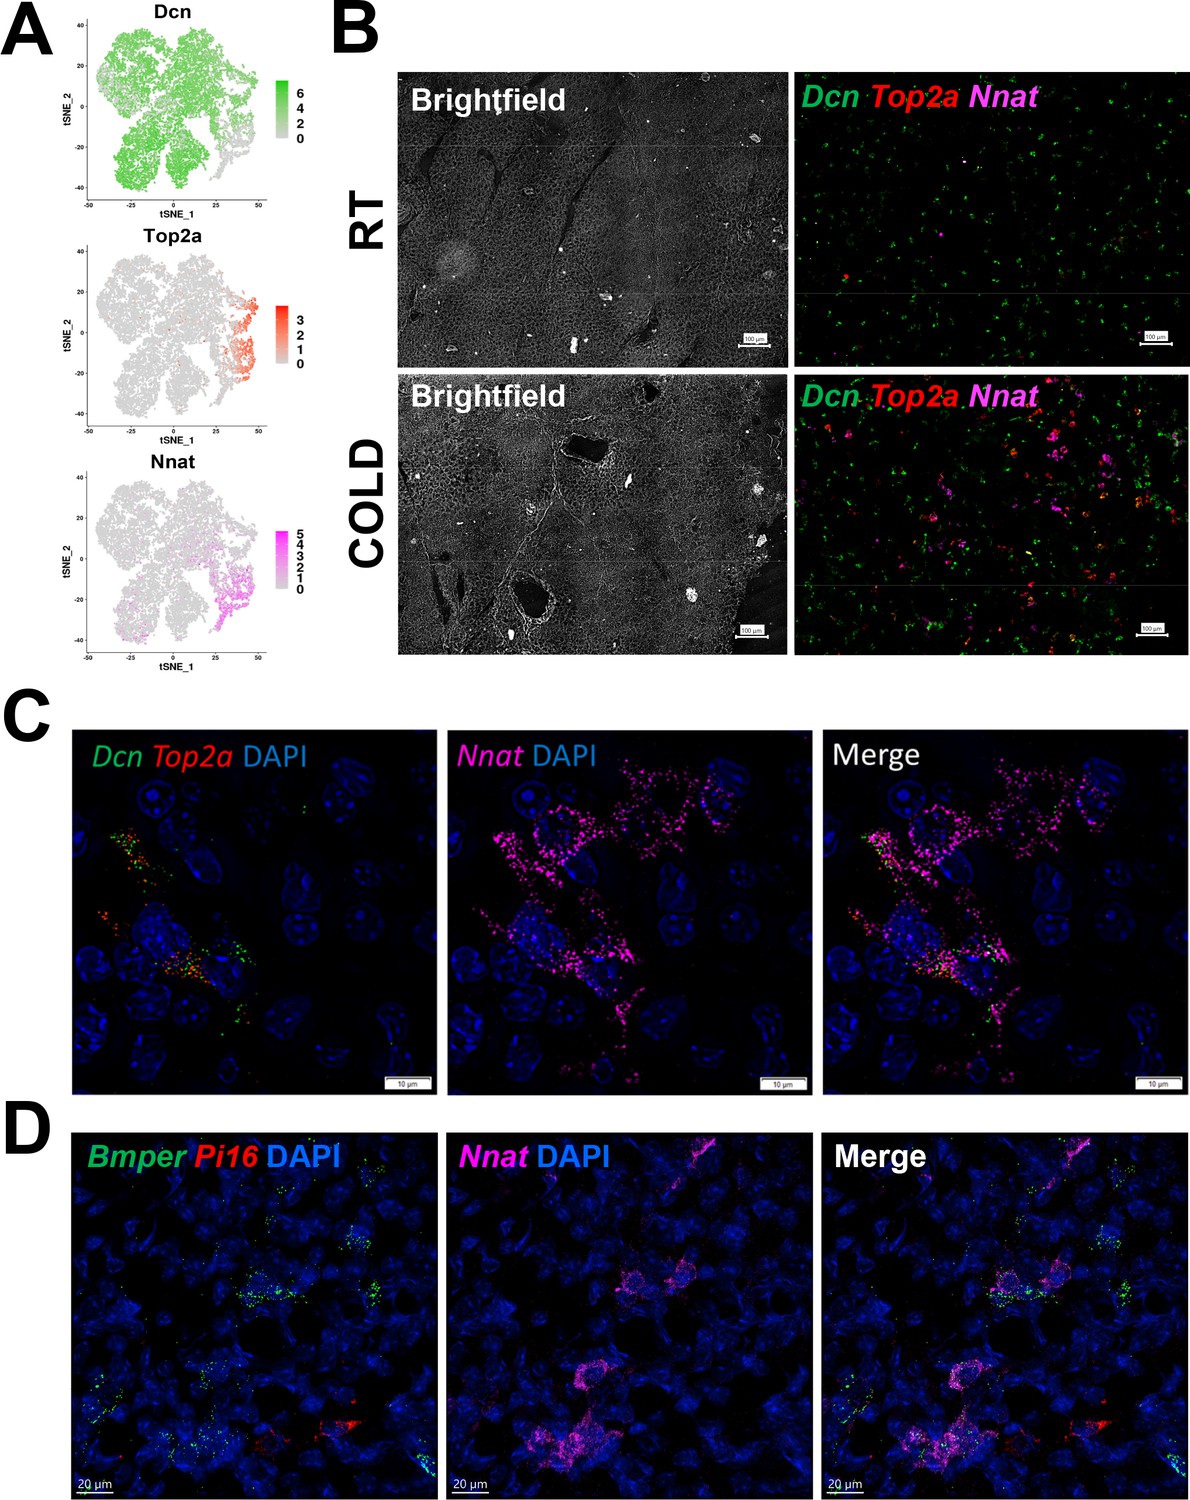
smFISH maps adipogenic trajectories and supports ASC1 as the direct precursors of new BA.
(A) t-SNE plot of log2 gene expression of smFISH probes in scRNA-seq data. t-SNE plot displays ASCs from iBAT of control and cold-exposed mice. (B) Representative low magnification images of fixed frozen iBAT stained with smFISH probes for Dcn (green), Top2a (red), and Nnat (pink). Tissue is from control and cold-exposed mice, as indicated. Associated brightfield image shows gross tissue structure. Scale bar, 100 μm. (C) High-magnification image of fixed frozen cold-exposed mouse iBAT stained with smFISH probes Dcn (green), Top2a (red), and Nnat (pink). Nuclei were counterstained with DAPI. Scale bar, 10 μm. (D) High-magnification image of fixed frozen cold-exposed mouse iBAT stained with smFISH probes Bmper (green), Pi16 (red), and Nnat (pink). Nuclei were counterstained with DAPI. Scale bar, 20 μm.
Figure 4—figure supplement 1
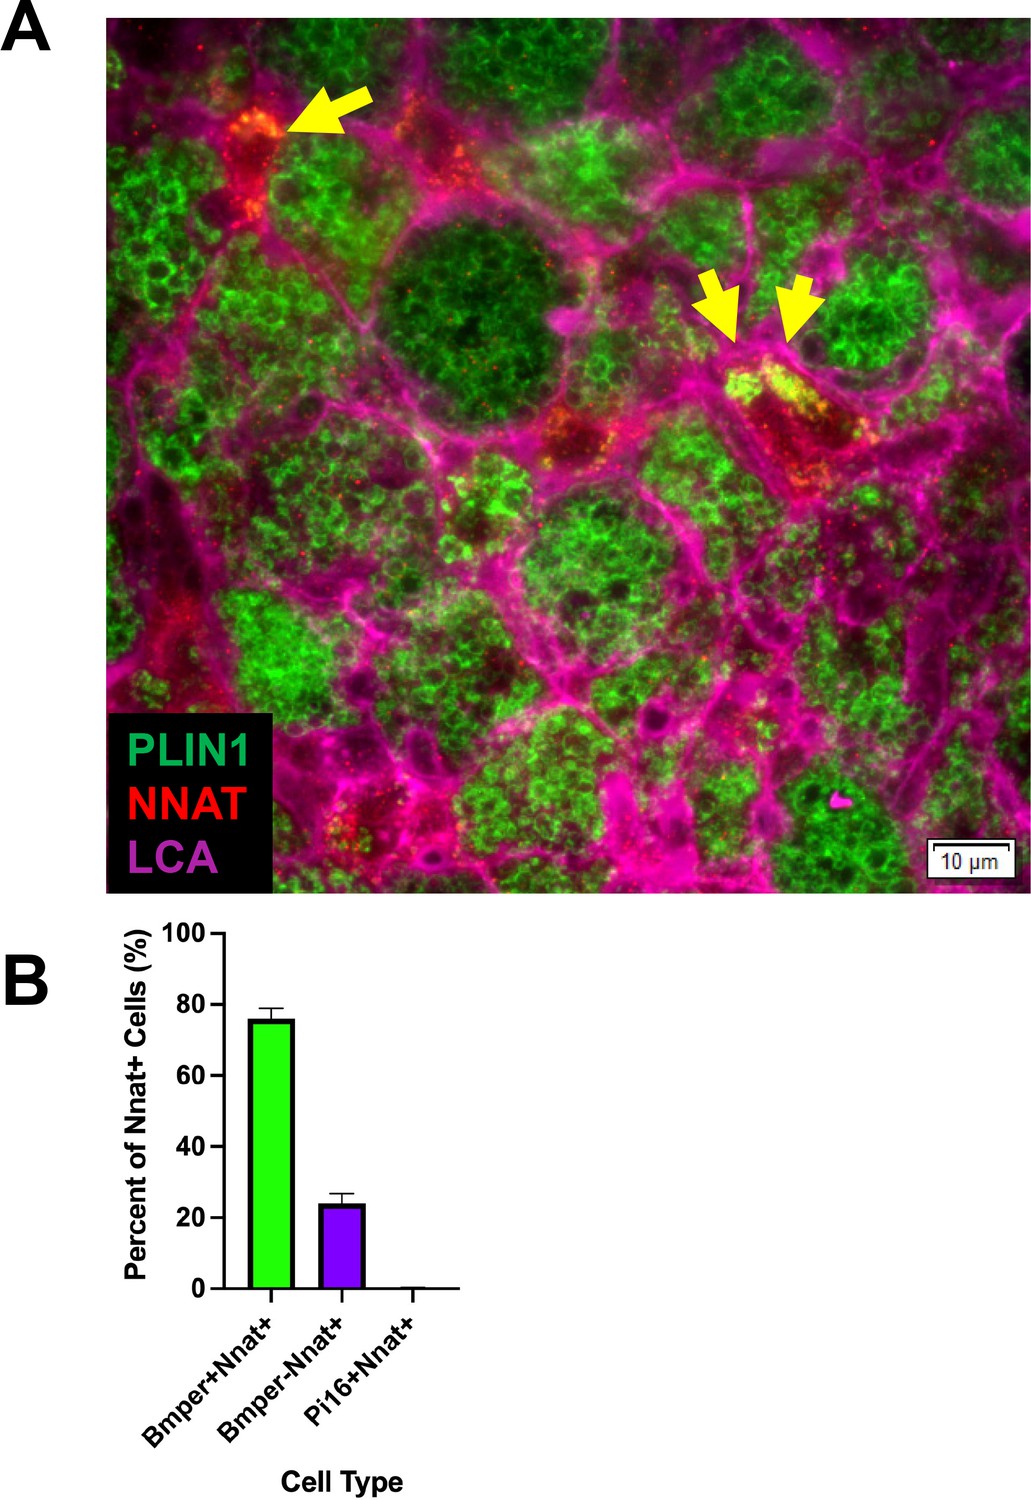
Immunohistochemistry identified newly differentiating ASCs that are NNAT and PLIN1 positive.
Related to Figure 4. (A) Representative image of fixed frozen iBAT from cold-exposed mice stained with the antibodies PLIN1 (green), NNAT (red), and LCA (pink). Arrows identify PLIN1+ NNAT+ cells. Scale bar, 10 μm. (B) Quantification of the co-expression of smFISH probe Nnat with probes for Bmper and Pi16 (n=3 animals; mean ± SD). See also Figure 4—figure supplement 1—source data 1.
-
Figure 4—figure supplement 1—source data 1
Quantification of co-expression of the smFISH probe Nnat with probes for Bmper and Pi16 (n=3 animals).
- https://cdn.elifesciences.org/articles/80167/elife-80167-fig4-figsupp1-data1-v2.xlsx
Figure 5 with 1 supplement
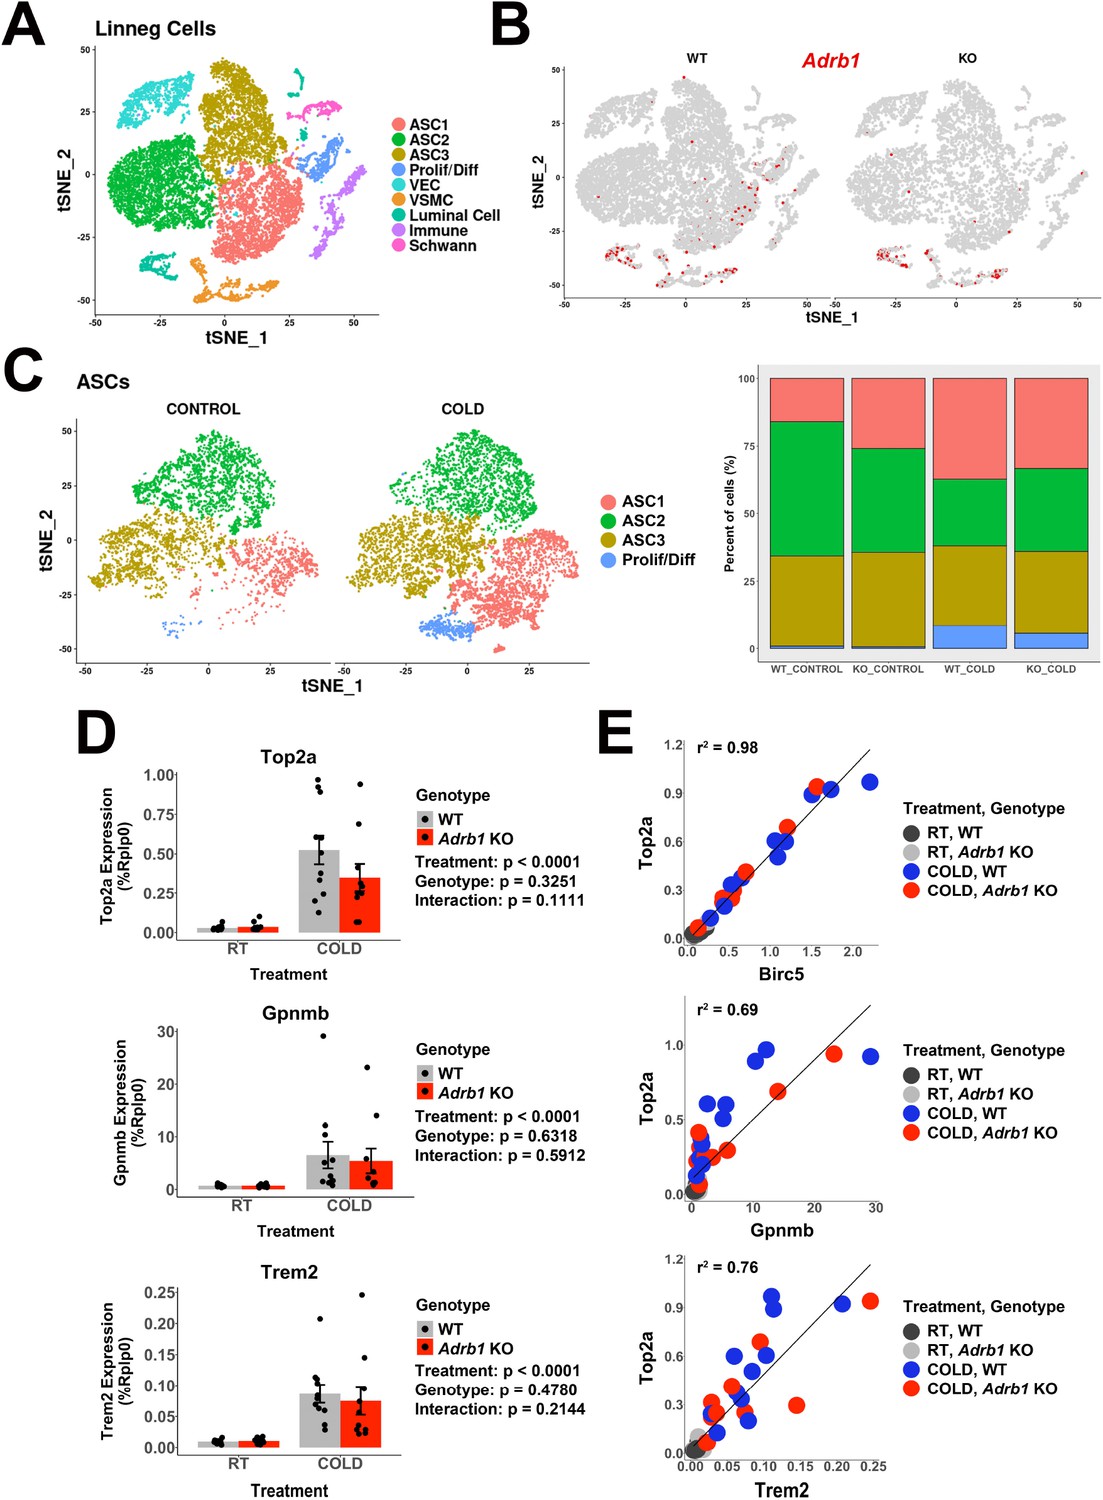
Adrb1 is dispensable for cold-induced brown adipocyte neogeneisis.
Related to Table 1A. (A) t-SNE plot of 18,332 Lin- cells from iBAT of WT (Adrb1fl/fl) or Adrb1 KO mice, either housed at room temperature or exposed to cold for 4 days. Clustering identified 9 cell types. ASC, adipose tissue stromal cell; VEC, vascular endothelial cell; VSMC, vascular smooth muscle cells; Prolif/Diff, proliferating/differentiating cells. DEGs that define these clusters are in Supplementary file 3. (B) t-SNE plot from (A), split into cells from WT or Adrb1 KO animals. Colored cells have Adrb1 expression > 0. (C) ASCs and Prolif/Diff cells from (A) reclustered, and split into cells from control or cold-exposed libraries. The bar graph shows the proportion of each cell type in the in the individual libraries. DEGs that define these clusters are in Supplementary file 4. (D) Quantitative PCR analysis of proliferation and immune cell activation genes in iBAT of WT or Adrb1 KO mice maintained at room temperature or exposed to cold for four days (n=10–11 per condition; mean ± SE). p-values are from two-way ANOVA analysis of log transformed data. (C) Correlation of specific genes in the quantitative PCR data with Top2a expression by individual animal. r2 values are displayed on the plot. See also Figure 5—source data 1.
-
Figure 5—source data 1
Quantitative PCR analysis of proliferation and immune cell activation genes in iBAT of WT or Adrb1 KO mice maintained at room temperature or exposed to cold for 4 days (n=10–11 animals per condition).
Figure 5—figure supplement 1—source data 1. Quantification of the number of Adrb1 molecules in Nnat+ cells between WT and Adrb1 KO samples.
- https://cdn.elifesciences.org/articles/80167/elife-80167-fig5-data1-v2.xlsx
Figure 5—figure supplement 1
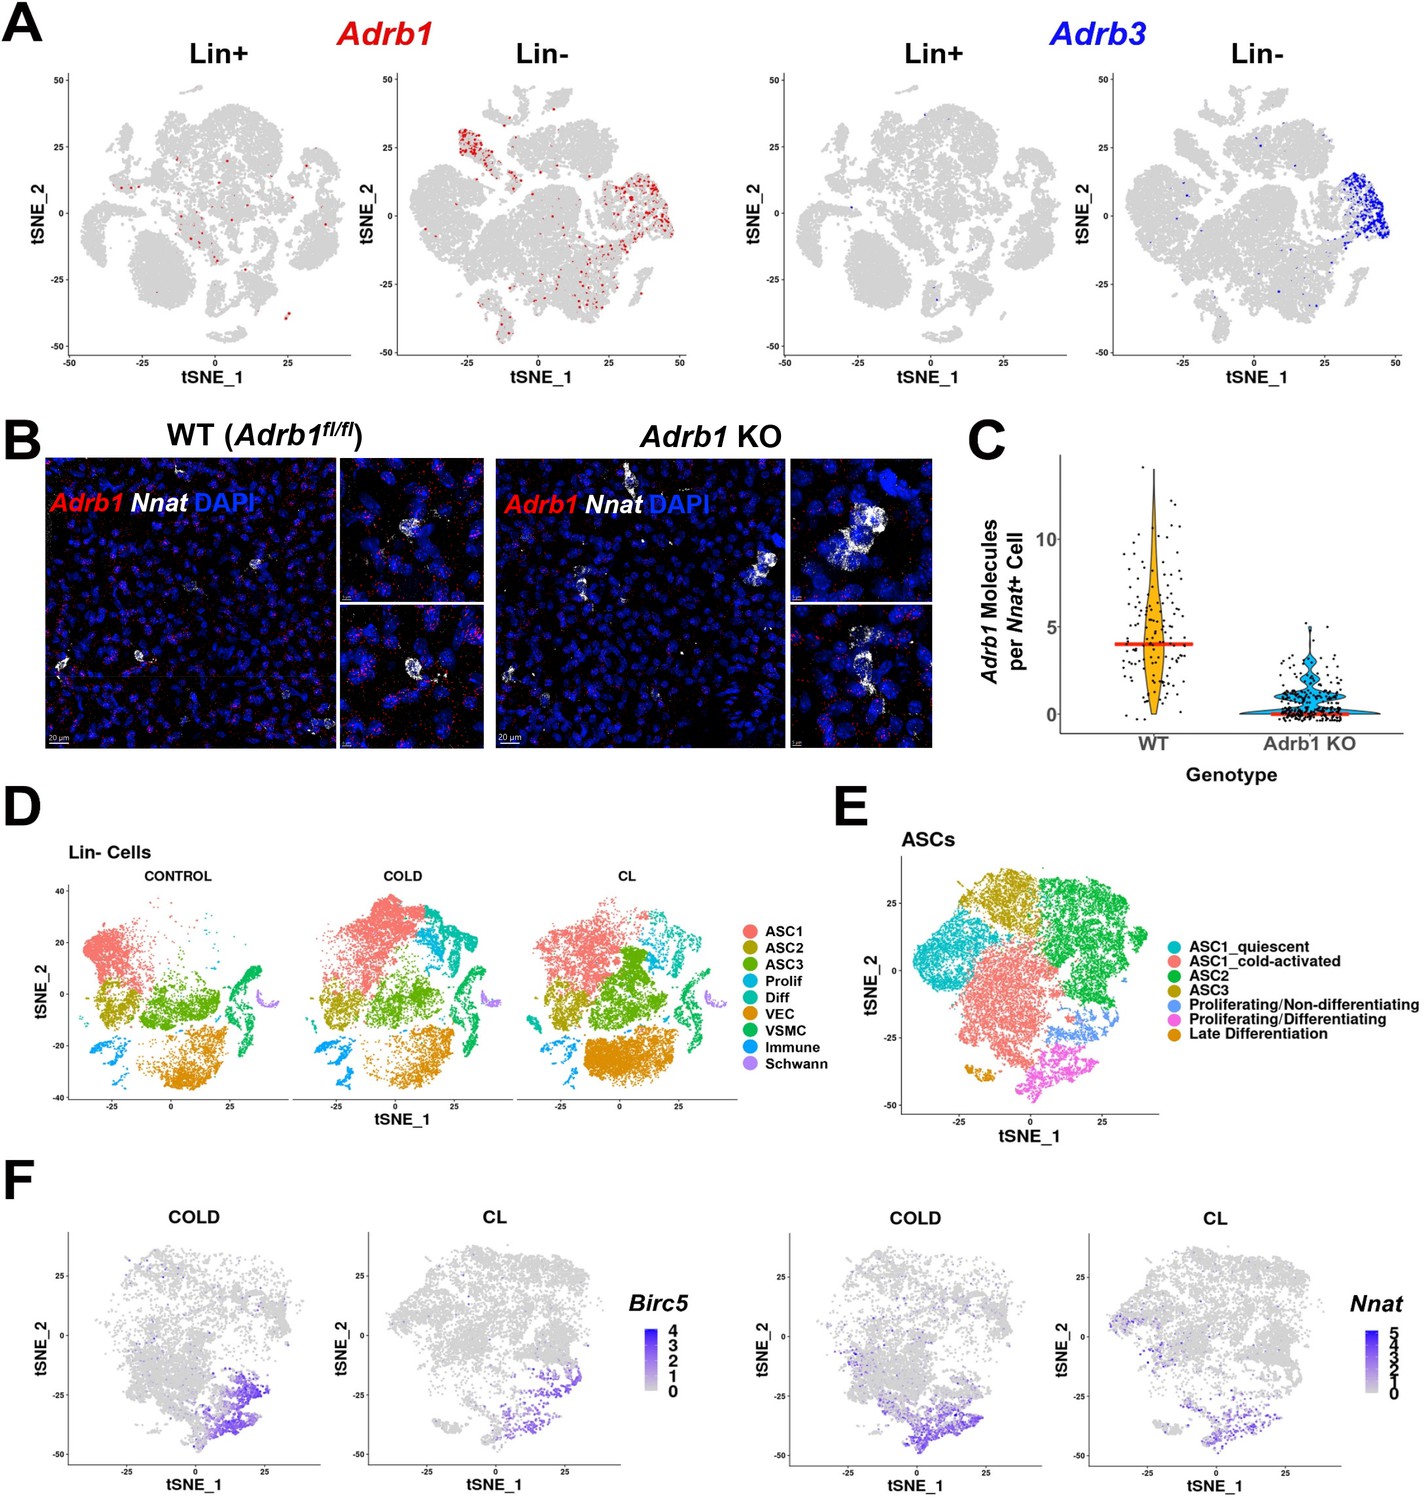
Role of ADRB subtypes in cold-induced iBAT neogenesis.
(A) Adrb1 (left) and Adrb3 (right) expression in Lin+ and Lin- scRNA-seq libraries from WT control and cold-exposed animals. Colors indicate cells with log2 expression > 0. tSNE plots with cell identities are presented in Figure 2A (Lin-) and Figure 6A (Lin+). (B) Related to Figure 5. Representative images of iBAT fixed-frozen sections from WT or Adrb1 KO mice stained with smFISH probes for Adrb1 (red) and Nnat (white). Nuclei were counterstained with DAPI. Scale bar, 20 μm and 5 μm. (C) Quantification of the number of Adrb1 molecules in Nnat+ cells between Adrb1 WT and Adrb1 KO samples (n=2 animals per condition; red line is the median of the data). (D–F) Related to Table 1B. (D) t-SNE plot of Lin- data from control, cold-exposed, and CL-treated mice. DEGs that define these clusters are in Supplementary file 5. (E) ASCs and Prolif/Diff cells from (D) reclustered. DEGs that define these clusters are in Supplementary file 6. (F) t-SNE plots displaying the log2 expression levels for proliferation marker Birc5 and adipogenic differentiation marker Nnat. See also Figure 5—figure supplement 1—source data 1.
-
Figure 5—figure supplement 1—source data 1
Quantification of the number of Adrb1 molecules in Nnat+ cells between WT and Adrb1 KO samples.
- https://cdn.elifesciences.org/articles/80167/elife-80167-fig5-figsupp1-data1-v2.xlsx
Figure 6 with 1 supplement
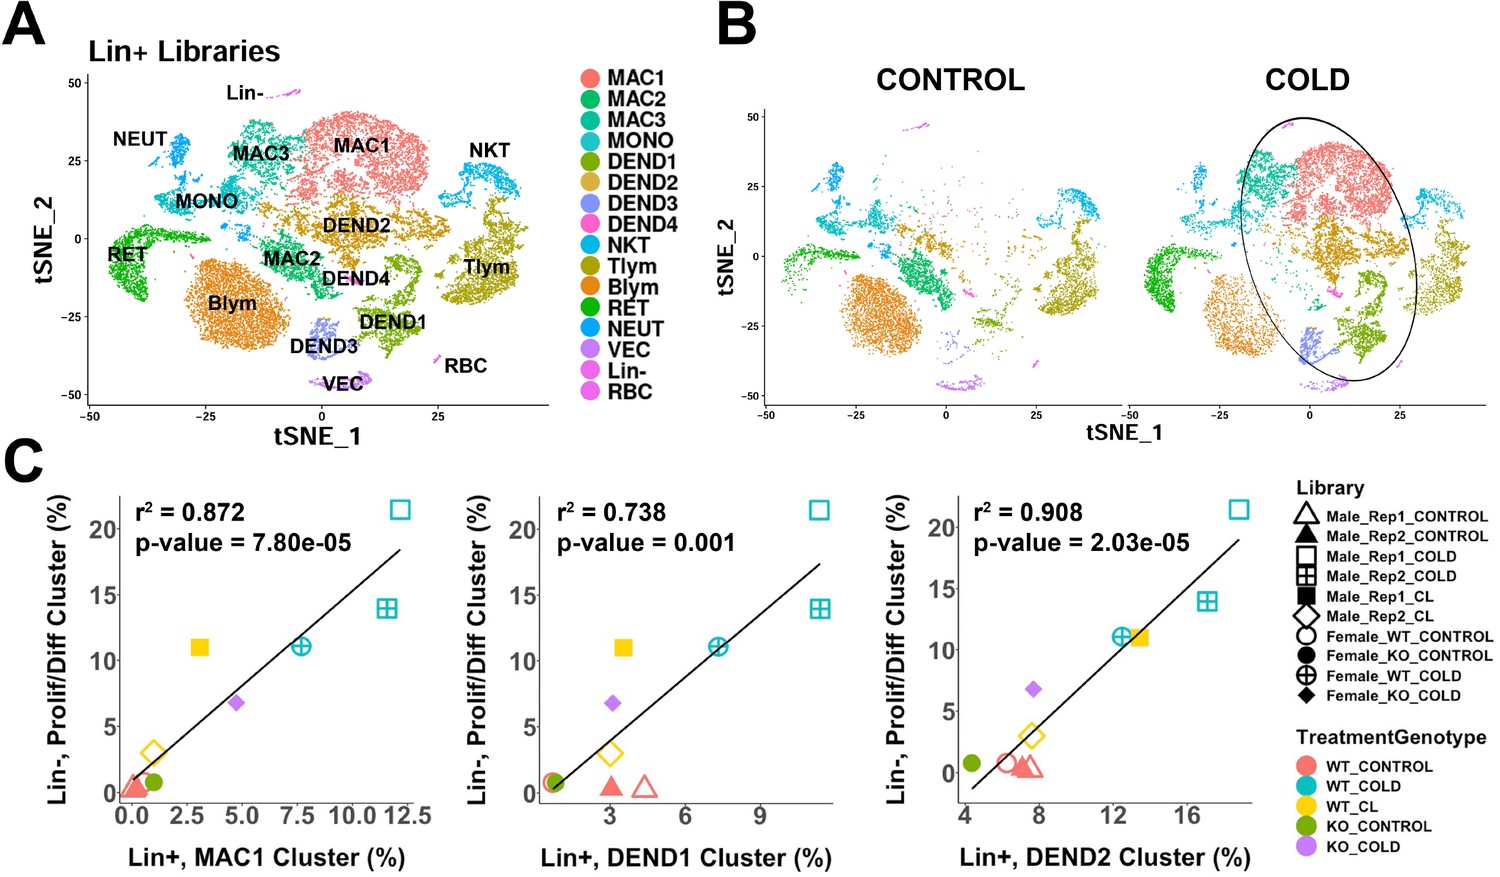
scRNA-seq analysis of Lin+ immune cells from iBAT of control or cold-exposed mice.
(A) t-SNE plot of 25,344 lineage marker positive (Lin+) cells from iBAT of control mice and mice exposed to cold for four days. Clustering applied to the t-SNE plot identified 16 clusters, highlighted in different colors. MAC, macrophage; MONO, monocyte; DEND, dendritic cell; NKT, natural killer T-cell; Tlym, T lymphocyte; Blym, B lymphocyte; RET, reticulocyte; NEUT, neutrophil; VEC, vascular endothelial cell; Lin-, lineage-negative cells; RBC, red blood cell. Cell types were determined by DEGs within each cluster. DEGs that define these clusters are in Supplementary file 7. (B) t-SNE plot from (A) split into the cells from control (CONTROL) and cold-exposed (COLD) mice. Circle highlights cold-induced cell clusters. (C) Lin+ or Lin- libraries from the 10 single-cell experiments presented in this paper were visualized and clustered in one t-SNE plot and the proportion of each immune cell cluster in the Lin+ libraries were correlated with the proportion of the proliferating/differentiating cluster in the Lin- libraries. Point shapes correspond to individual libraries. Point color corresponds to the combination of treatment (CONTROL, COLD, CL) and the genotype (WT, KO). r2 values and p-values are displayed on the plot. p-values were calculated using the Pearson’s product-moment correlation.
Figure 6—figure supplement 1
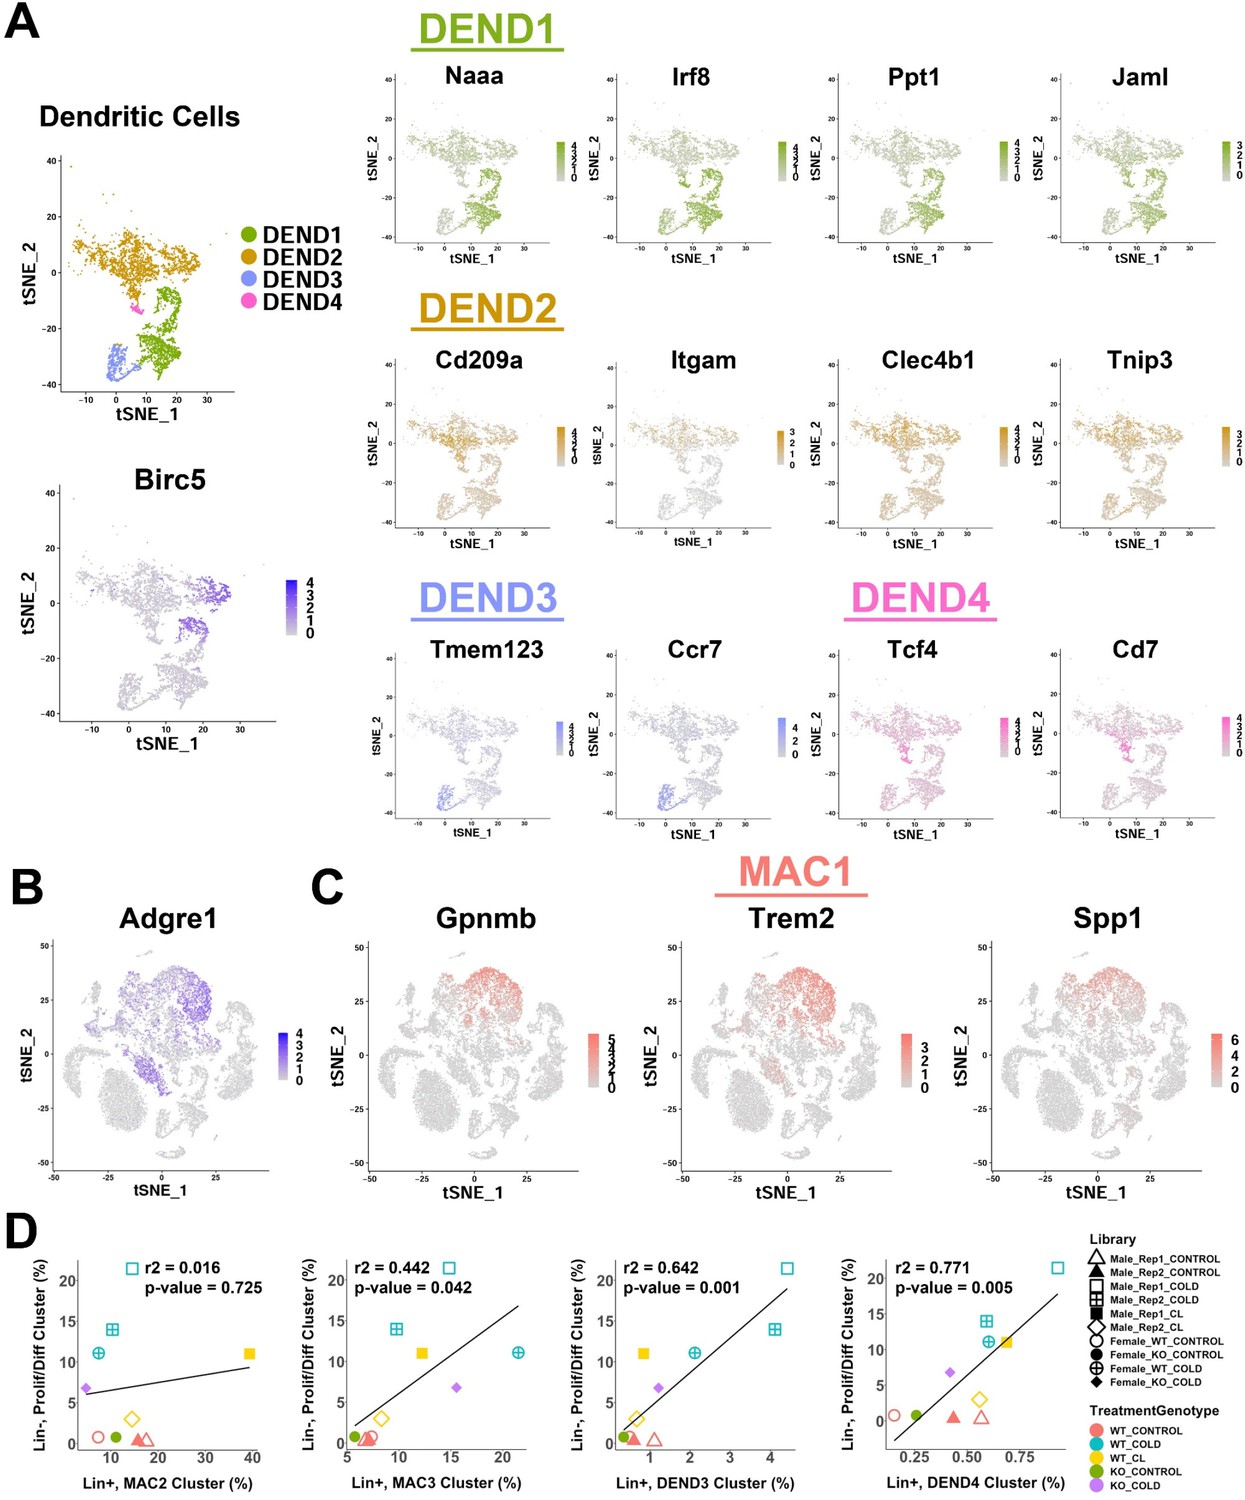
Analysis of gene expression markers from single-cell analysis of iBAT dendritic cells and lipid-handling macrophages.
Related to Figure 6. (A) t-SNE plot of dendritic cell clusters from Figure 6A (top left), along with a t-SNE plot displaying the log2 expression levels of proliferation marker Birc5 (bottom left). Additionally, t-SNE plots displaying the log2 expression levels for genes that define each dendritic cell cluster. (B) t-SNE plot displaying the log2 expression level of Adgre1 (F4/80). (C) t-SNE plots displaying the log2 expression levels for genes that define cluster MAC1. (D) Correlation of remaining immune cell clusters with proliferating/differentiating cells across all single-cell libraries. r2 values and p-values are displayed on the plot. p-values were calculated using the Pearson’s product-moment correlation.
Figure 7 with 1 supplement
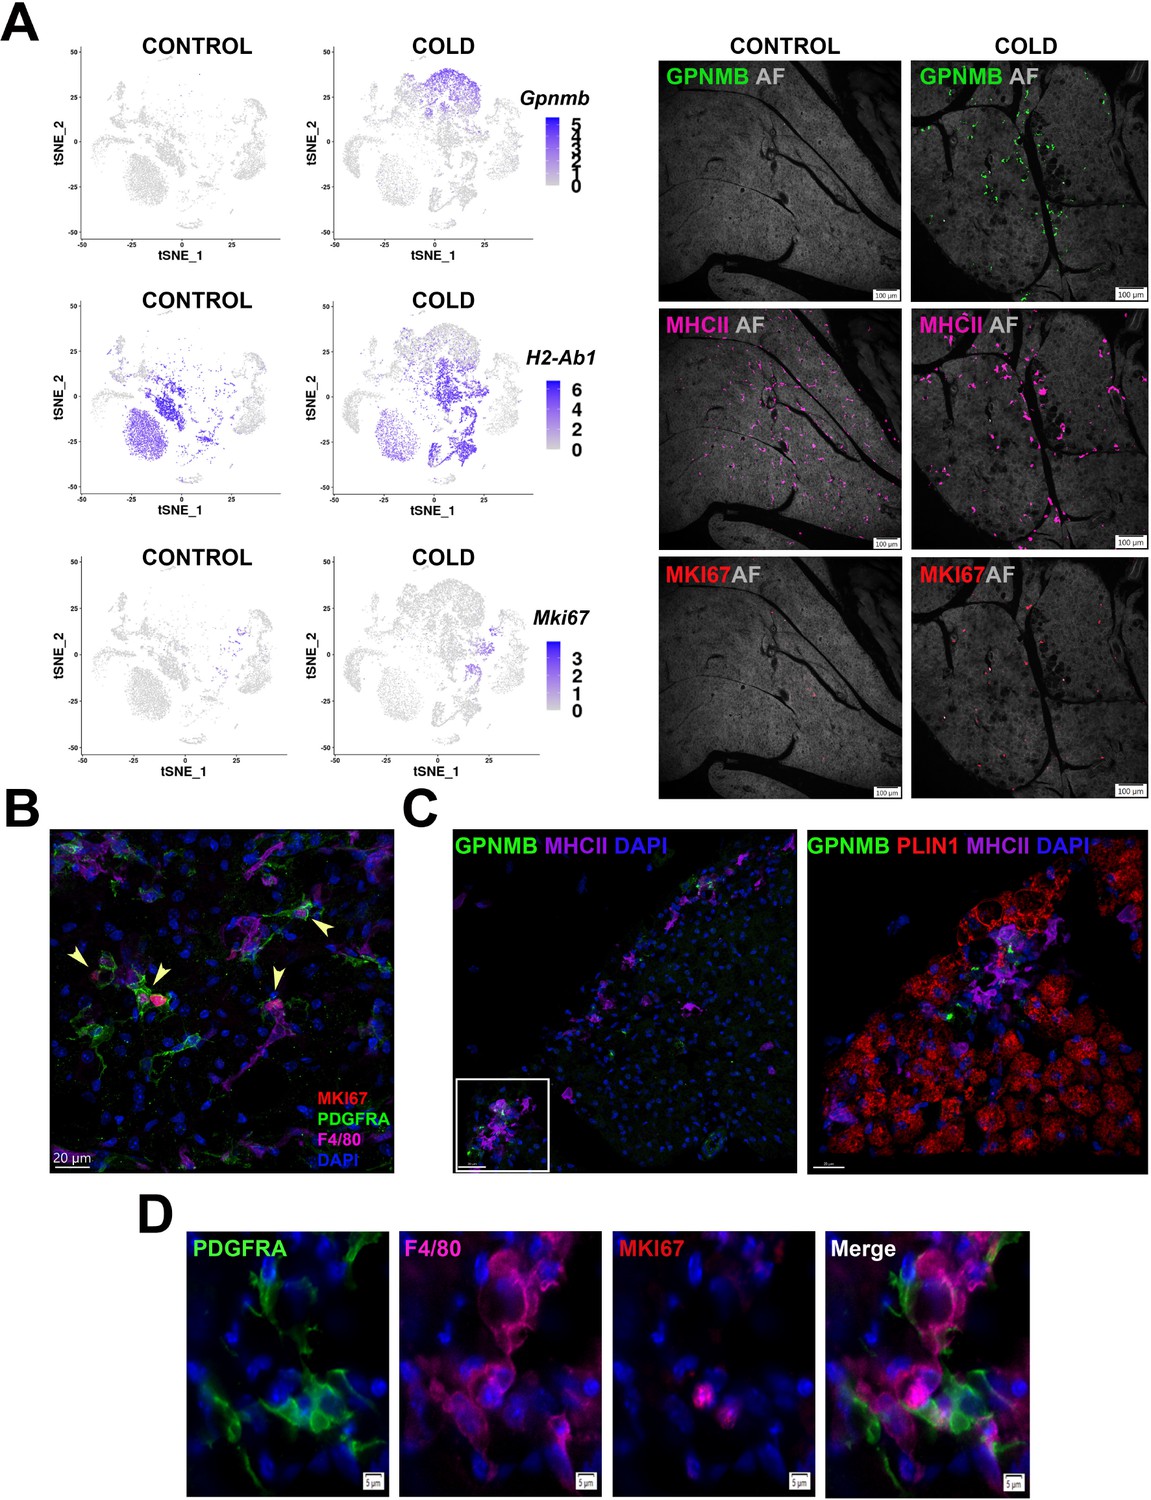
Cold-induced iBAT neogenesis involves close interaction between immune cells and proliferating ASCs.
(A) Low-magnification images of iBAT fixed-frozen sections from control and cold-exposed mice stained for GPNMB (green), MHCII (pink), and MKI67 (red), along with their corresponding log2 gene expression in Lin+ scRNA-seq data. Lin+ t-SNE plots were split between cells from control and cold-exposed mice. Tissue images for antibody staining show the same tissue area for each treatment. Background for each image is autofluorescence (AF) in grey scale. Scale bar, 100 μm. (B) iBAT fixed-frozen sections from cold-exposed mice stained with antibodies for MKI67 (red), PDGFRA (green), and F4/80 (pink). Nuclei were counterstained with DAPI. Arrows indicate PDGFRA+ MKI67+ cells. Scale bar, 20 μm. 3D rendering presented in Appendix 1—Video 1. (C) iBAT fixed-frozen sections from cold-exposed mice. Left image displays antibody staining for GPNMB (green) and MHCII (purple). Right image is a magnified view of the boxed region from left, displaying staining for GPNMB (green), PLIN1 (red), and MHCII (purple). Nuclei were counterstained with DAPI. Scale bars, 30 μm and 20 μm. 3D rendering presented in Appendix 1—Video 2. (D) iBAT fixed-frozen sections from cold-exposed mice stained for PDGFRA (green), F4/80 (pink), and MKI67 (red). Nuclei were counterstained with DAPI. Scale bar, 5 μm.
Figure 7—figure supplement 1
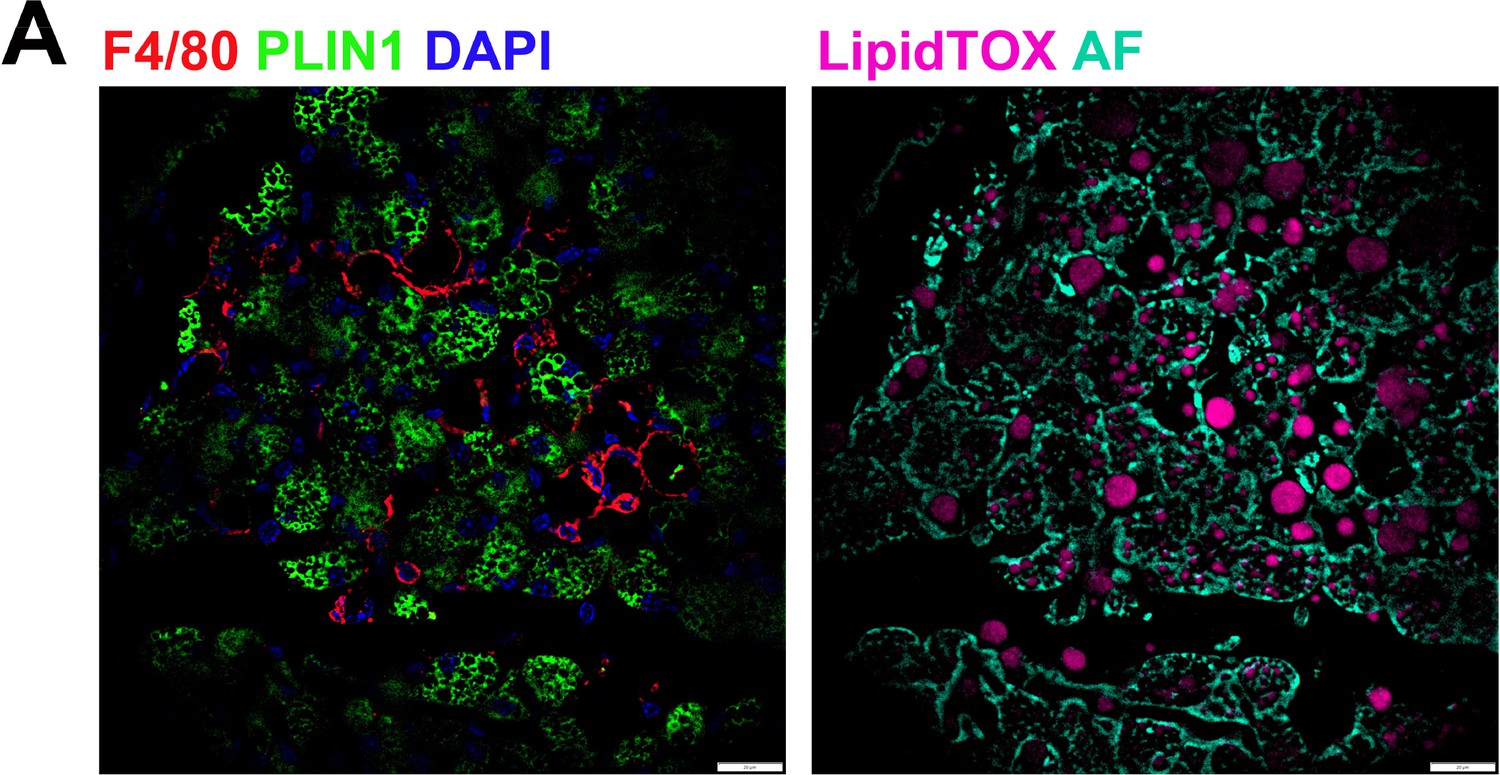
Macrophages surround cellular vacancies containing lipid remnants.
(A) iBAT fixed-frozen sections from cold-exposed mice. Both images show the same tissue area. Left image displays antibody staining for F4/80 (red) and PLIN1(green). Nuclei were counterstained with DAPI. Right image displays lipid staining (LipidTOX, pink) and cellular autofluorescence (AF, cyan). Scale bar, 20 μm.
Figure 8 with 1 supplement

ASCs and immune cells comprise a dynamic cellular niche.
(A, top) Representative images of fixed frozen mouse cold-exposed iBAT. Tissue was stained with smFISH probes Dcn (green), H2-Ab1 (red), and Top2a (pink). Nuclei were counterstained with DAPI. Images on the right are a magnified view of the boxed regions on the left. Scale bars, 40 μm and 5 μm. (A, bottom) Quantification of cell types within 20 μm around either an H2-Ab1+ cell or a Dcn+ Top2a+ cell (n=3 animals; >100 cells/mouse; mean ± SD). (B) Representative images of fixed frozen mouse cold-exposed iBAT. Tissue was stained with smFISH probes Dcn (green), H2-Ab1 (red), and Nnat (pink). Nuclei were counterstained with DAPI. Images on the right are a magnified view of the boxed regions on the left. Scale bars, 40 μm and 5 μm. (B, bottom) Quantification of cell types within 20 μm around either an H2-Ab1+ cell or a Nnat+ cell (n=3 mice; >100 cells/mouse; mean ± SD). See also Figure 8—source data 1, Figure 8—source data 2.
-
Figure 8—source data 1
Quantification of the nearest neighbor (20 µM) to either a H2-Ab1+, Dcn+, or Dcn+ Top2a+ cell in the iBAT of cold-exposed mice.
- https://cdn.elifesciences.org/articles/80167/elife-80167-fig8-data1-v2.xlsx
-
Figure 8—source data 2
Quantification of the nearest neighbor (20 µM) to either a H2-Ab1+, Dcn+, or Nnat+ cell in the iBAT of cold-exposed mice.
- https://cdn.elifesciences.org/articles/80167/elife-80167-fig8-data2-v2.xlsx
Figure 8—figure supplement 1
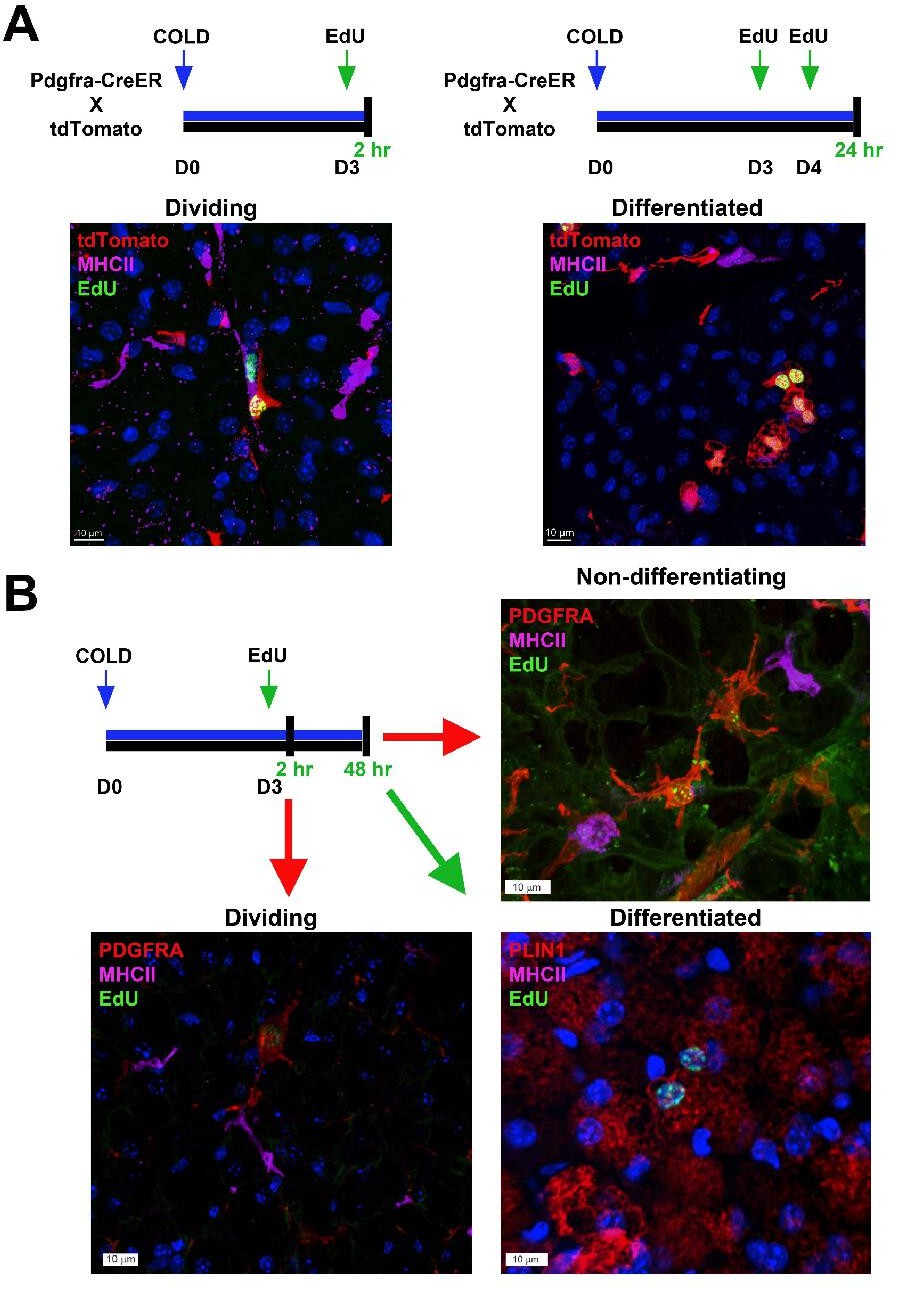
Flash-labeling of proliferating cells and proximity of MHCII+ dendritic cells.
(A, top) Procedure for EdU labeling to trace dividing ASCs and differentiated adipocytes. Pdgfra-CreERT2 x LSL-tdTomato were used for genetic tracing of PDGFRA+ cells. Seven days after induction with tamoxifen, animals were housed in the cold for up to 5 days. For dividing ASCs, on the third day, animals were injected with EdU and sacrificed 2 hr later. For differentiated adipocytes, animals were injected with EdU on days 3 and 4 of cold exposure and sacrificed on day 5. (A, bottom) Representative images from iBAT for the experiments outlined, where tissue was stained with EdU (green) or MHCII (pink). tdTomato (red) was detected by native fluorescence. Nuclei were counterstained with DAPI. Scale bar, 10 μm. (B) Alternatively, C57 mice were exposed to cold for up to 5 days. EdU was injected on day three and animals were sacrificed two hours or 2 days after EdU injection. Representative images of iBAT harvested from mice at the indicated times. Tissue was stained with either PDGFRA (red), MHCII (pink), and EdU (green) or PLIN1 (red), MHCII (pink), and EdU (green). Nuclei were counterstained with DAPI.
Figure 9

scRNA-seq data reveal potential ligand-receptor pairs for ASC-immune cell crosstalk.
(A) Circos plots of ligand-receptor pairs, where cold-activated ASC1 cells expressed the receptor and dendritic cells and/or macrophages expressed the ligand. Ligand-receptor pairs were identified from the computational programs CellPhoneDB and NicheNet, and additional ligand-receptor databases. Phenotype specificity was confirmed using expression patterns in t-SNE plots. (B) t-SNE plots displaying the log2 expression pattern levels for Adam12 corresponding to Lin- data (Figure 2A), Lin+ data (Figure 6A), and ASC re-clustered data (Figure 2C), respectively.
Figure 10

Schematic demonstrating adaptation to cold-induced stress in brown adipose tissue (non-shivering thermogenesis).
Under steady state conditions, the capacity for thermogenesis is in equilibrium with the demand for thermoregulation. As the demand for heat production increases (i.e. cold exposure) BAT can increase thermogenic capacity (upregulate UCP1, mitochondrial content); however, continued cold exposure exceeds the capacity of existing adipocytes (non-shivering thermogenesis) and muscle (shivering thermogenesis) to regulate body temperature, resulting in brown adipocyte niche formation and neogenesis until a new steady state level is reached.
Videos
Appendix 1—video 1
Video showing 3D detail of Figure 7B.
High-magnification movie of iBAT fixed-frozen tissue section from cold-exposed mice stained for PDGFRA (green), F4/80 (purple), and MKI67 (red). Nuclei were counterstained with DAPI. Video shows sequential addition of the following elements: (1) distribution of cell nuclei stained with DAPI, (2) proliferating (MKI67, red) PDGFRA+ progenitors (green), (3) F4/80+ dendritic cells (pink). Note that the cellular processes of each proliferating PDGFRA+ progenitor (yellow arrow heads in Figure 7B) extends toward, and makes apparent contact with F4/80 dendritic cells.
Appendix 1—video 2
High-magnification movie of iBAT fixed-frozen tissue section from cold-exposed mice stained for GPNMB (green), MHCII (purple), and PLIN1 (red).
Nuclei were counterstained with DAPI. Video shows sequential addition of the following elements: (1) image with immune marker channels turned off to show the outline of the effercytosis site (ES). (2) GPNMB+ cells (green) in the ES. (3) MHCII+ cells (purple) in the ES. Note that both GPNMB+ cells and MHCII+ cells surround cellular vacancies.
Tables
Table 1
Analysis of β-adrenergic receptor manipulation by scRNA-seq.
(A) Cell counts and calculated percentages for proliferating/differentiating cells (Prolif/Diff) and ASCs in the Adrb1 KO single-cell libraries. p-values were calculated by chi-squared analysis between CONTROL and COLD libraries for the two genotypes. ***p<1E-5. (B) Cell counts and calculated percentages for Prolif/Diff cells and ASCs in the CONTROL and CL-treated single-cell libraries. p-values were calculated by chi-squared analysis between CONTROL and CL libraries. ***p<1E-5.
| A | Library | Number ofProlif/Diff Cells | Number ofASCs | Percent of Prolif/Diff Cells out of Total ASCs (%) |
|---|---|---|---|---|
| CONTROL, WT | 31 | 3,695 | 0.84 | |
| COLD, WT | 437 | 5,118 | 8.54*** | |
| CONTROL, Adrb1 KO | 9 | 1,543 | 0.58 | |
| COLD, Adrb1 KO | 171 | 3,063 | 5.58*** | |
| B | Library | Number ofProlif/Diff Cells | Number of ASCs | Percent of Prolif/Diff Cells out of Total ASCs (%) |
| CONTROL | 38 | 7,234 | 0.53 | |
| CL | 1,526 | 11,275 | 13.5*** |
Key resources table
| Reagent type (species) or resource | Designation | Source or reference | Identifiers | Additional information |
|---|---|---|---|---|
| Antibody | Anti-PDGFRalpha antibody (goat polyclonal) | R&D Systems | Mouse PDGFRalpha antibody; cat no. AF1062 | Diluted 1:70 in blocking buffer. |
| Antibody | Anti-GPNMB antibody (goat polyclonal) | R&D Systems | Mouse osteoactivin/GPNMB antibody; cat no. AF2330 | Dilute 1:400 in blocking buffer. |
| Antibody | Anti-MHCII antibody (rat monoclonal) | Biolegend | Alexa Fluor 647 rat anti-mouse I-A/I-E antibody; cat no. 107617 | Diluted 1:100 in blocking buffer. |
| Antibody | Anti-MKI67 antibody (rabbit monoclonal) | Invitrogen | Ki-67 recombinant rabbit monoclonal antibody; cat no. MAS-14520 | Diluted 1:125 in blocking buffer. |
| Antibody | Anti-PLIN1 antibody (goat polyclonal) | Everest Biotech | Goat anti-perilipin 1 (C terminus) antibody; cat no. EB07728 | Diluted 1:200 in blocking buffer. |
| Antibody | Anti-F4/80 antibody (rat monoclonal) | Bio-Rad | rat anti mouse F4/80 antibody; cat no. MCA497GA | Diluted 1:125 in blocking buffer. |
| Antibody | Anti-NNAT antibody (rabbit polyclonal) | Abcam | Anti-Neuronatin antibody; ab27266 | Diluted 1:400 in blocking buffer. |
| Antibody | Anti-IgG Alexa Fluor 647 (donkey polyclonal) | Abcam | Donkey anti-rat secondary antibody; cat no. ab150155 | Diluted 1:250 in blocking buffer. |
| Antibody | Anti-IgG Alexa Fluor 568 (donkey polyclonal) | Invitrogen | Donkey anti-goat secondary antibody; cat no. A11057 | Diluted 1:250 in blocking buffer. |
| Antibody | Anti-IgG Alexa Fluor 488 (donkey polyclonal) | Invitrogen | Donkey anti-goat secondary antibody; cat no. A11055 | Diluted 1:250 in blocking buffer. |
| Antibody | Anti-IgG Alexa Fluor 647 (donkey polyclonal) | Invitrogen | Donkey anti-goat secondary antibody; cat no. A21447 | Diluted 1:250 in blocking buffer. |
| Antibody | Anti-IgG Alexa Fluor 594 (donkey polyclonal) | Invitrogen | Donkey anti-rabbit secondary antibody; cat no. A21207 | Diluted 1:250 in blocking buffer. |
| Antibody | Anti-IgG Alexa Fluor 594 (goat polyclonal) | Invitrogen | Goat anti-rat secondary antibody; cat no. A11007 | Diluted 1:250 in blocking buffer. |
| Chemical compound, drug | EdU | Invitrogen | 5-Ethynyl-2‘-deoxyuridine; cat no. A10044 | Diluted in sterile PBS. |
| Chemical compound, drug | Tamoxifen | Cayman Chemical | Tamoxifen; cat no. 13258 | Diluted in corn oil. |
| Chemical compound, drug | CL316,243 | Sigma-Aldrich | C5976 | |
| Chemical compound, drug | Paraformaldehyde (PFA) | Electron Microscopy Sciences | Paraformaldehyde 16% Solution, EM Grade; cat no. 15710 | Dilute to 4% PFA in PBS. |
| Chemical compound, drug | Sucrose | Fisher Scientific | D-Sucrose; cat no. BP220-1 | |
| Chemical compound, drug | O.C.T Compound | Fisher Heathcare | Tissue Plus O.C.T. Compound Clear; cat no. 23-730-572 | |
| Chemical compound, drug | Triton X-100 | Sigma | Triton X-100 laboratory grade; cat no. X100-500ML | |
| Chemical compound, drug | ProLong Gold antifade reagent | Invitrogen | ProLong Gold antifade reagent; cat no. P36930 | Coverslip mounting media |
| Chemical compound, drug | Collagenase Type 2 | Worthington Biochemical Corporation | Collagenase Type 2; cat no. LS004177 | Tissue digestion reagent |
| Chemical compound, drug | HBSS | Sigma-Aldrich | Hanks' Balanced Salt Solution; cat no. H1387−10 × 1 L | Tissue digestion reagent |
| Chemical compound, drug | HEPES | Sigma-Aldrich | cat no. H4034 | Tissue digestion reagent; FACs Buffer |
| Chemical compound, drug | Sodium Bicarbonate | Fisher Scientific | Sodium Bicarbonate (Powder/Certified ACS); cat no. S233-500 | Tissue digestion reagent; RBC lysis buffer |
| Chemical compound, drug | FF-BSA | Gemini Bio-products | Bovine Serum Albumin, Fatty Acid Free; cat no. 700–107 P | Tissue digestion reagent |
| Chemical compound, drug | EDTA | Millipore Sigma | Ethylenediaminetetraacetic acid (EDTA), Tetrasodium Tetrahydrate Salt; cat no. 13235-36-4 | Tissue digestion reagent; FACs Buffer |
| Chemical compound, drug | FBS | Atlanta Biologicals | Fetal Bovine Serum, Heat-inactivated; S11550H | FACs Buffer |
| Chemical compound, drug | Ammonium Chloride | Fisher Scientific | Ammonium Chloride (Crystalline/Certified ACS); cat no. A661-500 | RBC lysis buffer |
| Chemical compound, drug | TRIzol | Ambion by Life Technologies | TRIzol Reagent; cat no. 15596018 | |
| Chemical compound, drug | Dextran sulfate | Sigma-Aldrich | cat no. D8906 | |
| Commercial assay or kit | Click-iT EdU Cell Proliferation Kit for Imaging, Alexa Fluor 488 dye | Invitrogen | cat no. C10337 | |
| Commercial assay or kit | Debris Removal Solution | Miltenyi Biotec | cat no. 130-109-398 | |
| Commercial assay or kit | Lineage Cell Depletion Kit | Miltenyi Biotec | Lineage Cell Depletion Kit, mouse; cat no. 130-090-858 | |
| Commercial assay or kit | Chromium Single Cell 3’ Library & Gel Bead Kit v2 | 10X Genomics | cat no. 120237 | |
| Commercial assay or kit | Chromium Single Cell 3’ Library & Gel Bead Kit v3 | 10X Genomics | cat no. 1000092 | |
| Commercial assay or kit | Chromium Single Cell A Chip Kit | 10X Genomics | cat no. 120236 | |
| Commercial assay or kit | Chromium i7 Multiplex Kit | 10X Genomics | cat no. 120262 | |
| Commercial assay or kit | Bioanalyzer High Sensitivity DNA kit | Agilent Biotechnologies | 2,100 Bioanalyzer High Sensitivity DNA kit; cat no. 5067–4626 | |
| Commercial assay or kit | Direct-zol RNA Miniprep Kit | Zymo Research | cat no. R2050 | |
| Commercial assay or kit | High Sensitivity D1000 ScreenTape for DNA Analysis | Agilent Biotechnologies | cat no. NC1786959 | |
| Commercial assay or kit | QuantSeq 3' mRNA-Seq Library Prep Kit FWD for Illumina | Lexogen | cat no. 113.96 | |
| Commercial assay or kit | KAPA SYBR Fast Universal qPCR Kit – Illumina Kapa | Kapa Biosystems | cat no. 07960441001 | |
| Commercial assay or kit | High Capacity cDNA Reverse Transcription Kit | Applied biosystems | cat no. 4368814 | |
| Commercial assay or kit | DyNAmo HS SYBR Green qPCR Kit | Thermoscientific | cat no. F-410XL | |
| Commercial assay or kit | TrueVIEW | Vector Laboratories | cat no. SP-8400 | |
| Other | Micro-osmotic Pump | ALZET | Micro-osmotic Pump, 0.5 uL/hr; cat no. 1007D | Experimental model and subject details; continuous CL infusion |
| Other | Normal Donkey Serum | Fisher | Jackson Immunoresearch SERUM NORMAL DONKEY; cat no. 017-000-121 | Tissue processing and immunohistochemistry; blocking buffer |
| Other | Normal Goat Serum | Sigma | cat no. G-9023 | Tissue processing and immunohistochemistry; blocking buffer |
| Other | Lens Culinaris Agglutinin (LCA) DyLight 649 | Vector Laboratories | DL-1048 | Diluted 1:150 in blocking buffer. |
| Other | HCS LipidTOX Deep Red neutral lipid stain | Invitrogen | cat no. H34477 | Diluted 1:500. |
| Other | DAPI | Sigma | D9542 | 20 mg/mL; dilute 1:2,000 |
| Other | 100 µm Sterile Cell Strainer | fisherbrand | Sterile Cell Strainer 100 µm; cat no. 22-363-549 | Isolation of stromal vascular cells for mouse iBAT single cell |
| Other | 40 µm Sterile Cell Strainer | fisherbrand | Sterile Cell Strainer 40 µm; cat no. 22-363-547 | Isolation of stromal vascular cells for mouse iBAT single cell |
| Other | MS Columns | Miltenyi Biotec | cat no. 130-042-201 | Magnetic bead enrichment of cellular subtypes |
| Other | OctoMACS Separator | Miltenyi Biotec | cat no. 130-042-109 | Magnetic bead enrichment of cellular subtypes |
| Other | Chromium Controller Instrument | 10X Genomics | cat no. 1000204 | Single-cell RNA library preparation and sequencing |
| Other | Bst LF polymerase | New England Biolabs | cat no. M0275L | Single-molecule fluorescence in situ hybridization (smFISH) |
| Other | Digest-All 3 | ThermoFisher | cat no. 003009 | Single-molecule fluorescence in situ hybridization (smFISH) |
| Software, algorithm | Cell Ranger v3.0.1 | 10X Genomics | ||
| Software, algorithm | SoupX v1.0.1 | PMID:33367645 | ||
| Software, algorithm | Seurat v3.1.5 | PMID:31178118 | ||
| Software, algorithm | CellPhoneDB v2.1.3 | PMID:32103204 | ||
| Software, algorithm | NicheNet v0.1.0 | PMID:31819264 | ||
| Software, algorithm | CASAVA v1.8.2 | Illumina | ||
| Software, algorithm | STAR-2.6.1d | PMID:23104886 | ||
| Software, algorithm | Htseq v0.11.2 | PMID:25260700 | ||
| Software, algorithm | iDEP v0.95 | PMID:30567491 | ||
| Software, algorithm | GraphPad Prism v9.3.1 | GraphPad Software | ||
| Software, algorithm | Imaris Viewer x64 v9.9.0 | Oxford Instruments Group | ||
| Strain, strain background (Mus musculus) | C57 | Jackson Labs | C57BL/6J; stock no. 000664 | |
| Strain, strain background (Mus musculus) | LSL-tdTomato | Jackson Labs | B6.Cg-Gt(ROSA)26Sor_tm9(CAG-tdTomato)Hze/J; stock no. 007909 | |
| Strain, strain background (Mus musculus) | Pdgfra-CreERT2 | Jackson Labs | B6.129S-Pdgfratm1.1(cre/ERT2)Blh/J; stock no. 032770 | |
| Strain, strain background (Mus musculus) | Adrb1fl/fl | PMID:27548523 | Dr. Jeffery Zigman, The University of Texas Southwestern Medical Center |
Additional files
-
Supplementary file 1
DEGs for each cluster in the CONTROL and COLD Lin- iBAT data.
- https://cdn.elifesciences.org/articles/80167/elife-80167-supp1-v2.xlsx
-
Supplementary file 2
DEGs for each cluster in the reclustered CONTROL and COLD ASC iBAT data.
- https://cdn.elifesciences.org/articles/80167/elife-80167-supp2-v2.xlsx
-
Supplementary file 3
DEGs for each cluster in the WT and Adrb1 KO Lin- iBAT data.
- https://cdn.elifesciences.org/articles/80167/elife-80167-supp3-v2.xlsx
-
Supplementary file 4
DEGs for each cluster in the reclustered WT and Adrb1 KO ASC iBAT data.
- https://cdn.elifesciences.org/articles/80167/elife-80167-supp4-v2.xlsx
-
Supplementary file 5
DEGs for each cluster in the CONTROL, COLD, and CL Lin- iBAT data.
- https://cdn.elifesciences.org/articles/80167/elife-80167-supp5-v2.xlsx
-
Supplementary file 6
DEGs for each cluster in the reclustered CONTROL, COLD, and CL ASC iBAT data.
- https://cdn.elifesciences.org/articles/80167/elife-80167-supp6-v2.xlsx
-
Supplementary file 7
DEGs for each cluster in the CONTROL and COLD Lin+ iBAT data.
- https://cdn.elifesciences.org/articles/80167/elife-80167-supp7-v2.xlsx
-
Supplementary file 8
List of gene-specific primers used to synthesize probes for SABER-FISH.
- https://cdn.elifesciences.org/articles/80167/elife-80167-supp8-v2.xlsx
-
MDAR checklist
- https://cdn.elifesciences.org/articles/80167/elife-80167-mdarchecklist1-v2.pdf
Download links
A two-part list of links to download the article, or parts of the article, in various formats.
Downloads (link to download the article as PDF)
Open citations (links to open the citations from this article in various online reference manager services)
Cite this article (links to download the citations from this article in formats compatible with various reference manager tools)
Deconstructing cold-induced brown adipocyte neogenesis in mice
eLife 11:e80167.
https://doi.org/10.7554/eLife.80167


