Artificially stimulating retrotransposon activity increases mortality and accelerates a subset of aging phenotypes in Drosophila
- Biology Department, Brandeis University, United States
Figures
Figure 1 with 2 supplements
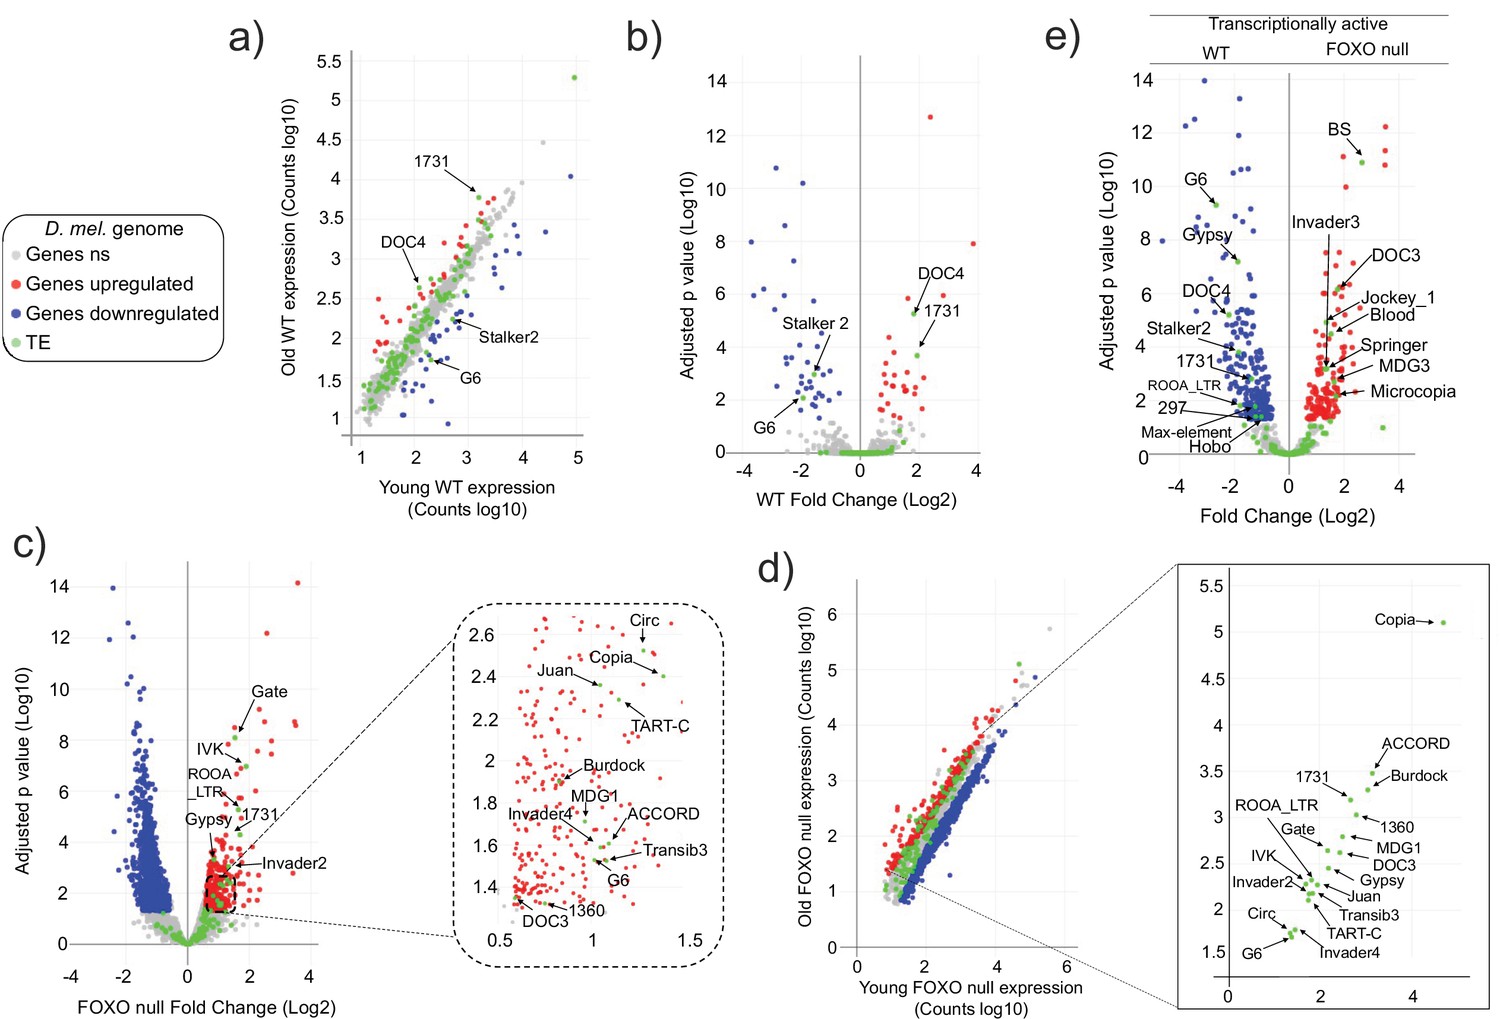
Transposable element (TE) expression increases with age in Forkhead-box O family (FOXO) null flies.
Data represents RNAseq from three biological replicates. Legend (gray: fly genes not significant [ns]; red: upregulated fly genes; blue: downregulated fly genes; green: TE). Differential expression indicates a 1.5-fold change or higher and an adjusted p-value<0.05, as determined by DESeq2. (a–d) Red indicates upregulation with age. Blue denotes downregulation with age. Significantly different TEs are identified by name. (a, b) Wildtype (WT) control. Four TEs are labeled. (c, d) FOXO null. Eighteen TEs are labeled. (e) Volcano plot of young WT control and young FOXO null. Red and blue dots indicate gene relative expression in FOXO null compared to WT, respectively. TEs are marked by green dots.
Figure 1—figure supplement 1
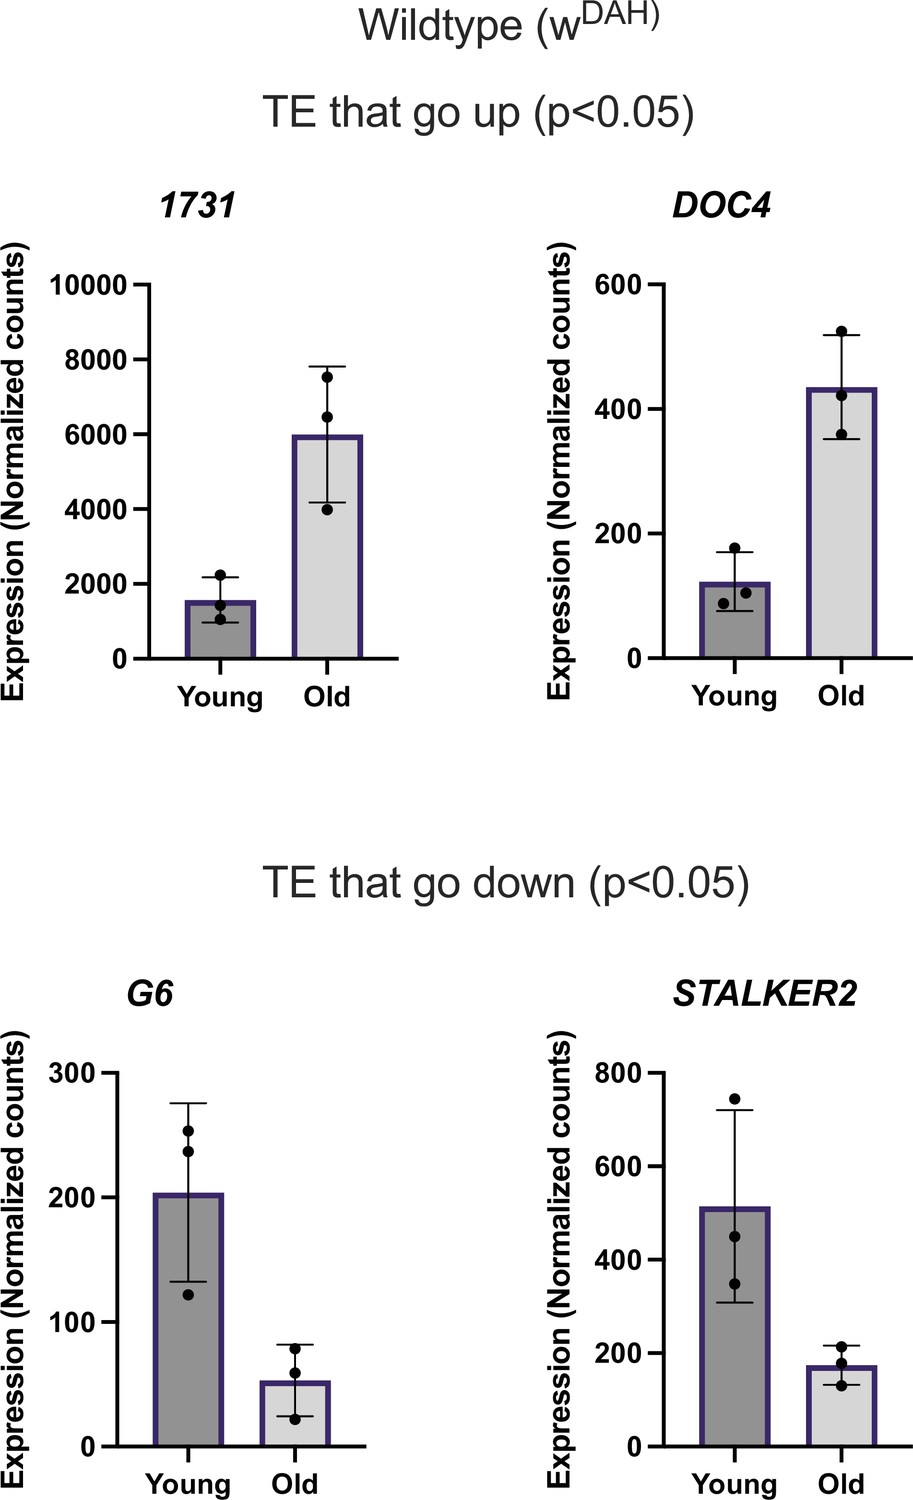
Differentially expressed transposable element (TE) in wildtype.
Normalized counts of TE differentially expressed with age in wt flies.
Figure 1—figure supplement 2
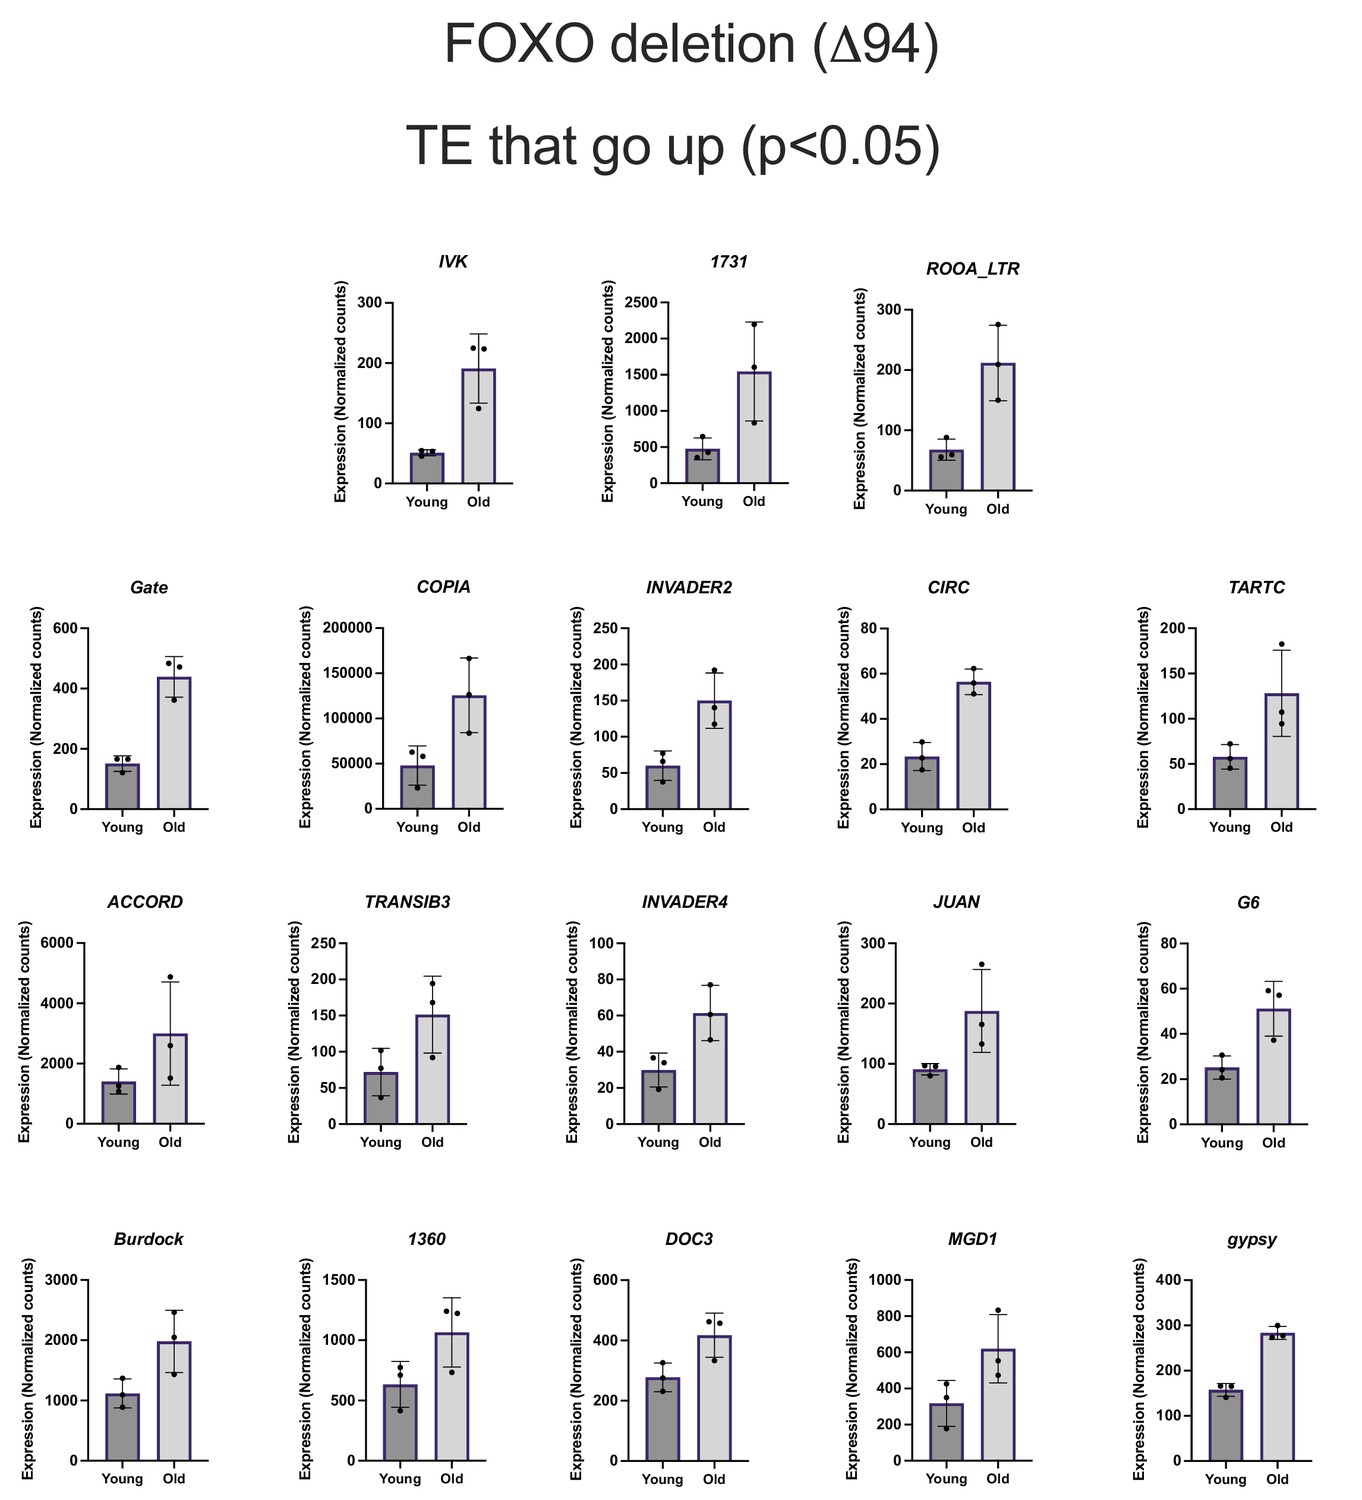
Differentially expressed transposable element (TE) in Forkhead-box O family (FOXO) deletion flies.
Normalized counts of TE differentially expressed with age in FOXO deletion flies.
Figure 2
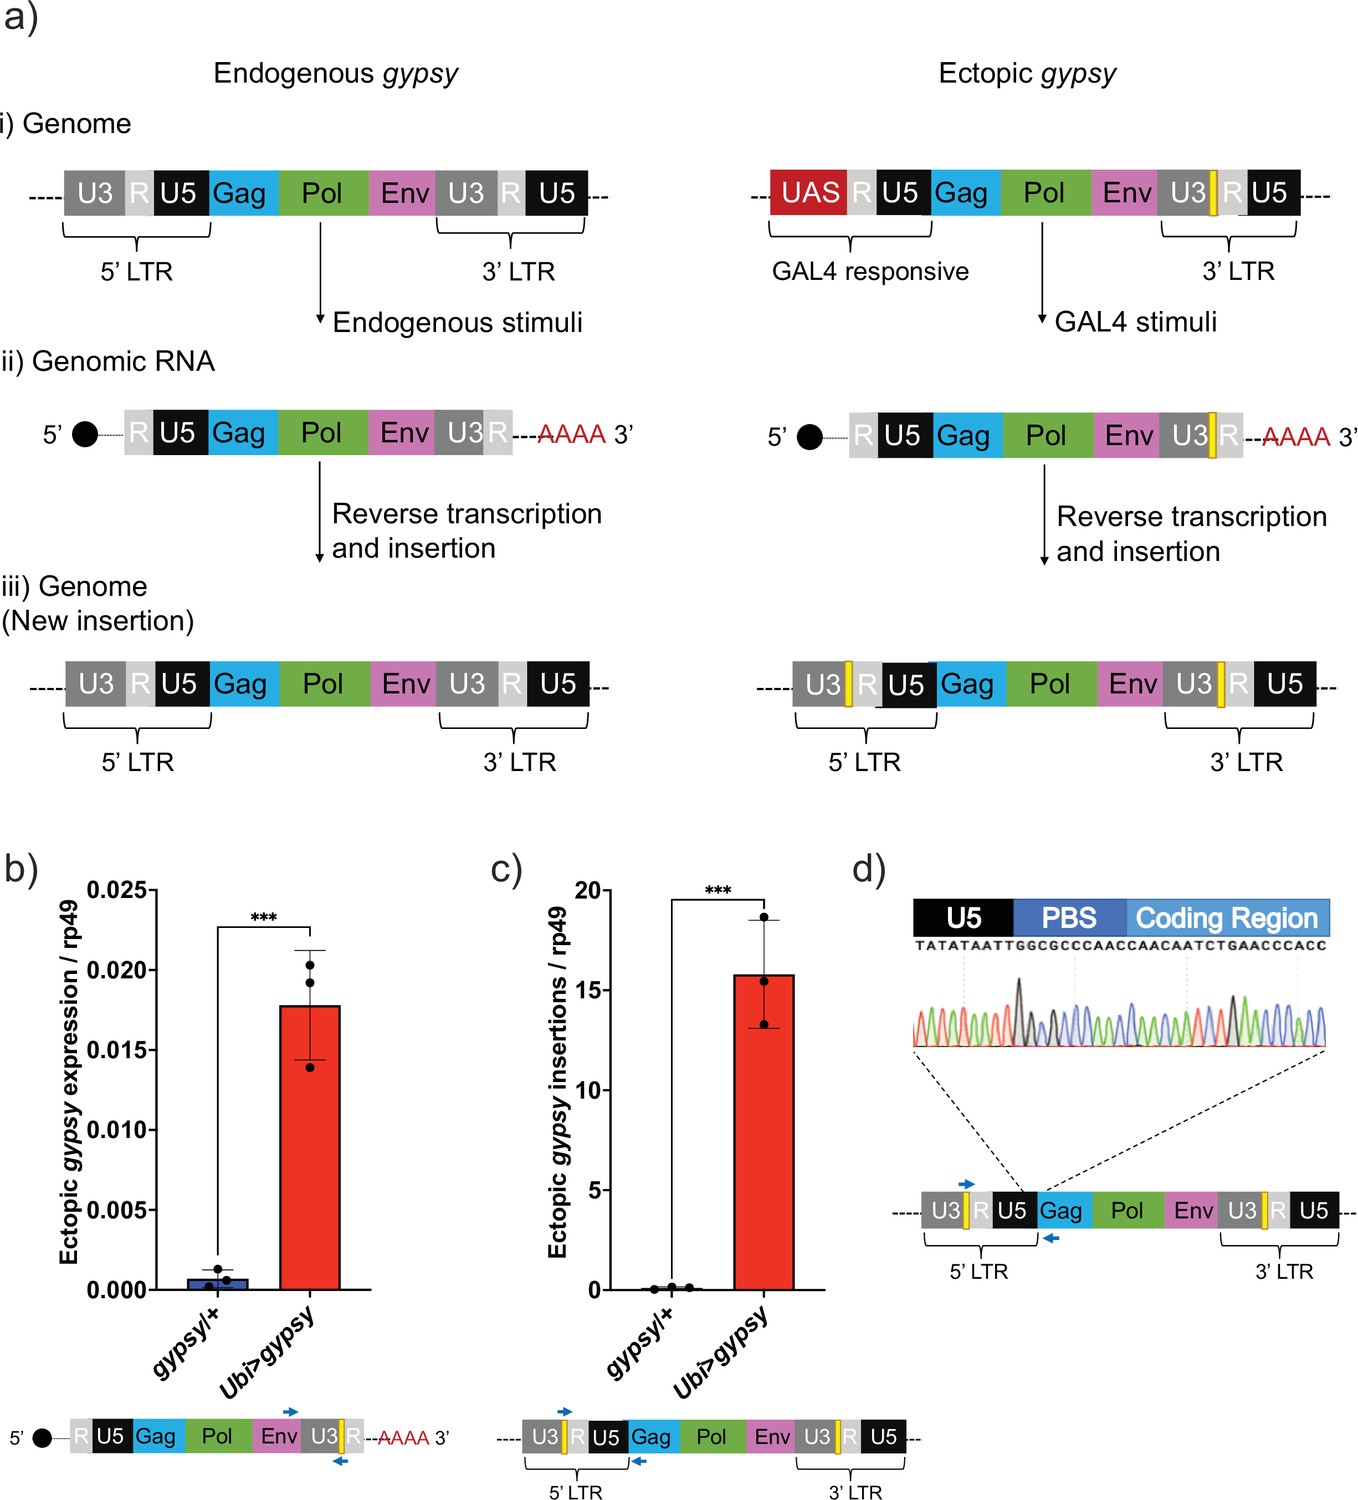
UAS-gypsy structure and functional test.
(a) Simplified overview of three stages of the gypsy retrotransposon life cycle, (i) parent insertion in the genome, (ii) the transcribed RNA (genomic RNA), and (iii) the new copy inserted in the genome. The difference between the wildtype gypsy and ectopic gypsy resides in both its 5′ and 3′ long-terminal-repeat (LTR). The presence of an upstream activating sequence (UAS) in the 5′ LTR allows gypsy to be transcribed in response to a GAL4 stimuli. In the 3′ LTR, the addition of a unique sequence of DNA (denoted by a yellow square) not found in the D. melanogaster genome allows quantification and tracking of new insertions by molecular methods. (b) RT-qPCR of 5-day-old males. 3′ end of ectopic gypsy transcript is detected. Data are represented as means ± SD (three biological replicates, each dot is a pool of five flies). One-tailed t-test, ***p-value=0.0005. (c) gDNA qPCR of 5-day-old males. Ectopic gypsy provirus insertion junctions are detected. Data are represented as means ± SD (three biological replicates, each dot is a pool of 10 flies). One-tailed t-test, ***p-value=0.0003. (d) Sanger sequencing of the newly created ectopic gypsy provirus insertion junction in Ubi>gypsy flies.
Figure 3 with 2 supplements
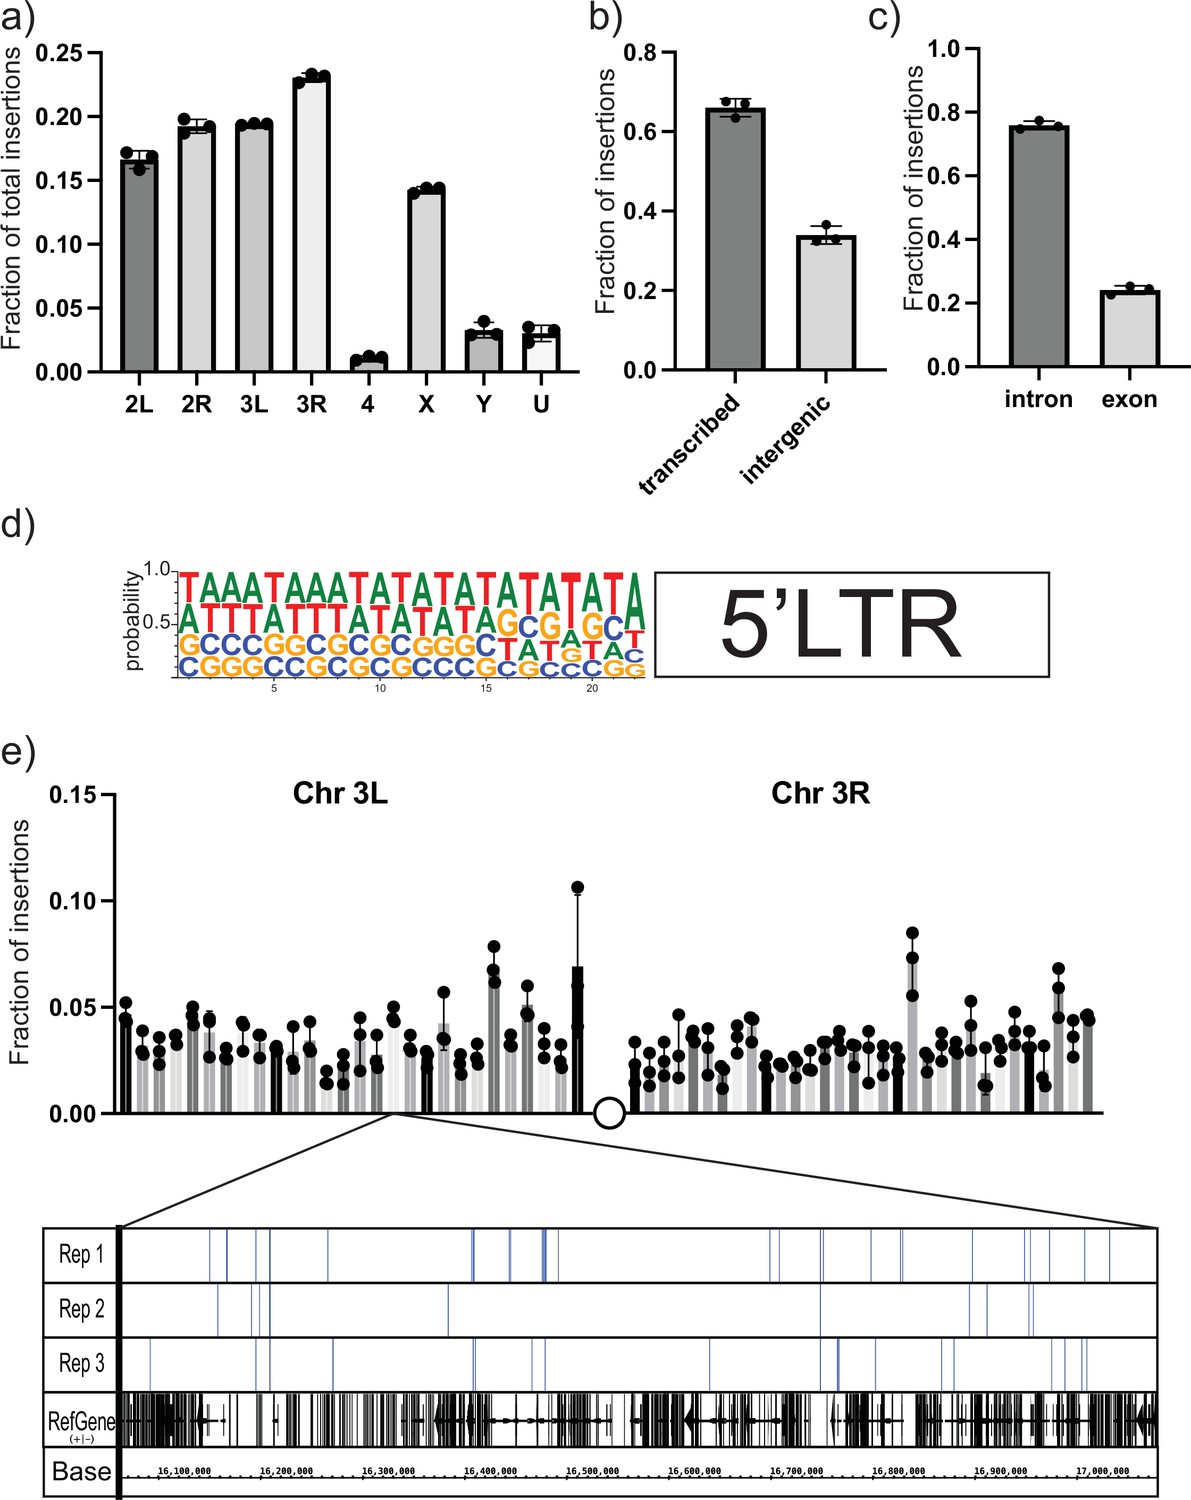
Next-generation sequencing (NGS) mapping of ectopic gypsy insertions.
(a) The average fraction of total insertions is shown for each chromosome (4, X, Y) or chromosome arm (2L, 2R, 3L, 3R). In addition, the fraction mapping to unplaced contigs is indicated as U. (b) The fraction of total reads mapping to transcribed regions of the genome and intergenic regions is graphed. (c) The fraction of insertions that map to the transcribed regions of the genome is subdivided. Insertions mapping to regions annotated as introns or exons is graphed. (d) The sequences of the junction of the new 5′ long-terminal-repeat (LTR) and the Drosophila genome were aligned and used to determine the probability of finding each base at each position. These probabilities are indicated by the size of the letter at each position. (e) The fraction of insertions that map to each 1 megabase region of the reference genome for the arms of chromosome 3 is plotted. For illustration, a genome browser view of the 1 Mb in Chr3L is shown. The insertion sites in that region for each replicate are indicated. A collapsed track showing genes in that region is also shown. For all histograms, the bars represent the average of three biological replicates. Error bars indicate the standard deviation, and the filled circles indicate the individual measurements.
Figure 3—figure supplement 1
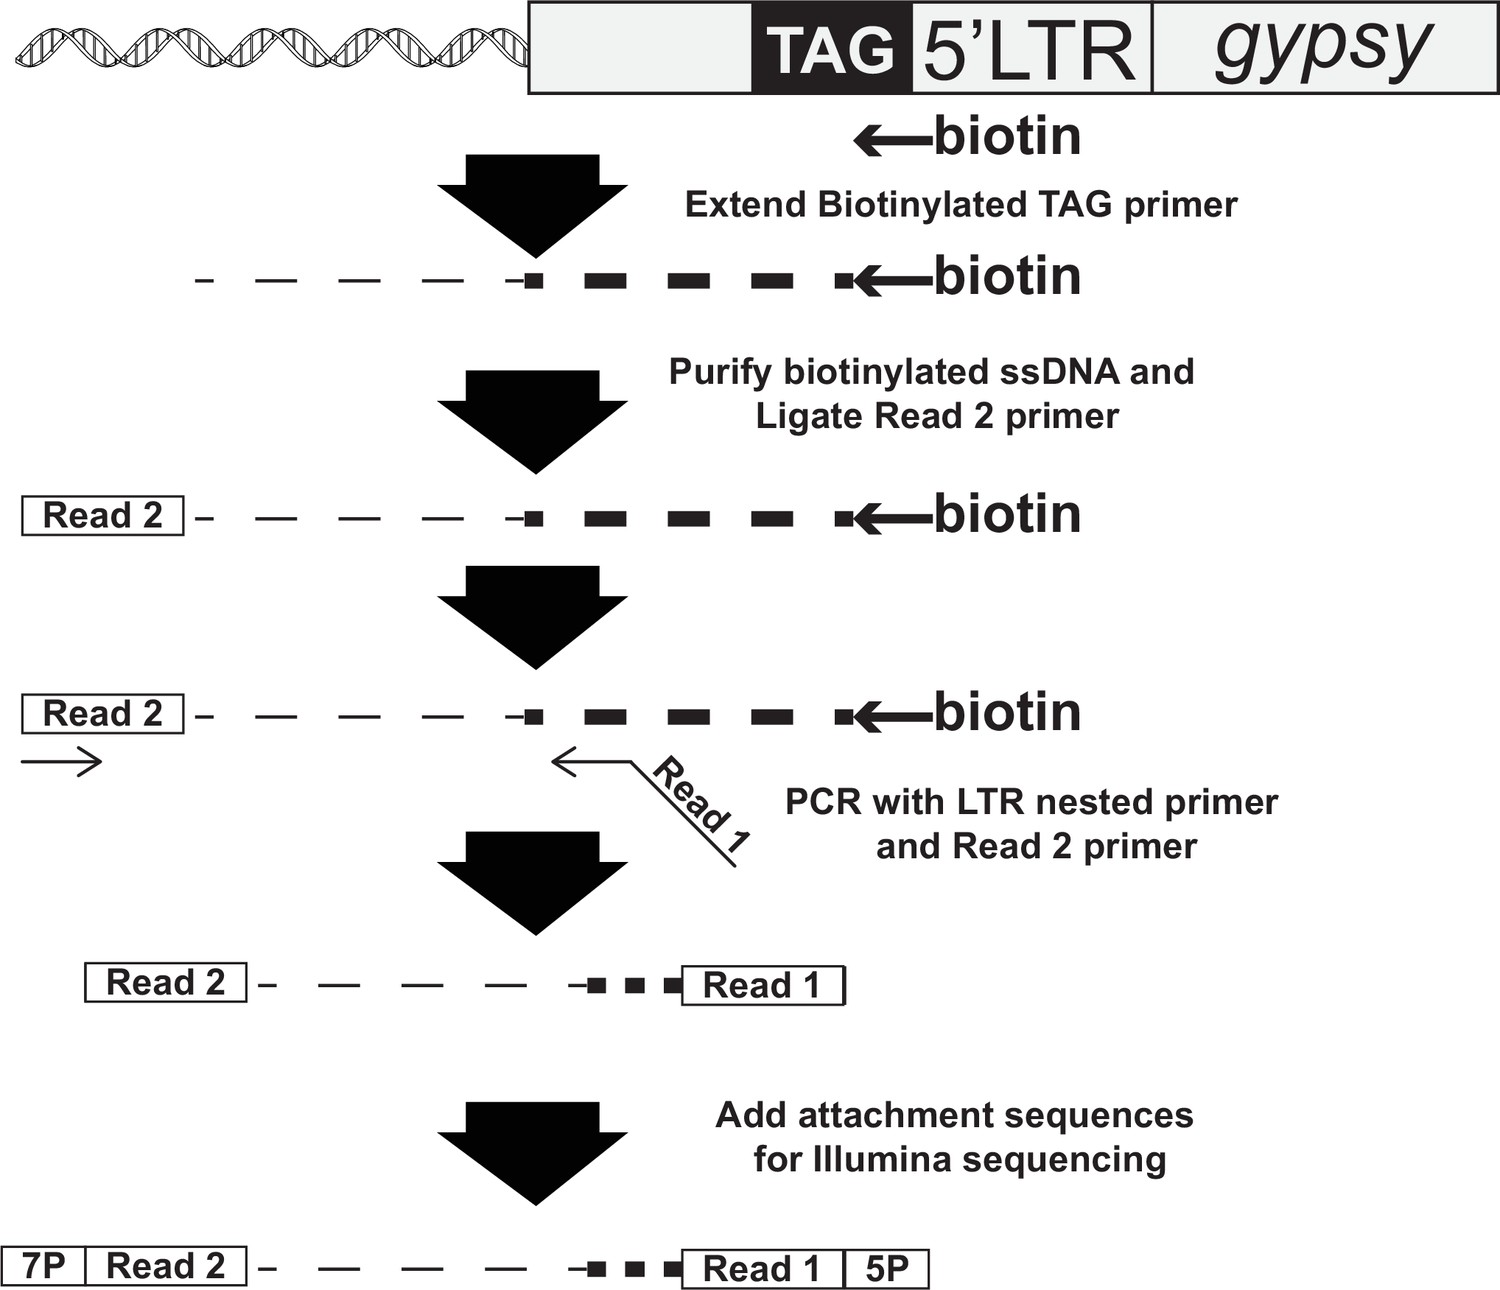
Schematic of targeted sequencing approach to map 5′ junctions.
Figure 3—figure supplement 2
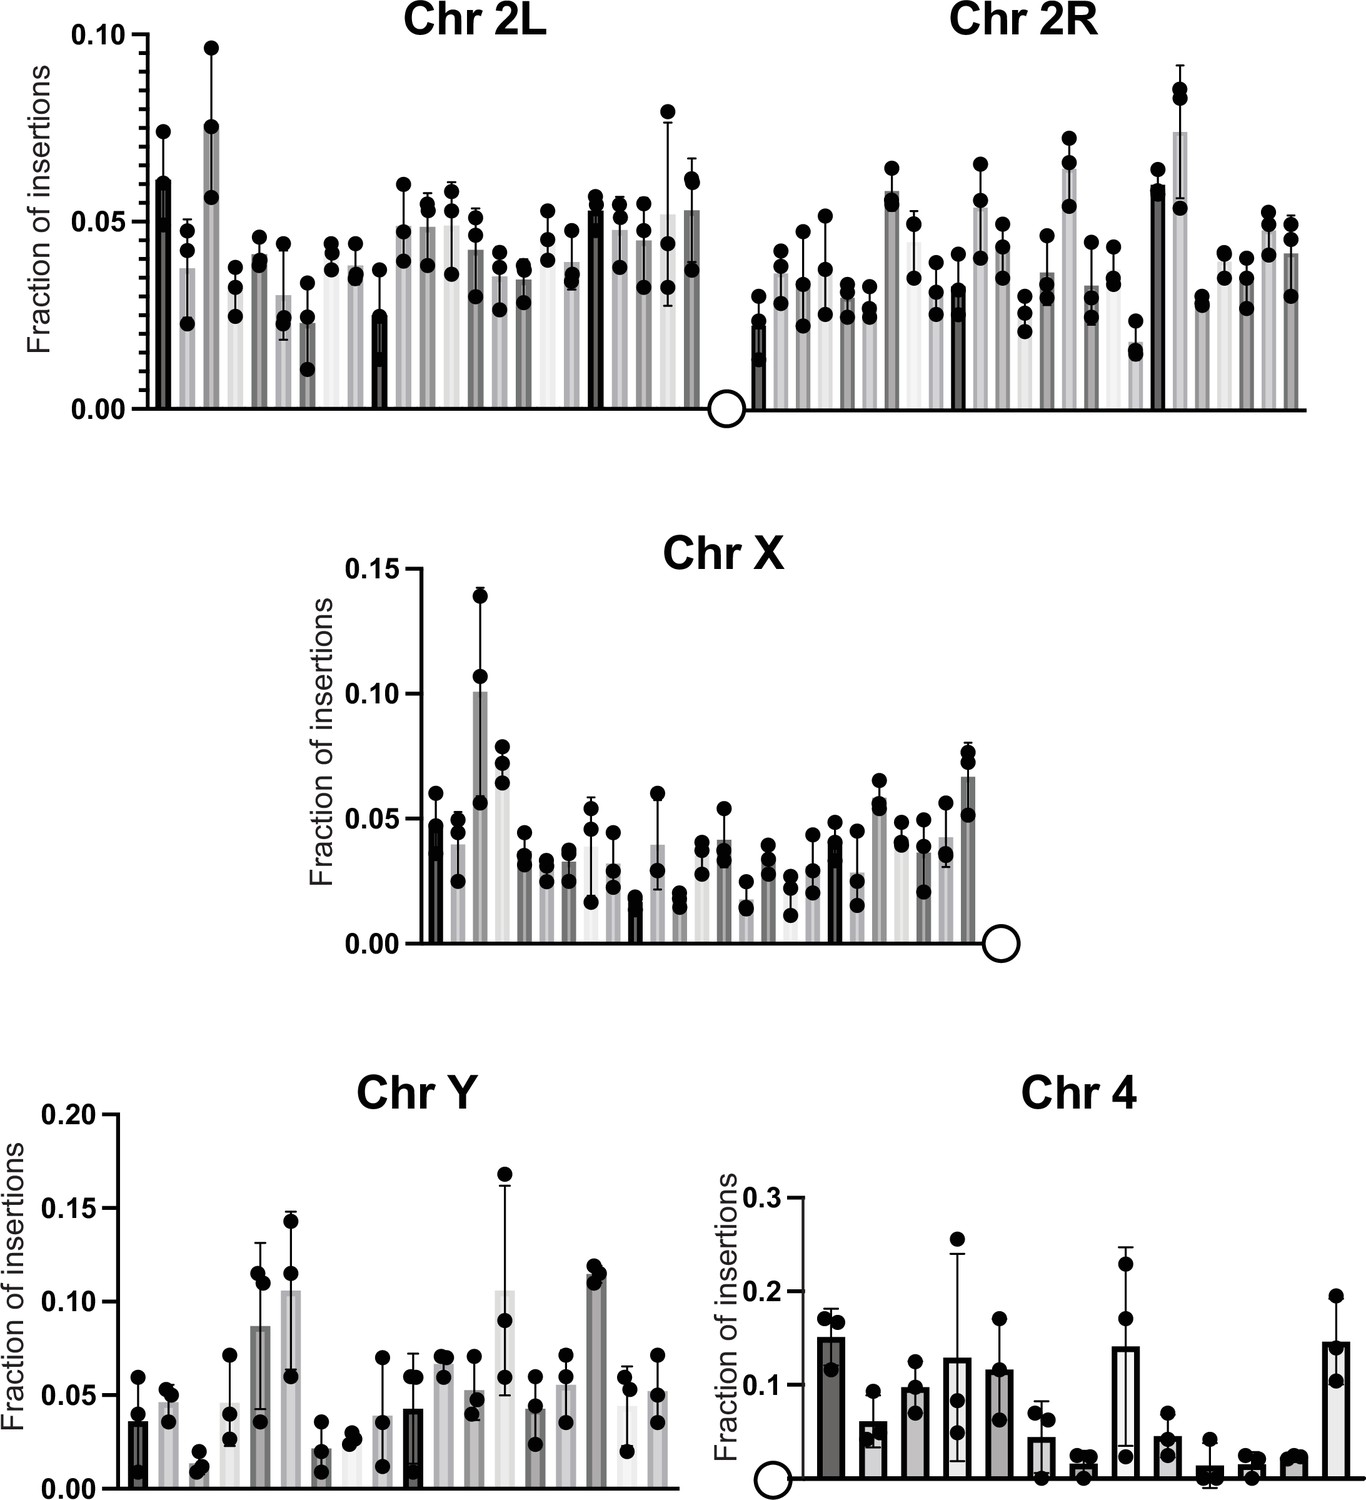
The fraction of insertions that map to each 1 megabase region of the reference genome for the arms of chromosome 2 and the X chromosome is plotted.
For the Y chromosome, each bin represents 200K bases. For chromosome 4, each bin represents 100K bases. For all histograms, the bars represent the average of three biological replicates. Error bars indicate the standard deviation, and the filled circles indicate the individual measurements.
Figure 4 with 3 supplements
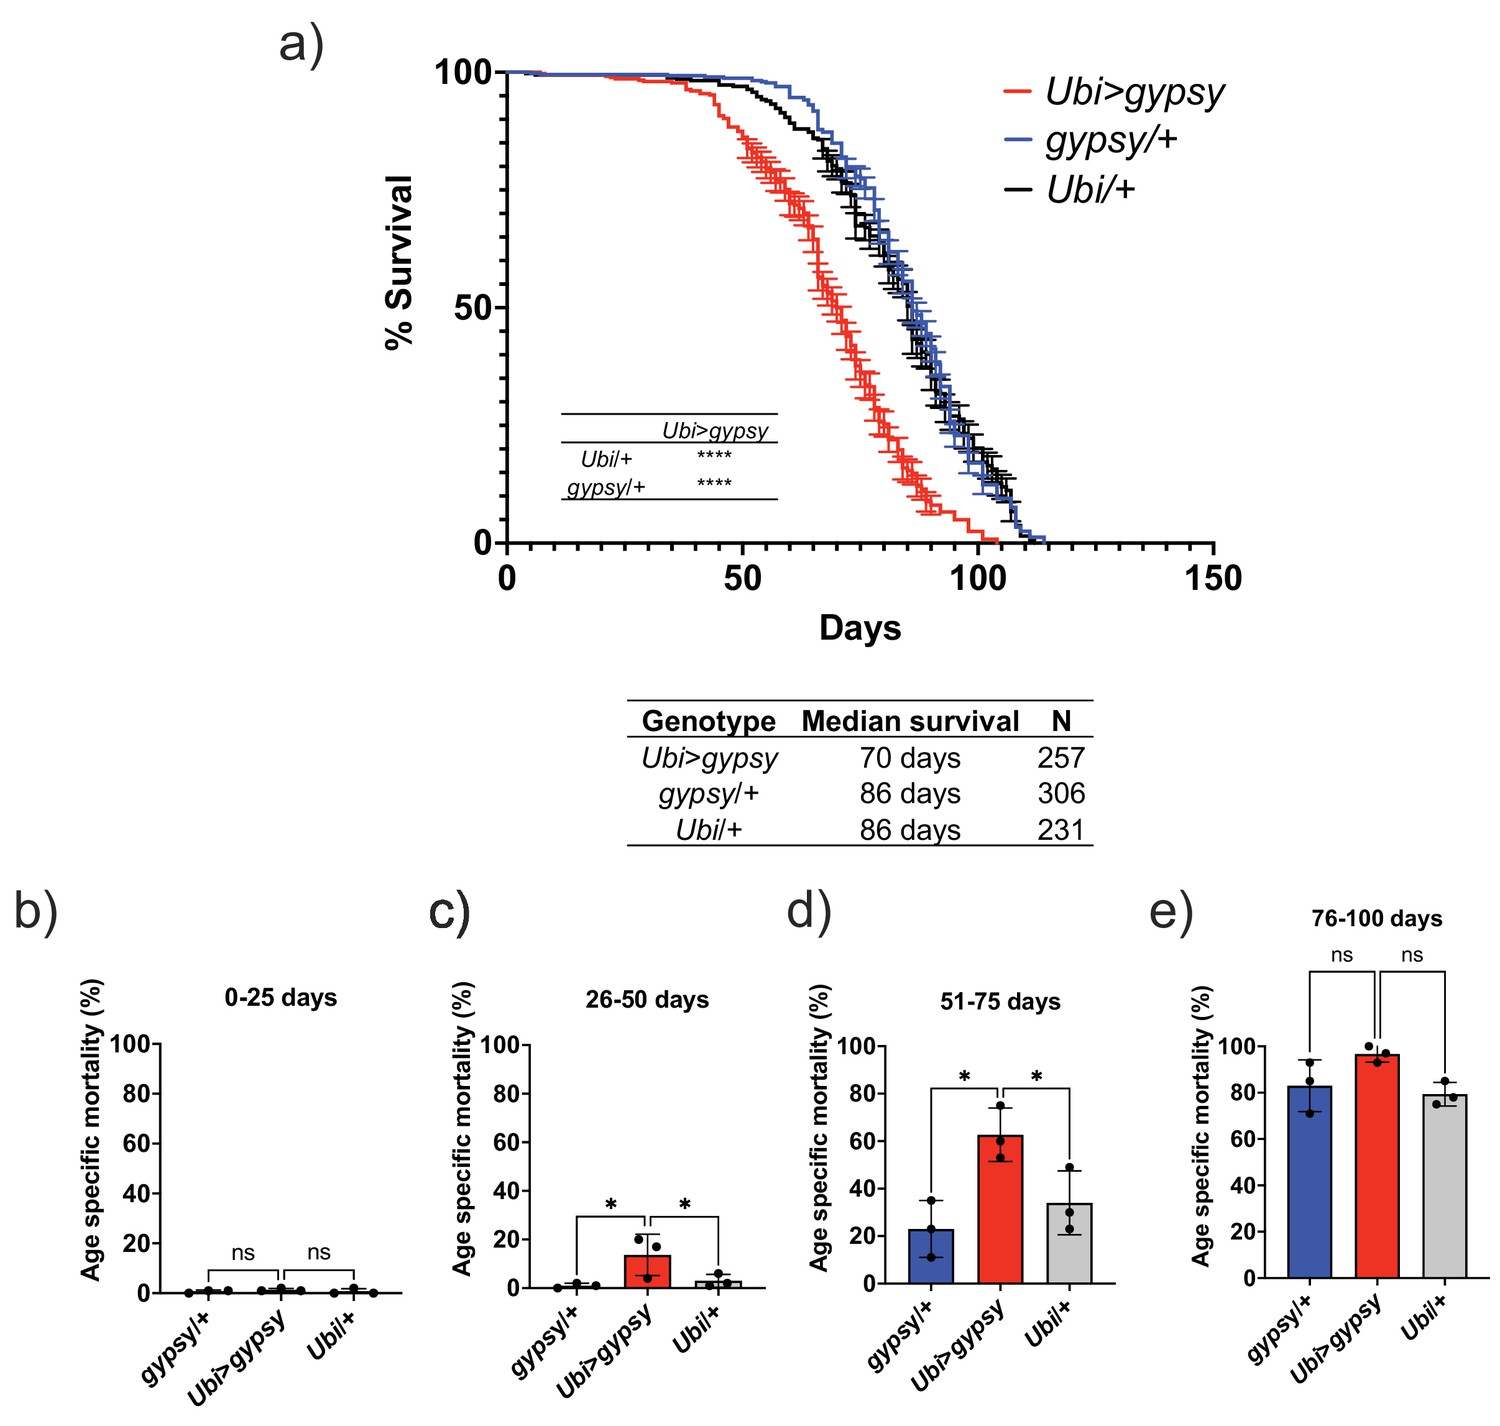
Ectopic gypsy expression decreases life span during old age.
(a) Survival curves of male flies expressing gypsy under the control of Ubiquitin GAL4 (red) and the parental controls: gypsy/+ (blue) and Ubi/+ (black). Data represents three biological replicates (independent cohorts done at different times of year), error bars SE. p-value<0.0001, log-rank test. (b–e) Data are represented as means ± SD (individual measurements are shown as dots, age-specific mortality was calculated for each cohort independently). One-way ANOVA: adjusted p-value 26–50 days (gypsy/+ 0.047, Ubi/+ 0.047), adjusted p-value 51–75 days (gypsy/+ 0.015, Ubi/+ 0.030), ns, not significant.
Figure 4—figure supplement 1
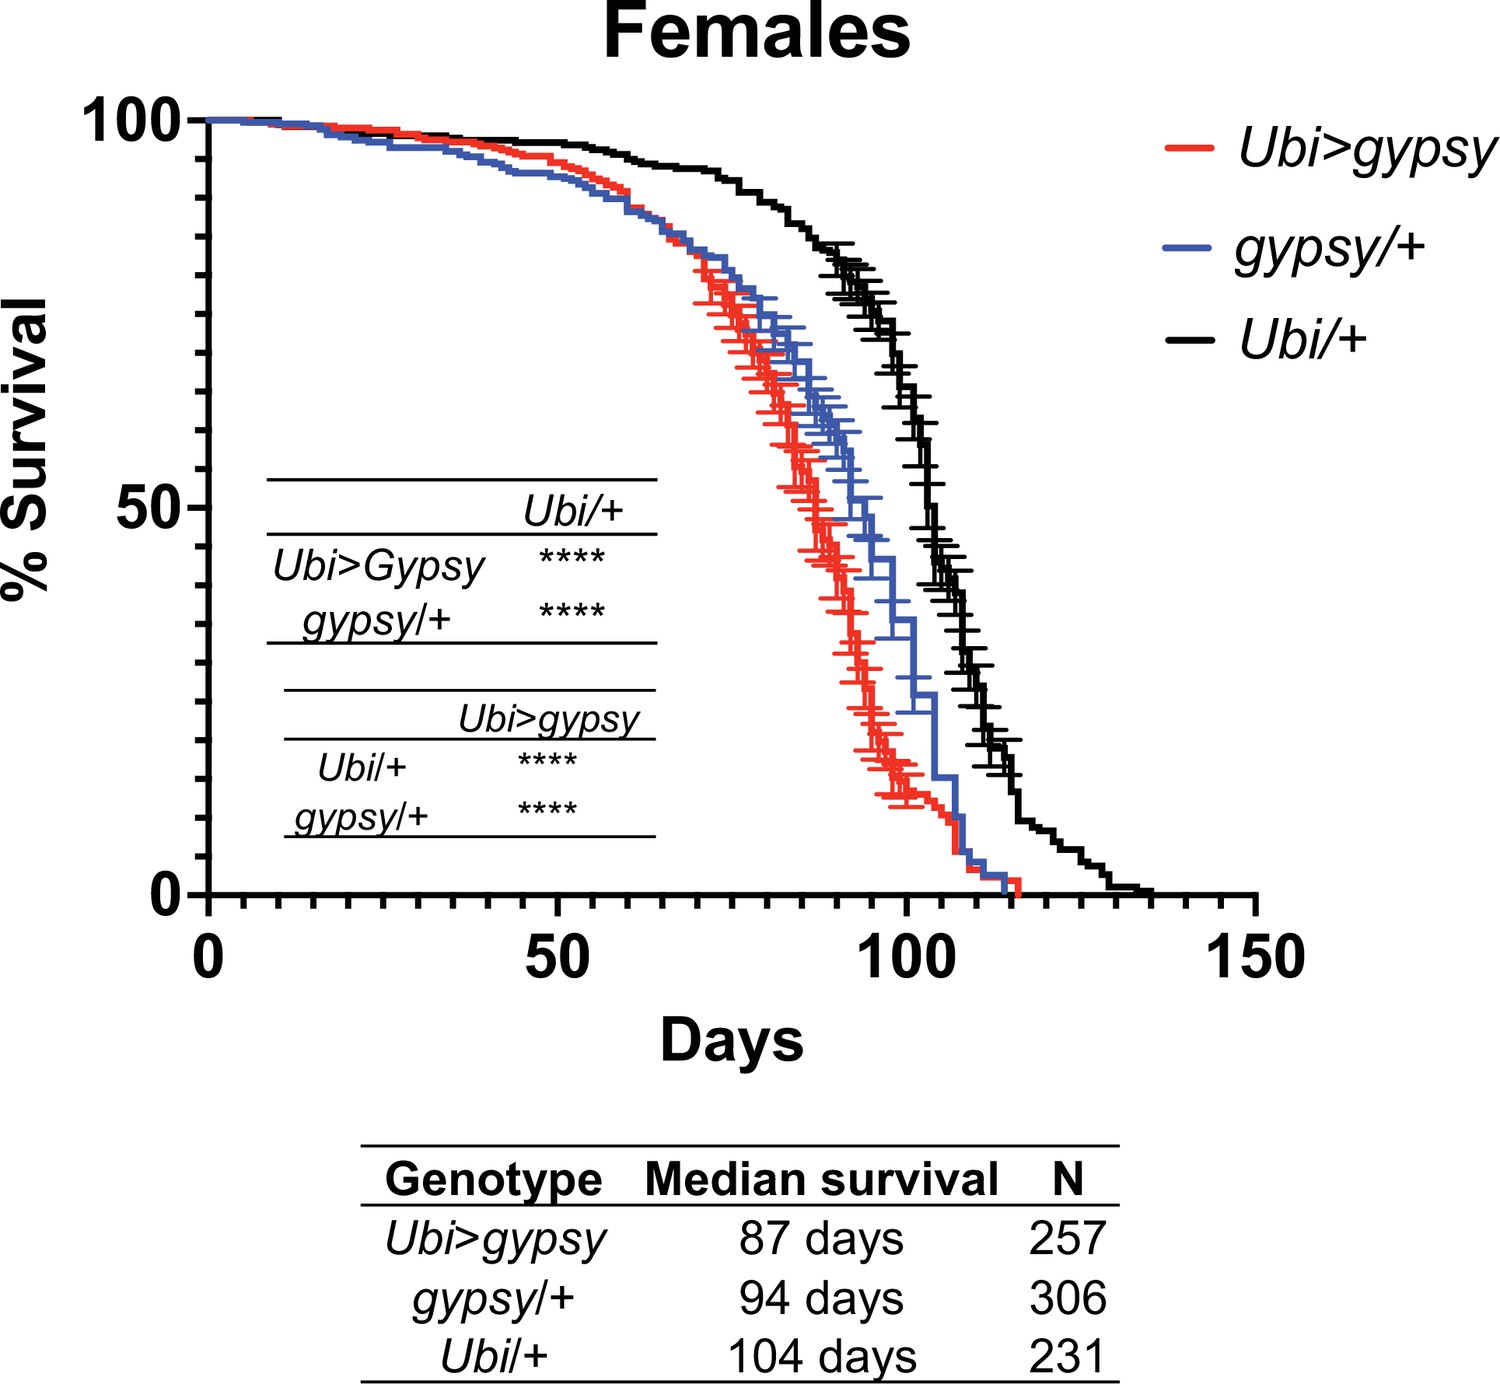
Survival curves of female flies expressing gypsy under the control of Ubiquitin GAL4 (red) and the parental controls: gypsy/+ (blue) and Ubi/+ (black).
Data represents three biological replicates (independent cohorts done at different times of year), error bars SE. p-value<0.0001, log-rank test.
Figure 4—figure supplement 2
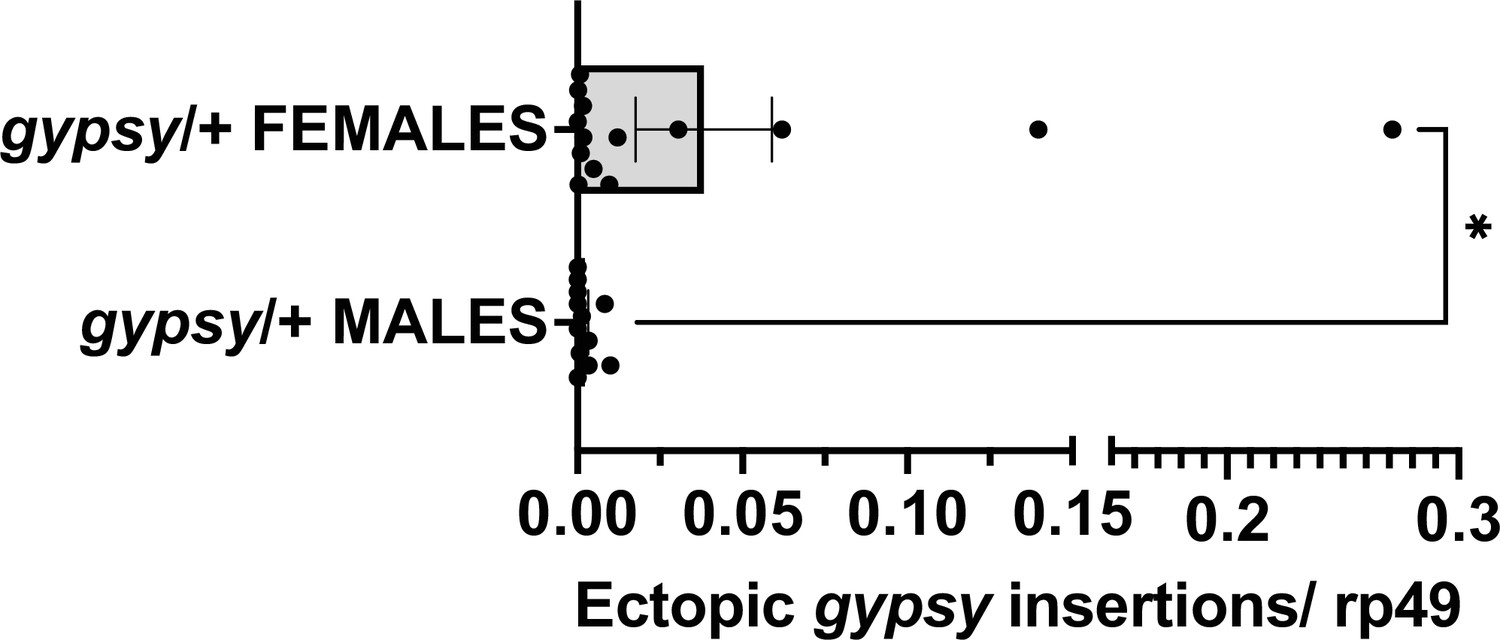
Male vs. female parental UAS gypsy control.
Ectopic gypsy provirus insertion junctions are detected. Data are represented as means ± SEM. gypsy/+ gDNA from dead flies across the whole life span curve was assayed. All dead flies were assayed. Each dot represents a pool of 5–10 dead flies. Two-tailed Mann–Whitney test, *p-value=0.0177. Male n = 12 pools. Female n = 14 pools.
Figure 4—figure supplement 3
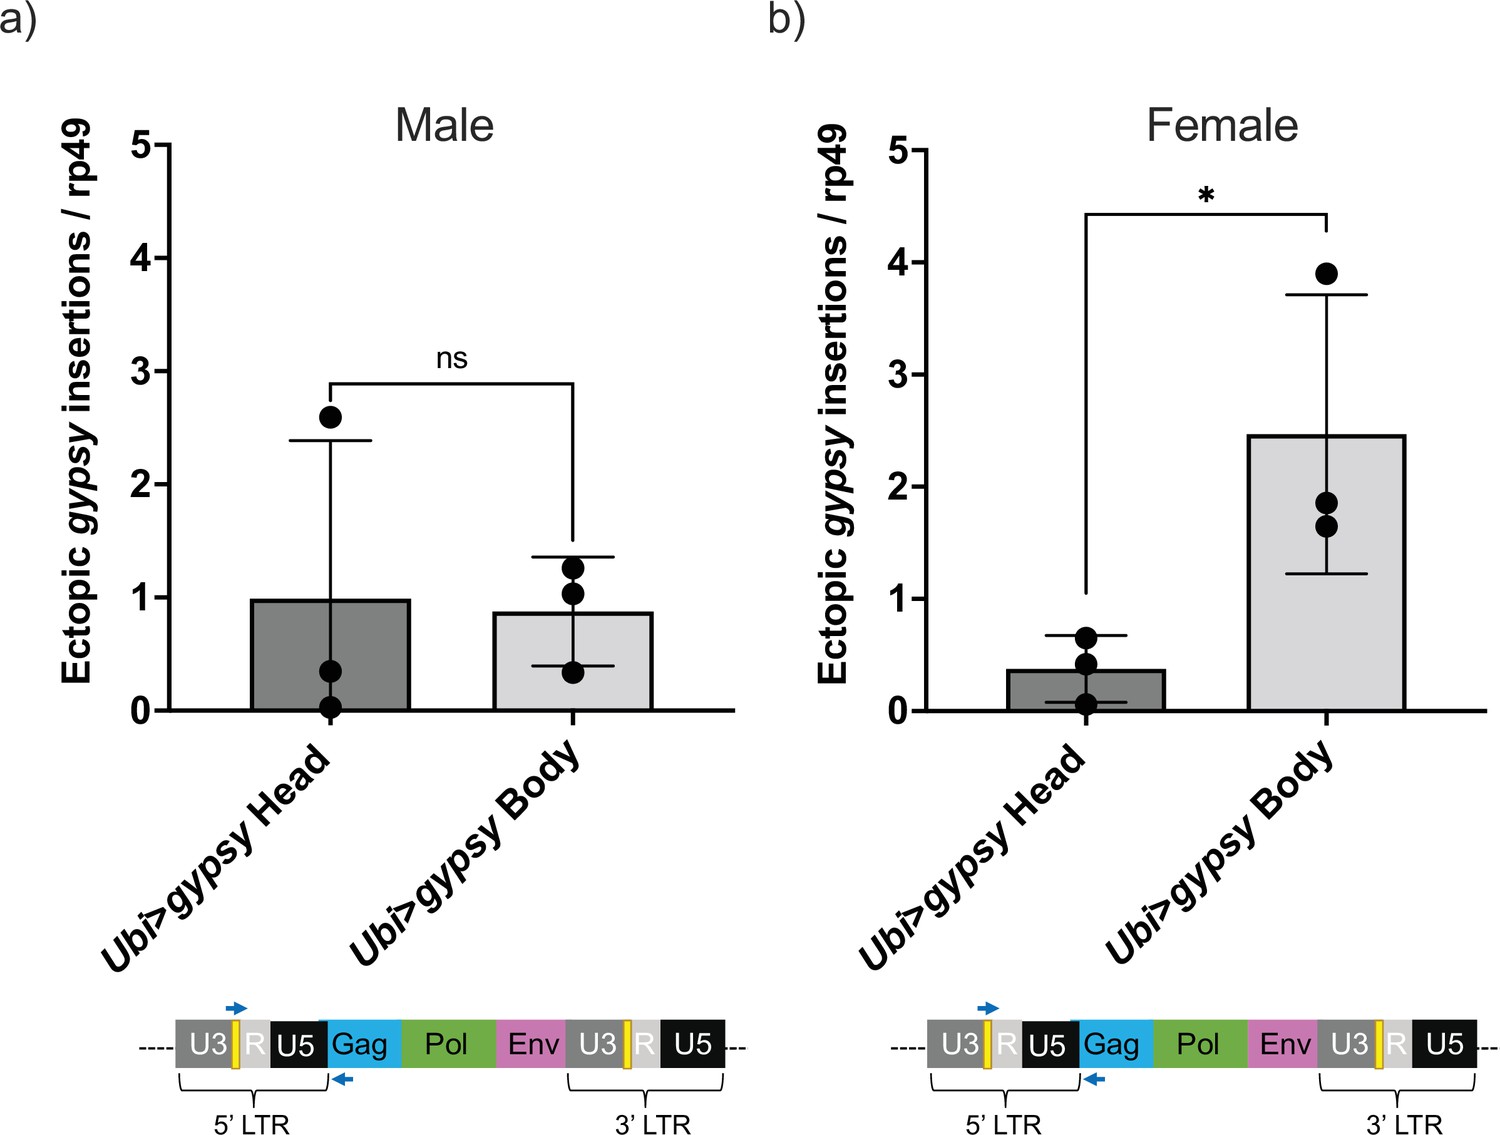
Head vs. body gypsy parental control.
(a, b) Ectopic gypsy provirus insertion junctions are detected. Data are represented as means ± SD (three biological replicates, each dot represents a pool of gDNA from 15 to 20 14-day-old heads or bodies). (a) Males. Two-tailed unpaired t-test, ns p-value>0.9. (b) Females. Two-tailed unpaired t-test, *p-value=0.047.
Figure 5
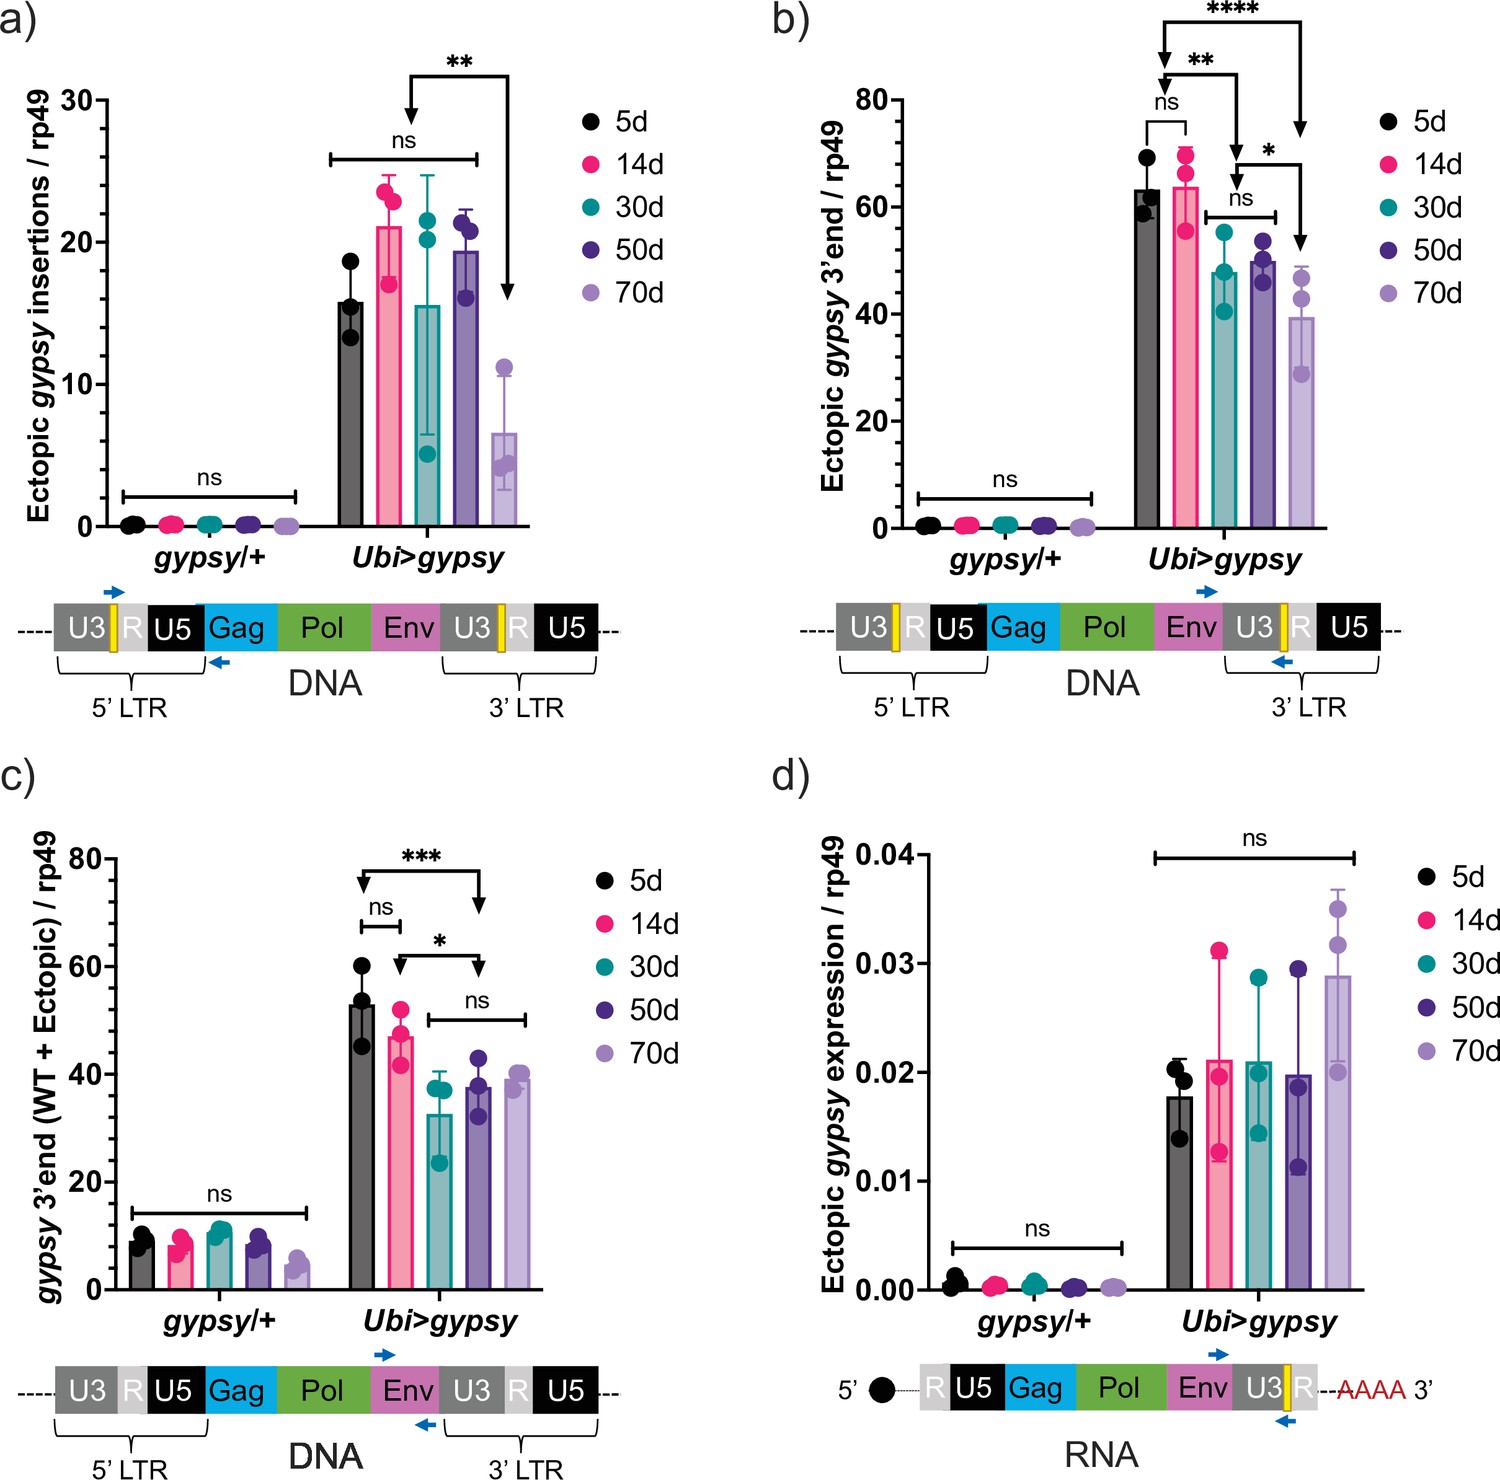
Ectopic gypsy DNA does not increase with age.
(a–c) gDNA qPCR of male flies at different ages (5 days, 14 days, 30 days, 50 days, and 70 days). Data are represented as means ± SD (three biological replicates, each dot is a pool of 10 flies). Two-way ANOVA, ****adjusted p-value<0.0001, **adjusted p-value<0.01, *adjusted p-value<0.05. (a) Ectopic gypsy provirus junctions are detected. (b) 3′ end of ectopic gypsy fragments are detected. (c) Wildtype (WT) and ectopic gypsy env fragments are detected. (d) RT-qPCR of male flies at different ages (5 days, 14 days, 30 days, 50 days, and 70 days). 3′ end of ectopic gypsy transcript is detected. Data are represented as means ± SD (three biological replicates, each dot is a pool of five flies). Two-way ANOVA, not significant (ns).
Figure 6
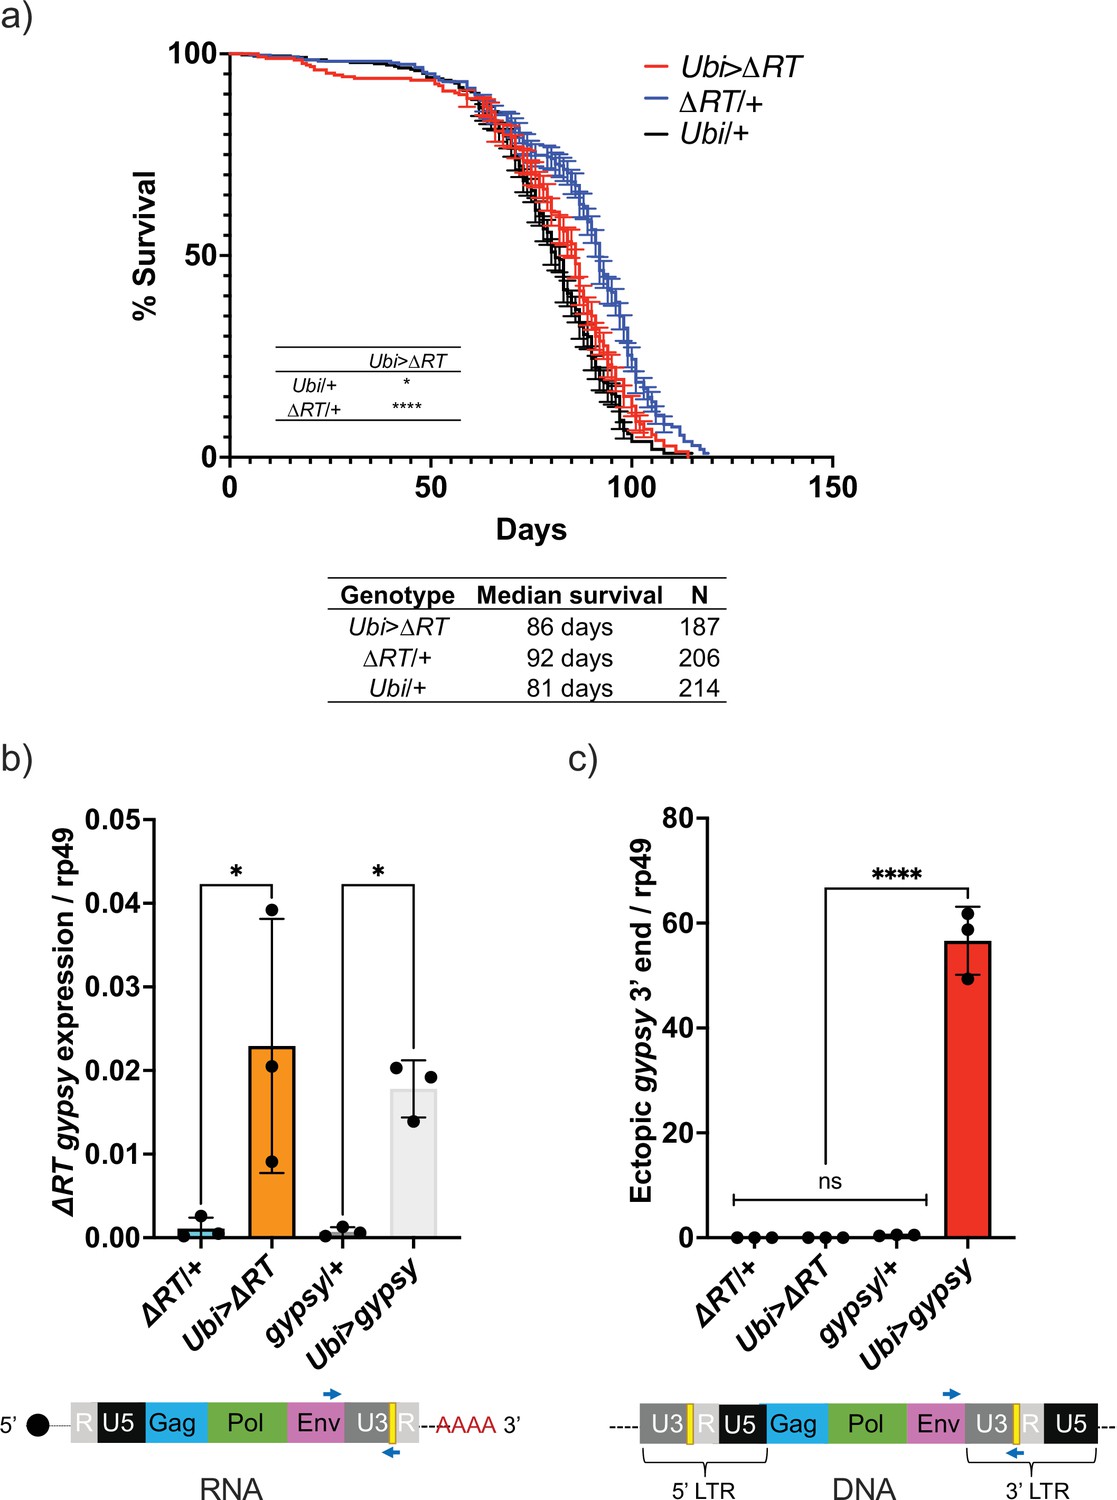
Decrease in life span requires reverse transcriptase activity.
(a) Survival curves of male flies expressing ∆RT gyps under the control of Ubiquitin GAL4 (red) and the parental controls: ∆RT gypsy/+ (blue) and Ubi/+ (black). Data represents two biological replicates (staggered independent cohorts), error bars SE. p-Value<0.0001, *p-value=0.016, log-rank test. (b, c) Data are represented as means ± SD (three biological replicates, each dot is a pool of five flies). gypsy/+ and Ubi>gypsy data are replotted from Figure 2b and c, respectively. (b) RT-qPCR of 5-day-old males. 3′ end of ectopic gypsy transcript is detected. One-way ANOVA, ΔRT/+ vs. Ubi>ΔRT * adjusted p-value=0.012, gypsy/+ vs. Ubi>gypsy * adjusted p-value=0.029. (c) gDNA qPCR of 5-day-old males. 3′ end of ectopic gypsy fragments is detected. Ordinary one-way ANOVA, ****adjusted p-value<0.0001.
Figure 7 with 3 supplements
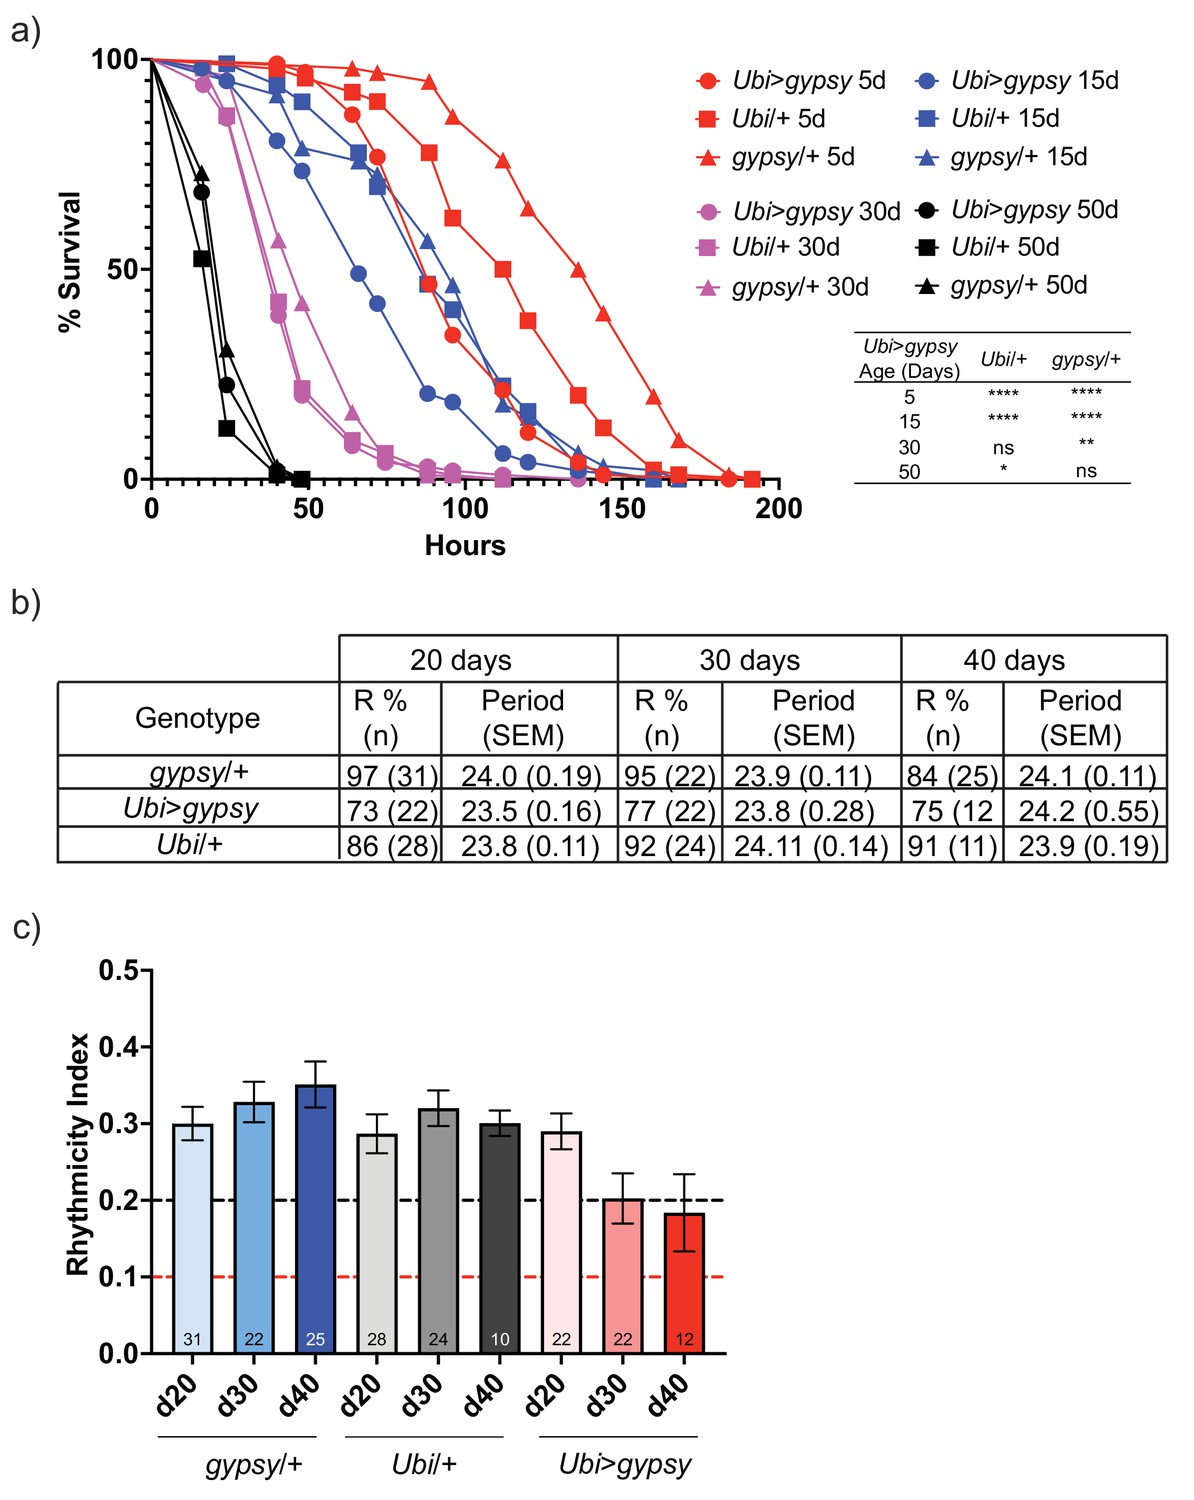
gypsy activity accelerates a subset of aging phenotypes.
(a) Survival curves of male flies after exposure to 20 mM paraquat at different ages (red = 5 days, blue = 15 days, magenta = 30 days, and black = 50 days). Experimental flies expressing gypsy under the control of Ubiquitin GAL4 are represented as circles. The parental controls Ubi/+ and gypsy/+ are denoted squares and triangles, respectively. Statistical significance is indicated on graph. *p-value=0.013, **p-value=0.006, p-value<0.0001, log-rank test. (b) Summary table of the percentage of rhythmic flies (R%) and their period in DD. (c) Rhythmicity levels of each genotype across the assessed ages (± SEM). gypsy/+ control, Ubi>gypsy experimental, and Ubi/+ control flies are represented in blue, red, and gray, respectively. The black and red dotted lines mark the thresholds between what are considered highly (rhythmicity index [RI] > 0.2) and weakly rhythmic, and arrhythmic flies (RI < 0.1). The number at the bottom of each column indicates the n.
Figure 7—figure supplement 1
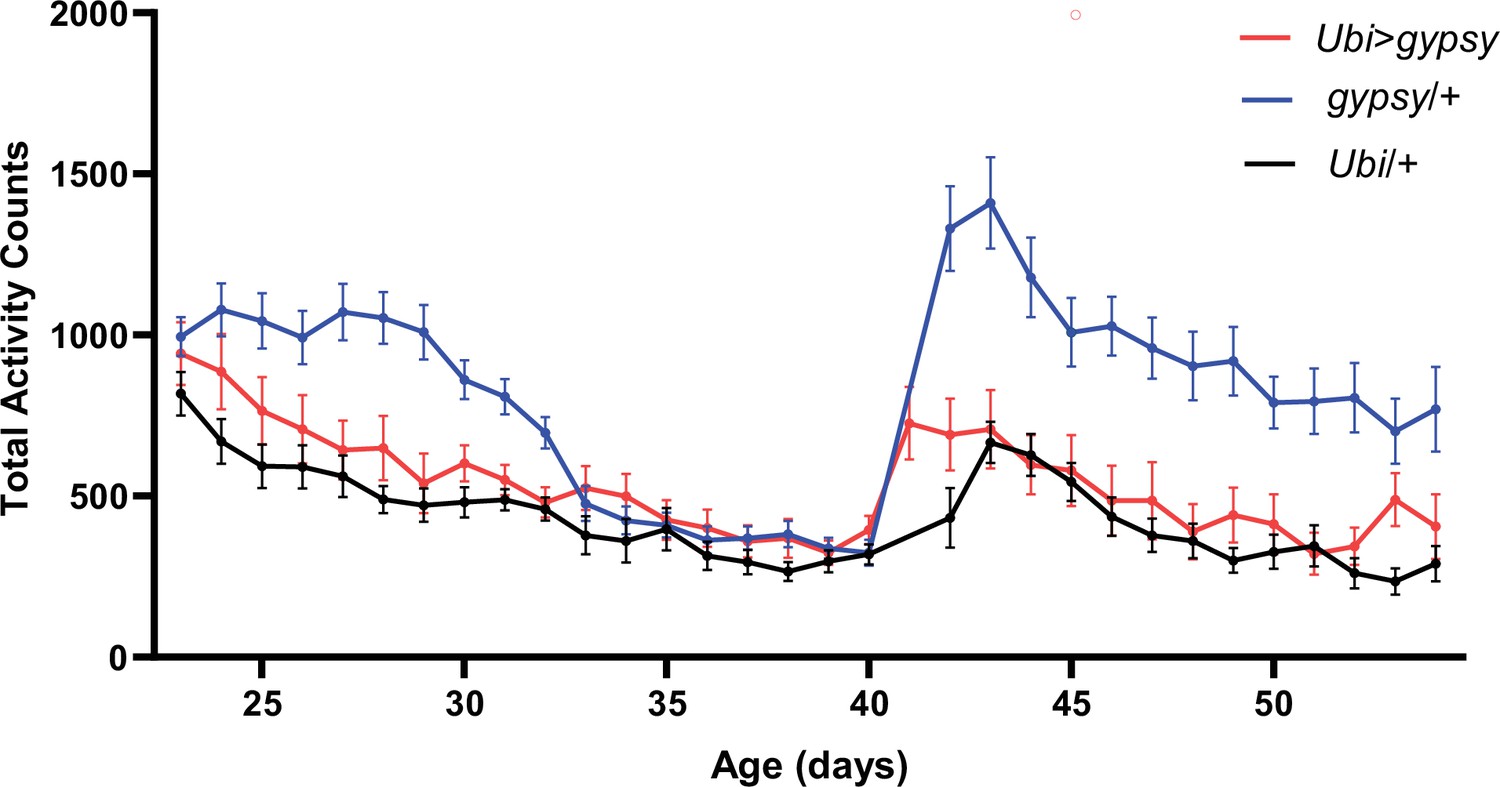
Total activity counts of each genotype per day under 12:12 light–dark (LD) conditions.
The sudden increase in activity around day 40 corresponds with the start of a new recording. UAS-gypsy/+ blue line. Ubi>gypsy red line. Ubi/+ black line. N = 26–32. Data are represented as means ± SEM.
Figure 7—figure supplement 2
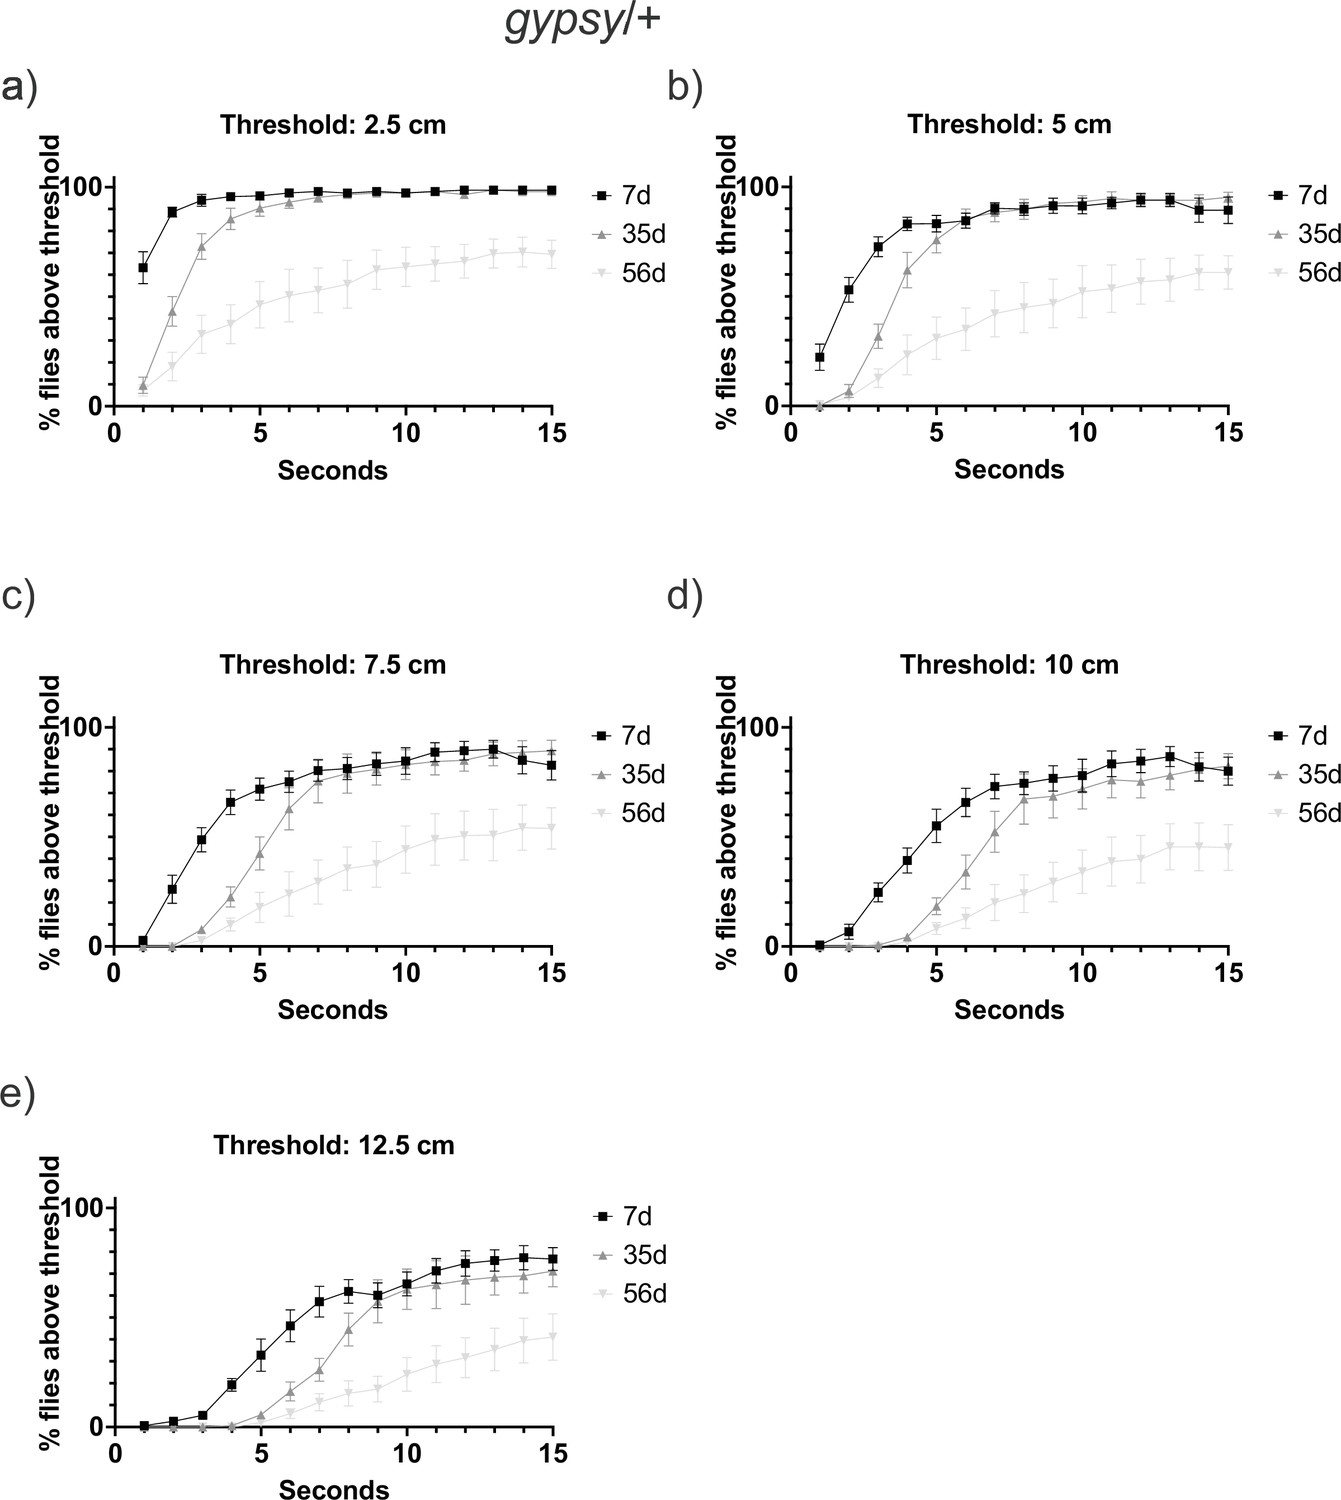
Negative geotaxis threshold optimization.
Climbing behavior at three different ages 7-day-old (black square), 35-day-old (gray triangle), and 56-day-old (light gray inverted triangle) of the UAS-gypsy parental control. Data are represented as means ± SEM (five biological replicates, three trials each). Behavior was examined using different thresholds: (a) 2.5cm (b) 5cm (c) 7.5cm (d) 10cm (e) 12.5cm.
Figure 7—figure supplement 3
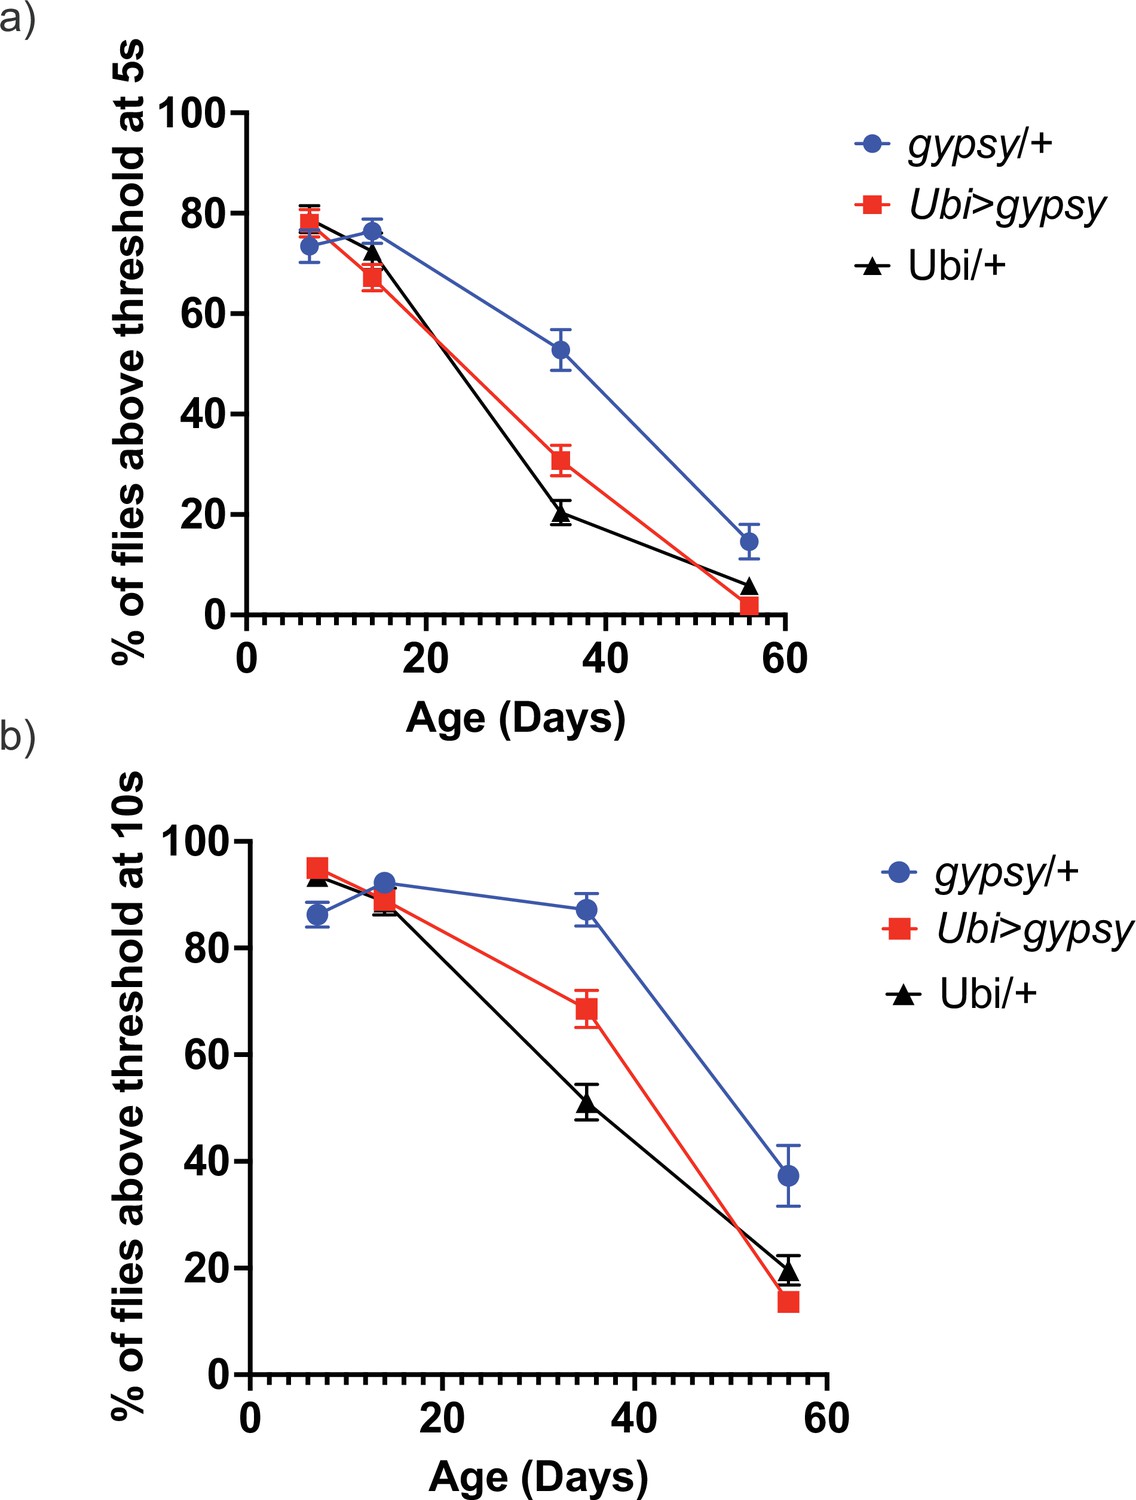
Negative geotaxis.
Threshold 7.5 cm. Data are represented as means ± SEM (10 biological replicates, 10 male flies each, 5 trials per replicate). gypsy/+ blue circles. Ubi>gypsy red squares. Ubi/+ black triangles. (a) 5 s. (b) 10 s. Slopes were analyzed by simple linear regression and determined to be not significantly different from each other.
Figure 8
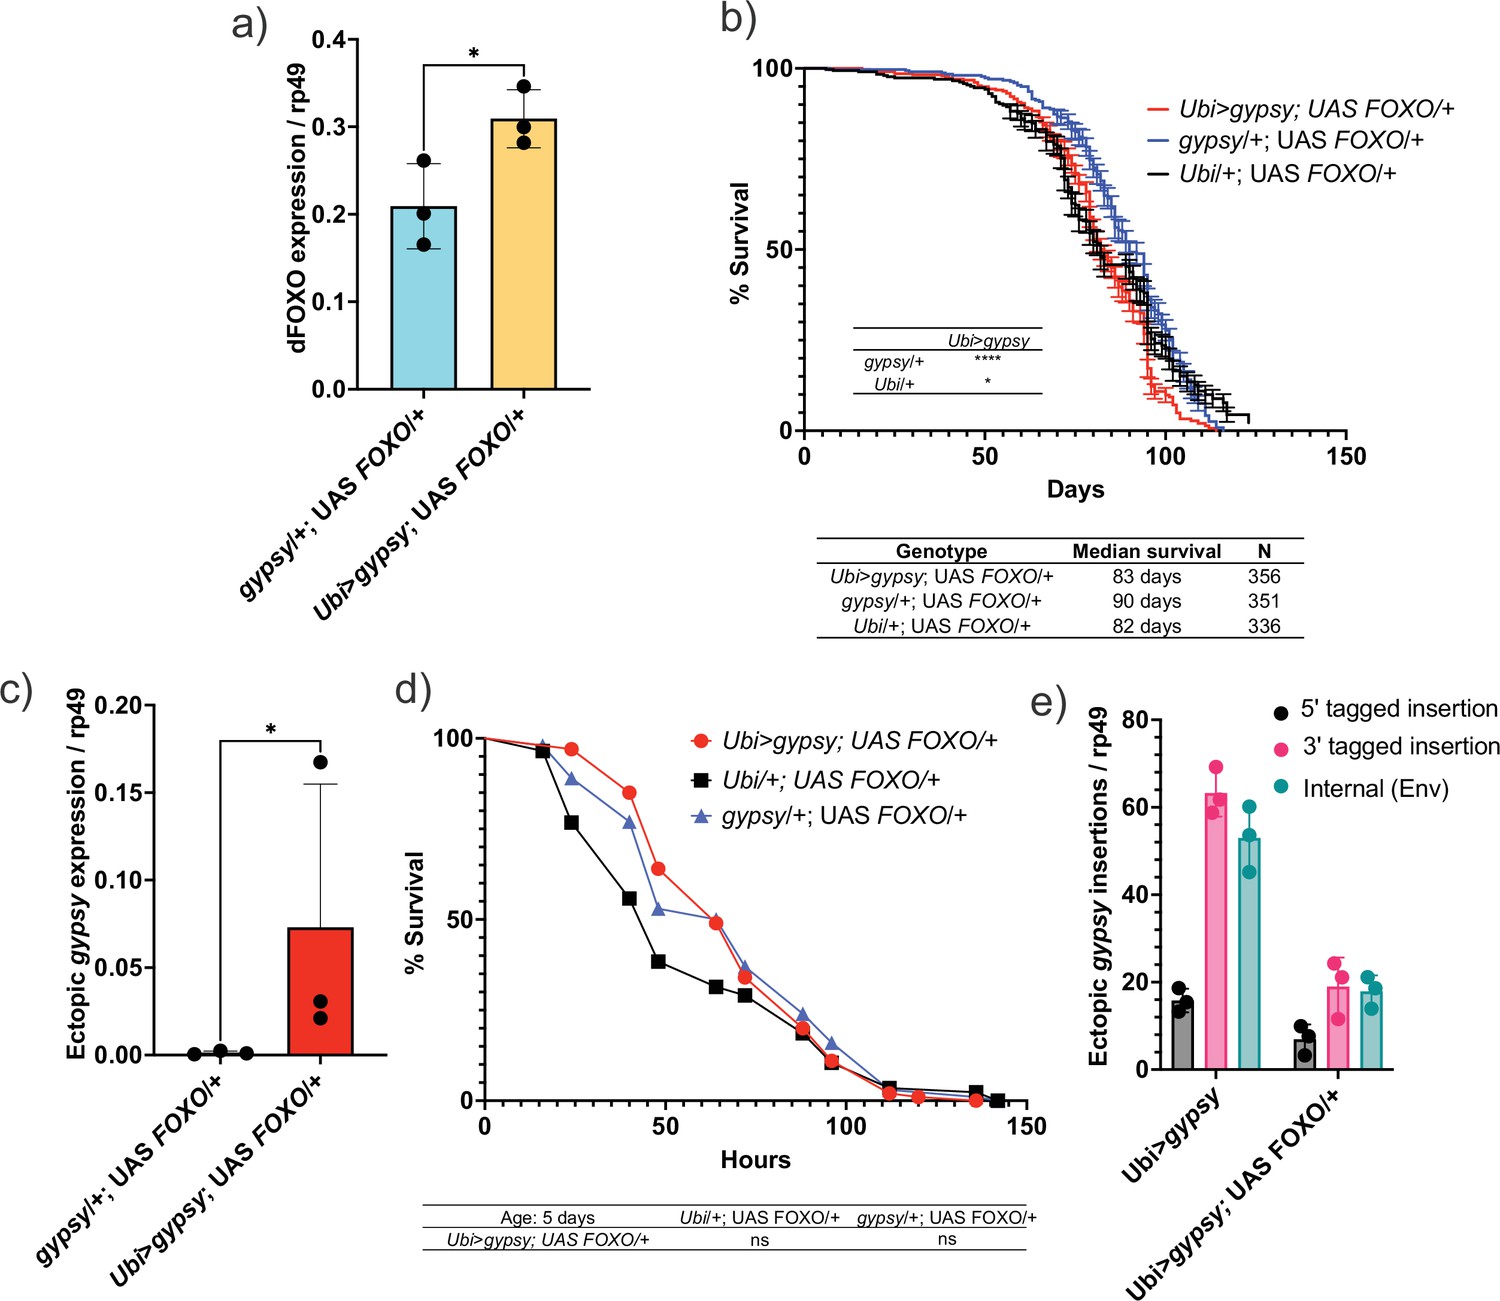
Increasing Forkhead-box O family (FOXO) activity can rescue longevity effect.
(a) dFOXO exon 8 is detected. RT-qPCR of 5-day-old males. Data are represented as means ± SD (three biological replicates, each dot is a pool of five flies). One-tailed t-test, *p-value=0.021. (b) Survival curves of male flies expressing gypsy and dFOXO under the control of Ubiquitin GAL4 (red line) and the parental controls: Ubi/+; UAS-FOXO/+ (black) and gypsy/+; UAS-FOXO/+ (blue). Data represents two biological replicates, error bars SE. *p-value=0.018, p-value<0.0001, log-rank test. (c) 3′ end of ectopic gypsy transcript is detected. RT-qPCR of 5-day-old males. Data are represented as means ± SD (three biological replicates, each dot is a pool of five flies) One-tailed Mann–Whitney test, *p-value=0.05. (d) Survival curves of male flies exposed to 20 mM paraquat expressing gypsy and dFOXO under the control of Ubiquitin GAL4 (red line) and the parental controls: Ubi/+; UAS-FOXO/+ (black) and gypsy/+; UAS-FOXO/+ (blue). Log-rank test result for curve comparisons is shown below the curve; Ubi>gypsy; UAS FOXO/+n = 100, Ubi/+; UAS FOXO/+n = 86, gypsy/+; UAS FOXO/+n = 100. (e) gDNA qPCR of male flies at 14 days. Data for 14-day Ubi>gypsy from Figure 5 are replotted for comparison. Data are represented as means ± SD (three biological replicates, each dot is a pool of 10 flies).
Author response image 1
Tables
Table 1
Primers for next-generation sequencing.
| MB2640 | Biotin-GTGAGGGTTAATTCTGAGCTTGGC |
| MB1192 | Phos-AGATCGGAAGAGCACACGTCTGA-3′ amino blocked |
| MB1019 | TCAGACGTGTGCTCTTCCGATCT |
| MB2669 | CCTACACGACGCTCTTCCGATCTNNNTTCTTCGCGTGGAGCGTTGA |
| MB583 | AATGATACGGCGACCACCGAGATCTACACTCTTTCCCTACACGACGCTCTTCCGATCT |
| MB2673 | CAAGCAGAAGACGGCATACGAGATTCCGAAACGTGACTGGAGTTCAGACGTGTGCTCTTCCGATCT |
| MB2674 | CAAGCAGAAGACGGCATACGAGATTACGTACGGTGACTGGAGTTCAGACGTGTGCTCTTCCGATCT |
| MB2675 | CAAGCAGAAGACGGCATACGAGATATCCACTCGTGACTGGAGTTCAGACGTGTGCTCTTCCGATCT |
Key resources table
| Reagent type (species) or resource | Designation | Source or reference | Identifiers | Additional information |
|---|---|---|---|---|
| Strain, strain background (Drosophila melanogaster) | Wildtype control; wt; wDAH | Doi: 10.1111/j.1474-9726.2011.00707.x; Slack et al., 2011 | ||
| Strain, strain background (D. melanogaster) | w1118 | Kadener Lab, Brandeis University | ||
| Genetic reagent (D. melanogaster) | dFOXO null; wDAH ∆94; dFOXO deletion animals | Bloomington Drosophila Stock Center | BDSC: 42220 | |
| Genetic reagent (D. melanogaster) | UAS-gypsy TAG; UAS-gypsy | This paper | See ‘Fly stocks, D. melanogaster husbandry, and constructs’ | |
| Genetic reagent (D. melanogaster) | UAS-ΔRT; RT deletion | This paper | See ‘Fly stocks, D. melanogaster husbandry, and constructs’ | |
| Genetic reagent (D. melanogaster) | Ubi-Gal4 | Bloomington Drosophila Stock Center | BDSC: 32551 | |
| Genetic reagent (D. melanogaster) | UAS-FOXO | Bloomington Drosophila Stock Center | BDSC: 42221 | |
| Sequence-based reagent | Tag-Provirus junction_F | This paper | PCR primers | GCCAAGCTCAGAATTAACCC |
| Sequence-based reagent | Tag-Provirus junction_R | This paper | PCR primers | TGGTGGGTTCAGATTGTTGG |
| Sequence-based reagent | gypsy env – Tag_F | This paper | PCR primers | TACAGCGCACCATCGATACT |
| Sequence-based reagent | gypsy env – Tag_R | This paper | PCR primers | GTGAGGGTTAATTCTGAGCTTG |
| Sequence-based reagent | gypsy env_F | This paper | PCR primers | CTCTGCTACACCGGATGAGT |
| Sequence-based reagent | gypsy env_R | This paper | PCR primers | AGTATCGATGGTGCGCTGTA |
| Sequence-based reagent | Rp49_F | This paper | PCR primers | CCACCAGTCGGATCGATATGC |
| Sequence-based reagent | Rp49_R | This paper | PCR primers | CTCTTGAGAACGCAGGCGACC |
| Sequence-based reagent | FOXO_F | This paper | PCR primers | CACGGTCAACACGAACCTGG |
| Sequence-based reagent | FOXO_R | This paper | PCR primers | GGTAGCCGTTTGTGTTGCCA |
| Sequence-based reagent | Primers for NGS | This paper | See Table 2 | |
| Commercial assay or kit | TruSeq RNA Library Prep Kit v2 | Illumina | RS-122-2001 | |
| Chemical compound, drug | Tri Reagent | Molecular Research Center | TR 118 | |
| Chemical compound, drug | Paraquat | Sigma | 856177-1G | |
| Software, algorithm | FASTQ Groomer | Galaxy web platform (usegalaxy.org) | See ‘Bioinformatics’ | |
| Software, algorithm | FastQC | Galaxy web platform (usegalaxy.org) | See ‘Bioinformatics’ | |
| Software, algorithm | RNA STAR aligner | Galaxy web platform (usegalaxy.org) | See ‘Bioinformatics’ | |
| Software, algorithm | Trimmomatic | Galaxy web platform (usegalaxy.org) | See ‘Insertion mapping’ | |
| Software, algorithm | Barcode Splitter | Galaxy web platform (usegalaxy.org) | See ‘Insertion mapping’ | |
| Software, algorithm | cutadapt | Galaxy web platform (usegalaxy.org) | See ‘Insertion mapping’ | |
| Software, algorithm | Bowtie2 | Galaxy web platform (usegalaxy.org) | See ‘Insertion mapping’ | |
| Software, algorithm | DEBrowser | Kucukural et al., 2019 | See ‘Bioinformatics’ | |
| Software, algorithm | weblogo3 | Crooks et al., 2004 | See ‘Insertion mapping’ | |
| Software, algorithm | GraphPad Prism | GraphPad Software | Version 9.4.0 | |
| Software, algorithm | MATLAB: Vecsey’s SCAMP | MathWorks, Donelson et al., 2012 | ||
| Other | M-270 Dynabeads | Thermo Fisher | Cat# 65305 | Magnetic resin |
| Other | NextSeq 500 | Illumina | Cat# SY-415-1001 | Illumina sequencing platform reagents |
| Other | D. melanogaster genome (dm6) | Galaxy web platform (usegalaxy.org) | See ‘Bioinformatics’ | |
| Other | TE consensus FASTA | TIDAL Database, Rahman et al., 2015 | See ‘Bioinformatics’ | |
| Other | Flybase genespan | Flybase.org Genome Browser | See ‘Insertion mapping’ | |
| Other | Intron annotation for Ensembl | Ensembl | intron_annotation_Drosophila_ ensemblv84.bed | See ‘Insertion mapping’ |
Table 2
Primers.
| Target | Forward | Reverse |
|---|---|---|
| Tag-Provirus junction | GCCAAGCTCAGAATTAACCC | TGGTGGGTTCAGATTGTTGG |
| gypsy env – Tag | TACAGCGCACCATCGATACT | GTGAGGGTTAATTCTGAGCTTG |
| gypsy env | CTCTGCTACACCGGATGAGT | AGTATCGATGGTGCGCTGTA |
| Rp49 | CCACCAGTCGGATCGATATGC | CTCTTGAGAACGCAGGCGACC |
| FOXO | CACGGTCAACACGAACCTGG | GGTAGCCGTTTGTGTTGCCA |
Additional files
-
Supplementary file 1
Total transposable element (TE) expression in wildtype (wDAH) flies.
- https://cdn.elifesciences.org/articles/80169/elife-80169-supp1-v2.docx
-
Supplementary file 2
Total transposable element (TE) expression in dFOXO null (∆94) flies.
- https://cdn.elifesciences.org/articles/80169/elife-80169-supp2-v2.docx
-
MDAR checklist
- https://cdn.elifesciences.org/articles/80169/elife-80169-mdarchecklist1-v2.pdf
Download links
A two-part list of links to download the article, or parts of the article, in various formats.
Downloads (link to download the article as PDF)
Open citations (links to open the citations from this article in various online reference manager services)
Cite this article (links to download the citations from this article in formats compatible with various reference manager tools)
Artificially stimulating retrotransposon activity increases mortality and accelerates a subset of aging phenotypes in Drosophila
eLife 11:e80169.
https://doi.org/10.7554/eLife.80169


