Oncogene expression from extrachromosomal DNA is driven by copy number amplification and does not require spatial clustering in glioblastoma stem cells
- MRC Human Genetics Unit, Institute of Genetics and Cancer, The University of Edinburgh, United Kingdom
- Centre for Regenerative Medicine and Cancer Research UK Edinburgh Centre, Institute for Regeneration and Repair, The University of Edinburgh, United Kingdom
- Centre for Clinical Brain Sciences, University of Edinburgh, United Kingdom
- School of Mathematics, University of Edinburgh, United Kingdom
Figures
Figure 1 with 1 supplement
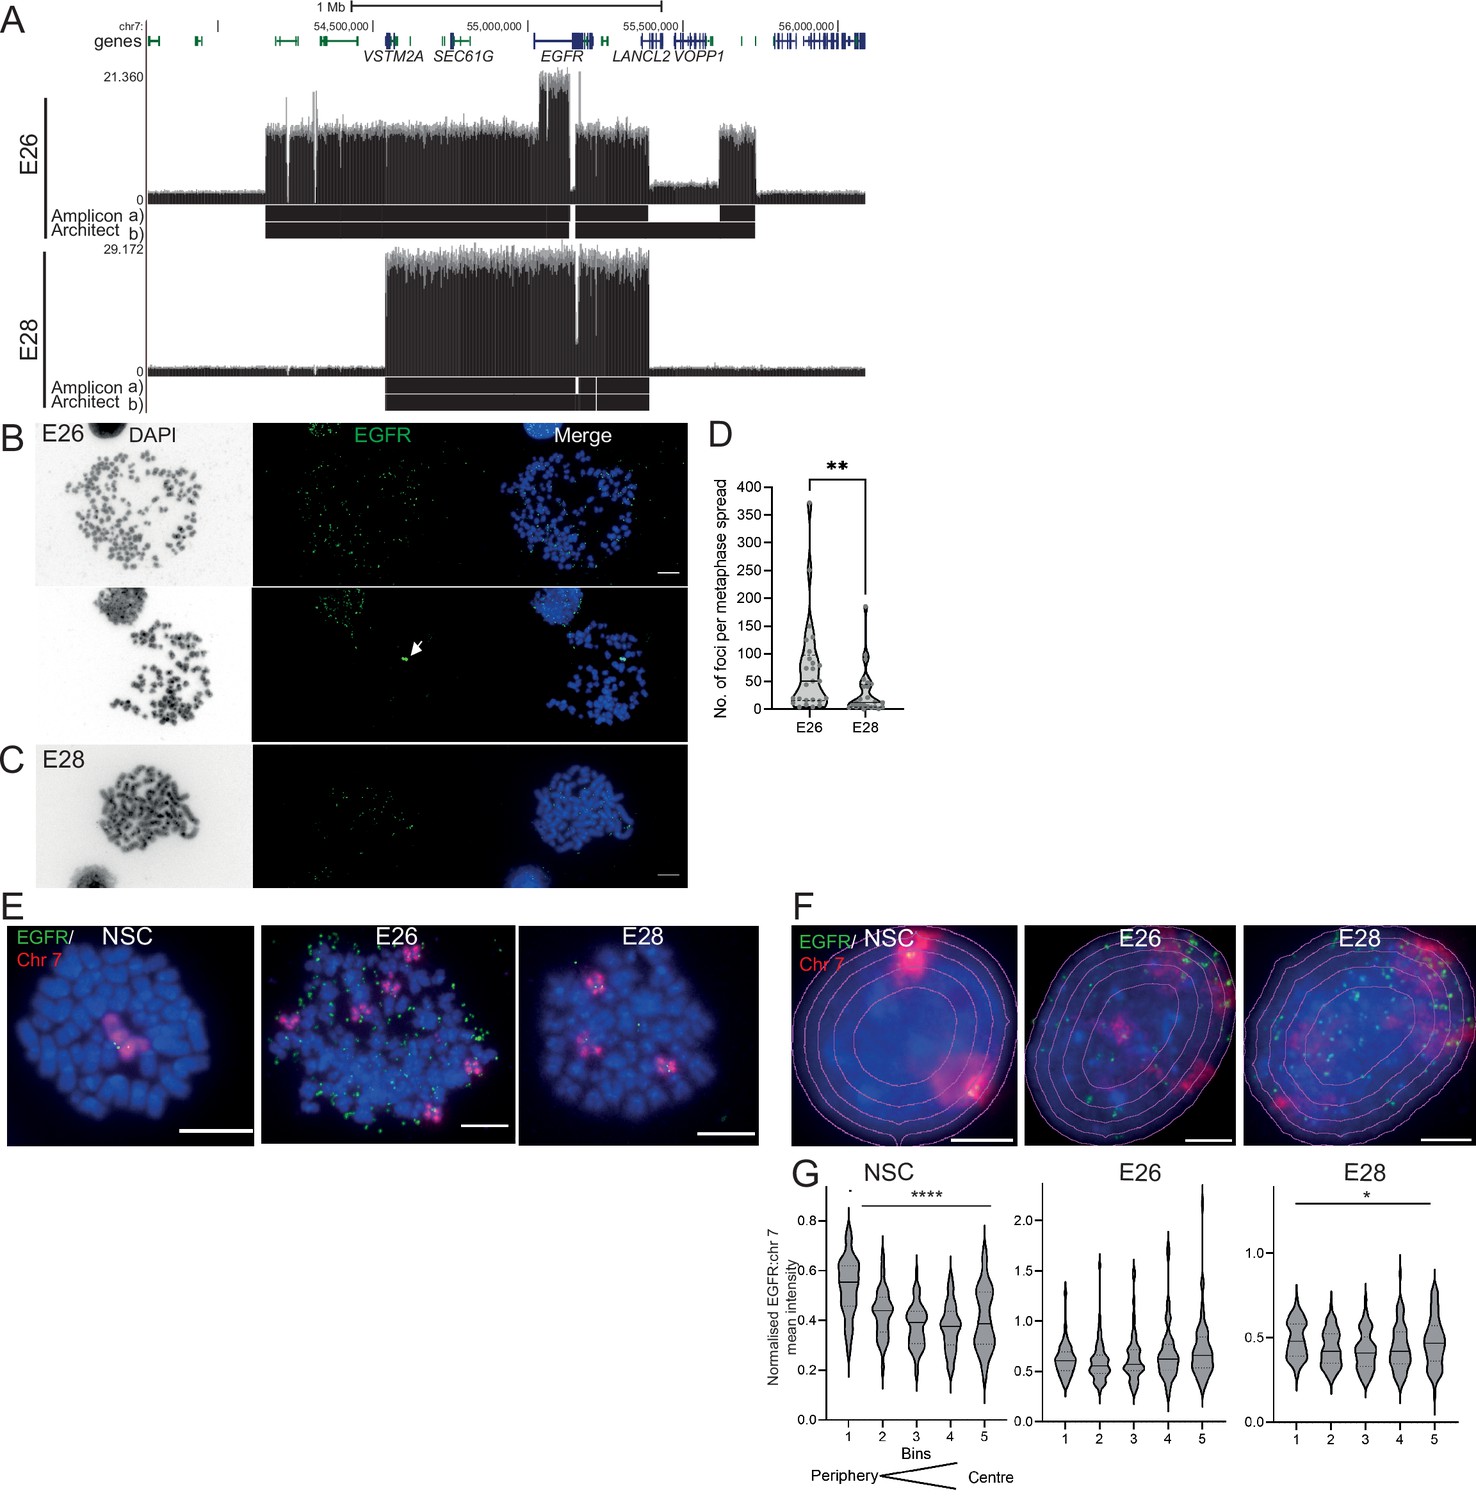
The nuclear localization of extrachromosomal DNA (ecDNA) in glioblastoma (GBM) cell lines.
(A) Whole genome sequencing (WGS) and AmpliconArchitect analysis for ecDNA regions for E26 and E28 cell lines showing an EGFR exon 2–7 deletion in all ecDNA in E26 cells (seen in WGS and AmpliconArchitect regions a and b), and a subpopulation of ecDNA in E28 with a deletion across EGFR exons 7–14 (seen in WGS and Amplicon Architect region a – no deletion in E28 AmpliconArchitect region b). Genome coordinates (bp) are from the hg38 assembly of the human genome. (B) DNA FISH on metaphase spread of the E26 cell line showing EGFR (green) present on ecDNA, and on a homogeneously staining region (HSR) (arrowed) detected in ~10% of metaphases. Scale bar = 10 μm. (C) As for (B) but for the E28 cell line. (D) Violin plot of the number of EGFR DNA FISH signals per metaphase spread of E26 and E28 cells. Median and quartiles are shown. ** p=0.008 (Mann-Whitney test). Median values are 51 (E26)and 12 (E28), n=25 (E26) and 24 (E28) spreads. (E and F) Representative DNA FISH images of metaphase spread (E) and 2D nuclei (F) for neural stem cell (NSC), E26, and E28 cells showing signals for chromosome 7 (red) and EGFR (green). Blue = DNA (DAPI). Scale bar = 10 μm. The five erosions bins from the periphery to the centre of the nucleus are shown in F. (G) EGFR FISH signal intensity normalized to that for chromosome 7 (EGFR:Chr7 Mean Intensity) across five bins of equal area eroded from the peripheral (Bin 1) to the centre (Bin 5) of the nucleus for NSC, E26, and E28 cell lines. Median and quartiles shown. **** p<0.0001, * p<0.05. Kruskall-Wallis test. EGFR and chr7 signal normalized to DAPI shown in Figure 1—figure supplement 1. n=66 (NSC), 59 (E26), 64 (E28) nuclei. Statistical data relevant for this figure are in Figure 1—source data 1.
-
Figure 1—source data 1
Statistical data for Figure 1 and Figure 1—figure supplement 1.
Median values for number of EGFR DNA FISH signals per metaphase spread for E26 and E28 cell lines. Data are for Figure 1D. Mean Chr7 (Texas Red) and EGFR (FITC) DNA FISH signal intensity in bins eroded from the periphery (1) to the centre (5) of the nucleus of neural stem cell (NSC), E26 and E28 cells. p-Values from Kruskall-Wallis test. Data are for Figure 1G and Figure 1—figure supplement 1.
- https://cdn.elifesciences.org/articles/80207/elife-80207-fig1-data1-v3.docx
Figure 1—figure supplement 1
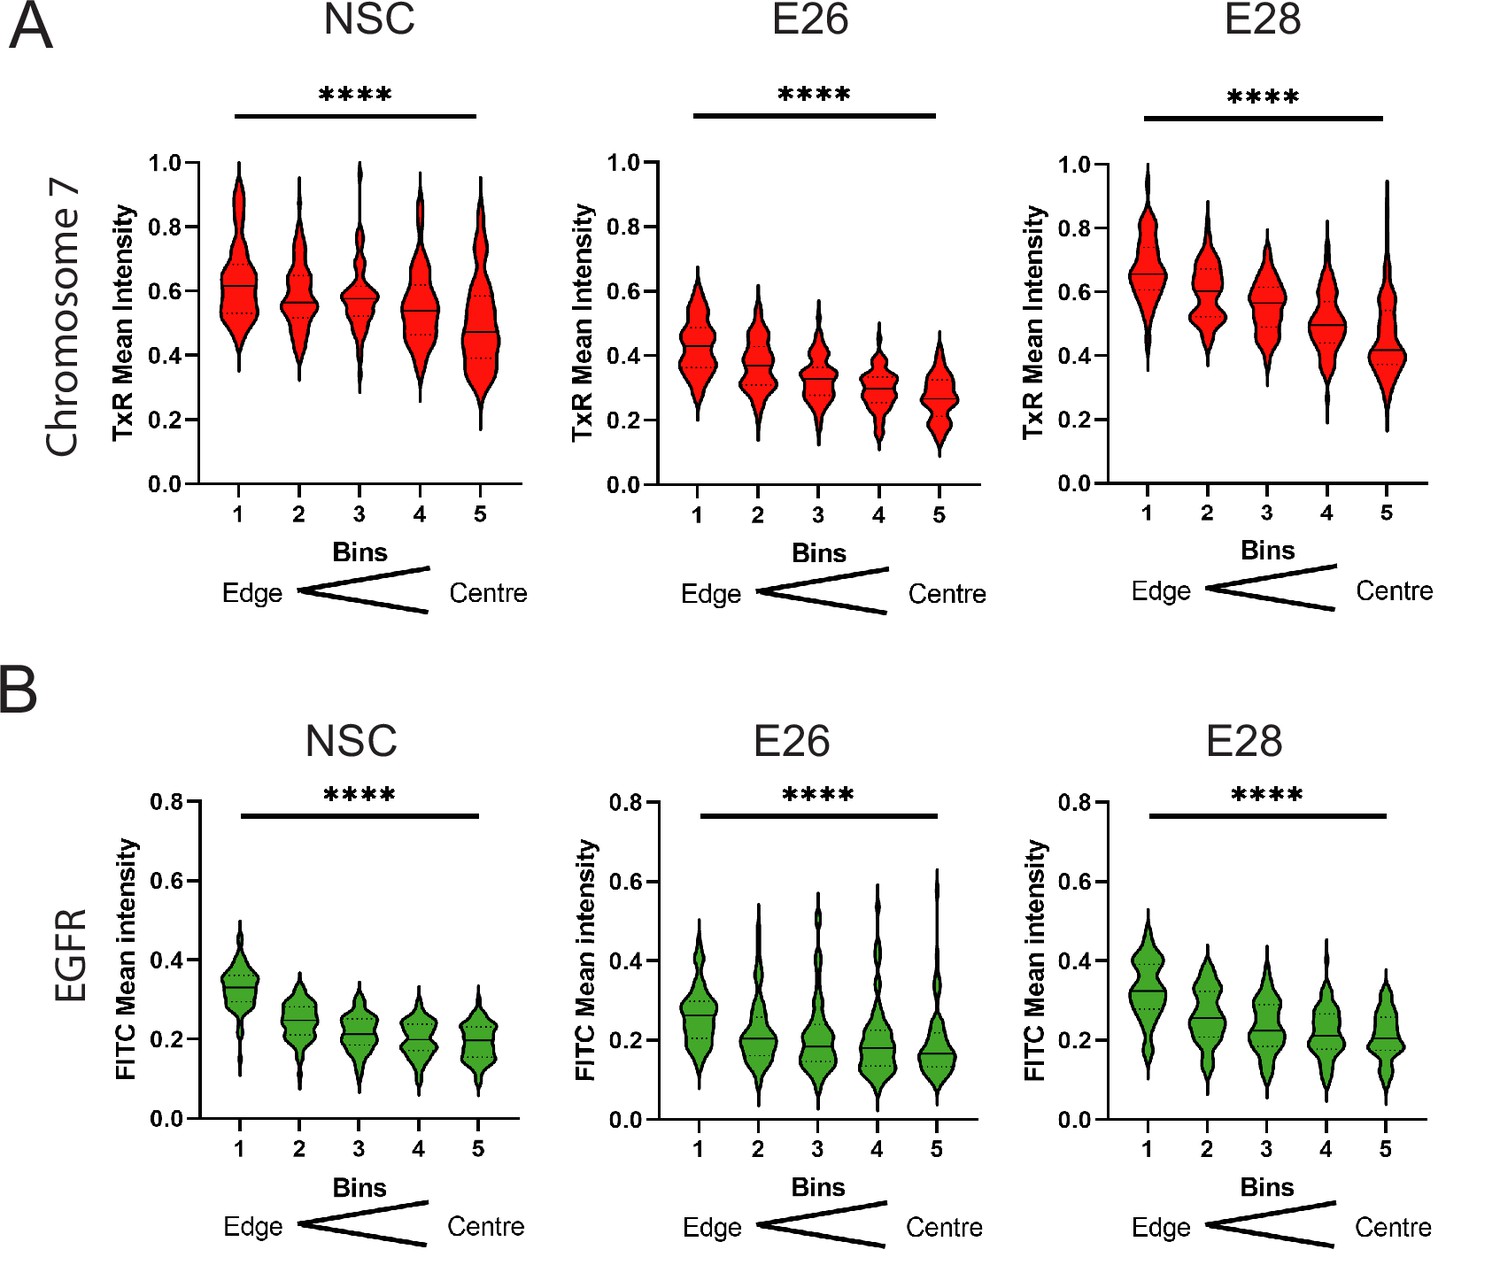
Additional EGFR and chromosome 7 signal intensity data.
Radial distribution, normalized to DAPI, across bins of equal area eroded from the edge (1) to the centre (5) of the nucleus for (A) chromosome 7 (TxR mean normalized intensity per nucleus) or (B) EGFR (FITC mean normalized intensity per nucleus) hybridization signals.
Median and quartiles are shown. Statistical significance was examined by Kruskall-Wallis. **** p<0.0001. Statistical data relevant for this figure are in Figure 1—source data 1.
Figure 2 with 1 supplement
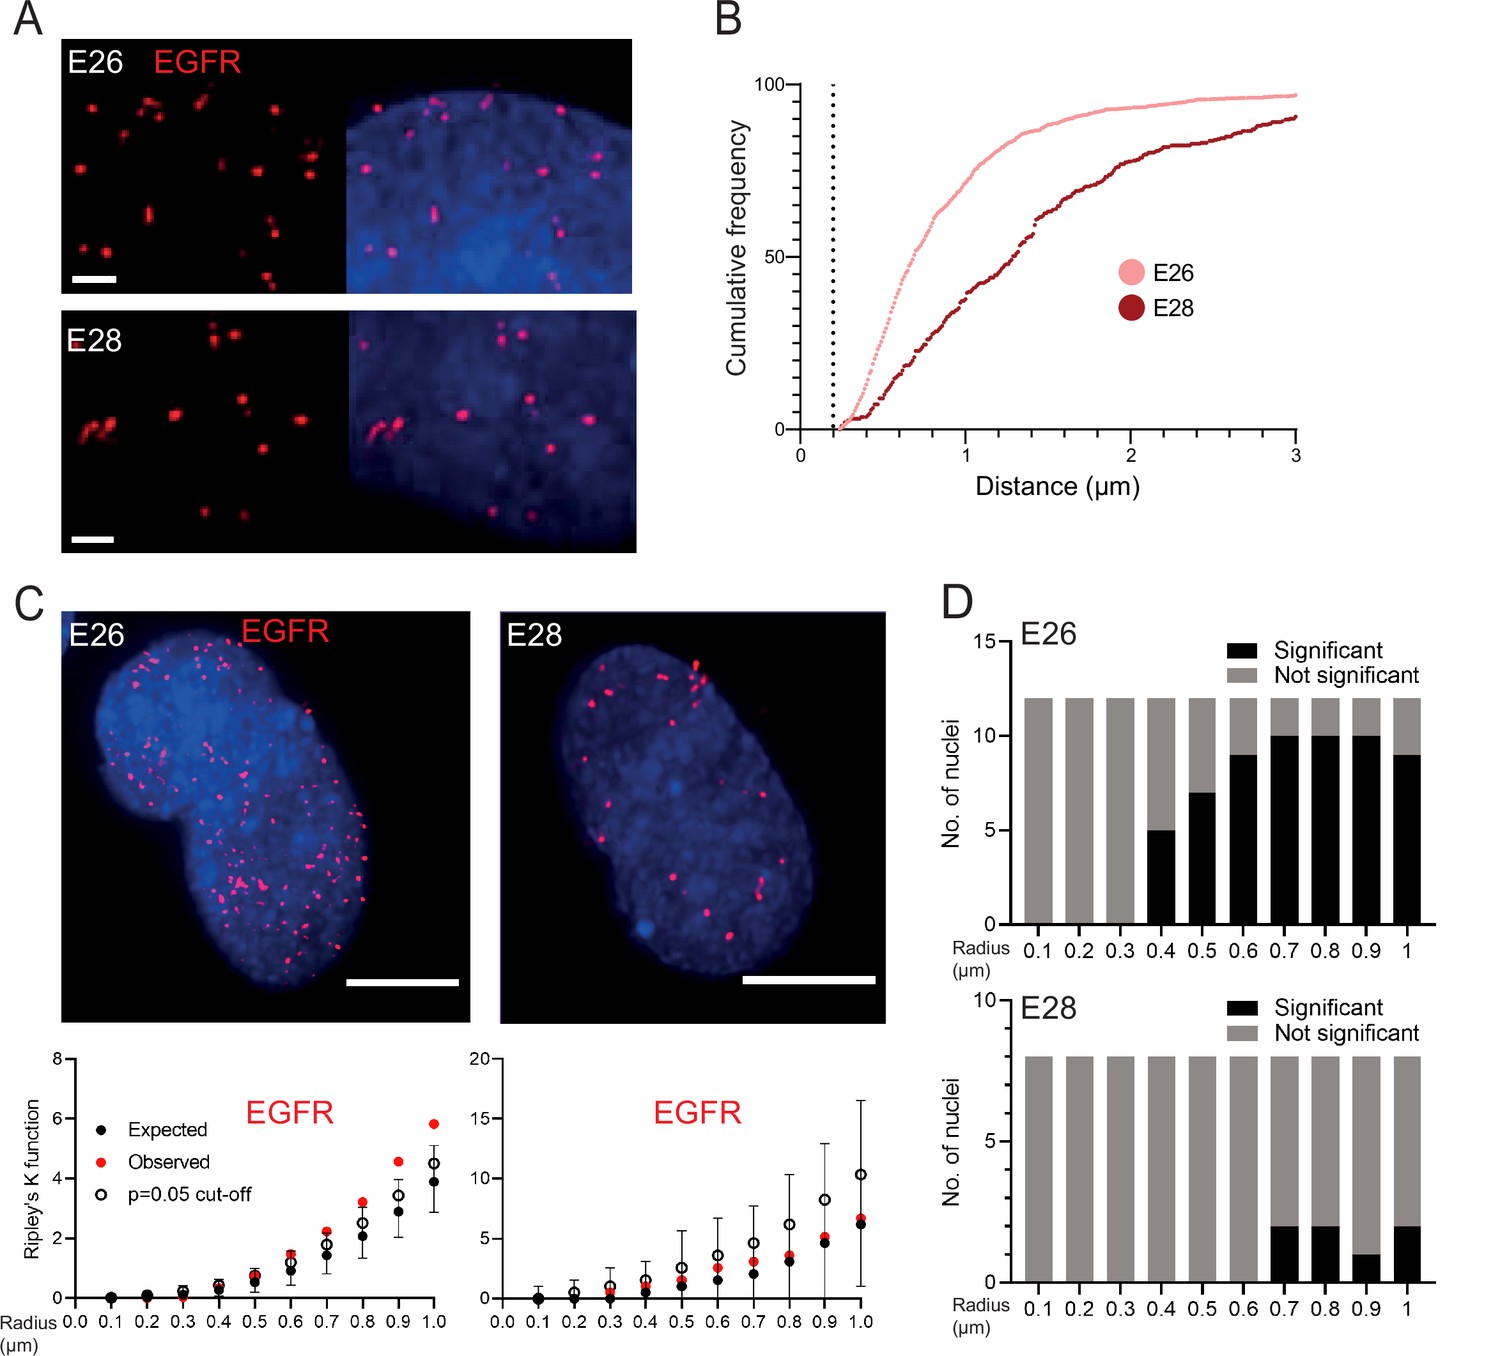
EGFR-containing extrachromosomal DNA (ecDNA) do not cluster in the nucleus.
(A) Representative images shown as maximum intensity projection of DNA FISH for EGFR (red) in the nuclei of E26 (top) and E28 (bottom) glioblastoma (GBM) cell lines, scale bar = 1 μm. (B) Cumulative frequency distribution of shortest EGFR-EGFR distances between all foci in each nucleus across all E26 (n=37) and E28 (n=36) nuclei. Dotted line = 200nm. (C) (Top) Representative maximum intensity projection images of EGFR DNA FISH (red) in nuclei of E26 and E28 cells (blue=DNA). Scale bar = 5 μm. (Bottom) Associated 3D Ripley’s K function for these nuclei showing observed K function (red), max/min/median (black) of 10,000 null samples with p=0.05 significance cut-off shown (empty black circle). (D) Ripley’s K function for EGFR DNA FISH signals showing number of E26 (n=12) and E28 (n=8) nuclei with significant and non-significant clustering at each given radius. p-values were calculated using Neyman-Pearson lemma with optimistic estimate p-value where required (see Materials and methods), and Benjamini-Hochberg procedure (BHP, FDR = 0.05).
-
Figure 2—source data 1
Statistical data for Figure 2—figure supplement 1.
Statistical analysis of data for Figure 2—figure supplement 1B-E. Mean shortest interprobe distance and shortest interprobe distance in E26 and E28 cell lines. EGFR-EGFR interprobe distance (μm) = median values shown. The statistical significance of the data distributions between E26 and E28 were assessed with a Mann-Whitney test. n = number of nuclei.
- https://cdn.elifesciences.org/articles/80207/elife-80207-fig2-data1-v3.docx
Figure 2—figure supplement 1
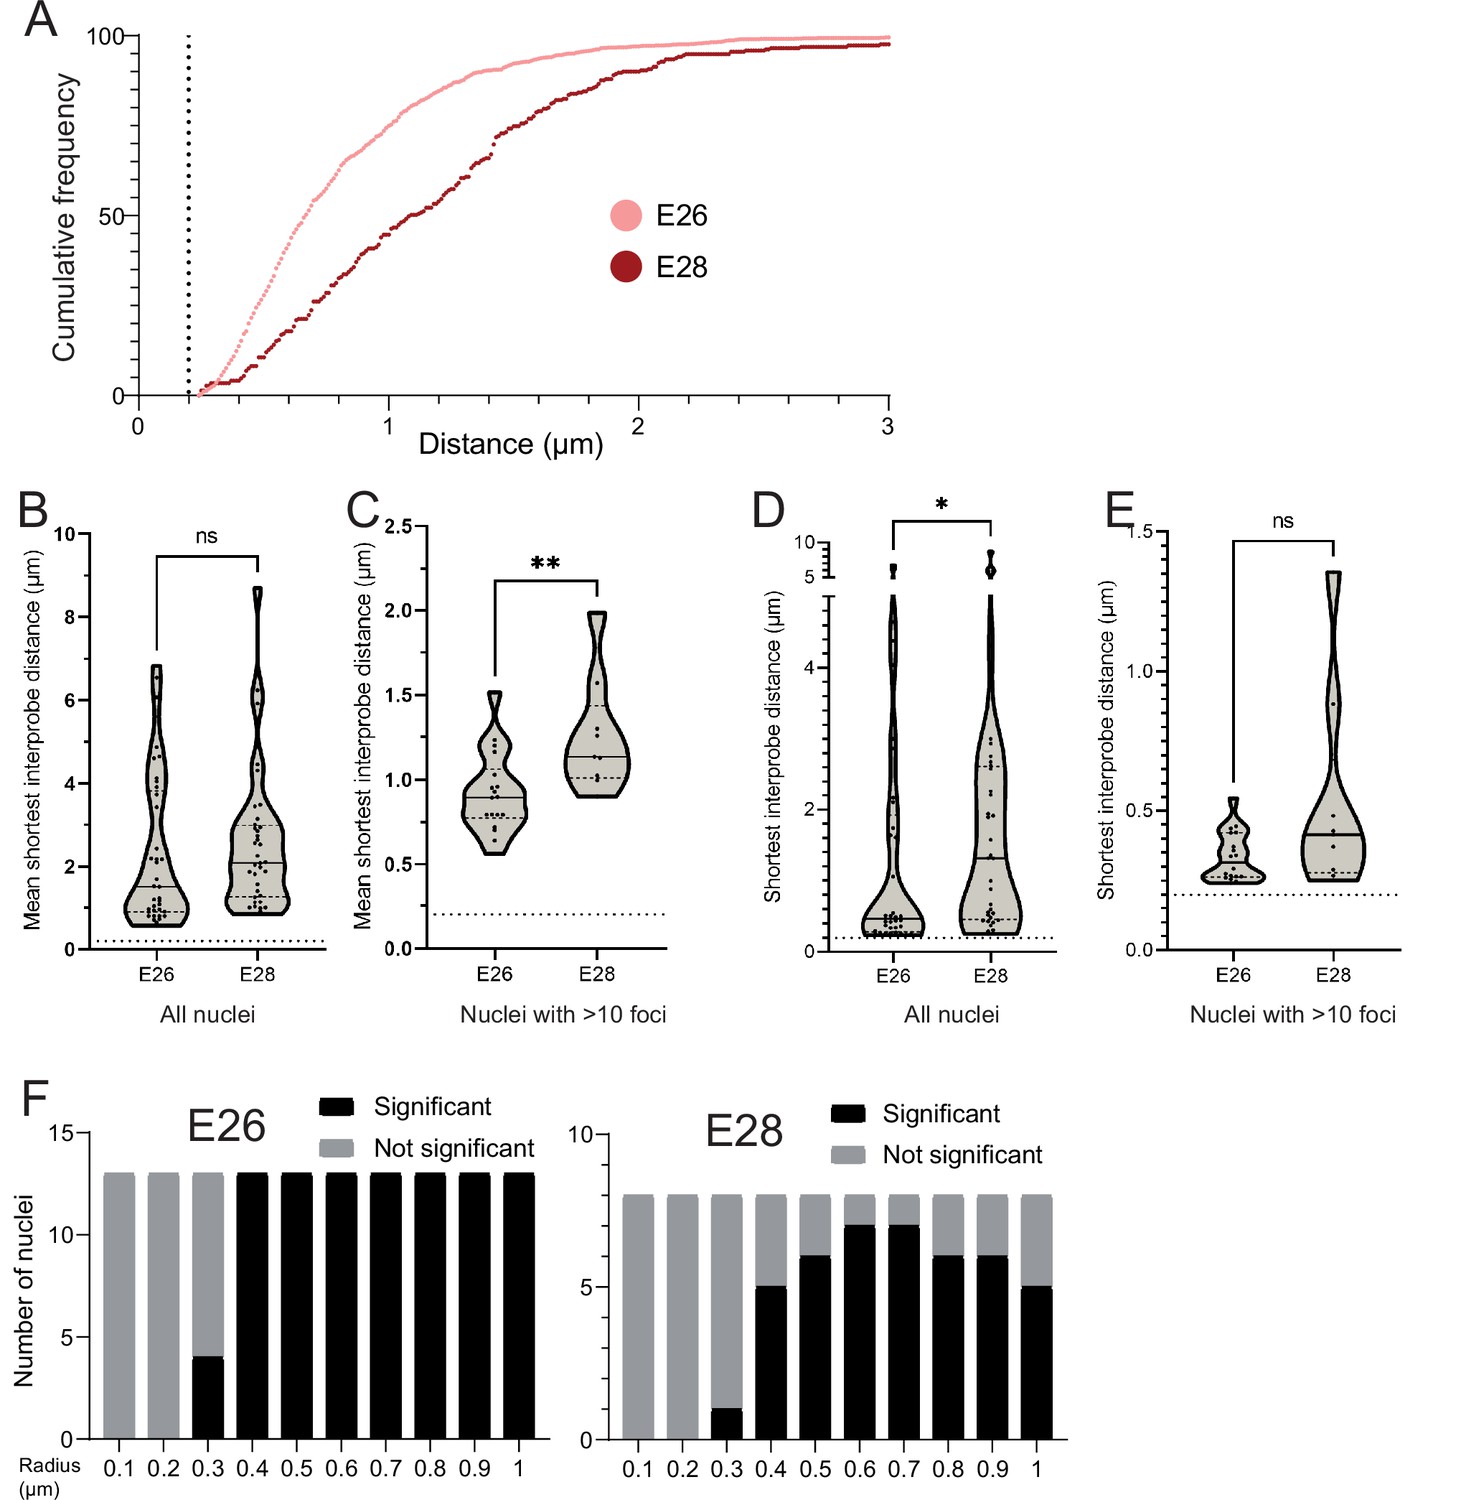
Additional analysis of EGFR-EGFR distances in E26 and E28 cell lines.
(A) Cumulative frequency distribution of shortest EGFR-EGFR distances between all foci in each nucleus across all E26 and E28 nuclei with >10 EGFR foci. (B) Violin plots showing the distribution of mean shortest interprobe distance between EGFR foci per nucleus in E26 and E28 cell lines. Dotted line denotes y=200 nm. Number of nuclei (n): E26 = 37, E28 = 36. (C) As for (B) but only showing nuclei with >10 EGFR foci. Number of nuclei (n): E26 = 18, E28 = 9. (D) As for (B) but for shortest single distance between two EGFR foci in any nucleus. (E) As for (D) but only showing nuclei with >10 EGFR foci. Statistical significance examined by Mann-Whitney test. ns = not significant, * p<0.05, ** p<0.01. Figure 2—source data 1. (F) Ripley’s K function for E26 and E28 nuclei showing number of nuclei with significant and non-significant clustering at each given radius − with spot diameter = 150 nm.
Figure 3 with 2 supplements
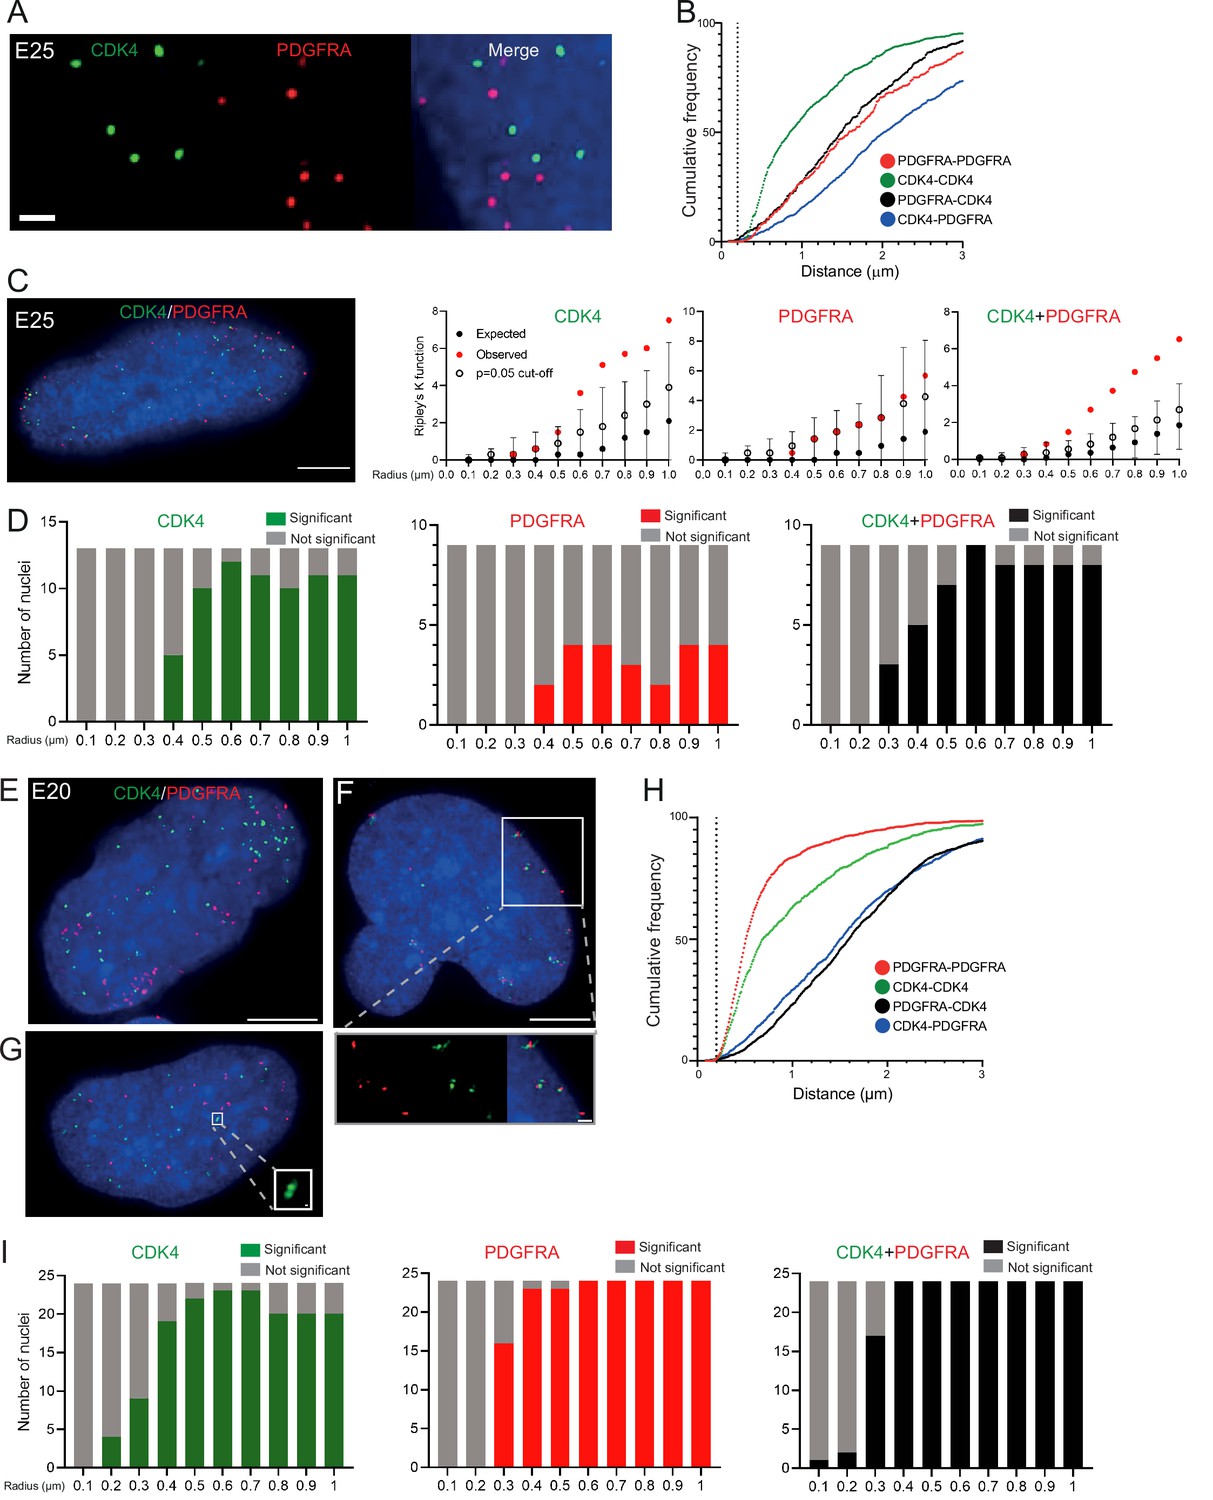
Two separate extrachromosomal DNA (ecDNA) populations do not cluster in the nucleus.
(A) Representative maximum intensity projection images of DNA FISH for CDK4 (green) and PDGFRA (red) in an E25 nucleus. Blue=DNA (DAPI) . Scale bar = 1 μm. (B) Cumulative frequency distribution of shortest interprobe distances (CDK-CDK, PDGFRA-PDGFRA, CDK4-PDGFRA, and PDGFRA-CDK4) between all foci in each nucleus across all E25 nuclei (n=26). (C) (Left) Representative maximum intensity projection image shown of E25 nucleus hybridized with probes for CDK4 (green) and PDGFRA (red). Blue=DNA (DAPI). Scale bar = 5 μm. (Right) Ripley’s K function for this nucleus showing observed K function (red), max/min/median (black) of 10,000 null samples with p=0.05 significance cut-off shown (empty black circle) for CDK4, PDGFRA, and CDK4 and PDGFRA spots combined. (D) Ripley’s K function for E25 nuclei showing number of nuclei with significant and non-significant clustering at each given radius for CDK4 spots (n=13 nuclei), PDGFRA spots (n=9 nuclei), and CDK4 and PDGFRA spots combined (n=9 nuclei). p-values were calculated using Neyman-Pearson lemma with optimistic estimate p-value where required (see Materials and methods), and Benjamini-Hochberg procedure (BHP, FDR = 0.05). Metaphase analysis of E25 cells and Ripley’s K analysis with smaller foci are in Figure 3—figure supplement 1. (E) Representative maximum intensity projection image of E20 interphase nuclei hybridized with probes for CDK4 (green) and PDGFRA (red). Scale bar = 5 μm. (F) As in (E) but for a nucleus where the close association of CDK4 and PDGFA signal in doublets is indicative of ecDNAs harbouring both oncogenes. Scale bar = 1 μm in main panel (G) as in (E) but showing an E20 nucleus with doublets of CDK4 foci. Metaphase analysis of E20 cells with CDK4 and PDGFRA probes in Figure 3—figure supplement 2. (H) As in (B) but for E20 nuclei (n=24) (noting all nuclei shown here harbored >20 foci of each oncogene). (I) As in (D) but for E20 nuclei.
-
Figure 3—source data 1
Statistical data for Figure 3—figure supplement 1.
Median number of CDK4 and PDGFRA DNA FISH foci in E25 cell line (n=26) nuclei. Data are for Figure 3—figure supplement 1B. Mean shortest interprobe distance and shortest interprobe distance between CDK4 and PDGFRA DNA FISH foci in E25 cell line. Statistical analysis of data for Figure 3—figure supplement 1C and D, Interprobe distance (μm) between fosmids indicated = median values shown. Value in brackets indicates adjusted p-value (adj) = Bonferroni. n=26 nuclei.
- https://cdn.elifesciences.org/articles/80207/elife-80207-fig3-data1-v3.docx
Figure 3—figure supplement 1
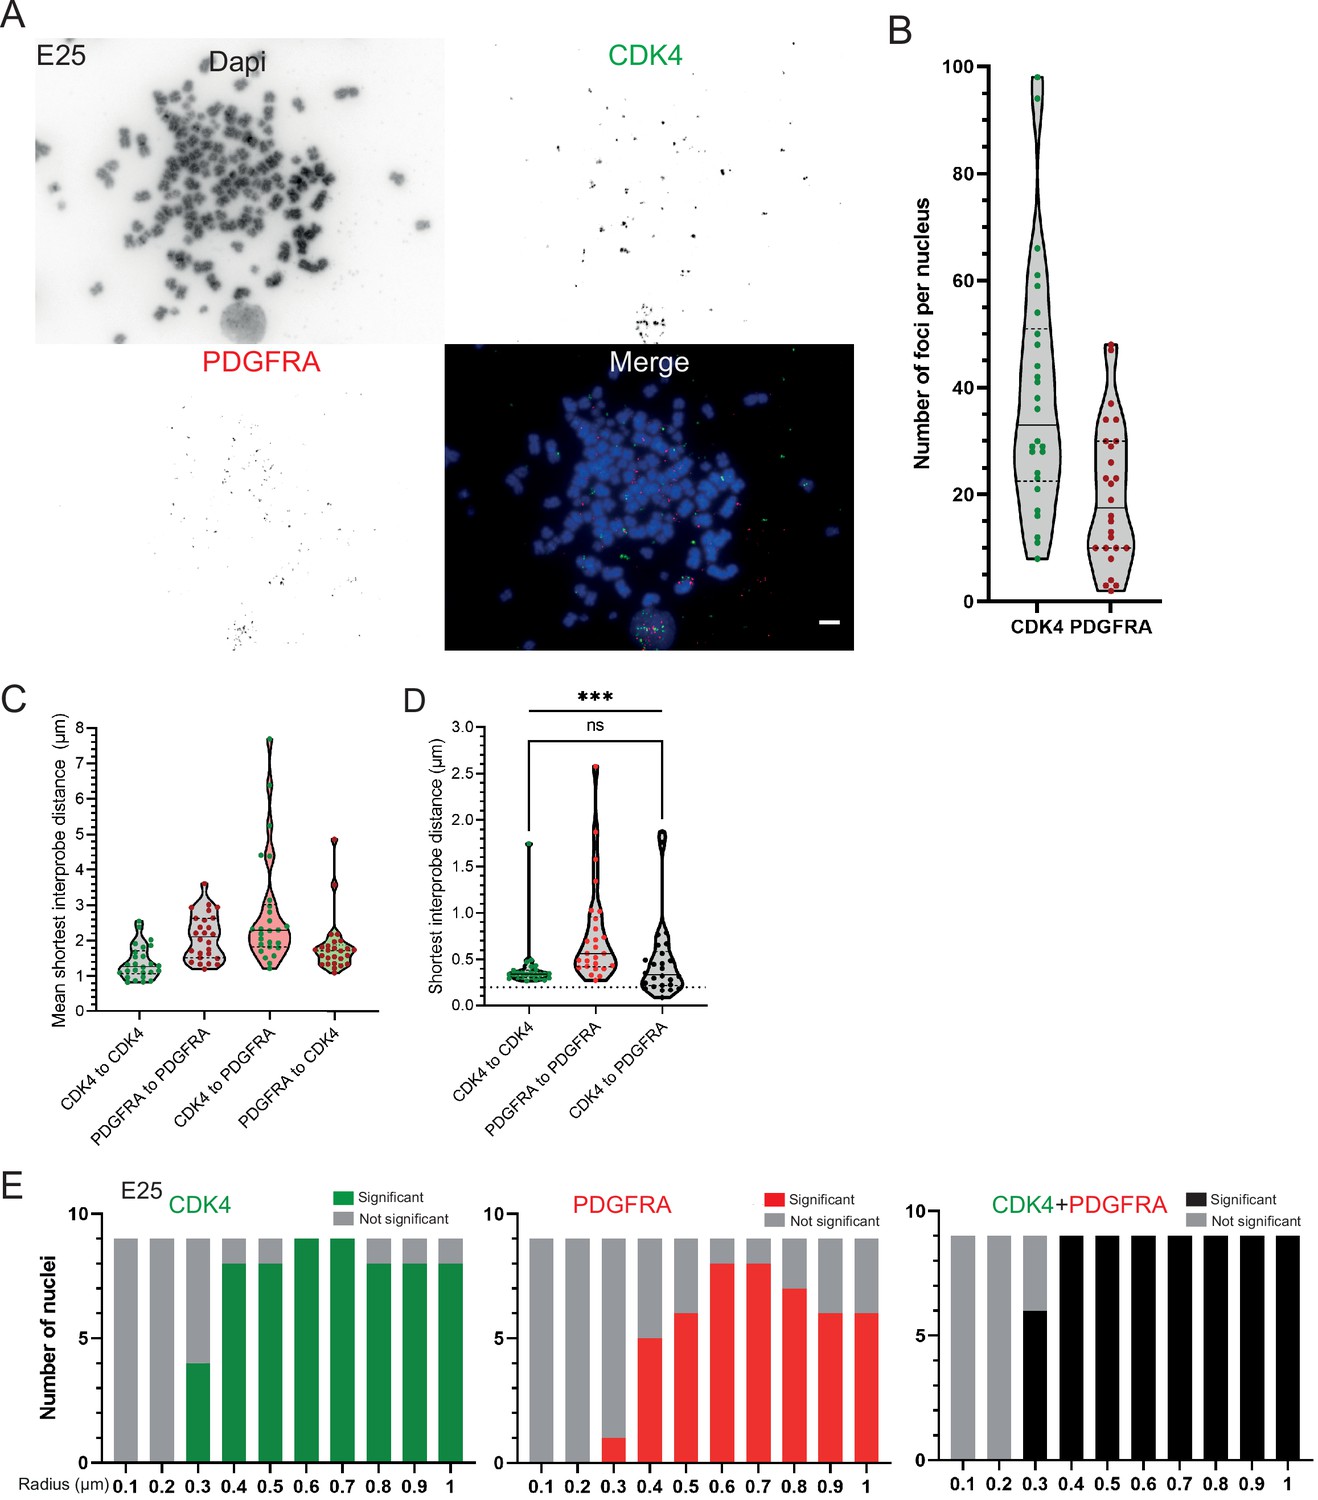
Additional analysis of the distribution of CDK4 and PDGFRA ecDNAs in the E25 cell line.
(A) DNA FISH for CDK4 and PDGFRA on metaphase spreads from the E25 cell line, showing CDK4 and PDGFRA on separate extrachromosomal DNA (ecDNA), scale bar = 5 μm. (B) Number of ecDNA per nucleus in E25 cell line, CDK4 (green) and PDGFRA (red). (C) Violin plots showing distribution of mean shortest distance between CDK4 and PDGFRA foci per E25 nucleus. (D) As for (C) but showing the shortest single interprobe distance measured in any nucleus. Dotted line denotes y=200 nm. Statistical significance examined by Mann-Whitney test (hooked line, ns = not significant) and Kruskall-Wallis (straight line, *** p<0.001). Statistical data are detailed in Figure 3—source data 1. (E) Ripley’s K function for E25 nuclei showing number of nuclei with significant and non-significant clustering at each given radius for CDK4 spots, PDGFRA spots, and CDK4 and PDGFRA spots combined − with spot diameter = 150 nm. All p-values for Ripley’s K function calculated using Neyman-Pearson lemma with optimistic estimate p-value where required, and Benjamini-Hochberg procedure (BHP, FDR = 0.05).
Figure 3—figure supplement 2
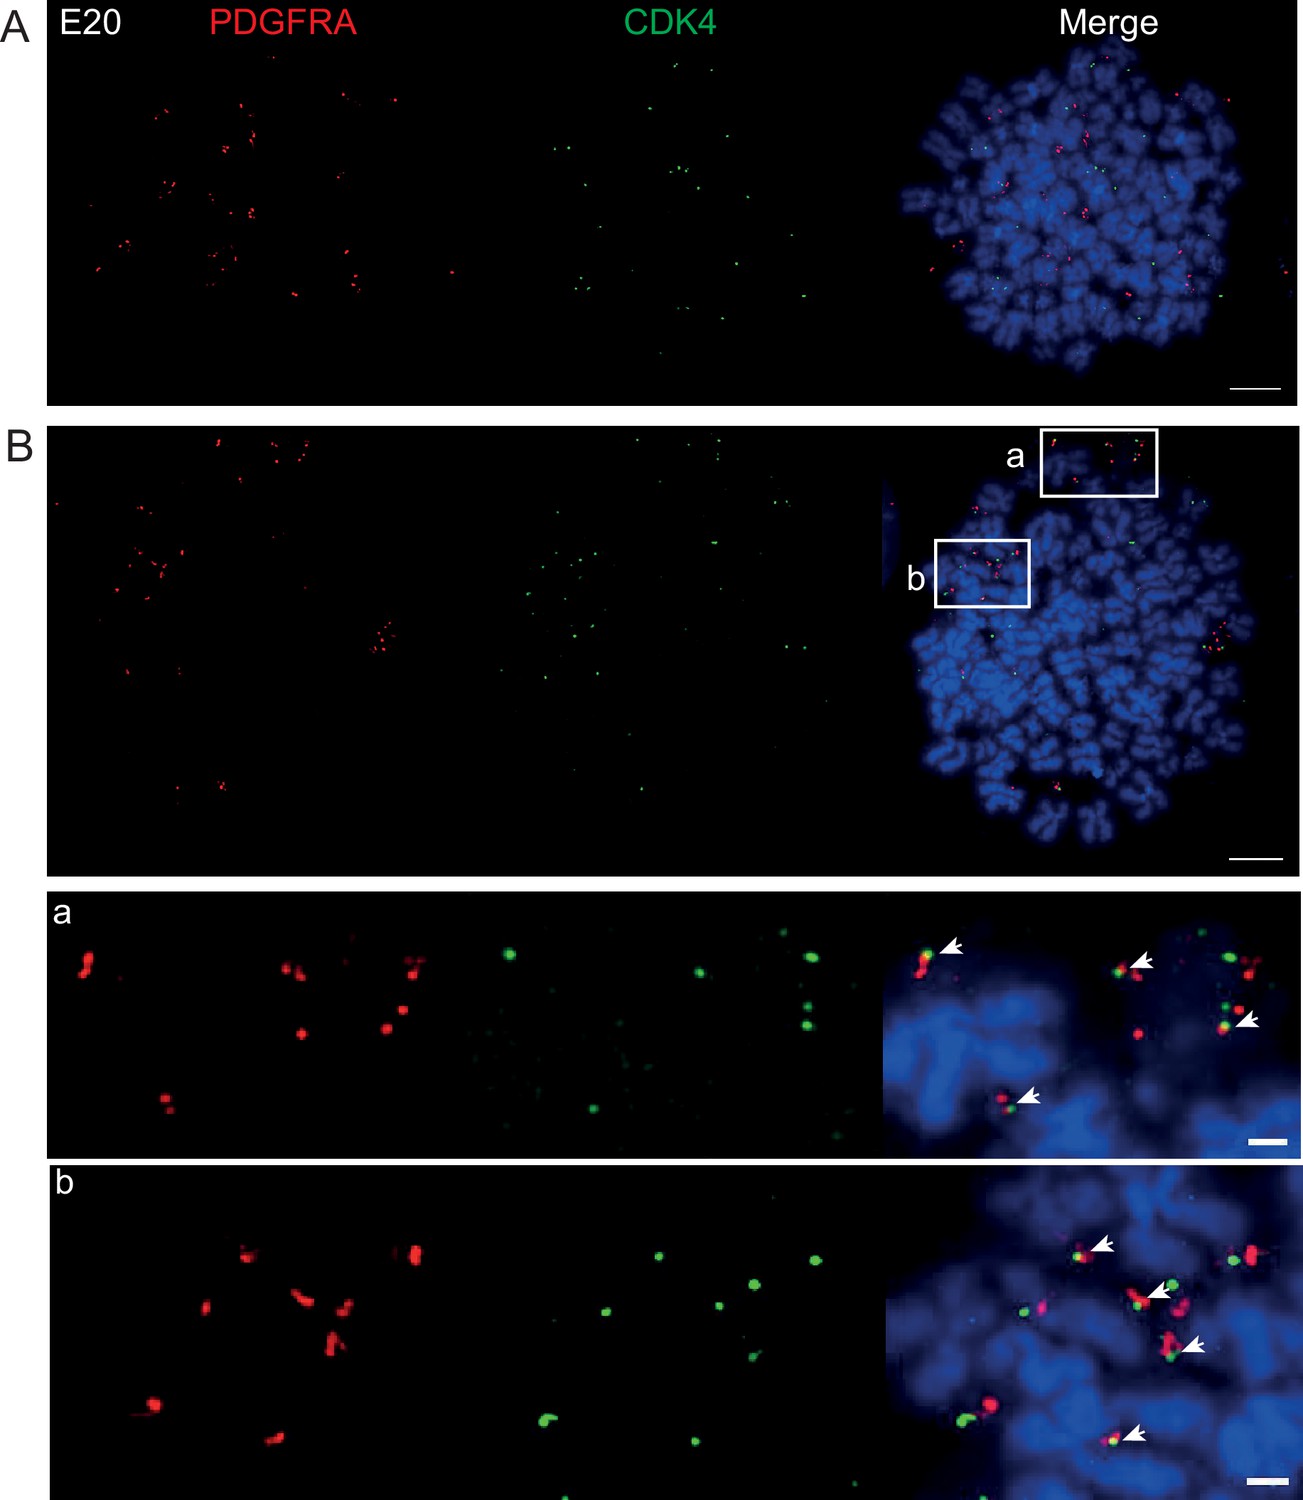
DNA FISH on metaphase spreads of the E20 cell line showing hybridization signal for PDGFRA (red) and CDK4 (green).
Scale bar = 10 μm. (A) Metaphase spread representative of most cells with PDGFRA and CDK4 clearly on separate extrachromosomal DNA (ecDNAs). (B) Metaphase spread showing an example, representative of approximately 10% of cells where PDGFRA and CDK4 of signals are juxtaposed, suggesting that both oncogenes are located on the same ecDNA. Scale bar = 10 μm. Insets a and b are shown zoomed in below (scale bar 1 μm). Note these are representative images of metaphase spreads where both oncogenes were located on ecDNA – we observed many metaphases with primarily CDK4 ecDNA and few/no PDGFRA ecDNA. Subsequent interphase nuclei were therefore only imaged if >20 CDK and >20 PDGFRA foci to ensure ecDNA of both were present, and to allow Ripley’s K analysis.
Figure 4 with 1 supplement
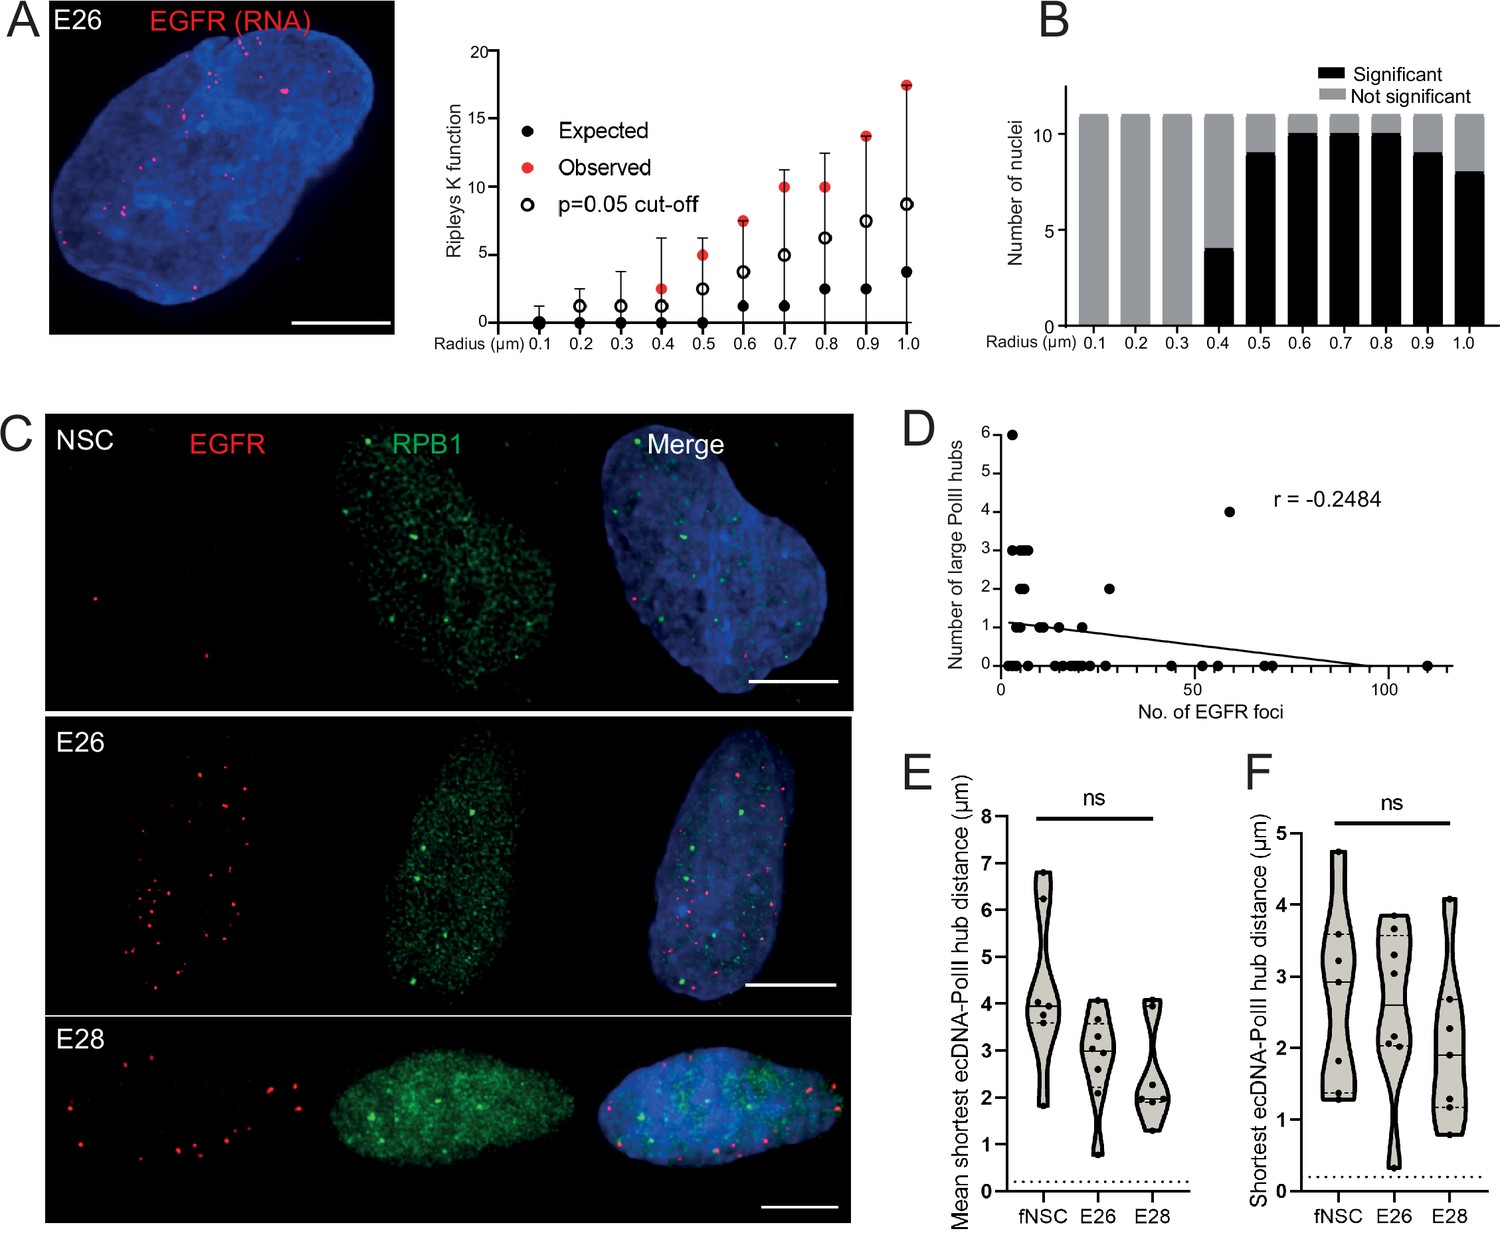
Extrachromosomal DNA (ecDNA) do not colocalize with large foci of the transcriptional machinery.
(A) Representative maximum intensity projection image of nascent EGFR RNA FISH (red) in E26 cell nucleus,(blue=DNA). Scale bar = 5 μm. Associated Ripley’s K function for this nucleus showing observed K function (red), max/min/median (black) of 10,000 null samples with p=0.05 significance cut-off shown (empty black circle). (B) Ripley’s K function for E26 nuclei (n=11) after EGFR nascent RNA FISH showing number of nuclei with significant and non-significant clustering at each given radius. All p-values for Ripley’s K function calculated using Neyman-Pearson lemma with optimistic estimate p-value where required, and Benjamini-Hochberg procedure (BHP, FDR = 0.05). (C) Representative maximum intensity projection images of immunoFISH in neural stem cell (NSC), E26 and E28 cell lines: Immunofluorescence for RPB1 (green) and EGFR DNA FISH (red). Scale bar = 5 μm. (D) Spearman’s correlation between number of EGFR foci and number of RPB1 foci, p = 0.13, E26 and E28 cell line data combined. (E) Violin plot of distribution of mean shortest interprobe distance per nucleus between EGFR foci and PolII foci in NSC (n=7), E26 (n=8) and E28 (n=7) cell lines. (F) As for (E) but for shortest single distance in each nucleus. ns, not significant. Kruskall-Wallis test. Statistical data relevant for this figure are in Figure 4—source data 1.
-
Figure 4—source data 1
Statistical data for Figure 4 and Figure 4—figure supplement 1.
EcDNA-large RPB1 foci distances for neural stem cell (NSC), E26 and E28 cell lines. Statistical analysis of data for DNA-ImmunoFISH (i – Figure 4E and F), RNA-ImmunoFISH (ii – Figure 4—figure supplement 1E F) EcDNA-large RPB1 foci distance (μm) indicated = median values shown. (iii) Median number of EGFR RNA FISH signals for NSC, E26 and E28 cell lines. (iv) Median ecDNA-large POLR2G foci distances for E28 mCherry-POLR2G cell line (Figure 4—figure supplement 1I, J). n = number of nuclei. Kruskall-Wallis and Mann-Whitney tests performed with comparisons as indicated.
- https://cdn.elifesciences.org/articles/80207/elife-80207-fig4-data1-v3.docx
Figure 4—figure supplement 1
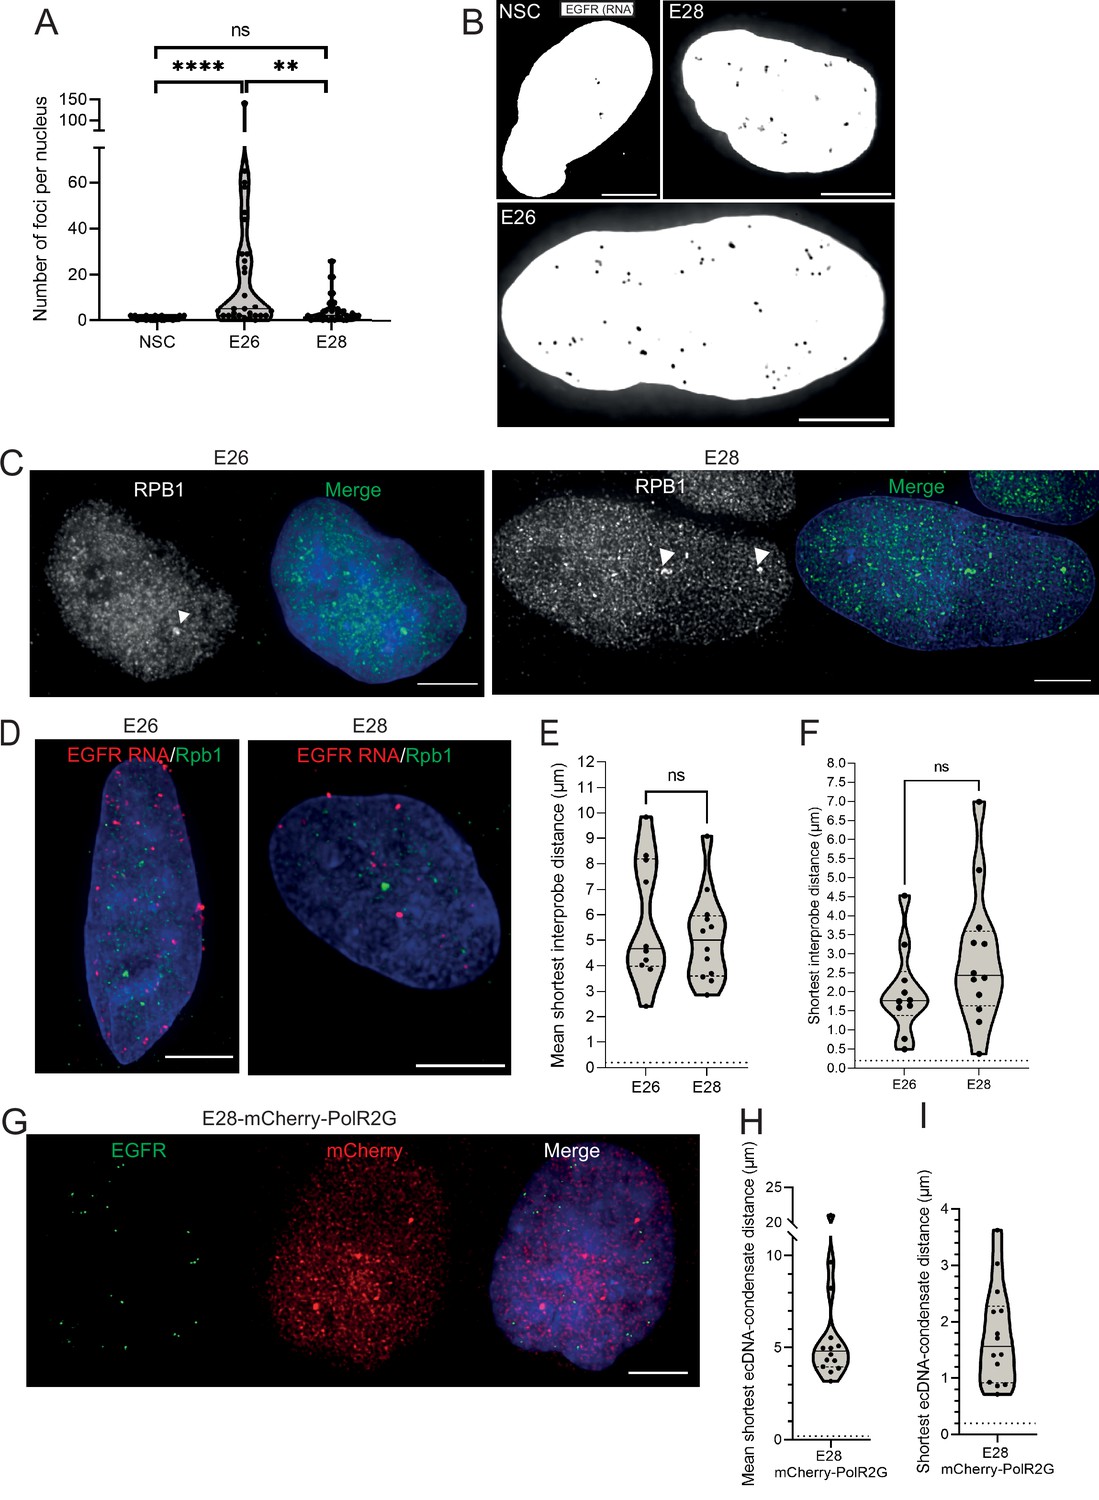
Analysis of sites of EGFR nascent transcription relative to RNA polymerase II in GBM cell lines.
(A) Number of nascent EGFR RNA foci per cell line, at least 25 nuclei of each cell line imaged. Statistical significance examined by Mann-Whitney test. ns = not significant, ** p<0.01, ****p<0.0001 and are detailed in Figure 4—source data 1. (B) Representative images of nascent EGFR RNA FISH (shown in greyscale) in neural stem cell (NSC), E26 and E28 cell lines. MIP, scale bar = 5 μm. (C) Representative images of RNA polymerase II (RPB1) foci (arrow heads) detected by immunofluorescence. Scale bar = 5 μm. (D) Representative images of E26 and E28 nascent RNA immunoFISH for EGFR (red) and RNA polymerase II (PolII) (Rpb1 – green), MIP, scale bar = 5 μm. (E) Mean shortest interprobe distance between EGFR RNA and PolII foci. (F) As for (E) but for shortest distance. Median and quartiles plotted. Dotted line denotes y = 200 nm. Statistical significance examined by Mann-Whitney. ns, not significant. Statistical data relevant for this figure are in Figure 4—source data 1. (G) Representative images of immunoFISH in the E28 mCherry-POL2RG cell line: Immunofluorescence for mCherry and EGFR DNA FISH. Scale bar = 5 μm. (H) Violin plot of mean shortest distance per nucleus between EGFR foci and foci detected by Pol2RG-mCherry fusion. Dotted line denotes y=200 nm. (I) As for (H) but for shortest single distance in each nucleus. n=14 nuclei.
Figure 5 with 1 supplement
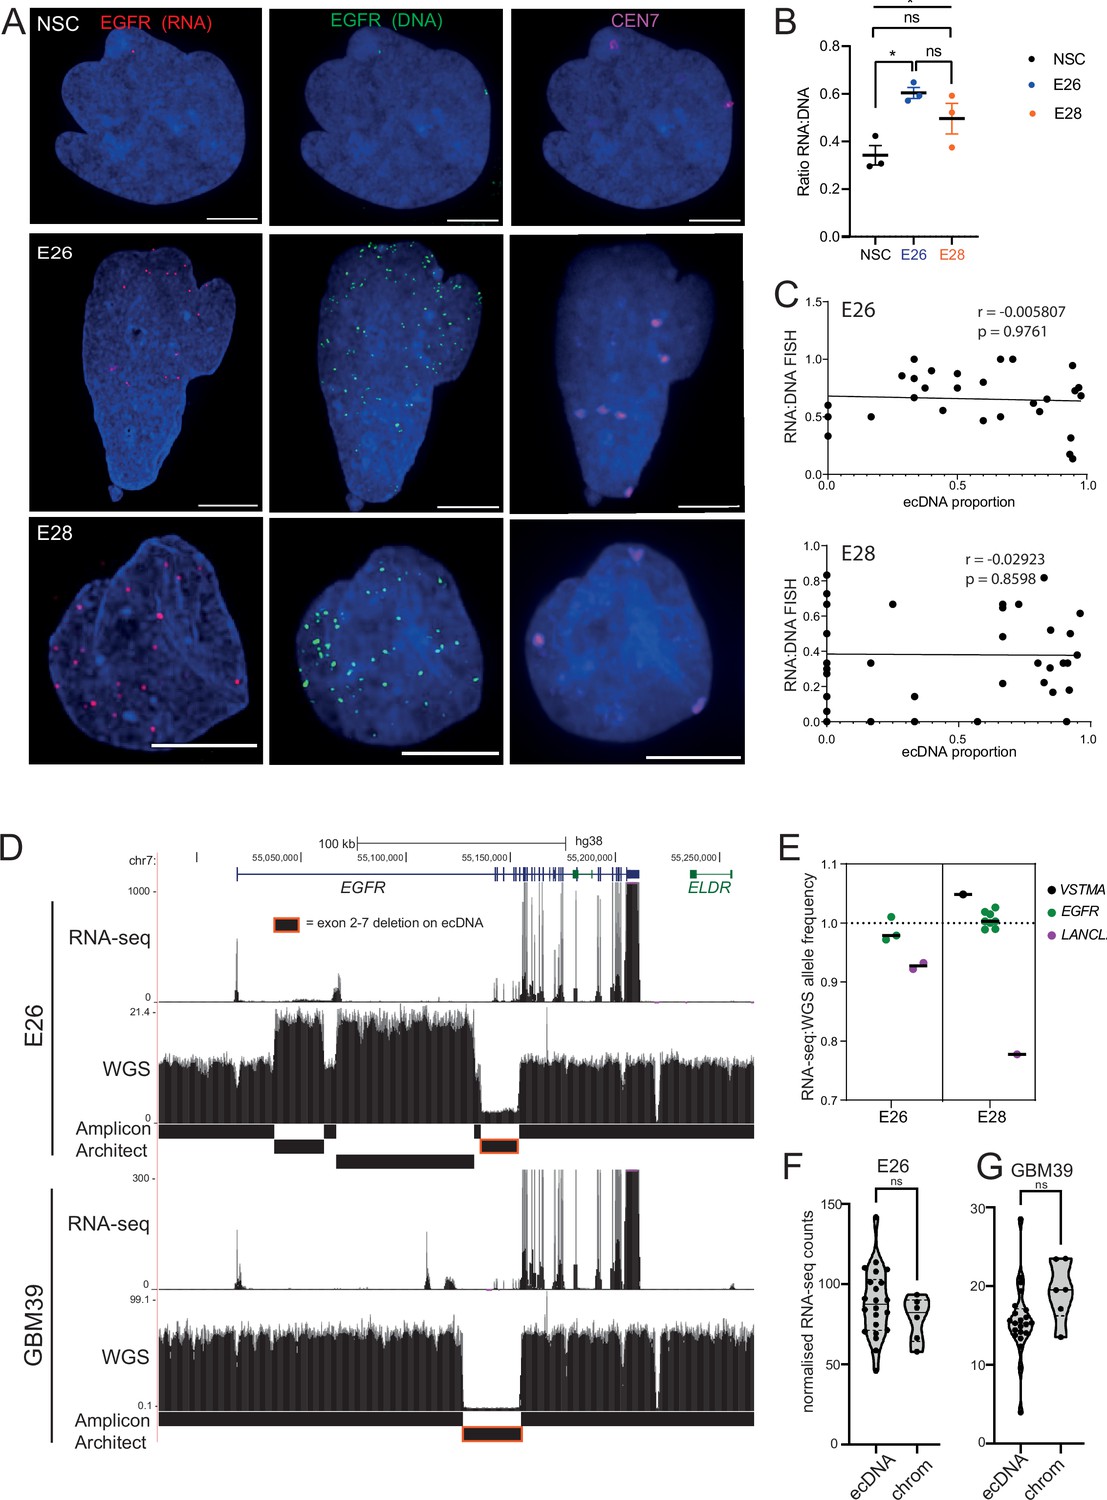
Levels of transcription from extrachromosomal DNA (ecDNA) reflect copy number but not enhanced transcriptional efficiency.
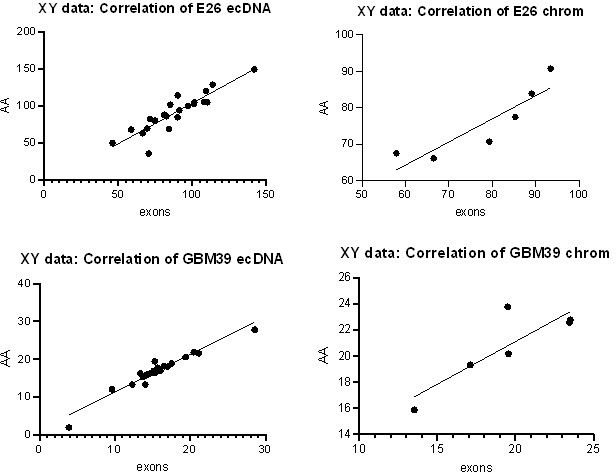
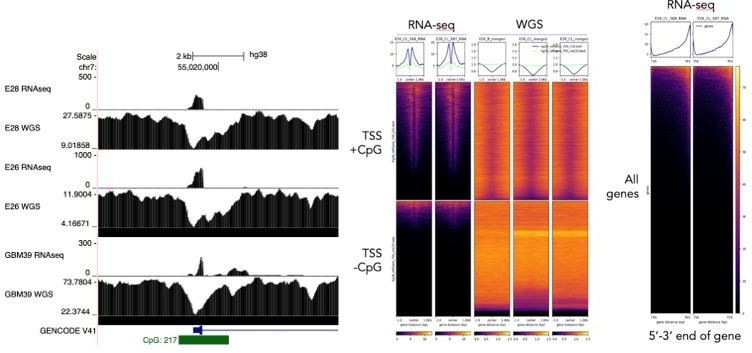
(A) Representative maximum intensity projection (MIP) images of nascent EGFR RNA, EGFR, and centromere 7 (CEN7) DNA FISH in neural stem cell (NSC), E26 and E28 cell lines (scale bar = 5 µm). (B) Ratio of RNA:DNA foci per nucleus in NSC, E26 and E28 cell lines. * p<0.05, n.s. not significant. Flat line – one-way ANOVA, hooked lines – unpaired t-test. Mean and standard error of the mean (SEM) plotted, with 3 biological replicates for NSC (total n=67), E26 (98) and E28 (95) nuclei. (C) Representative Spearman r correlation (ρ) and p-values shown for E26 (n=29) and E28 (n=39) cells. RNA:DNA ratio = number of RNA foci/number of DNA foci. EcDNA proportion = (number of EGFR DNA foci – number of CEN7 foci)/number of EGFR DNA foci. Three biological replicates performed, data from replicate 1 shown here. (D) UCSC genome browser tracks showing E26 and GBM39 RNA-seq and WGS aligned sequences in the region of chromosome 7 where EGFR is located, EGFR exons (GENCODE) and the exon deletion predicted by AmpliconArchitect. Note that RNA-seq counts in some ecDNA regions go above the maximum value. Genome coordinates (Mb) are from the hg38 assembly of the human genome. (E) RNA-seq/WGS allele frequency ratio for SNPs overlapping with expressed exons in the amplicon. Lines denote median values. (F) EGFR RNA-seq counts normalized by WGS read count per EGFR exon in E26, with exons defined as extrachromosomal (exons 1,8-28) or chromosomal (exons 2-7). Statistical significance examined by Mann-Whitney test. ns, not significant. (G) As for (F) but for GBM39. Statistical data relevant for this figure are in Figure 5—source data 1.
-
Figure 5—source data 1
Statistical data for Figure 5 and Figure 5—figure supplement 1.
(i) RNA:DNA FISH EGFR foci ratios. Statistical analysis of data for Figure 5B, RNA:DNA FISH EGFR foci ratio = mean values shown. n = number of nuclei, total across three biological replicates. Values in brackets indicate adjusted p-value (adj) = Bonferroni. (ii) Correlation of RNA:DNA ratio and ecDNA/total foci ratio (Figure 5C), Spearman r (p-value) shown for three biological replicates. N = number of nuclei. Rep1 data shown in figure. (iii) RNA-seq/whole genome sequencing (WGS) allele frequency ratio, for Figure 5E. Median and number of SNPs per gene per cell line. (iv) EcDNA versus chromosomal EGFR exons (Figure 5F and G), Mann-Whitney test of normalized RNA counts between chromosomal and predominantly EGFR ecDNA exons. (v) Mann-Whitney test of of EGFR RNA FISH foci in FACs sorted E26 and E28 cells (Figure 5—figure supplement 1E).
- https://cdn.elifesciences.org/articles/80207/elife-80207-fig5-data1-v3.docx
Figure 5—figure supplement 1
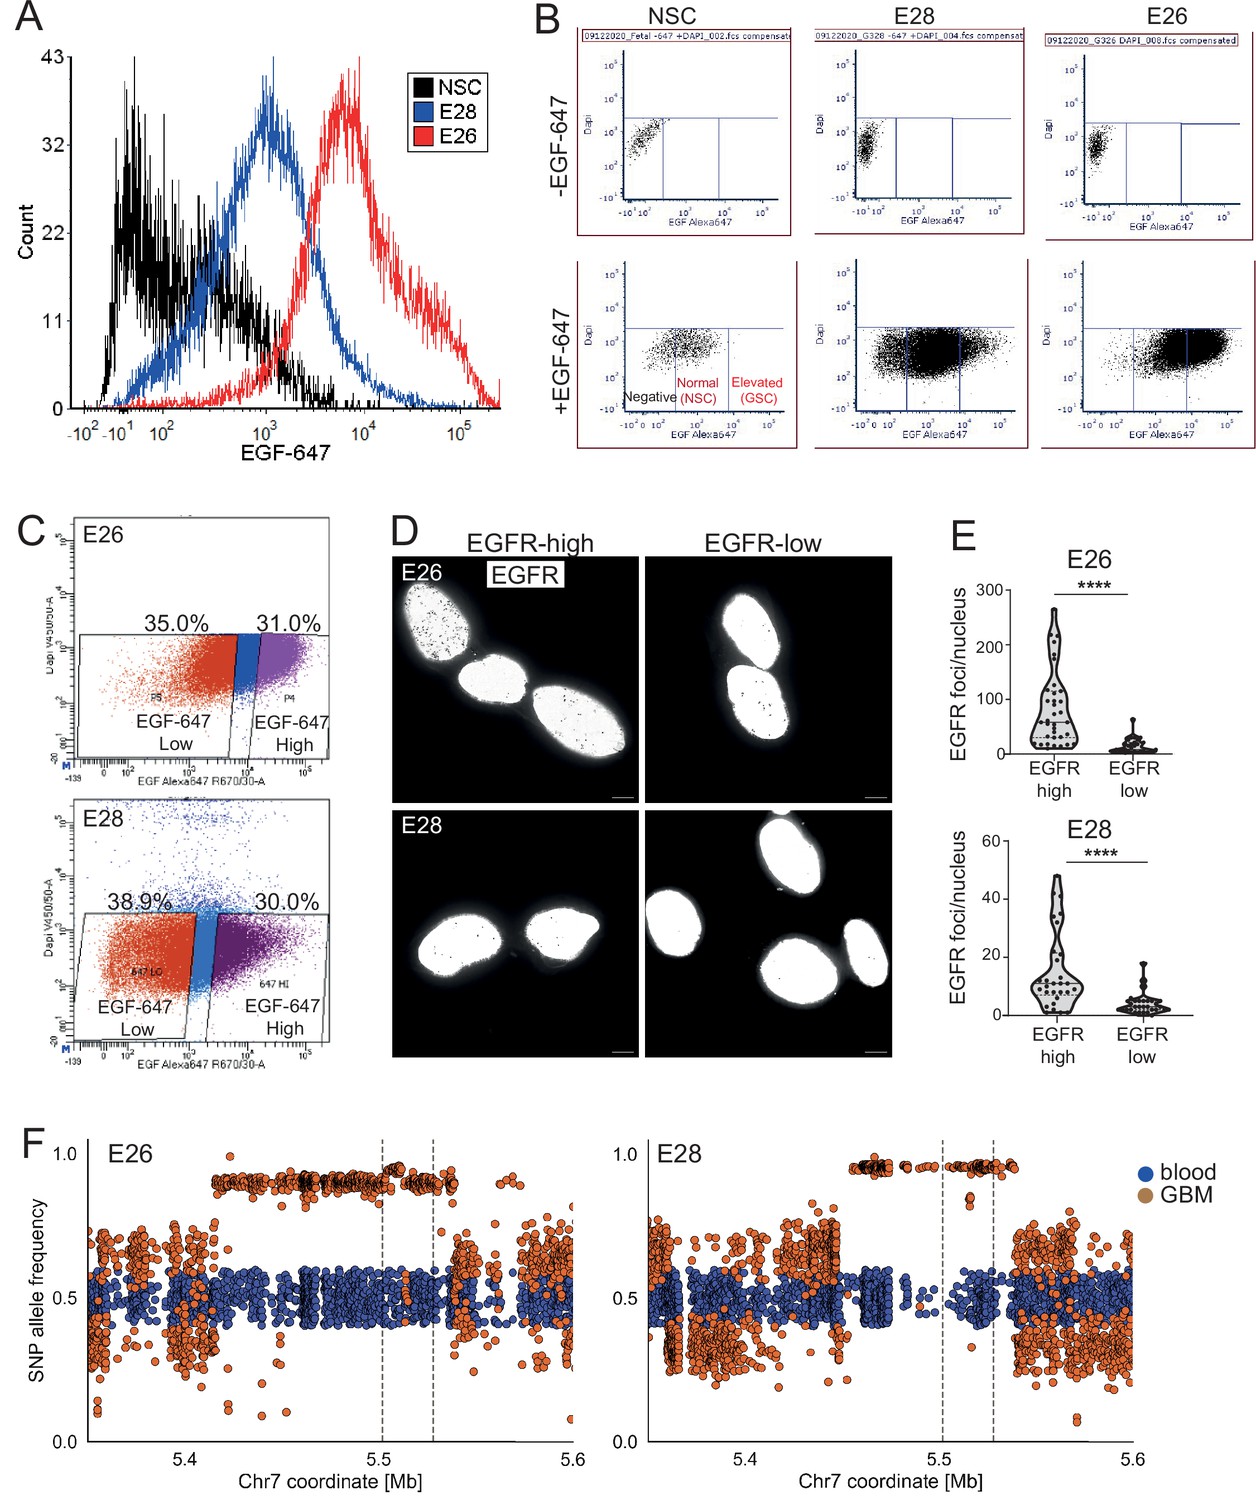
EGFR levels, ecDNA number, and ecDNA SNP allele frequency in E26 and E28 cell lines.
(A) Histogram of flow cytometry with EGF-647 showing signal in neural stem cell (NSC), E28 and E26 cell lines from live cells, normalized to peak count per cell line. Median EGF-647 – NSC = 172.2; E28 = 985.64; E26 = 7191.81. (B) Flow cytometry with EGF-647; gates showing negative, normal (NSC), and elevated (glioma stem cell [GSC]) EGF-647 signal in NSC, E28 and E26 cell lines. (C) Fluorescence activated cell sorting (FACS) into EGF-647 high and low populations from E26 and E28 cell lines. The percentage of total live cell population in each sorted population are shown. (D) Representative EGFR DNA FISH images (shown in greyscale) of E26 and E28 cells sorted via flow cytometry with EGF-647 into EGFR high and low cells. MIP, scale bar = 5 μm. (E) Number of EGFR DNA FISH per nucleus in sorted E26 and E28 cells. Statistical significance examined by Mann-Whitney. **** p<0.0001. Statistical data relevant for this figure are in Figure 5—source data 1. (F) SNP allele frequencies in E26 and E28 cell lines plotted in blood (blue) and glioblastoma GBM (orange) whole genome sequencing (WGS) samples. Dotted lines denote EGFR gene start and end.
Author response image 1
Author response image 2
Tables
Key resources table
| Reagent type (species) or resource | Designation | Source or reference | Identifiers | Additional information |
|---|---|---|---|---|
| Antibody | mCherry (Rabbit poly-clonal) | abcam | ab167453 | IF (1 in 500) |
| Antibody | Rpb1 NTD (D8L4Y) (Rabbit mono-clonal) | Cell Signaling Technology | #14958 | IF (1 in 1000) |
| Antibody | Anti-Digoxigenin (Sheep poly-clonal) | Roche | Ref 11333089001 | DNA FISH (1 in 10) |
| Antibody | Secondary Antibody – Alexa Fluor 647 (Donkey anti-Sheep IgG poly-clonal) | Thermo Fisher Scientific | A-21448 | DNA FISH (1 in 10) |
| Antibody | Secondary Antibody – Alexa Fluor 568 (Donkey anti-Rabbit IgG poly-clonal) | Thermo Fisher Scientific | A-10042 | IF (1 in 1000) |
| Antibody | Secondary Antibody – Alexa Fluor 488 (Donkey anti-Rabbit IgG poly-clonal) | Thermo Fisher Scientific | A-21206 | IF (1 in 1000) |
| Antibody | Secondary Antibody – Alexa Fluor 488 (Donkey anti-Rat IgG poly-clonal) | Thermo Fisher Scientific | A-21208 | IF (1 in 1000) |
| Genetic reagent (human) | Fosmid FISH probe (Human) | BACPAC resource | https://bacpacresources.org/library.php?id=275 | See Materials and methods - Supplementary file 1 |
| Cell line (Homo sapiens) | E20, E25, E26, E28, NSC – GCGR Human Glioma Stem Cells | This paper, Glioma Cellular Genetics Resource, CRUK, UK | http://gcgr.org.uk; pending publication | |
| Other | DMEM/HAMS-F12 | Sigma-Aldrich | Cat#: D8437 | Cell culture, media |
| Chemical compound, drug | Pen/Strep | GIBCO | Cat#: 15140–122 | Cell culture, media supplement |
| Other | BSA Solution | GIBCO | Cat#: 15260–037 | Cell culture, media supplement |
| Other | B27 Supplement (×50) | LifeTech/GIBCO | Cat#: 17504–044 | Cell culture, media supplement |
| Other | N2 Supplement (×100) | LifeTech/GIBCO | Cat#: 17502–048 | Cell culture, media supplement |
| Other | Laminin | Cultrex | Cat#: 3446-005-01 | Cell culture, media supplement, and pre-lamination of culture vessels |
| Peptide, recombinant protein | EGF | Peprotech | Cat: 315–09 | Cell culture, media supplement |
| Peptide, recombinant protein | FGF-2 | Peprotech | 100-18B | Cell culture, media supplement |
| Other | Accutase | Sigma-Aldrich | Cat#: A6964 | Cell culture, cell dissociation agent |
| Other | DMSO | Sigma-Aldrich | Cat#: 276855 | Cell culture, freeze media, and drug diluent |
| Other | Triton X-100 | Merck Life Sciences | Cat#: X-100 | Cell permeabiliz-ation agent following cell fixation |
| Other | Paraformaldehyde Powder 95% | Sigma | Cat#: 158127 | Cell fixation agent |
| Other | Tween 20 | Cambridge Bioscience | Cat#: TW0020 | DNA FISH (hybridization mix) |
| Other | PBS Tablets | Sigma-Aldrich | Cat#: P4417 | Diluent and washing agent |
| Other | Ethanol | VWR | Cat#: 20821–330 | DNA FISH |
| Other | Methanol | Fisher Chemical | M/4000/17 | Used 3:1 with acetic acid for metaphase spreads |
| Other | Acetic acid | Honeywell Research Chemicals | 33209-1L | See above |
| Peptide, recombinant protein | Alexa Fluor 647 EGF complex | Thermo Fisher Scientific | E35351 | Flow cytometry |
| Other | Green496-dUTP | ENZO Life Sciences | ENZ-42831L | Direct labelling of Fosmid DNA FISH probes via nick translation |
| Other | ChromaTide Alexa Fluor 594–5-dUTP | Thermo Fisher Scientific | C11400 | Direct labelling of Fosmid DNA FISH probes via nick translation |
| Peptide, recombinant protein | DNA Polymerase 1 | Invitrogen | 18010–017 | |
| Peptide, recombinant protein | DNase I recombinant, RNase-free | Roche | 04716728001 | |
| Genetic reagent (human) | Human Cot-1 DNA | Thermo Fisher Scientific | 15279011 | |
| Genetic reagent (salmon) | Salmon Sperm DNA | Invitrogen | 15632011 | |
| Chemical compound, drug | Paclitaxel | Cambridge Bioscience | CAY10461 | 10–100 nM |
| Chemical compound, drug | Nocodazole | Sigma-Aldrich | SML1665 | 50–100 ng/ml |
| Other | XCP 7 Orange Chromosome Paint | MetaSystems Probes | D-0307-100-OR | DNA FISH (see Figure 1 and Materials and methods referring to this) |
| Commercial assay or kit | Stellaris RNA-FISH probes (Custom Assay with Quasar 570 Dye) | LGC Biosearch Technologies | SMF-1063–5 | RNA FISH |
| Commercial assay or kit | Stellaris RNA FISH Hybridization Buffer | LGC Biosearch Technologies | SMF-HB1-10 | RNA FISH |
| Genetic reagent (human) | Alt-R CRISPR-Cas9 crRNA | IDT-Technologies | Alt-R CRISPR-Cas9 crRNA | |
| Genetic reagent (human) | Alt-R CRISPR-Cas9 tracrRNA | IDT-Technologies | 1072532 | |
| Commercial assay or kit | SG Cell Line 4D-NucleofectorTM X Kit S | Lonza Bioscience | V4XC-3032 | |
| Genetic reagent (human) | Chromosome 7 Control Probe | Pisces Scientific | CHR07-10-DIG | Probe and hybridization mix |
| Other | DAPI (4',6-Diamidino-2-Phenylindole, Dihydrochloride) | Thermo Fisher Scientific | D1306 | Nuclear staining; 50 ng/ml and 5 ng/ml (as indicated in Materials and methods) |
| Sequence-based reagent | mCherry_PolR2G crRNA and dsDNA (donor) | Twist Bioscience | See Materials and methods and Supplementary file 1 | |
| Other | WGS and RNAseq | This paper Glioma Cellular Genetics Resource, CRUK, UK | GEO: GSE215420 See also: https://gcgr.org.uk | See Materials and methods |
| Other | Erosion Territories analysis | This paper | Code available at: https://github.com/IGC-Advanced-Imaging-Resource/Purshouse2022_paper | |
| Other | Cluster analysis | This paper | Code available at: https://github.com/SjoerdVBeentjes/ripleyk | |
| Other | RNA-seq/WGS analysis | This paper | Code available at: https://github.com/kpurshouse/ecDNAcluster | |
| Software, algorithm | GraphPad Prism 9.0 | GraphPad Software, Inc | https://www.graphpad.com/ | |
| Software, algorithm | FCS Express | FCS Express 7 | https://denovosoftware.com/ | |
| Software, algorithm | Fiji/ImageJ | Open Source | https://imagej.net/Fiji | |
| Software, algorithm | BioRender | BioRender | https://biorender.com/ | |
| Software, algorithm | Python v3.9 | Open Source | https://www.python.org | |
| Software, algorithm | Algorithm - RipleyK package | Python Package Index | https://pypi.org/project/ripleyk/ | |
| Software, algorithm | Imaris x64 v9.4.0 | Imaris Microscopy Image Analysis Software | https://imaris.oxinst.com/ | |
| Software, algorithm | UCSC Genome Browser | Kent et al., 2002 | https://genome.cshlp.org/content/12/6/996 | |
| Software, algorithm | STAR 2.7.1a | Dobin et al., 2013 | https://github.com/alexdobin/STAR; Dobin et al., 2013 | |
| Software, algorithm | Picard | Broad Institute | https://broadinstitute.github.io/picard/ RRID:SCR_006525, Version 2.23.2 | |
| Software, algorithm | AmpliconArchitect | Deshpande et al., 2019 | https://github.com/virajbdeshpande/AmpliconArchitect; Deshpande et al., 2019 (with Python v2.7) | |
| Software, algorithm | AmpliconClassifier | Kim et al., 2020 | https://github.com/jluebeck/AmpliconClassifier (with Python v2.7) | |
| Software, algorithm | deepTools v3.4 | Ramírez et al., 2016 | https://deeptools.readthedocs.io/en/develop/ | |
| Software, algorithm | HOMER2 4.10 | Heinz et al., 2010 | http://homer.ucsd.edu/homer/ | |
| Software, algorithm | SAMtools v1.10 | Li et al., 2009 | http://www.htslib.org | |
| Software, algorithm | BEDTools v2.3 | Quinlan and Hall, 2010 | http://code.google.com/p/bedtools | |
| Software, algorithm | bcftools | Danecek et al., 2021 | https://doi.org/10.1093/gigascience/giab008 | |
| Software, algorithm | strelka v2.9.10 | Kim et al., 2018 | https://doi.org/10.1038/s41592-018-0051-x |
Additional files
-
Supplementary file 1
Genomic information for FISH probes and CRISPR knockin.
(A)Fosmid probes for DNA FISH related to STAR methods. Genome coordinates (Mb) are from the hg38 assembly of the human genome. (B) CrRNA sequence and dsDNA sequence for mCherry_PolR2G CRISPR knock-in.
- https://cdn.elifesciences.org/articles/80207/elife-80207-supp1-v3.docx
-
MDAR checklist
- https://cdn.elifesciences.org/articles/80207/elife-80207-mdarchecklist1-v3.docx
Download links
A two-part list of links to download the article, or parts of the article, in various formats.
Downloads (link to download the article as PDF)
Open citations (links to open the citations from this article in various online reference manager services)
Cite this article (links to download the citations from this article in formats compatible with various reference manager tools)
Oncogene expression from extrachromosomal DNA is driven by copy number amplification and does not require spatial clustering in glioblastoma stem cells
eLife 11:e80207.
https://doi.org/10.7554/eLife.80207


