Hormone replacement therapy for postmenopausal atherosclerosis is offset by late age iron deposition
- State Key Laboratory of Pharmaceutical Biotechnology, Department of Vascular Surgery, The Affiliated Drum Tower Hospital of Nanjing University Medical School, China
- Jiangsu Key Laboratory of Molecular Medicine, Medical School of Nanjing University, China
- The Second Affiliated Hospital, School of Public Health, State Key Laboratory of Experimental Hematology, Zhejiang University School of Medicine, China
- Faculty of Biotechnology and Food Engineering, Technion Israel Institute of Technology, Israel
- Department of Physiology, Biophysics and Neuroscience, Cinvestav, Mexico
Figures
Figure 1
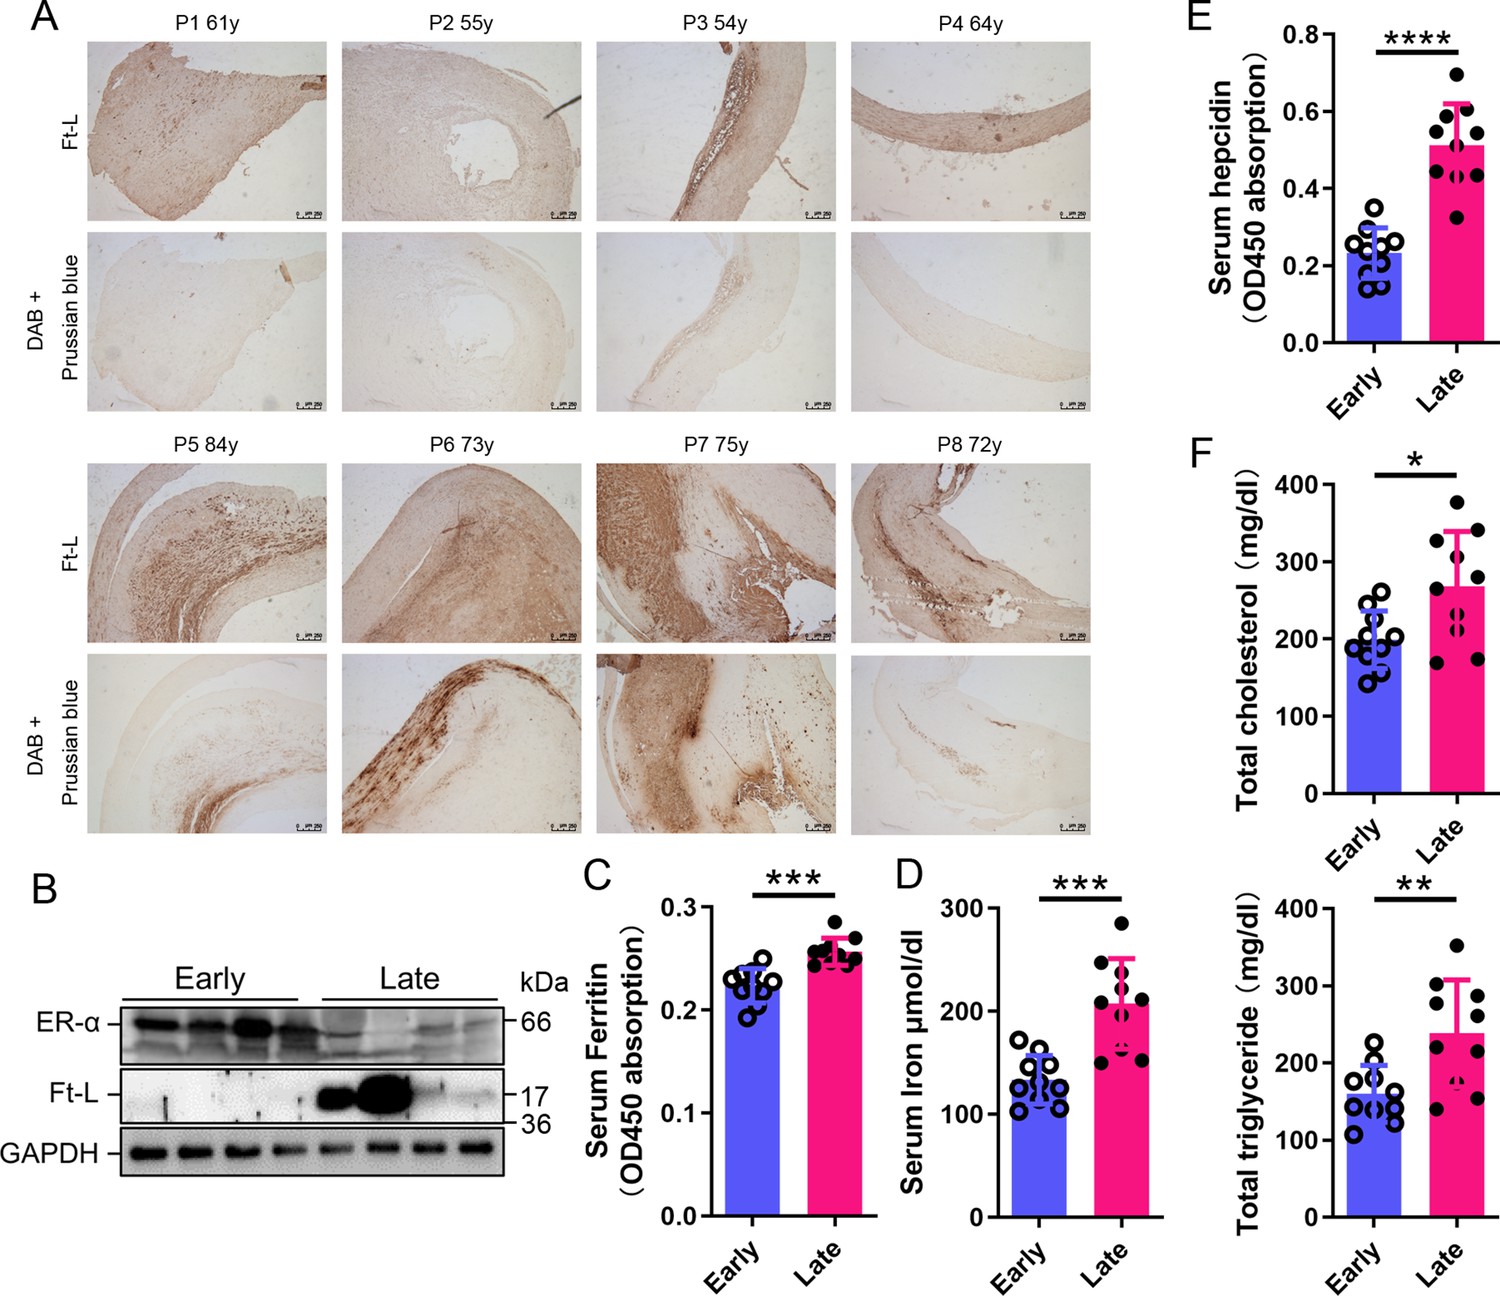
Estrogen receptor α (ERα) levels were negatively associated with iron content in human plaques.
(A) Ferritin (Ft-L), revealed by immunohistochemistry (IHC), and iron content, revealed by DAB-enhanced Prussian blue staining, in plaque paraffin sections of eight postmenopausal patients. Upper panel: the early postmenopausal (EPM) group (P1–P4,<65 years old); lower panel: the late postmenopausal (LPM) group (P5–P8, >65 years old). (B) ERα and Ft-L expression in plaques measured by western blotting. The samples are the same as in (A) except for the lane switch between lane 6 (P6) and lane 7 (P7) by chance. (C) Serum ferritin levels in EPM (blue) and LPM (magenta) patients, detected by ELISA. n = 10/group, ***p<0.001. (D) Serum iron measured by using an autochemical analyzer (Beckman Coulter AU5421, CA). n = 10/group, ***p<0.001. (E) Serum hepcidin levels detected by ELISA. n = 10/group, ****p<0.0001. (F) Serum total cholesterol (left) and total triglyceride (right) levels. n = 10/group, *p<0.05, **p<0.01. Student’s t-test analysis was used for (C–F).
-
Figure 1—source data 1
Raw data for Figure 1.
- https://cdn.elifesciences.org/articles/80494/elife-80494-fig1-data1-v1.zip
Figure 2 with 1 supplement
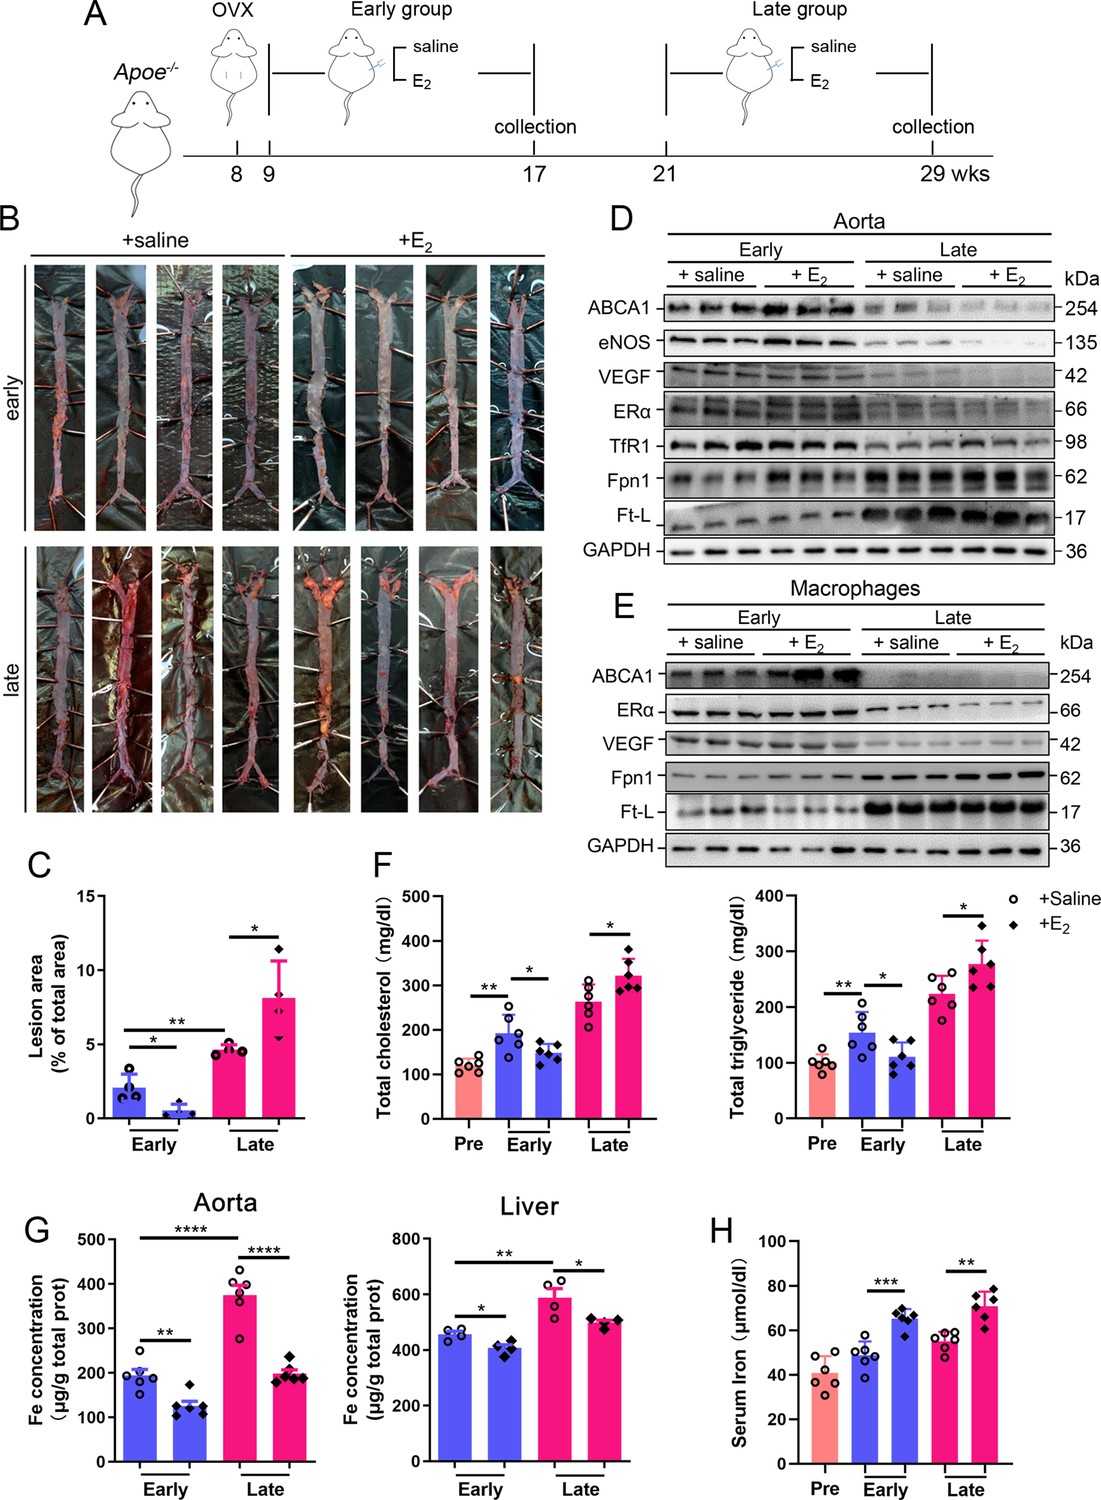
Atherosclerosis was aggravated in E2-treated late postmenopausal Apoe-/- mice with lower ERα expression.
(A) Flow diagram of mouse modeling. Early E2-treatment group: ovariectomy (OVX) at 8 weeks old, 1-wk recovery, E2 treatment for 8 wk; late E2-treatment group: OVX at 8 weeks old, E2 treatment from 21 weeks old to 29 weeks old for 8 wk. Saline is vehicle control. Mice were fed high-fat chow from 9 weeks old. (B) Oil red O-stained aortic lesions in Apoe-/- mice after E2 treatment for 8 wk in the early postmenopausal (EPM) or late postmenopausal (LPM) group. (C) Statistical analysis of the area of atherosclerotic plaque in the aorta. n = 4/group, *p<0.05, **p<0.01. (D) The expression of iron-related or ERα-targeted proteins in the aorta, detected by western blotting. (E) Protein expression in peritoneal macrophages detected by western blotting. Macrophages were isolated from four mouse groups (early/late ± E2, for details see ‘Materials and methods’). (F) Serum total cholesterol and total triglyceride levels in the four mouse groups. Pre: serum samples before OVX as a control group. n = 6/group, *p<0.05, **p<0.01. (G) Iron content in aorta and liver, detected by ferrozine assays. n = 6/group, ****p<0.0001, **p<0.01, *p<0.05. (H) Serum iron in different groups, detected by using an autochemical analyzer (Beckman Coulter AU5421). n = 6/group, ***p<0.001, **p<0.01. Student’s t-test analysis was used for (C, F–H).
-
Figure 2—source data 1
Raw data for Figure 2B–H.
- https://cdn.elifesciences.org/articles/80494/elife-80494-fig2-data1-v1.zip
Figure 2—figure supplement 1

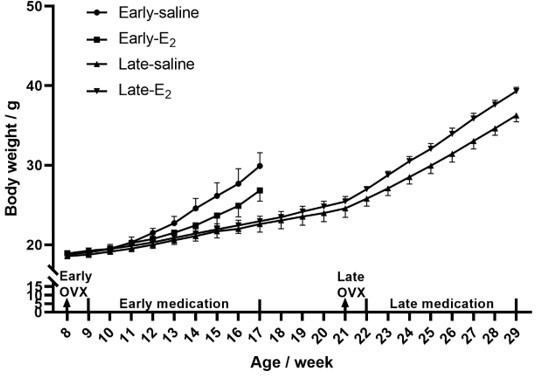
Serum E2 and body weight of postmenopausal Apoe-/- mice.
(A) Serum E2 levels after peritoneal E2 administration (3 μg/kg daily for 8 wk, n = 4) with Student’s t-test analysis. (B) Body weight of Apoe-/- mice after E2 treatment for 8 wk in the early postmenopausal (EPM) or late postmenopausal (LPM) groups (n = 6).
-
Figure 2—figure supplement 1—source data 1
Raw data of the mouse serum estradiol and body weight for Figure 2—figure supplement 1.
- https://cdn.elifesciences.org/articles/80494/elife-80494-fig2-figsupp1-data1-v1.zip
Figure 3 with 1 supplement
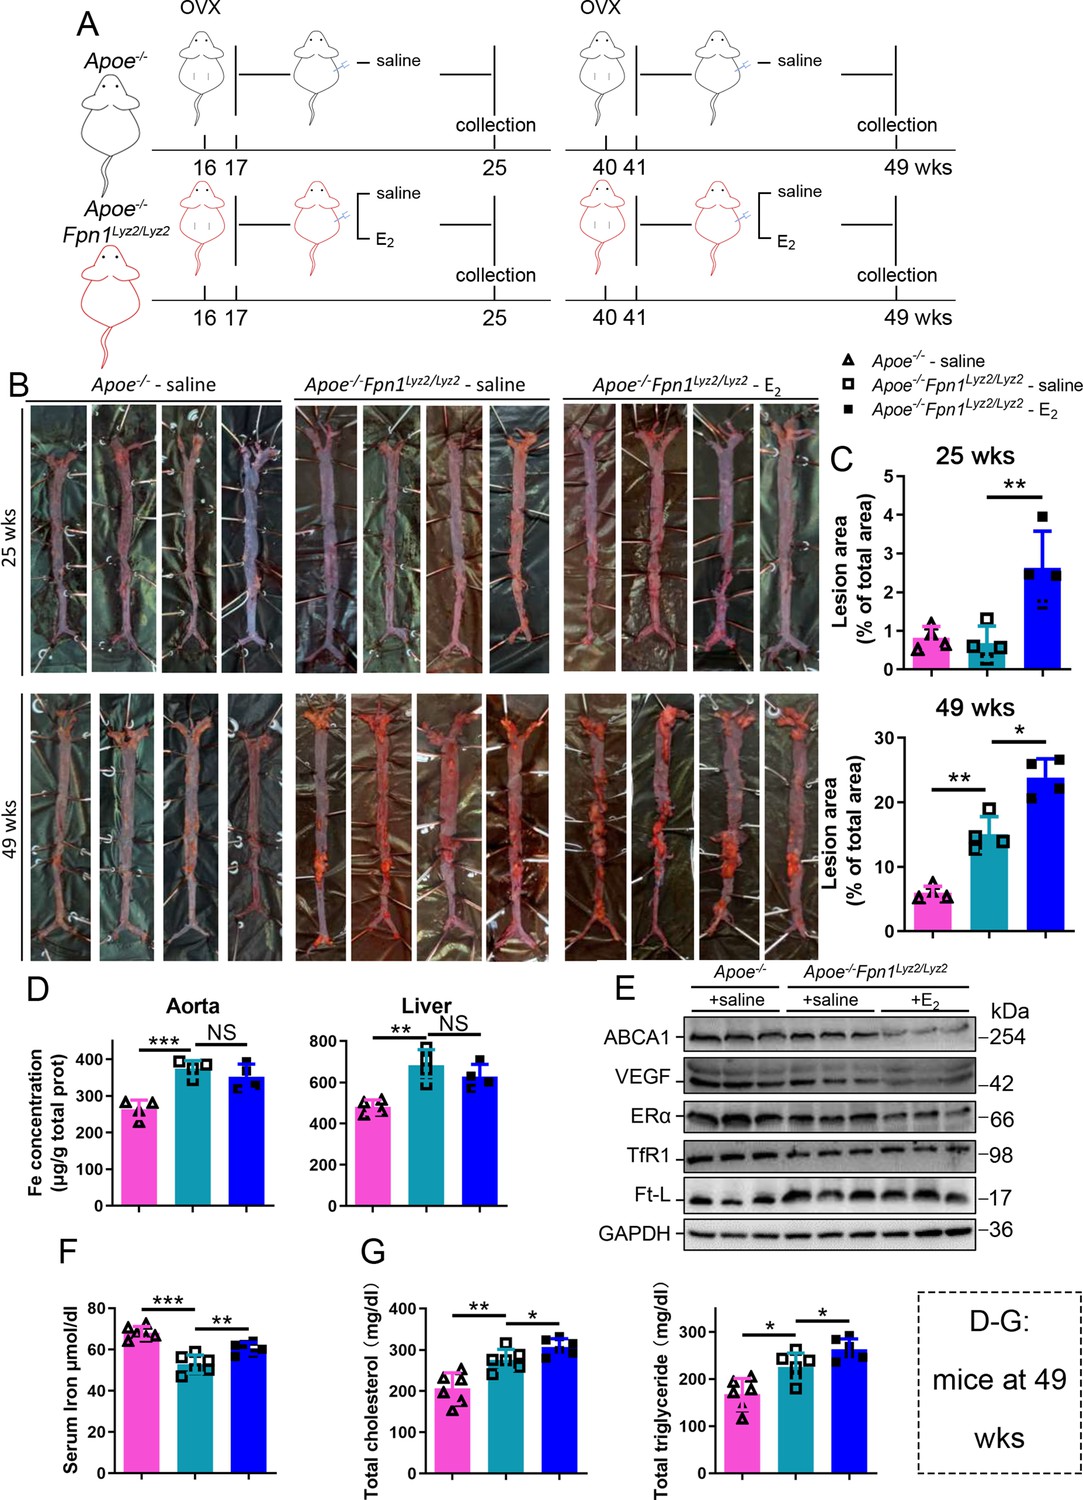
E2-triggered estrogen receptor α (ERα) deficiency was observed in a genetic iron overload mouse model at postmenopausal age.
(A) Flow diagram of mouse modeling. Early groups: ovariectomy (OVX) at 16 weeks old, 1-wk recovery, ± E2 treatment for 8 wk; late groups: OVX at 40 weeks old, 1-wk recovery, ± E2 treatment for 8 wk. Saline is vehicle control. The mice were fed with normal chow. (B) Oil red O-stained aortic lesions in Apoe-/- and Apoe-/- Fpn1Lyz2/Lyz2 mice after E2 treatment for 8 wk in the early postmenopausal (EPM) or late postmenopausal (LPM) groups as indicated. (C) The lesion area in the aorta. n = 4/group, **p<0.01, *p<0.05. (D) The iron content of the aorta and liver detected by ferrozine assays. n = 6/group, ***p<0.001, **p<0.01. (E) The expression of iron-related or ERα-targeted proteins in the aorta, detected by western blotting. (F) Serum iron level in different groups. n = 6/group, ***p<0.001, **p<0.01. (G) Serum total cholesterol and total triglyceride levels. n = 6/group, *p<0.05, **p<0.01. The samples for (D–G) were from 49-week-old Apoe-/- and Apoe-/- Fpn1Lyz2/Lyz2 mice. Student’s t-test analysis was used for (C, D, F, G).
-
Figure 3—source data 1
Raw data for Figure 3B–G.
- https://cdn.elifesciences.org/articles/80494/elife-80494-fig3-data1-v1.zip
Figure 3—figure supplement 1
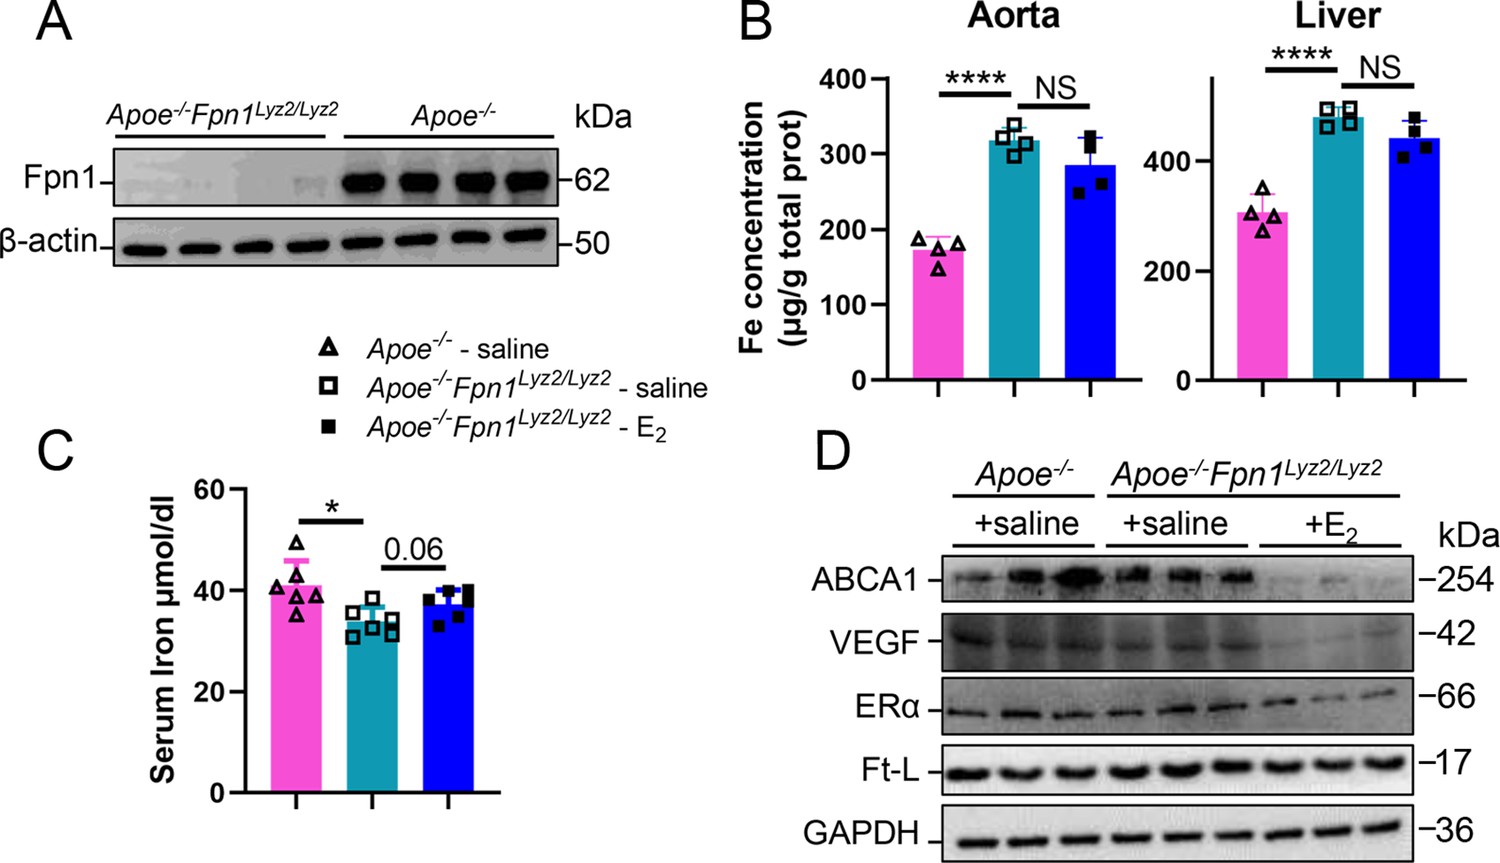
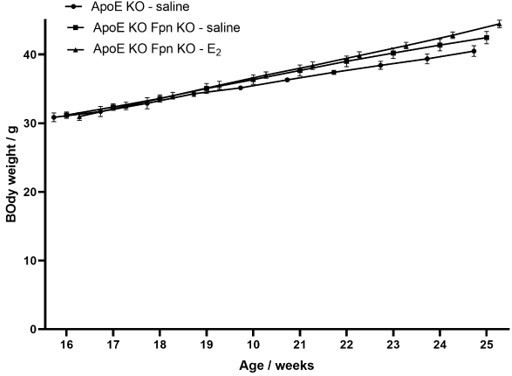
E2-triggered estrogen receptor α (ERα) deficiency was observed in Apoe-/- Fpn1Lyz2/Lyz2 at early postmenopause (25 weeks old).
(A) Fpn1 KO efficiency in peritoneal macrophages was validated. (B) Iron content of aorta and liver detected by ferrozine assays. n = 4, ****p<0.0001. (C) Serum iron in different groups. n = 6, *p<0.05. (D) ABCA-1, ERα, VEGF, and Ft-L protein expression of aorta were detected. Student’s t-test analysis was used for (B, C).
-
Figure 3—figure supplement 1—source data 1
Raw data for Figure 3—figure supplement 1.
- https://cdn.elifesciences.org/articles/80494/elife-80494-fig3-figsupp1-data1-v1.zip
Figure 4
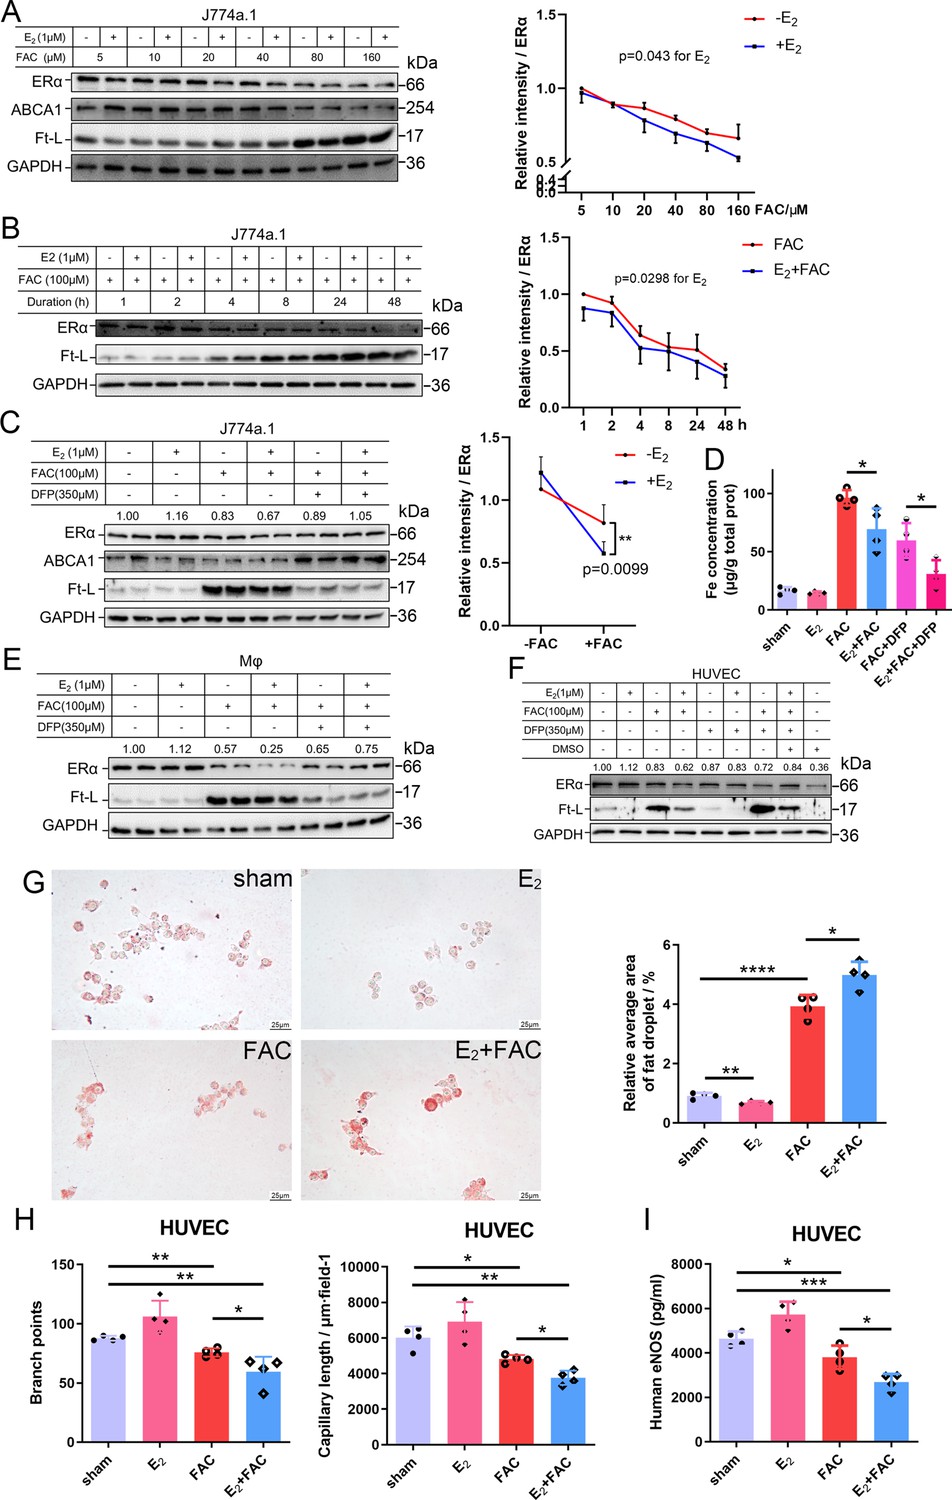
E2 treatment potentiates iron-induced downregulation of estrogen receptor α (ERα) in vitro.
(A, B) Left: ERα expression in the presence or absence of E2 under different iron concentration conditions (A) or in the time course (B). Right: quantification data using ImageJ analysis. Two-way ANOVA was used. (C) Left: the rescue effect of iron chelation on the downregulation of ERα by FAC or FAC plus E2. Right: quantification data using ImageJ analysis. Two-way ANOVA was used for the former four groups. (D) The intracellular iron content in J774a.1 under different iron-concentration conditions in the presence or absence of E2, detected by ferrozine assays. n = 4, *p<0.05. (E, F) ERα expression in peritoneal macrophages (E) and human umbilical vein endothelial cells (HUVECs) (F) under the indicated iron and E2 conditions. (A–C, E, F) are data from western blotting. The quantification is indicated as a relative intensity of ERα (n = 4). (G) Oil red O-stained J774a.1 cells after treatment with FAC and/or E2 (left) followed by oxidized LDL uptake, quantified by the area of droplets (right). scale bar = 25 μm, n = 4, ***p<0.001. (H) HUVEC angiogenesis assays, revealed by the number of branch points (left) and capillary length (right). n = 4, *p<0.05, **p<0.01. (I) eNOS level in HUVEC, assessed by ELISA. n = 4, *p<0.05, **p<0.01, ***p<0.001. Two-way ANOVA was used for (A–C). Student’s t-test analysis was used for (D, G–I).
-
Figure 4—source data 1
Raw data for Figure 4A–F and I.
- https://cdn.elifesciences.org/articles/80494/elife-80494-fig4-data1-v1.zip
-
Figure 4—source data 2
Raw data including parts of images and quantification for Figure 4G.
- https://cdn.elifesciences.org/articles/80494/elife-80494-fig4-data2-v1.zip
-
Figure 4—source data 3
Raw data including the images for parts of Figure 4G.
- https://cdn.elifesciences.org/articles/80494/elife-80494-fig4-data3-v1.zip
-
Figure 4—source data 4
Raw data including the images and quantification for Figure 4H.
- https://cdn.elifesciences.org/articles/80494/elife-80494-fig4-data4-v1.zip
Figure 5 with 2 supplements
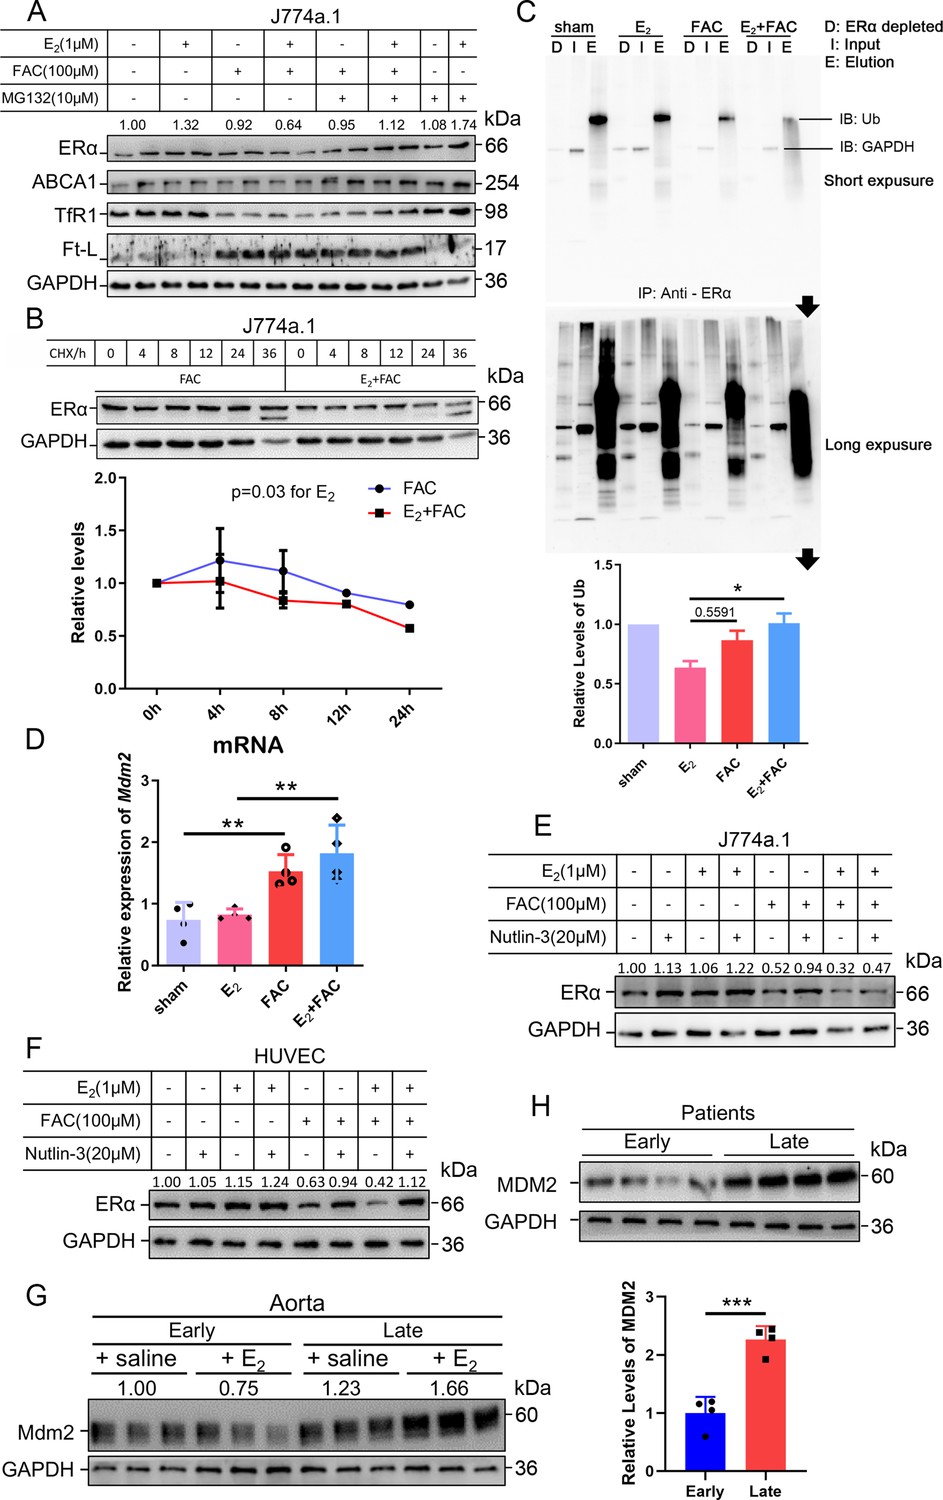
The interactive effects of iron overload and E2 treatment on estrogen receptor α (ERα) downregulation are mediated by the E3 ligase MDM2.
(A) Evaluation of ERα proteasome-dependent degradation in J774a.1 cells by western blotting. MG132: 10 μM. n = 4. (B) ERα turnover rate in J774a.1 cells under FAC or E2 + FAC conditions, detected by western blotting after 20 μM cycloheximide (CHX) treatment. *p<0.05 using two-way ANOVA. (C) Ubiquitination of ERα, evaluated by western blotting (anti-ubiquitin) following immunoprecipitation against ERα antibody. n = 3, *p<0.05. (D) Relative Mdm2 mRNA expression in J774a.1 cells, assessed by qPCR, n = 4, **p<0.01. (E) The protein levels of ERα in the presence of FAC or FAC plus E2 in J774a.1 cells after treatment of Nutlin-3, a specific antagonist of Mdm2. n = 3. (F) The protein levels of ERα in the presence of FAC or FAC plus E2 in human umbilical vein endothelial cells (HUVECs) after treatment of Nutlin-3. n = 3. (G) Mdm2 protein expression in the aortas of mice in the early postmenopausal (EPM) or late postmenopausal (LPM) stage, as detected by western blotting. n = 3/group. (H) MDM2 protein levels in patient plaques, detected by western blotting and quantified with ImageJ. n = 4/group, ***p<0.001. Two-way ANOVA was used for (B). Student’s t-test analysis was used for (C, D H).
-
Figure 5—source data 1
Raw data for Figure 5.
- https://cdn.elifesciences.org/articles/80494/elife-80494-fig5-data1-v1.zip
Figure 5—figure supplement 1
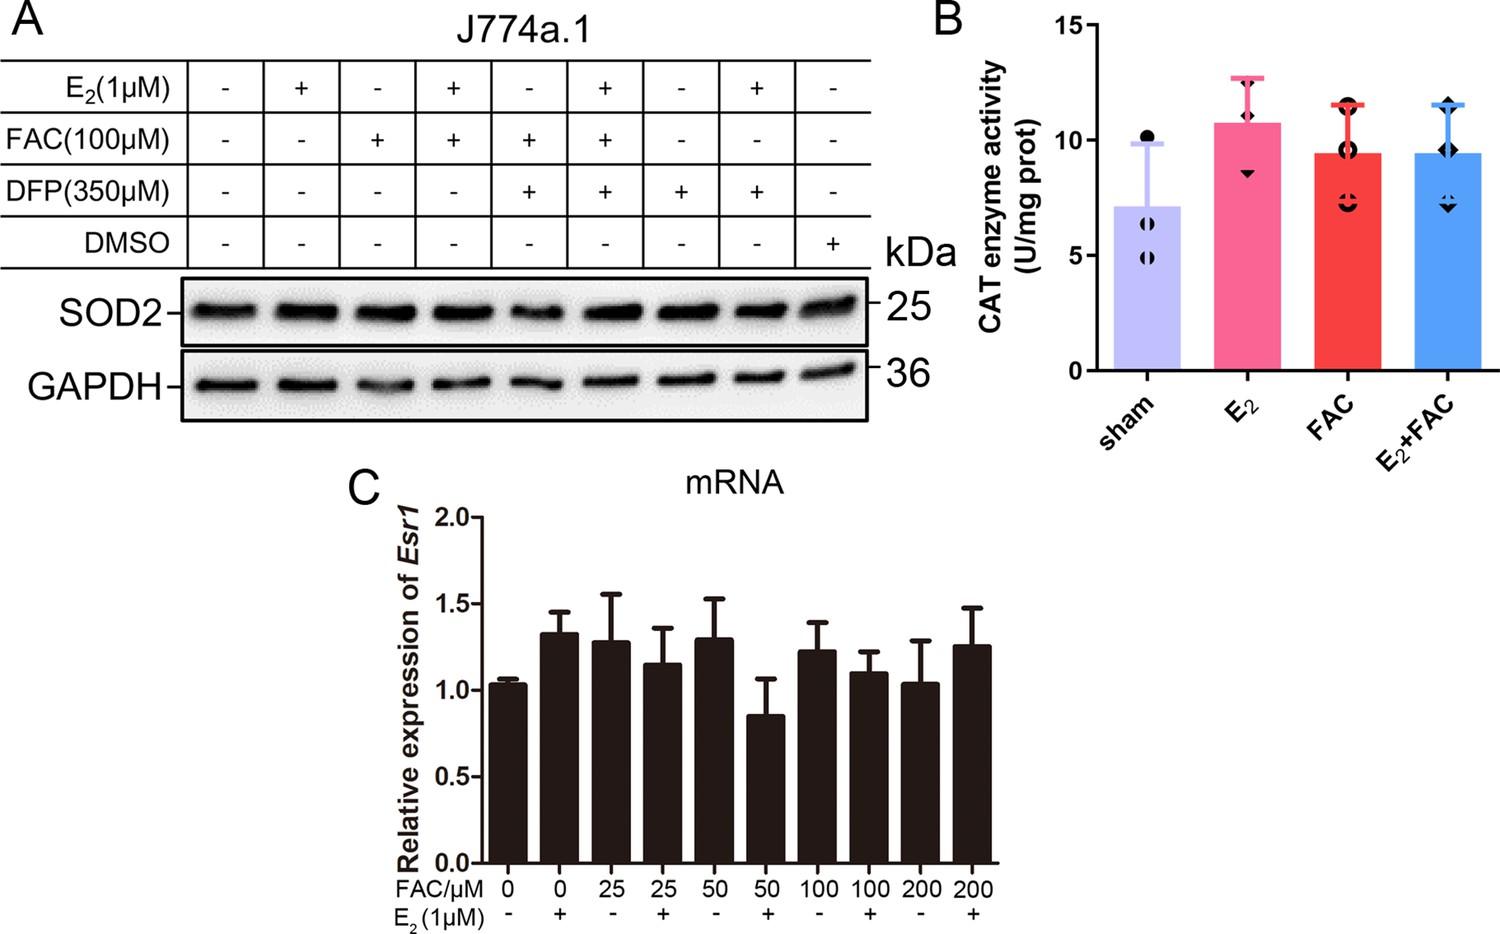
No significant oxidative-stress was raised by application of E2 and iron within the indicated concentration.
(A) SOD2 protein levels of J774a.1 post treatments with FAC/DFP in the presence/absence of E2. (B) The enzymatic activity of catalase in J774a.1. n = 4. (C) Relative ERα mRNA expression of J774a.1 treated with different concentrations of FAC in the presence/absence of E2, assessed by qPCR. n = 5. Student’s t-test analysis was used for (B, C).
-
Figure 5—figure supplement 1—source data 1
Raw data for Figure 5—figure supplement 1.
- https://cdn.elifesciences.org/articles/80494/elife-80494-fig5-figsupp1-data1-v1.zip
Figure 5—figure supplement 2
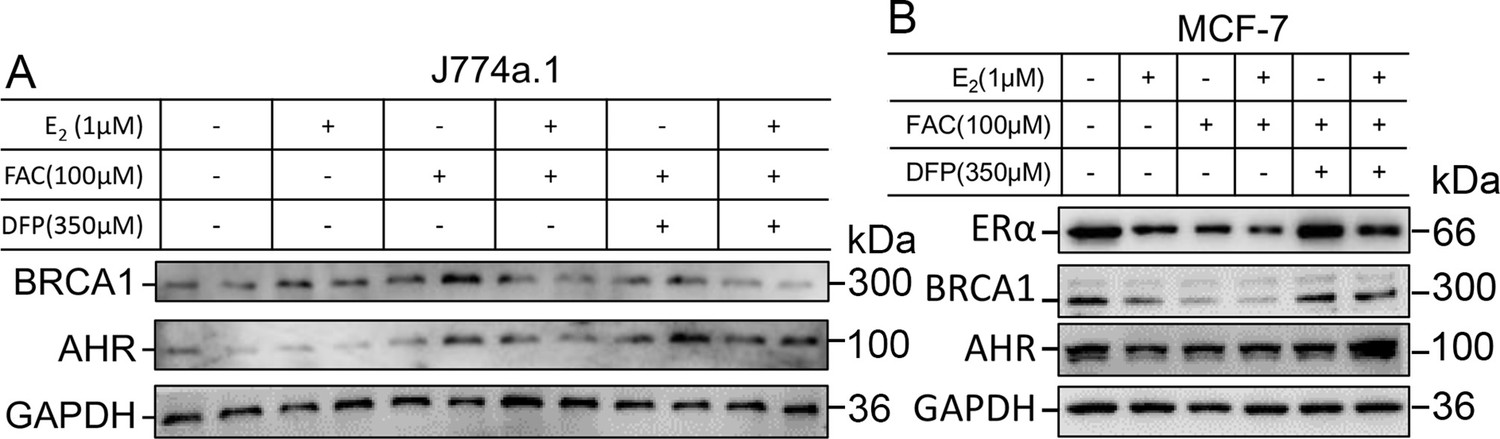
E3-ligase responses to iron and E2 treatment in different cell types.
(A) BRCA1 and AHR protein expressions in J774a.1 were detected. (B) The protein expression of ERα and its related E3 ligase, BRCA1 and AHR, was detected in MCF-7 cell line. n = 4.
-
Figure 5—figure supplement 2—source data 1
RAW data for Figure 5—figure supplement 2.
- https://cdn.elifesciences.org/articles/80494/elife-80494-fig5-figsupp2-data1-v1.zip
Figure 6 with 1 supplement
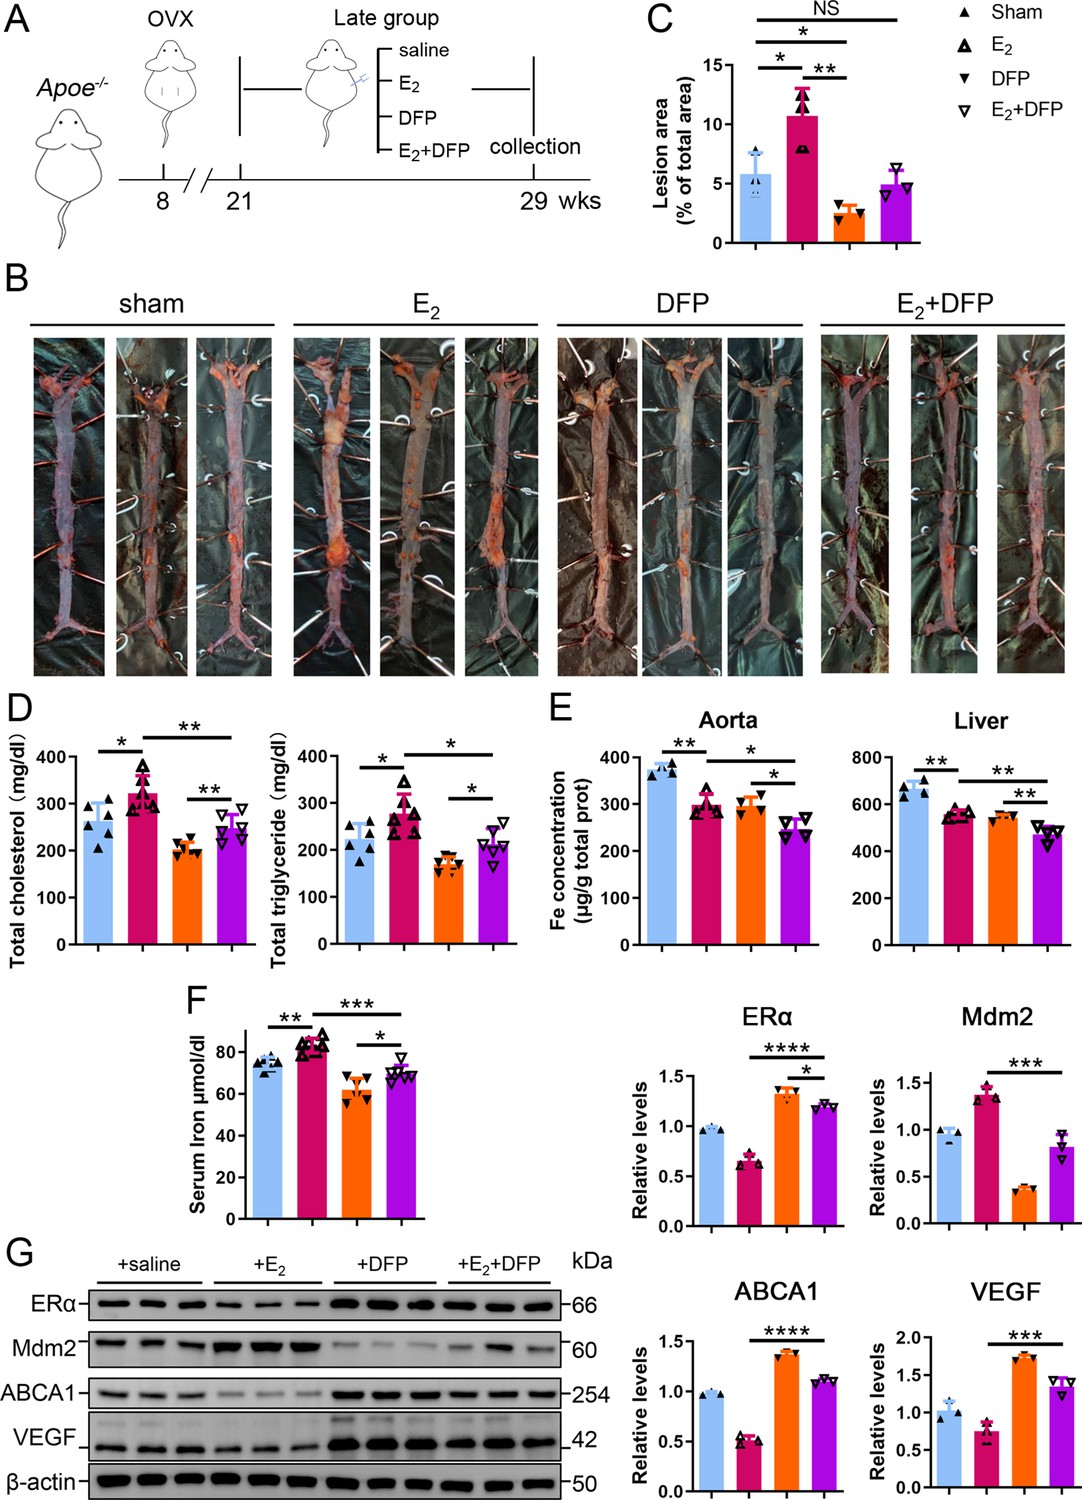
Iron restriction therapy restored estrogen receptor α (ERα) levels and attenuated E2-triggered progressive atherosclerosis in late postmenopausal mice.
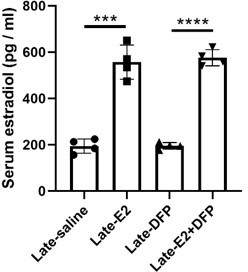
(A) Flow diagram of mouse modeling. The mice were ovariectomized (OVX) at 8 weeks old and E2, DFP or E2 + DFP treated from 21 weeks old to 29 weeks old for 8 wk. Saline is vehicle control. Mice were fed high-fat chow one week after OVX. 13 wk post-OVX is considered as late postmenopause. (B) Oil red O-stained aortic lesions in Apoe-/- mice treated with E2, DFP or E2 + DFP as indicated. (C) The quantified lesion area of atherosclerotic plaques in the aorta from (B). n = 3, **p<0.01, *p<0.05. (D) Serum total cholesterol and total triglyceride levels. n = 6, *p<0.05, **p<0.01. (E) The iron content in the aorta and liver, detected by ferrozine assays. n = 4, **p<0.01, *p<0.05. (F) Determination of serum iron in different groups. n = 6, ***p<0.001, **p<0.01, *p<0.05. (G) Protein expression in the aorta, detected by western blotting (left) and quantified with ImageJ (right). n = 3. ****p<0.0001, ***p<0.001, *p<0.05. Student’s t-test analysis was used for (C–G).
-
Figure 6—source data 1
Raw data for Figure 6B–G.
- https://cdn.elifesciences.org/articles/80494/elife-80494-fig6-data1-v1.zip
Figure 6—figure supplement 1

Serum hemoglobin after DFP administration with Student’s t-test analysis (80 mg/kg, daily for 8 wk, Apoe-/-, age 8 wk for Control, and 29 wk for the late, n = 4).
-
Figure 6—figure supplement 1—source data 1
Hemoglobin values for Figure 6—figure supplement 1.
- https://cdn.elifesciences.org/articles/80494/elife-80494-fig6-figsupp1-data1-v1.zip
Figure 7
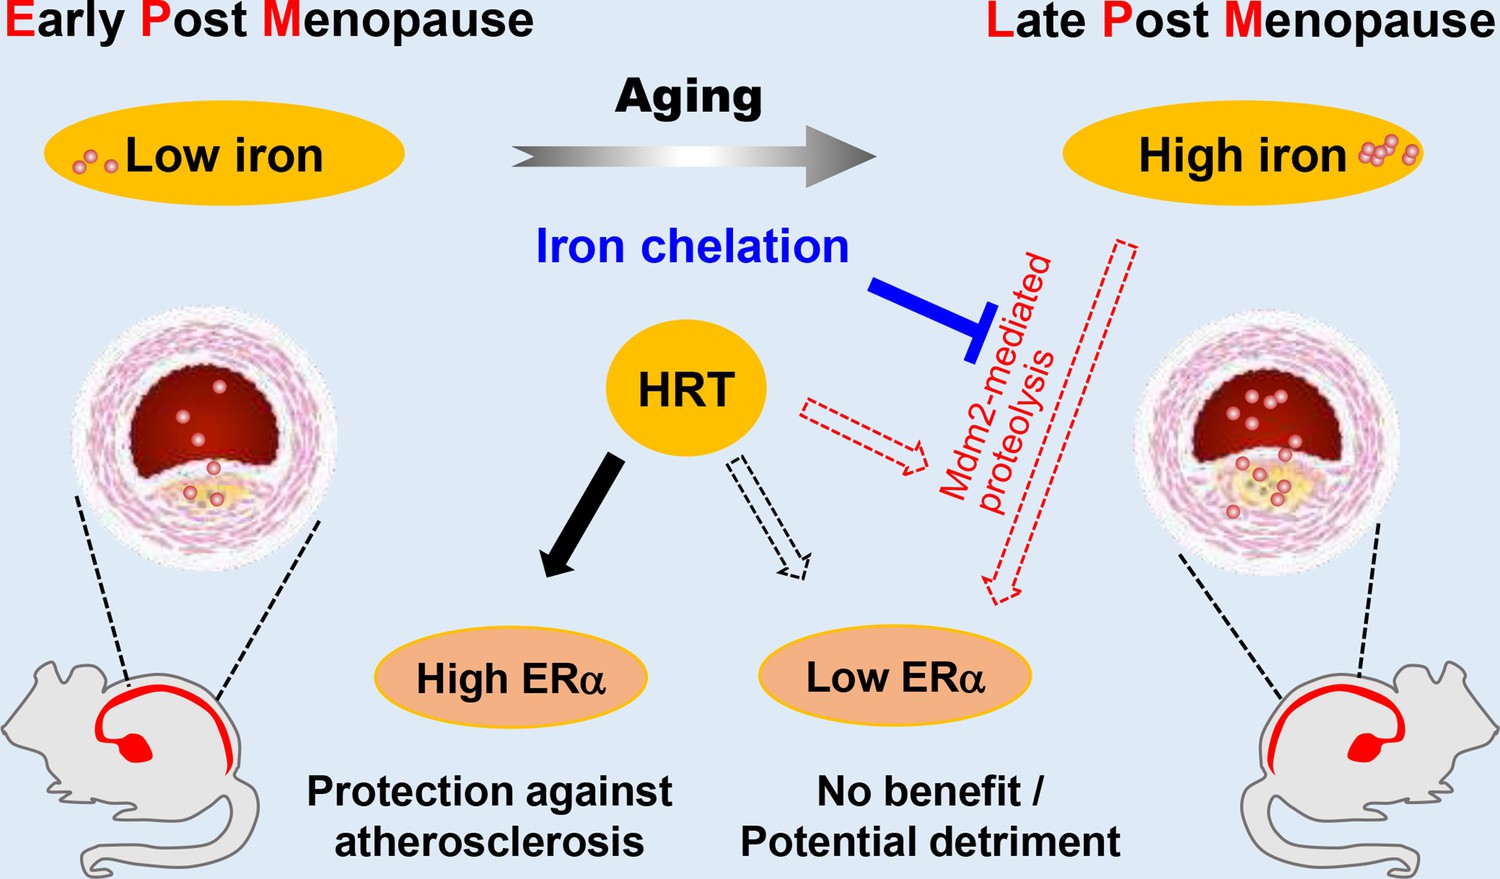
Schematic model for the effects of postmenopausal iron accumulation with or without hormone replacement therapy (HRT) on atherosclerosis (AS) severity through modulating estrogen receptor α (ERα) expression.
Iron accumulation occurs naturally and gradually after menopause. In early postmenopausal (EPM), iron retention was mild, and ERα was responsive to HRT application to achieve protective effects. However, when iron overload is significant in late postmenopausal (LPM), Mdm2 is upregulated along with ERα downregulation. This negative correlation is potentiated by the application of HRT and iron accumulation with aging. Therefore, HRT use avails to aggravate the progression of AS in the LPM period. Iron chelation, however, reverses the adverse effect of HRT and attenuates the accelerated development of AS, suggesting a protective role of appropriate iron restriction in the LPM stage.
Author response image 1
Author response image 2

Author response image 3
Author response image 4

Author response image 5
Tables
Table 1
Clinical data of 20 patients with atherosclerosis (AS).
| EPM | LPM | p-value | |
|---|---|---|---|
| Age | 59.3 ± 3.7 | 77.5 ± 4.5 | <0.0001 |
| Risk factors | |||
| Smoking history | 2 | 1 | 0.232 |
| Hypercholesterolemia | 4 | 8 | 1.000 |
| Hypertension | 7 | 8 | 0.334 |
| Coronary artery disease | 4 | 6 | 0.241 |
| Cerebral infarction | 4 | 5 | 0.548 |
| Cholesterol-lowering drug usage | 5 | 8 | 1.000 |
| Symptoms | |||
| Chest distress | 5 | 6 | 0.548 |
| Dizzy | 6 | 8 | 0.081 |
| Plaque type | |||
| Stable plaque | 5 | 3 | 0.207 |
| Vulnerable plaque | 5 | 7 | 0.207 |
-
EPM, early postmenopausal; LPM, late postmenopausal.
-
Table 1—source data 1
Patient clinical information.
- https://cdn.elifesciences.org/articles/80494/elife-80494-table1-data1-v1.zip
Additional files
Download links
A two-part list of links to download the article, or parts of the article, in various formats.
Downloads (link to download the article as PDF)
Open citations (links to open the citations from this article in various online reference manager services)
Cite this article (links to download the citations from this article in formats compatible with various reference manager tools)
Hormone replacement therapy for postmenopausal atherosclerosis is offset by late age iron deposition
eLife 12:e80494.
https://doi.org/10.7554/eLife.80494


