Complex subsets but redundant clonality after B cells egress from spontaneous germinal centers
- Program in Cellular and Molecular Medicine, Boston Children’s Hospital, United States
- Harvard-MIT Health Sciences and Technology, Harvard Medical School, United States
- Department of Pediatrics, Harvard Medical School, United States
Figures
Figure 1 with 1 supplement
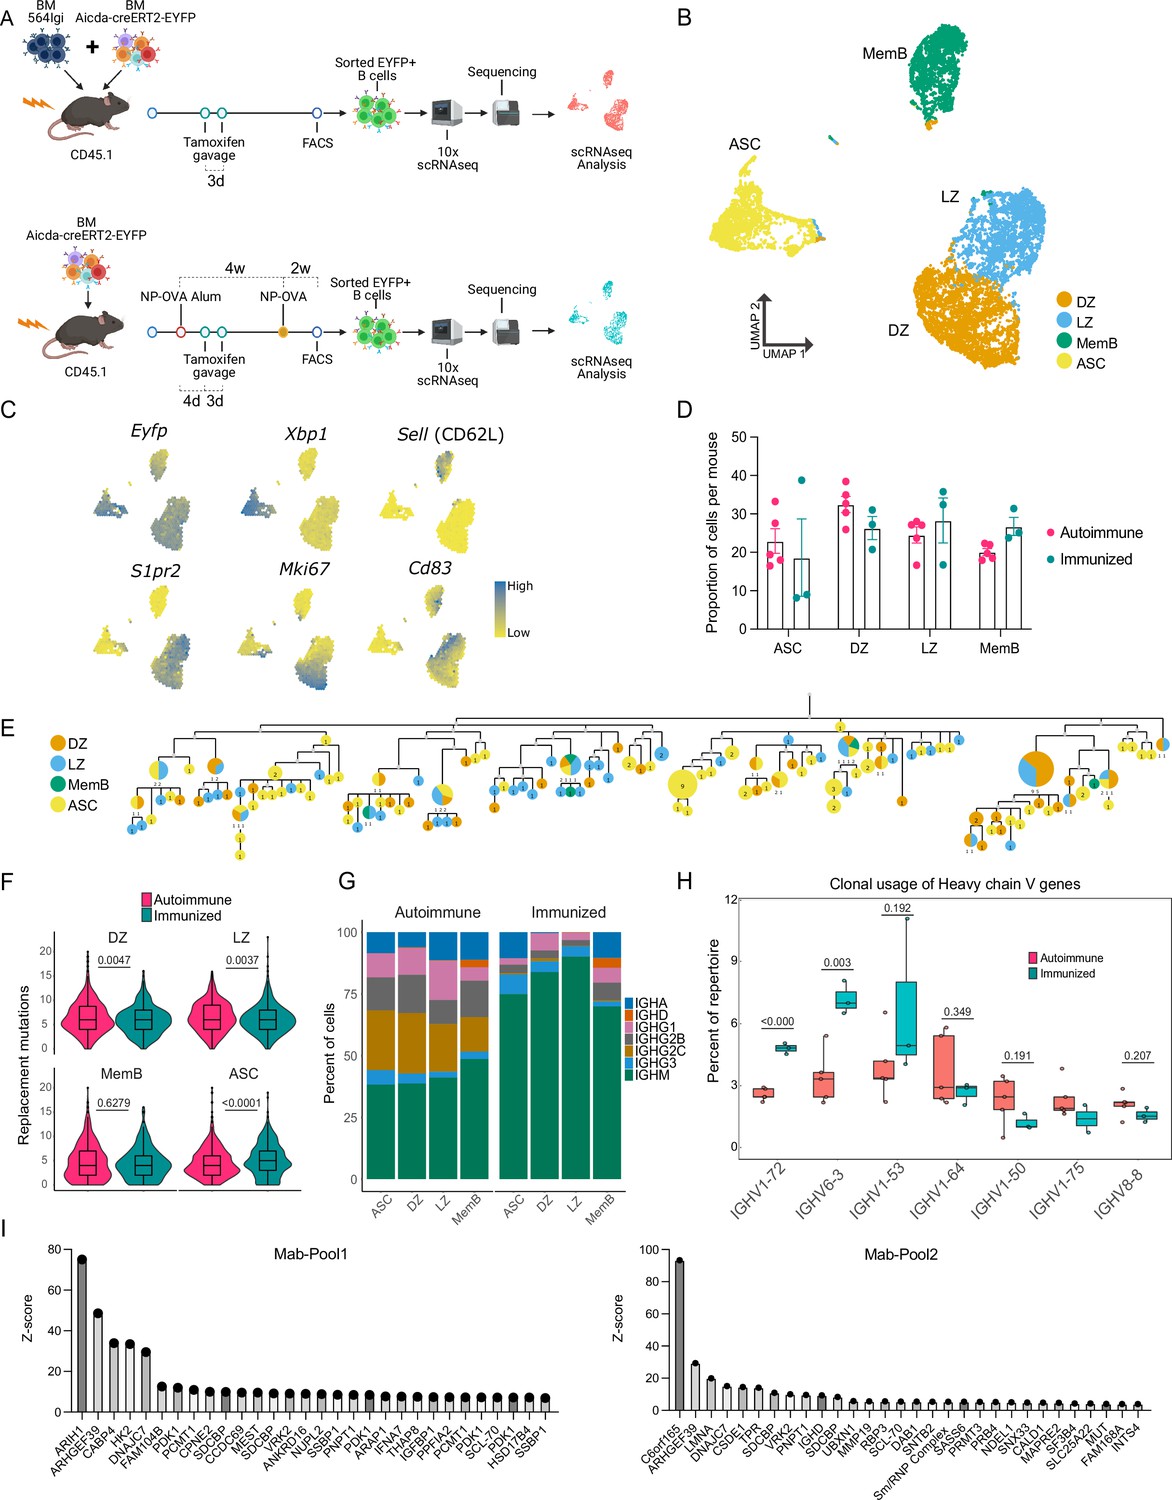
B cells with a WT repertoire are found in all compartments of autoimmune chimeras.
(A) Experimental setup to produce the autoimmune and immunized chimeras and selection for single-cell sequencing. (B–H) Single-cell RNA-seq data from autoimmune (n = 5) and immunized (n = 3) chimeras. (B) Two-dimensional UMAP representation of single-cell transcriptomic data from all cells from autoimmune and immunized chimeras. (C) Gene expression of conventional markers was used to assign an identity to the clusters. Log normalized expression. (D) Proportion of cells belonging to the antibody-secreting cell (ASC), DZ, LZ, and memory B cell (MemB) clusters among all cells sequenced from each chimera. Each dot represents a mouse. (E) Phylogenetic tree of the most expanded clone in one of the autoimmune chimeras. Clonal members colored by assigned cluster. (F) Accumulated replacement mutations in each cluster by condition. Violin plot with embedded Tukey boxplot. (G) Isotype usage per cluster for each condition. (H) Clonal usage of selected V genes by condition. Each dot represents a mouse in a Tukey boxplot. IGHV 1–75 was only found in two immunized chimeras. (I) Z-score ranking of fluorescent detection for monoclonal pools Mab1 (left) and Mab2 (right) after HuProt microarray binding assay. The monoclonals originate from two autoimmune chimeras. Statistical values correspond to two-tailed Mann–Whitney test (F) and unpaired t-tests (H).
-
Figure 1—source data 1
Data for Figure 1D.
- https://cdn.elifesciences.org/articles/81012/elife-81012-fig1-data1-v2.csv
-
Figure 1—source data 2
Data for Figure 1F.
- https://cdn.elifesciences.org/articles/81012/elife-81012-fig1-data2-v2.csv
-
Figure 1—source data 3
Data for Figure 1H.
- https://cdn.elifesciences.org/articles/81012/elife-81012-fig1-data3-v2.csv
Figure 1—figure supplement 1
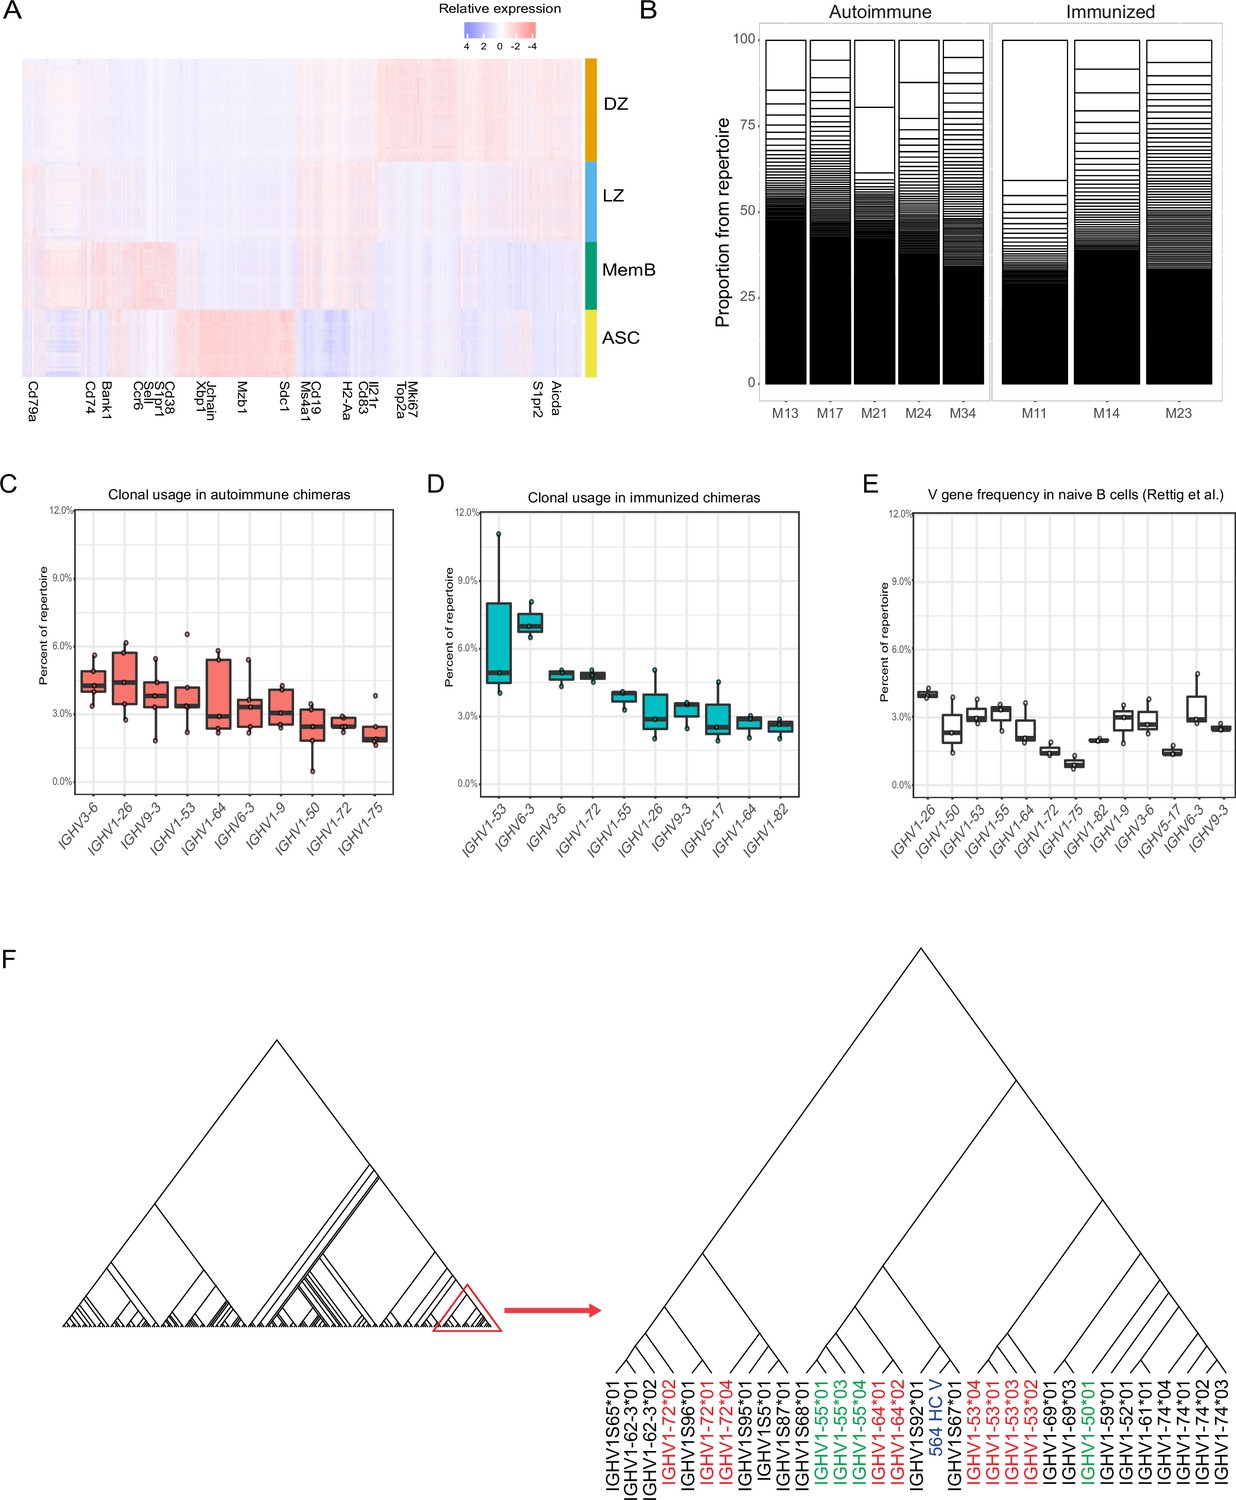
Transcriptomic and repertoire profile of main clusters.
(A) Relative gene expression heatmap for the top 25 defining genes from each of the main clusters. Selected genes for traditional markers are labeled. (B) Clonal proportion of the BCR repertoire per mouse. Each white box represents the proportion of a clone per mouse. (C) Clonal V gene usage in the autoimmune chimeras (n = 5). Top 10 most used V genes are shown. Each dot represents a mouse in a Tukey boxplot. (D) Clonal V gene usage in the immunized chimeras (n = 3). Top 10 most used V genes are shown. Each dot represents a mouse in a Tukey boxplot. (E) V gene frequency in naïve CD57B6 mice for the top 10 V genes from autoimmune and immunized chimeras. Data (n = 3) extracted from Rettig et al. (F) Phylogenetic tree of C57B6 V genes including the VDJ sequence for the transgenic BCR from 564Igi.
Figure 2 with 1 supplement
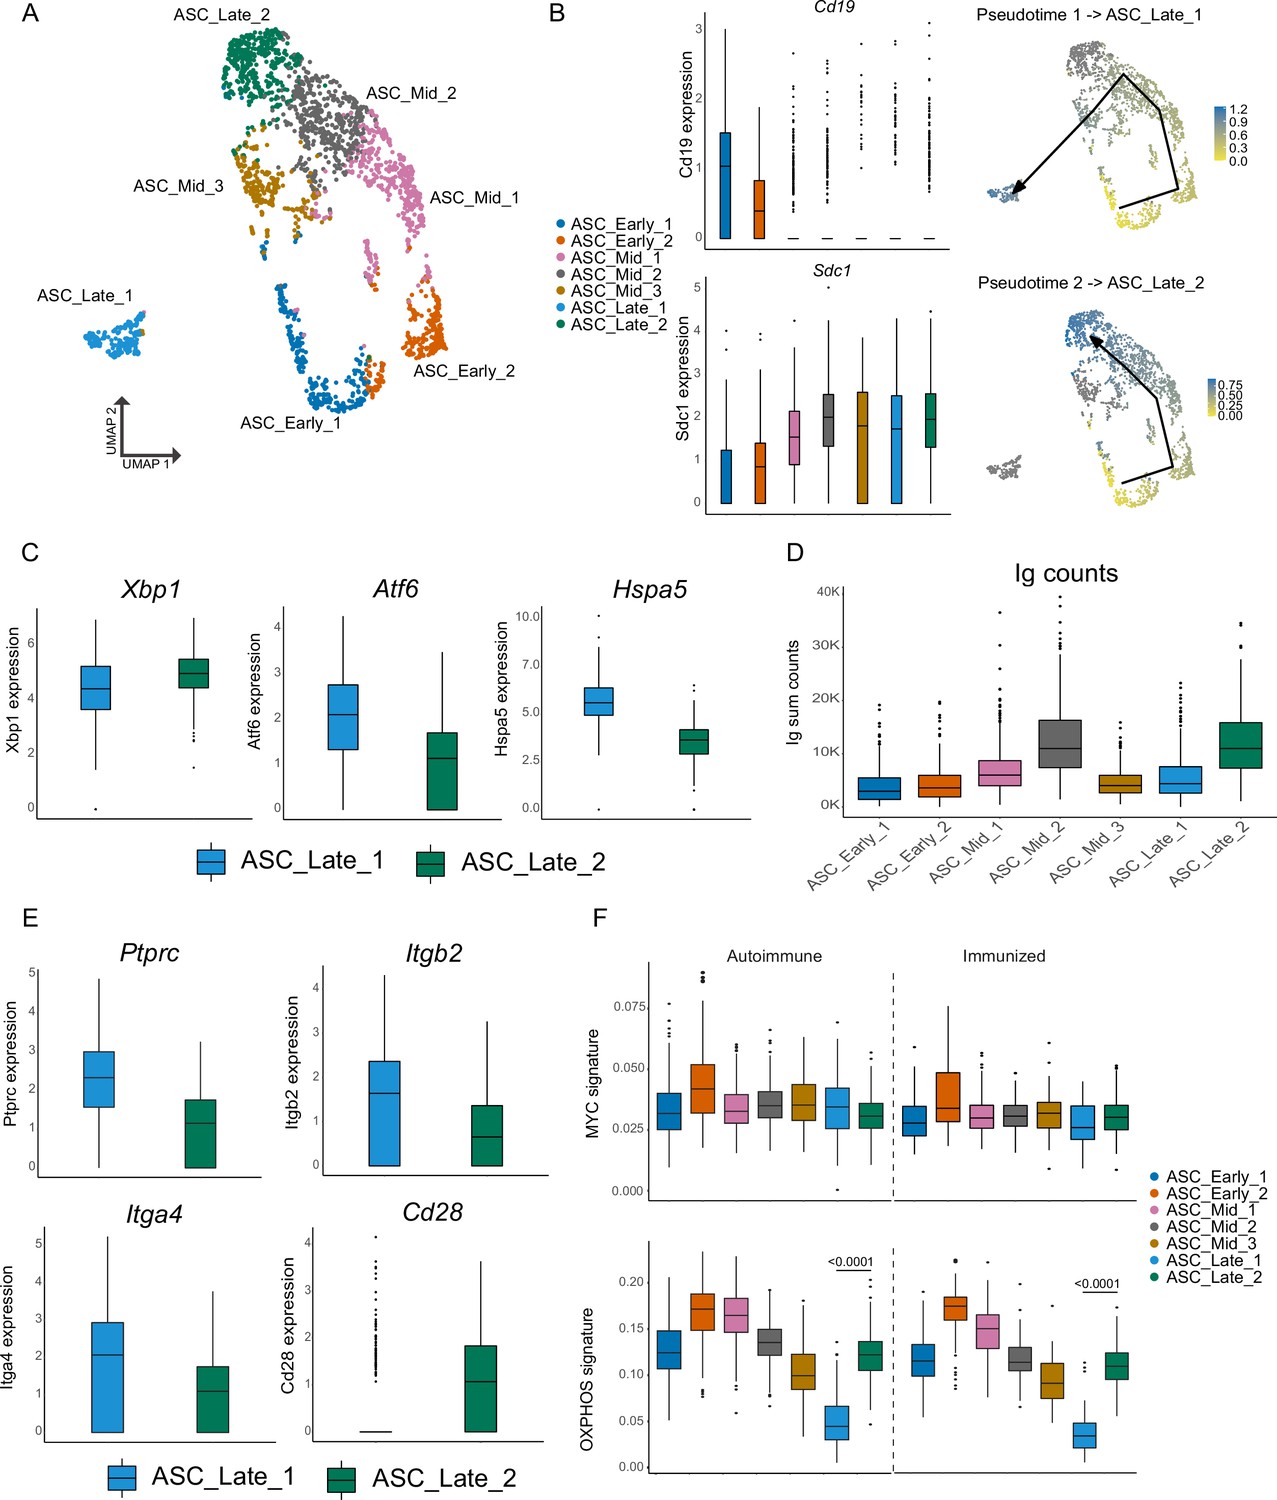
Antibody-secreting cells (ASCs) mature into two distinct terminal clusters.
(A) Two-dimensional UMAP representation of ASCs and their assigned subcluster for all ASC cells from autoimmune and immunized chimeras. (B) Cluster normalized gene expression levels for Cd19 and Sdc1 (left) and Slingshot pseudotime-based trajectory of ASCs (right). Tukey boxplot for gene expression. (C) Normalized gene expression level of Xbp1, Atf6, and Hspa5 in ASC_Late_1 and ASC_Late_2. (D) Total counts of Ig transcripts for all ASC subclusters, including both autoimmune and immunized chimeras. (E) Normalized gene expression level of surface markers Ptprc, Itgb2, Itga4, and Cd28 in ASC_Late_1 and ASC_Late_2. (F) Single-cell level scoring for MYC and OXPHOS signature profiling of ASC subclusters with AUCell, split by condition. Statistical values correspond to one-way analysis of variance (ANOVA) with Tukey correction for multiple comparisons (F).
-
Figure 2—source data 1
Data for Figure 2F, antibody-secreting cell (ASC) OXPHOS autoimmune graph.
- https://cdn.elifesciences.org/articles/81012/elife-81012-fig2-data1-v2.csv
-
Figure 2—source data 2
Data for Figure 2F, antibody-secreting cell (ASC) OXPHOS immunized graph.
- https://cdn.elifesciences.org/articles/81012/elife-81012-fig2-data2-v2.csv
Figure 2—figure supplement 1
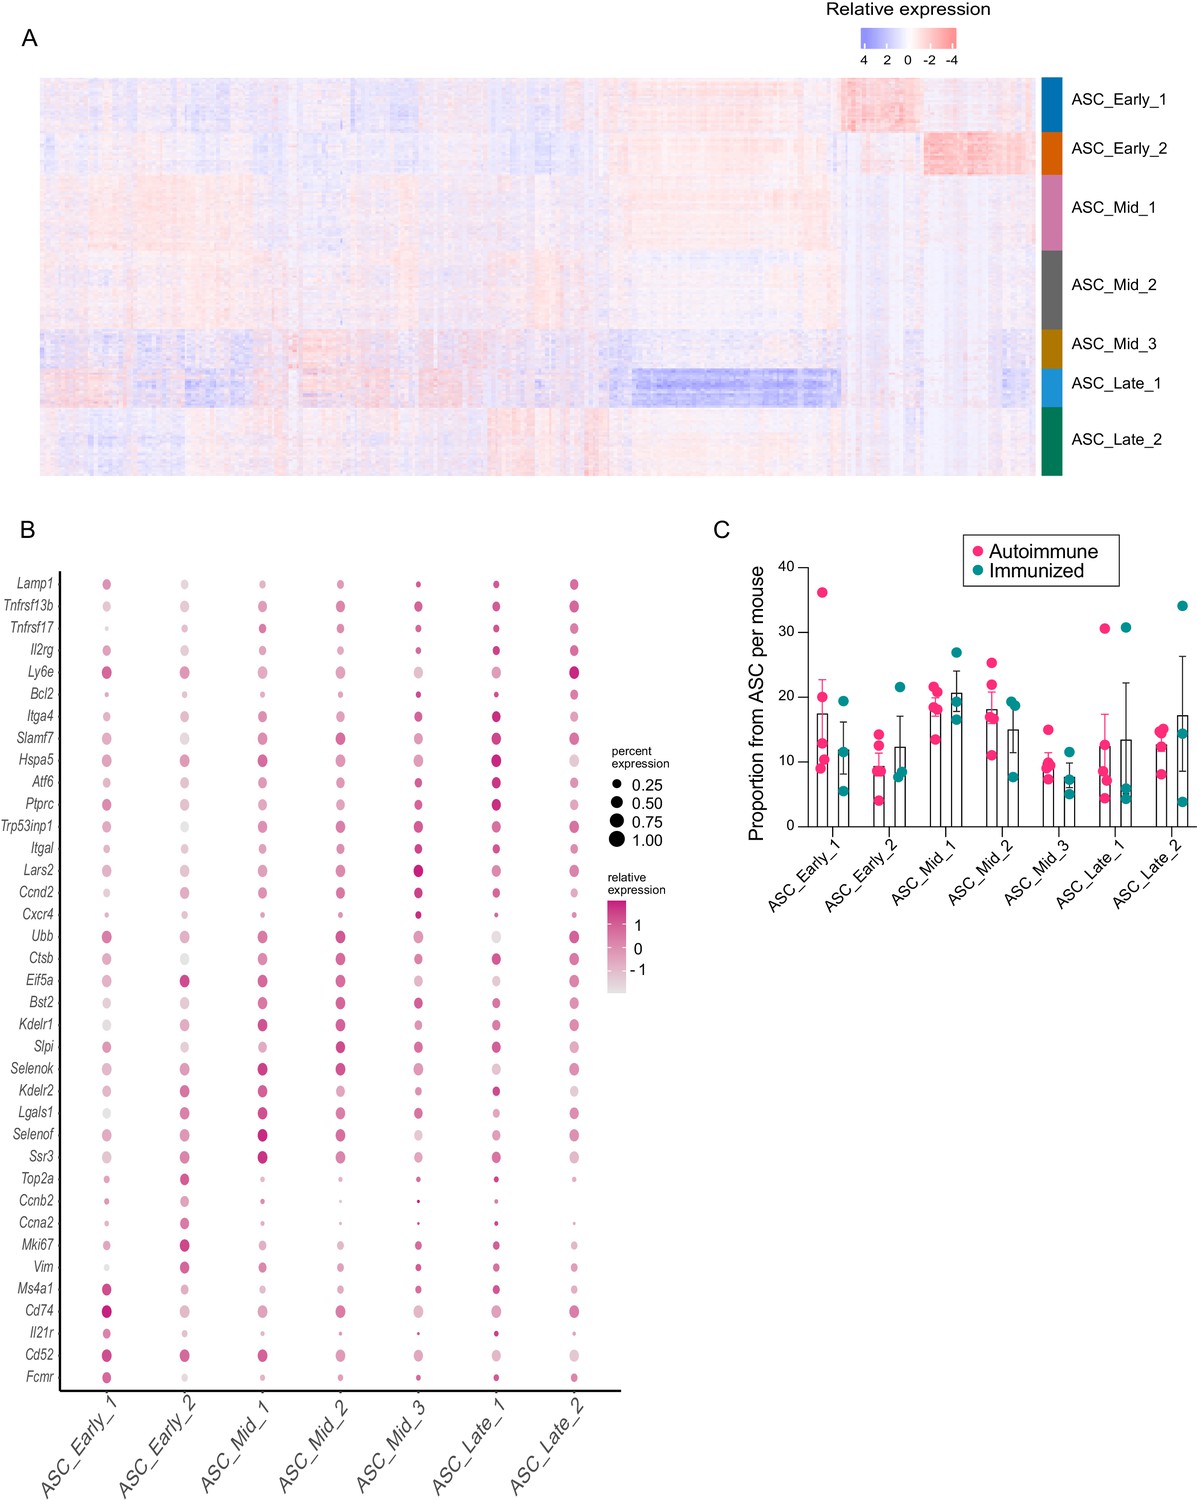
Complexity of the antibody-secreting cell (ASC) compartment.
(A) Relative gene expression heatmap for the top 25 marker genes from ASC subclusters. (B) Dotplot representation of relative gene expression and coverage of selected markers for each ASC subcluster. (C) Proportion of ASC subclusters per mouse in autoimmune and immunized chimeras. Each dot represents a mouse.
Figure 3
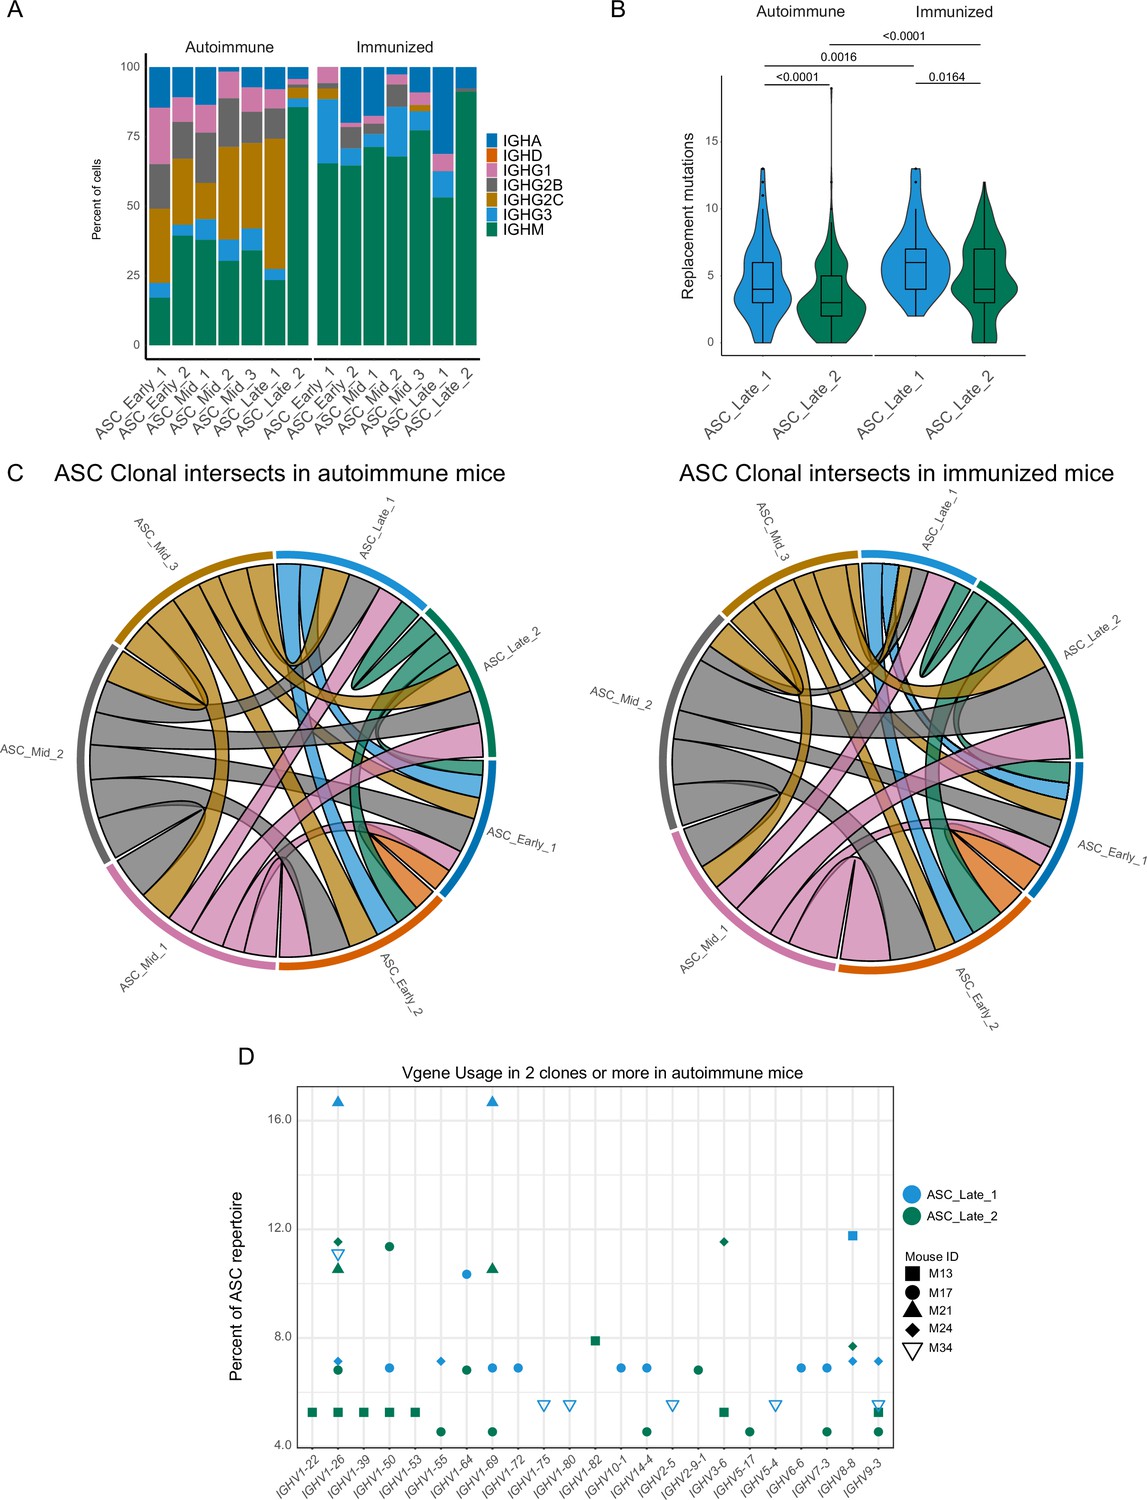
Terminal states of antibody-secreting cells (ASCs) have different repertoire characteristics but maintain clonal overlap.
(A) ASC subcluster isotype usage proportion by condition. (B) Replacement mutation accumulation in ASC_Late_1 and ASC_Late_2 by condition. Violin plot with Tukey boxplot overlay. (C) ASC subcluster clonal intersects in autoimmune (left) and immunized (right) chimeras, including all ASCs per condition. Connector ribbons’ width represents number of shared clones (see Supplementary file 1). (D) Clonal V-gene usage in ASC_Late_1 and ASC_Late_2 of autoimmune chimeras, per mouse. Only V genes used in two clones or more are displayed. Statistical values correspond to two-tailed Mann–Whitney test (B).
-
Figure 3—source data 1
Data for Figure 3B.
- https://cdn.elifesciences.org/articles/81012/elife-81012-fig3-data1-v2.csv
Figure 4 with 1 supplement
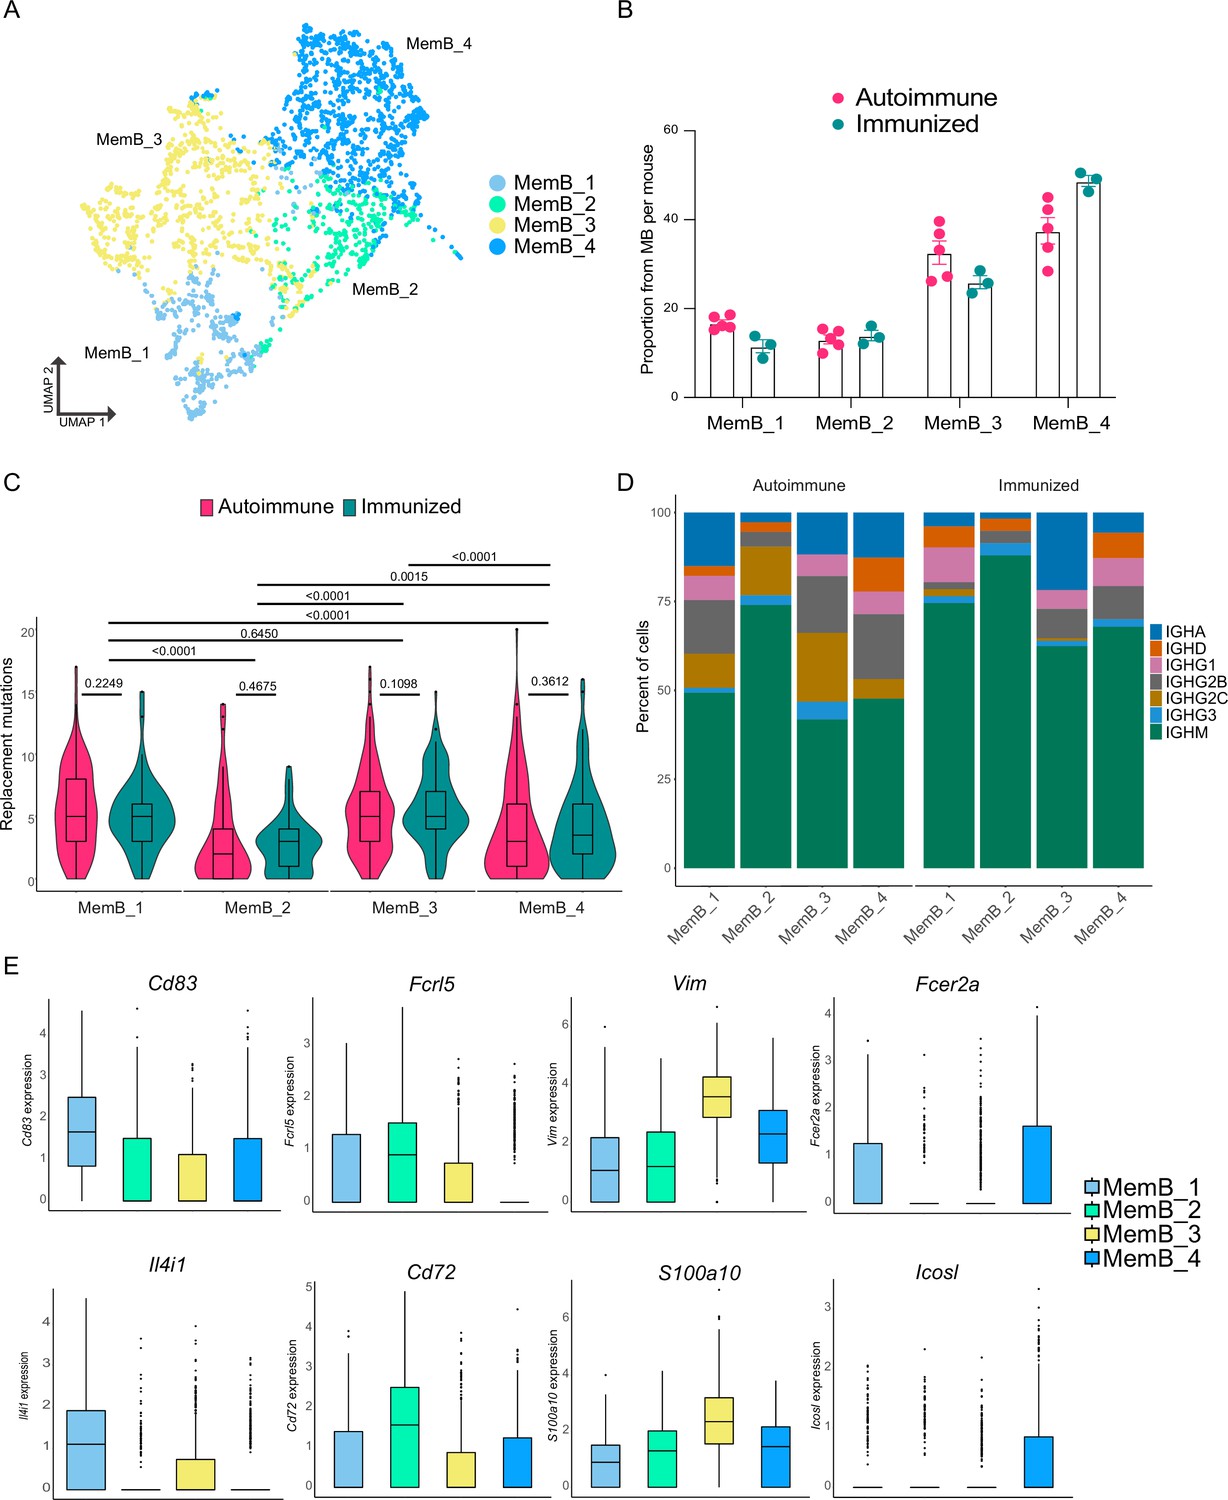
Memory B cells (MemBs) are grouped in four subclusters with distinct transcriptomic and BCR profiles.
(A) UMAP distribution of all cells in the MemB compartment colored by subclusters. (B) Proportion of MemBs in each subcluster per mouse. Each dot represents a mouse. (C) Replacement mutation accumulation in each MemB subcluster by condition. Violin plots embedded with Tukey boxplots. (D) Proportion of isotype usage for each MemB subcluster by condition. (E) Normalized gene expression of markers that characterize each MemB subcluster. Combined expression from autoimmune and immunized chimeras. Statistical values correspond to two-tailed Mann–Whitney tests (C).
-
Figure 4—source data 1
Data for Figure 4B.
- https://cdn.elifesciences.org/articles/81012/elife-81012-fig4-data1-v2.csv
-
Figure 4—source data 2
Data for Figure 4C, by cluster.
- https://cdn.elifesciences.org/articles/81012/elife-81012-fig4-data2-v2.csv
-
Figure 4—source data 3
Data for Figure 4C, within cluster.
- https://cdn.elifesciences.org/articles/81012/elife-81012-fig4-data3-v2.csv
Figure 4—figure supplement 1
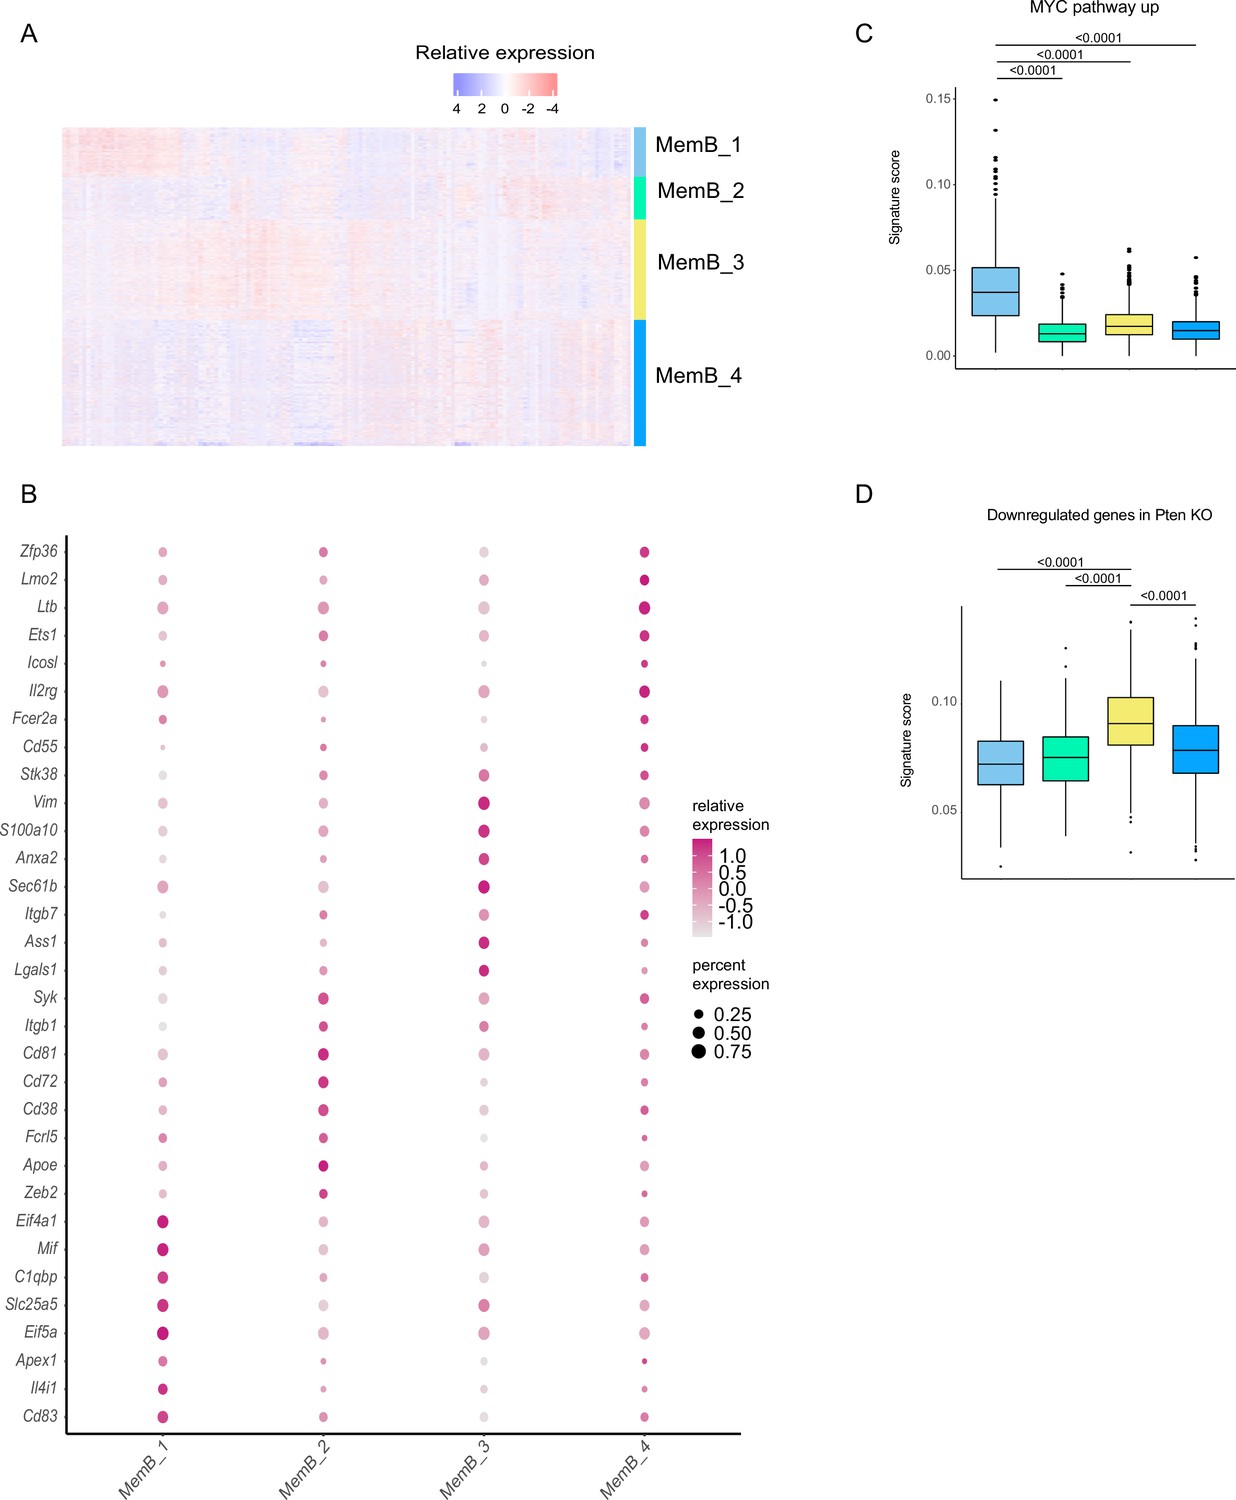
Complexity of the memory B cell (MemB) compartment.
(A) Relative gene expression heatmap for the top 25 marker genes for each MemB subcluster. (B) Relative gene expression and coverage dotplot for selected MemB subcluster markers. (C) Myc pathway single-cell signature analysis score with AUCell. (D) Single-cell gene signature score for genes downregulated in Pten KO with AUCell. Statistical values correspond to one-way analysis of variance (ANOVA) with Tukey correction for multiple comparisons (C, D).
Figure 5
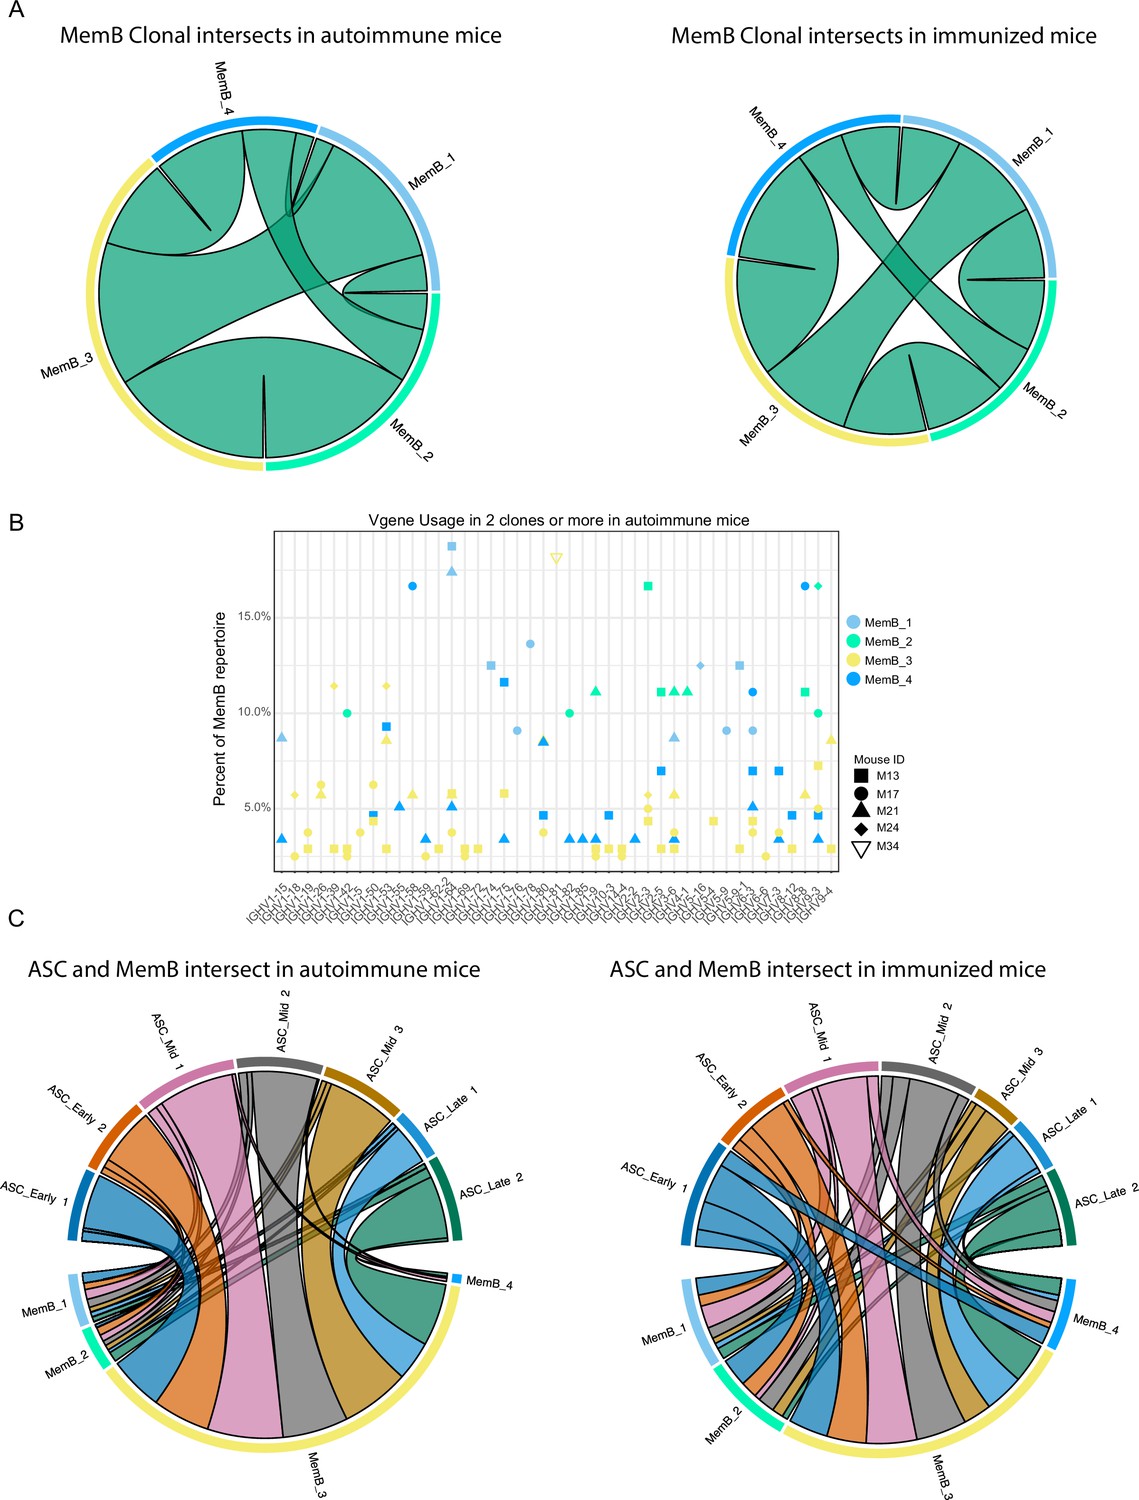
Clonal relations among and between memory B cell (MemB) and antibody-secreting cell (ASC) subclusters.
(A) Clonal intersects among MemB subclusters in autoimmune (left) and immunized (right) chimeras. Connector ribbons’ width represents number of shared clones (see Supplementary file 1). (B) Clonal V gene usage in MemB subclusters for the autoimmune chimeras, per mouse. Only V genes used in two clones or more. (C) Clonal intersects between ASC and MemB subclusters in autoimmune (left) and immunized (right) chimeras. Connector ribbons’ width represents number of shared clones (see Supplementary file 1).
Figure 6 with 1 supplement
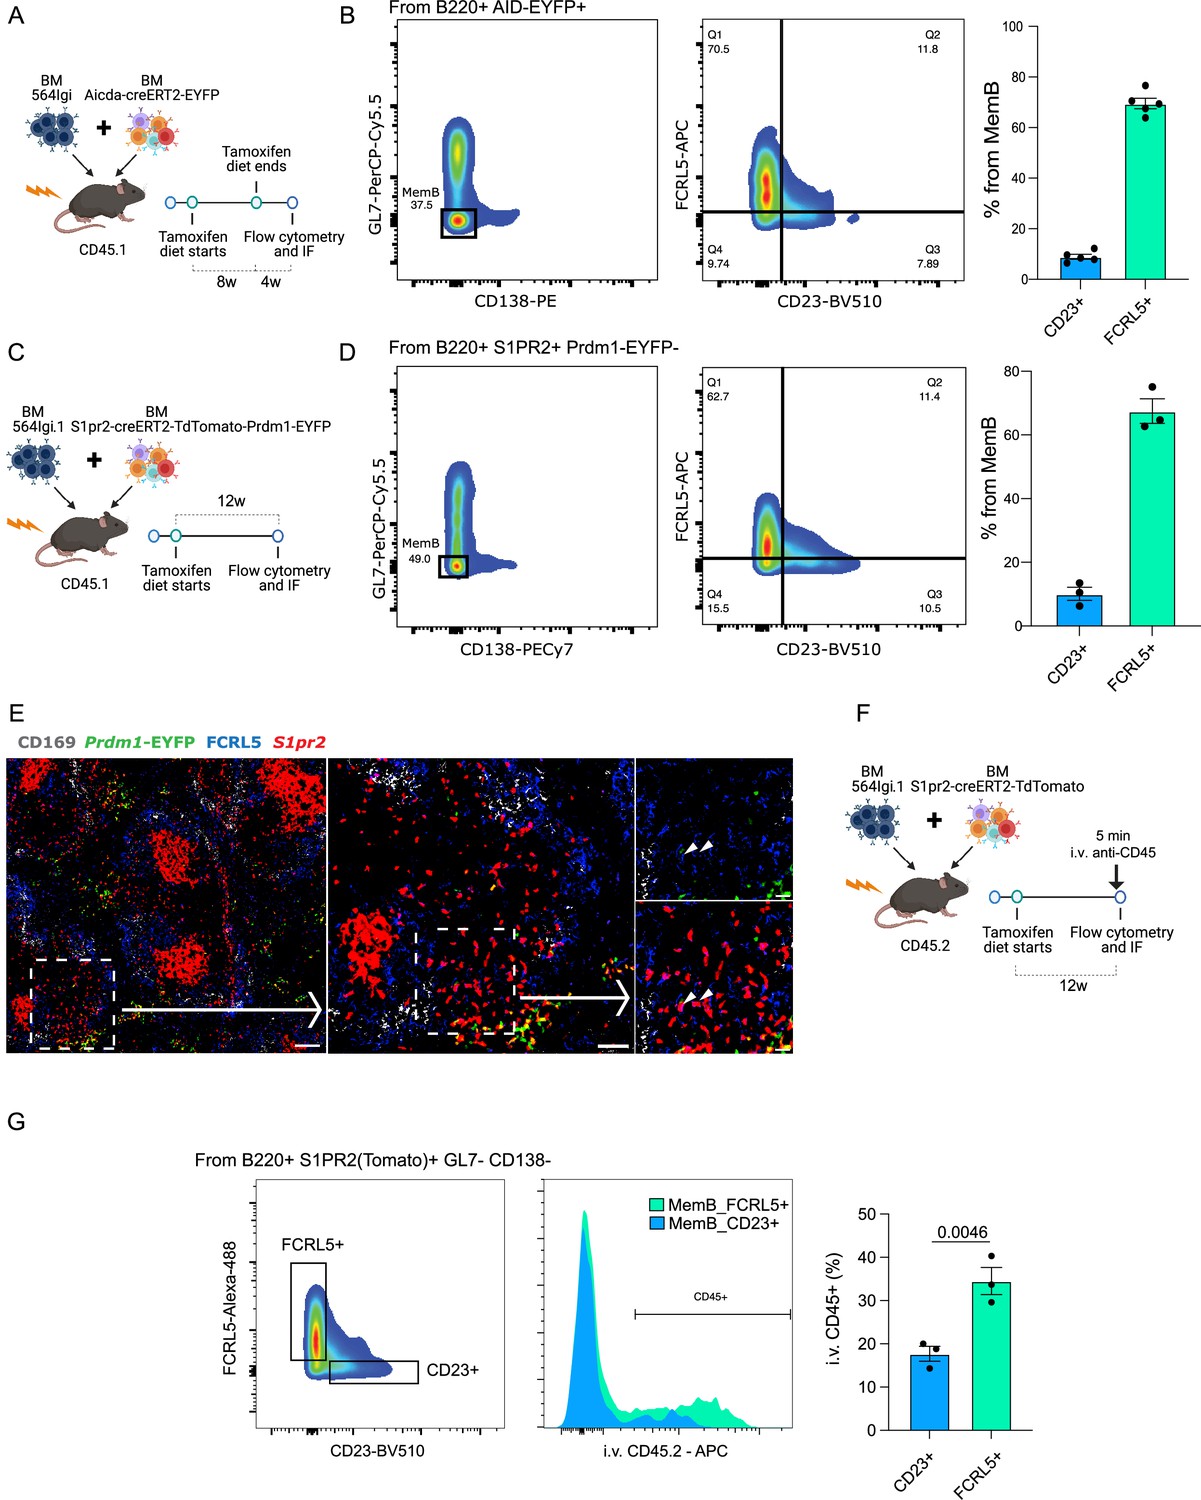
FCRL5+ and CD23+ fate-mapped memory B (MemB) cells have different preferential localization.
(A) Experimental design to validate presence of fate-mapped FCRL5+ and CD23+ MemBs. (B) Identification of discrete populations of FCRL5+ and CD23+ MemB cells with Aicda-CreERT2-EYFP reporter mice by flow cytometry (n = 5 chimeras). (C) Experimental design for using S1pr2-CreERT2-tdTomato fate mapping in autoimmune chimeras. (D) Identification of discrete populations of FCRL5+ and CD23+ MemB cells with S1pr2-CreERT2-tdTomato fate mapping in autoimmune chimeras by flow cytometry (n = 3 chimeras). (E) Splenic localization of FCRL5+ S1PR2(Tomato)+ MemB cells by confocal microscopy. Overview of a spleen from autoimmune chimeras (Figure 3C), left, and selected area, center, delineates a bridging channel for a close-up examination of FCRL5+ S1pr2tomato+, right. Arrow points to FCRL5+ MemBs. Scale bars represent 100 µm (left), 50 µm (center), and 20 µm (right). Arrow heads point to FCRL5+ S1PR2(Tomato)+ cells. (F) Experimental design for in vivo marginal zone labeling. S1pr2-CreERT2-tdTomato:564Igi chimeras intravenously (i.v.) injected with 5 µg of anti-CD45-APC for 5 min before organ extraction. (G) Flow cytometry gate strategy to evaluate i.v. CD45 labeling between MemB FCRL5+ and MemB CD23+ cells. Statistical values correspond to one-tailed unpaired Student t-test (G).
Figure 6—figure supplement 1
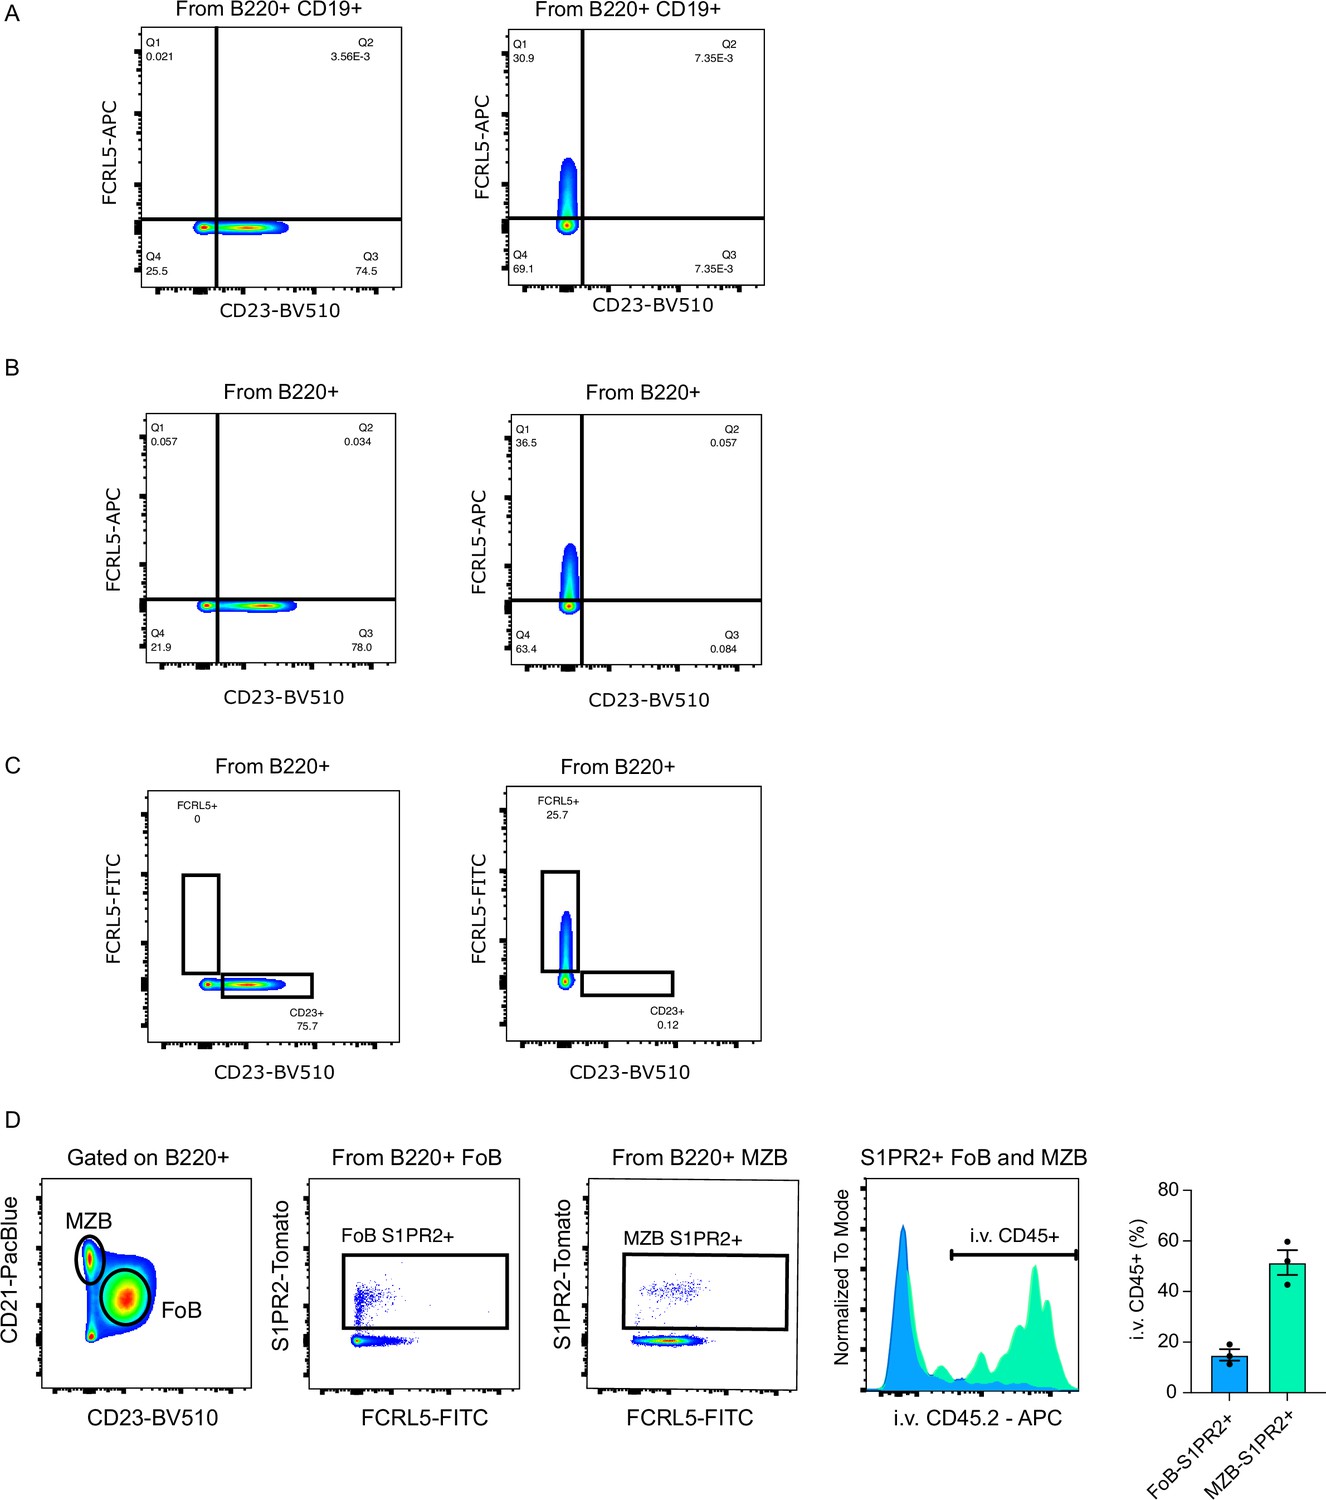
Controls for validation of memory B cell (MemB) clusters by flow cytometry.
(A) FCRL5 and CD23 FMO gating strategies for Figure 6B. (B) FCRL5 and CD23 FMO gating strategies for Figure 6D. (C) FCRL5 and CD23 FMO gating strategies for Figure 6G. (D) Validation of intravenously (i.v.) staining with CD45 by conventional gating for FoB and MZB cells for the same chimeras in Figure 6G.
Author response image 1

Normalized gene expression of Cd80 (left) and Pdcd1lg2(coding for PD-L2, right), split by MemB cluster and condition.
Author response image 2

Flow cytometry profile for CD49d expression for a representative 564:S1pr2 chimera, showing the CD49d lo an CD49 hi populations within the B cell, Plasmablast and Plasma cell conventional gates.
Author response image 3
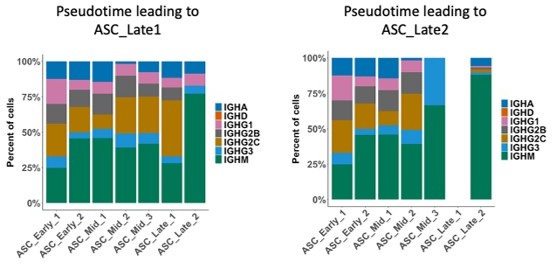
Isotype usage per ASC cluster, showed only for cells assigned to Pseudotime_1 (left) or Pseudotime_2 (right).
Tables
Key resources table
| Reagent type (species) or resource | Designation | Source or reference | Identifiers | Additional information |
|---|---|---|---|---|
| Strain, strain background (M. musculus) | AicdaCreERT2 | C-A Reynaud, J-C Weill. (Institut Necker) | ||
| Strain, strain background (M. musculus) | S1pr2CreERT2 BAC-transgenic | T. Kurosaki (RIKEN-Yokohama) | ||
| Strain, strain background (M. musculus) | B6.Cg-Tg(Prdm1-EYFP)1Mnz/J | Jackson Laboratories | ||
| Strain, strain background (M. musculus) | C57BL/6J | Jackson Laboratories | ||
| Strain, strain background (M. musculus) | B6.SJL | Jackson Laboratories | ||
| Strain, strain background (M. musculus) | 564Igi | Theresa Imanishi-Kari (Tufts University) | ||
| Strain, strain background (M. musculus) | 564Igi.1 | This manuscript | ||
| Antibody | anti-CD45.2-APC (104) (mouse monoclonal) | Biolegend | 109814 | 1:300 |
| Antibody | anti-CD23-BV510 (B3B4) (rat monoclonal) | Biolegend | 101623 | 1:300 |
| Antibody | anti-B220-PacBlue (RA3-6B2) (rat monoclonal) | Biolegend | 103227 | 1:300 |
| Antibody | anti-B220-PerCP/Cy5.5 (RA3-6B2) (rat monoclonal) | Biolegend | 103234 | 1:300 |
| Antibody | anti-GL7-PacBlue (GL7)(rat monoclonal) | Biolegend | 144614 | 1:300 |
| Antibody | anti-GL7-PerCP/Cy5.5 (GL7) (rat monoclonal) | Biolegend | 144610 | 1:300 |
| Antibody | anti-CD138-Biotin (281-2) (rat monoclonal) | Biolegend | 142512 | 1:300 |
| Antibody | anti-CD138-PE (281-2)(rat monoclonal) | Biolegend | 142504 | 1:300 |
| Antibody | anti-CD45.1-APC (A20)(mouse monoclonal) | Biolegend | 110714 | 1:300 |
| Peptide, recombinant protein | Streptavidin | Biolegend | 405206 | |
| Antibody | anti-FCRL5-Alexa488 (sheep polyclonal) | biotechne | FAB6757G | 1:10 |
| Antibody | anti-FCRL5-APC (sheep polyclonal) | biotechne | FAB6757A | 1:10 |
| Commercial assay, kit | Fixable Viability Dye eFluor 780 | Thermo Fisher | 65-0865-14 | 1:1000 |
| Commercial assay, kit | Pan B Cell Isolation Kit II, mouse | Miltenyi | 130-104-443 | |
| Peptide, recombinant protein | NP-OVA | Biosearch | N-5051-10 | |
| Chemical compound, drug | Tamoxifen | Sigma-Aldrich | T5648-5G | |
| Chemical compound, drug | Imject Alum | Thermo Fisher Scientific | 77161 | |
| Software, algorithm | FlowJo | FlowJo LLC | ||
| Software, algorithm | Prism | GraphPad | ||
| Software, algorithm | R | R Foundation | 4.1.2 | |
| Software, algorithm | Cellranger | 10× Genomics | 5.0.1 | |
| Software, algorithm | GC tree | https://github.com/matsengrp/gctree (DeWitt et al., 2018) | ||
| Commercial assay, kit | HuProt v4.0 array | CDI Labs | ||
| Commercial assay, kit | Single Cell Immune Profiling | 10× Genomics | ||
| Software, algorithm | Immcantation | https://immcantation.readthedocs.io/en/stable/ |
Additional files
-
Supplementary file 1
Clonal overlap between and among antibody-secreting cell (ASC) and memory B cell (MemB) subsets.
This file contains the raw values for the circos plot graphs showing clonal intersects between subsets for Figures 3C and 5A, C.
- https://cdn.elifesciences.org/articles/81012/elife-81012-supp1-v2.xlsx
-
MDAR checklist
- https://cdn.elifesciences.org/articles/81012/elife-81012-mdarchecklist1-v2.docx
Download links
A two-part list of links to download the article, or parts of the article, in various formats.
Downloads (link to download the article as PDF)
Open citations (links to open the citations from this article in various online reference manager services)
Cite this article (links to download the citations from this article in formats compatible with various reference manager tools)
Complex subsets but redundant clonality after B cells egress from spontaneous germinal centers
eLife 12:e81012.
https://doi.org/10.7554/eLife.81012


