Exploiting the mediating role of the metabolome to unravel transcript-to-phenotype associations
- Center for Integrative Genomics, University of Lausanne, Switzerland
- Swiss Institute of Bioinformatics, Switzerland
- University Center for Primary Care and Public Health, Switzerland
- Department of Computational Biology, University of Lausanne, Switzerland
Figures
Figure 1 with 1 supplement
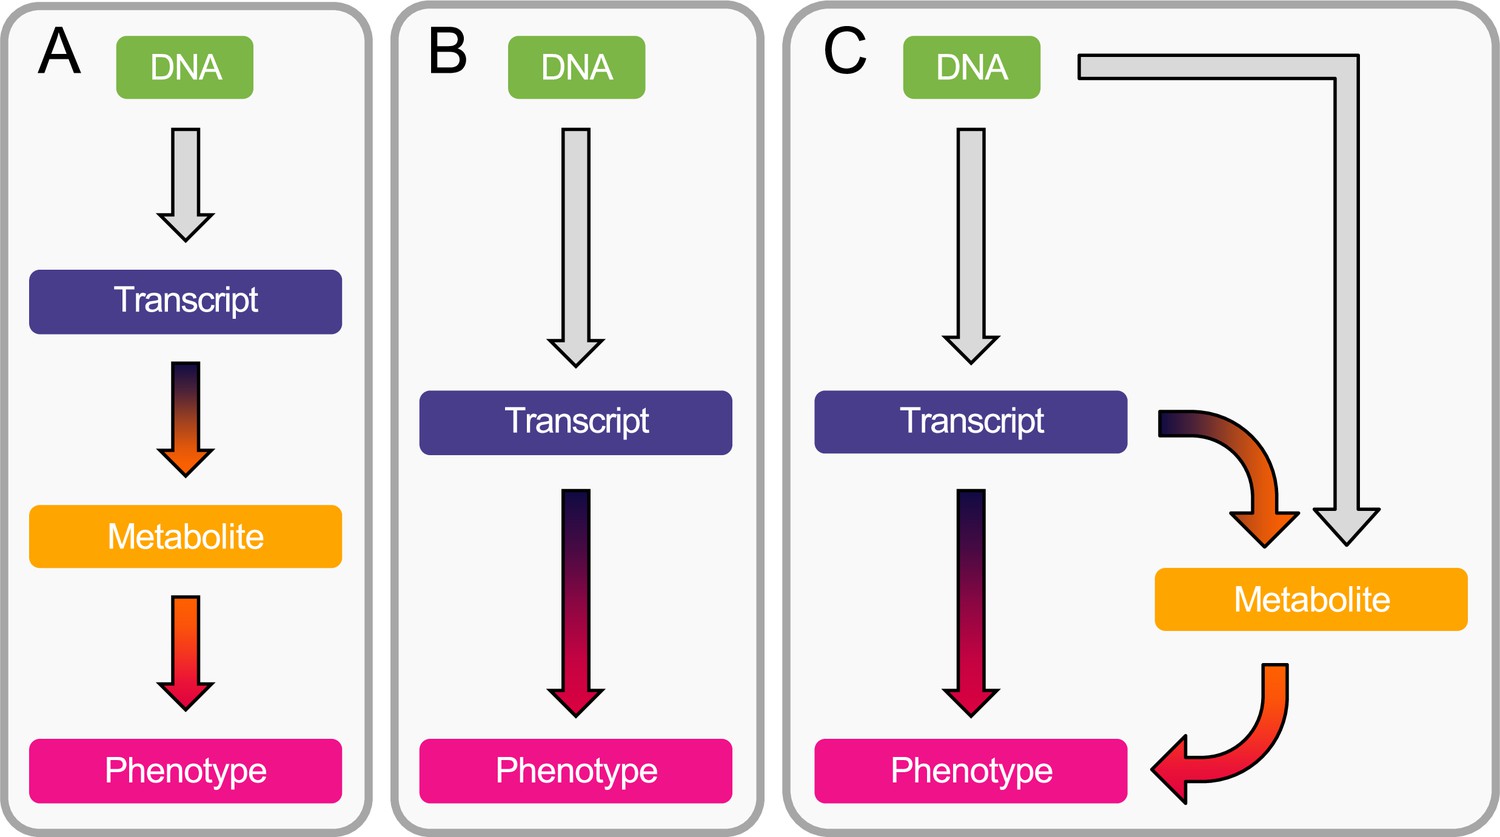
Workflow overview.
(A) Estimation of the causal transcript-to-metabolite and metabolite-to-phenotype effects through univariable Mendelian randomization (MR). (B) Estimation of the causal transcript-to-phenotype effects through univariable transcriptome-wide MR (TWMR). (C) Estimation of the direct (i.e., not mediated by the metabolites) and mediated effect of transcripts on phenotypes through multivariable MR (MVMR) by accounting for mediation through the metabolome.
Figure 1—figure supplement 1
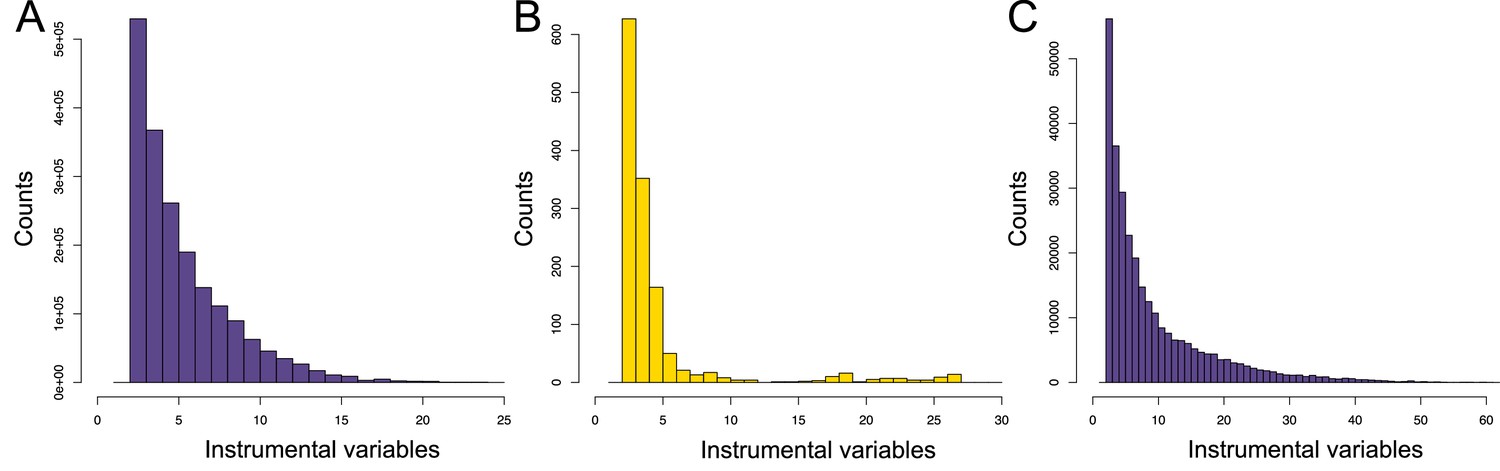
Number of instrumental variables (IVs) used for causal effect estimation through Mendelian randomization (MR).
Distribution of the number of IVs used by the univariable MR aiming at identifying (A) transcript-to-metabolite, (B) metabolite-to-phenotype, and (C) transcript-to-phenotype causal relations. Data related to Figure 1—figure supplement 1 panels A to C are available in Figure 1—figure supplement 1—source data 1.
-
Figure 1—figure supplement 1—source data 1
Number of instrumental variables (IVs) used for causal effect estimation through Mendelian randomization (MR).
Number of IVs used by the univariable MR aiming at identifying transcript-to-metabolite, metabolite-to-phenotype, and transcript-to-phenotype causal relations. This file relates to Figure 1—figure supplement 1.
- https://cdn.elifesciences.org/articles/81097/elife-81097-fig1-figsupp1-data1-v1.xlsx
Figure 2
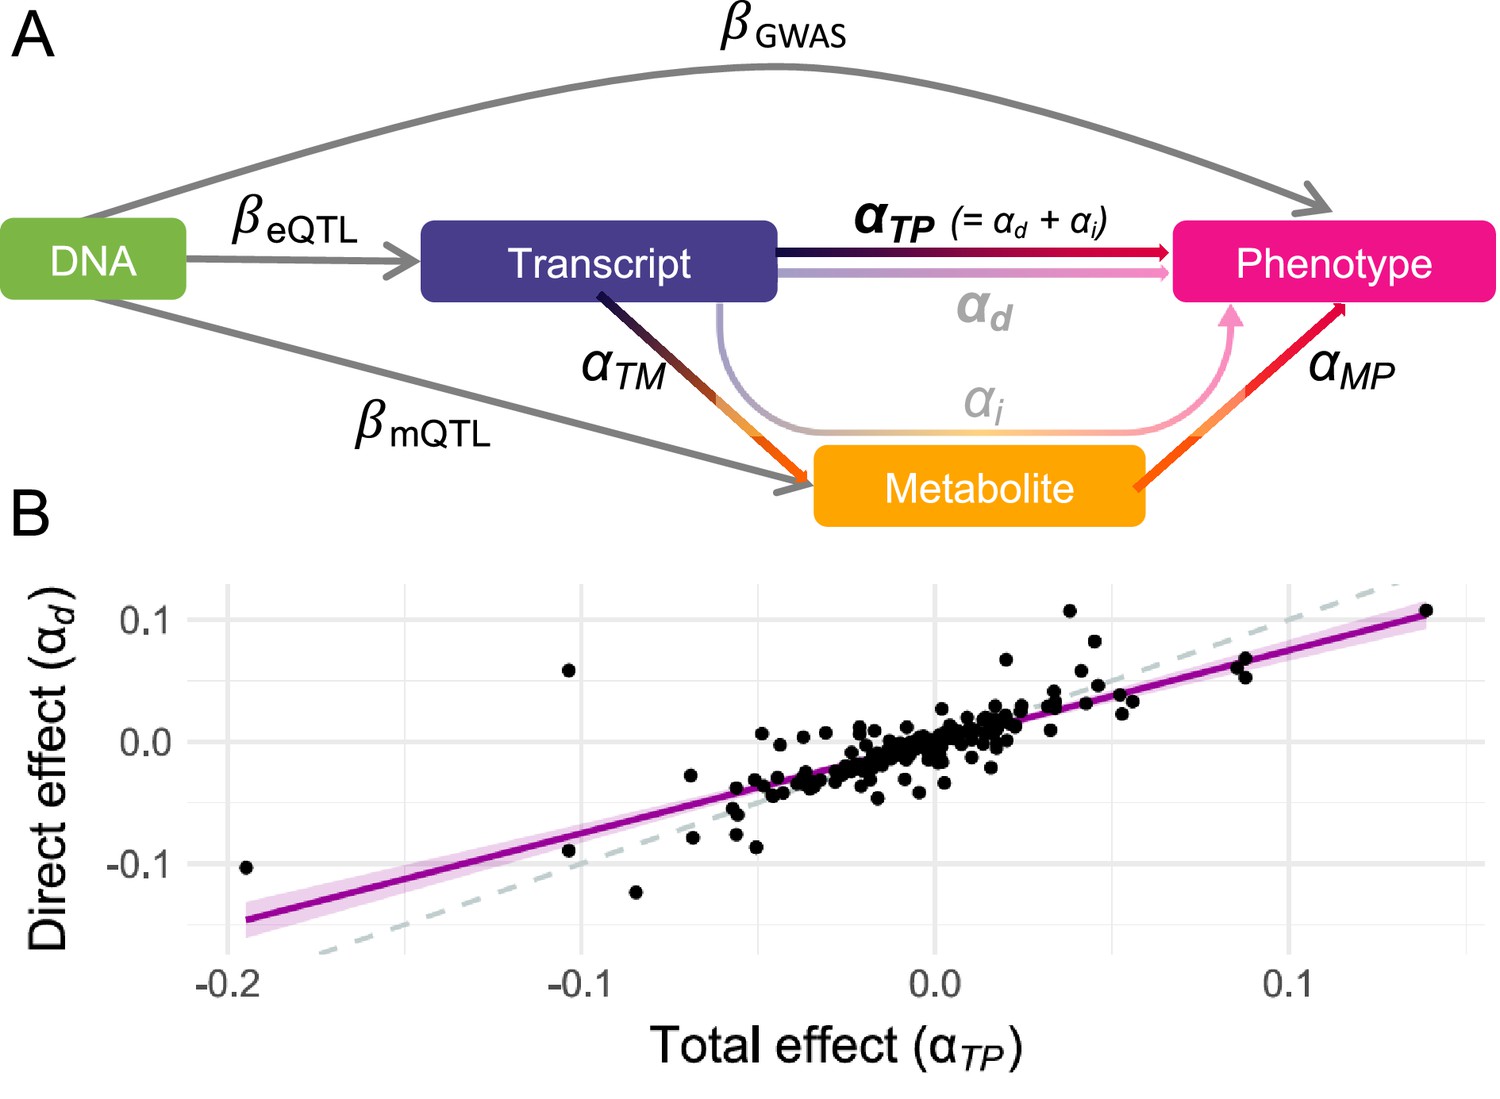
Direct and mediated effects.
(A) Graphical representation of the multivariable Mendelian randomization (MVMR) framework for mediation analysis: DNA represents genetic instrumental variables (IVs) chosen to be directly associated with either the exposure (transcript; ) or the mediator (metabolite; ) through summary statistics. The effect of these IVs on the outcome (phenotype; ) originates from genome-wide association studies (GWASs) summary statistics. Total effects of transcripts on phenotypes are estimated by transcriptome-wide Mendelian randomization (TWMR), while direct effects are estimated by MVMR. Total effects are assumed to equal the sum of the direct and indirect (i.e., mediated) effects, the two former being depicted in B. (B) Direct ( ; y-axis) and total ( ; x-axis) effects for the 216 transcript-metabolite-trait causal triplets. The dashed line represents the identity, while the purple line represents the regression line with a shaded 95% confidence interval. Data related to Figure 2 panel B are available in Figure 2—source data 1.
-
Figure 2—source data 1
Direct and mediated effects.
Total ( ; transcript-to-phenotype effect) and direct ( ; direct_effect) effects for the 216 transcript-metabolite-trait causal triplets involving the listed transcript (Gene_ID), metabolite (Shin_ID), and complex phenotype. This file relates to Figure 2B.
- https://cdn.elifesciences.org/articles/81097/elife-81097-fig2-data1-v1.xlsx
Figure 3
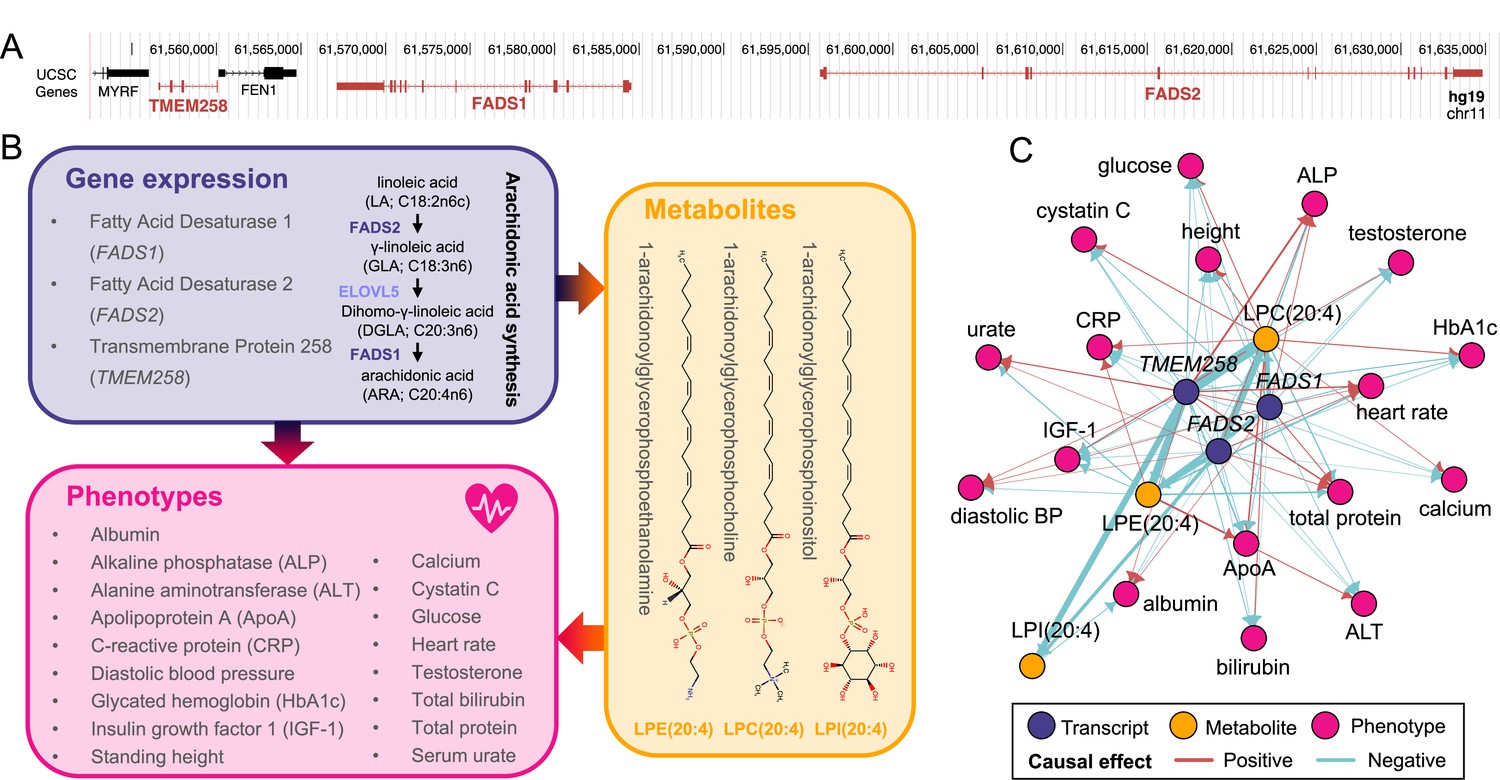
Molecular pleiotropy at the FADS locus.
(A) Genome browser (GRCh37/hg19) view of the genomic region on chromosome 11 encompassing TMEM258, FADS1, and FADS2 (red). (B) Diagram of the mediation signals detected for TMEM258, FADS1, and FADS2. Two of the implicated genes encode enzymes involved in arachidonic synthesis (purple). Involved genes impact 17 phenotypes (pink) through alteration of the levels of three metabolites, 1-arachidonoylglycerophosphocholine (LPC(20:4)), 1-arachidonoylglycerophosphoethanolamine (LPE(20:4)), and 1-arachidonoylglycerophosphoinositol (LPI(20:4)) whose structure is depicted (orange). (C) Network of the 65 transcript-metabolite-trait causal triplets involving TMEM258, FADS1, and FADS2. Nodes represent genes (purple), metabolites (orange), or phenotypes (pink). Edges indicate the direction of the effects estimated through univariable Mendelian randomization. Width of edges is proportional to effect size and color indicates if the effect is positive (red) or negative (blue).
Figure 4 with 2 supplements
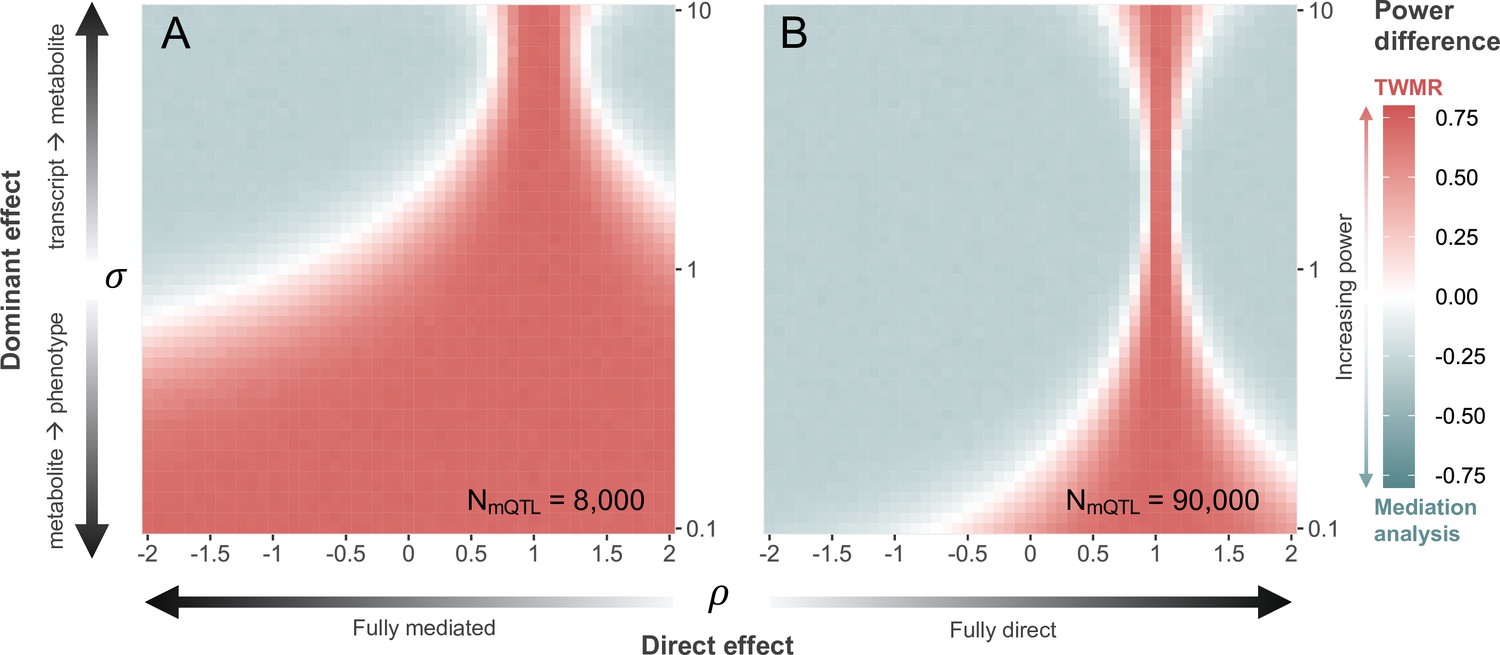
Power comparison between transcriptome-wide Mendelian randomization (TWMR) and multivariable Mendelian randomization (MVMR).
Heatmap showing the difference in statistical power between TWMR and mediation analysis through MVMR at current (A; ) and realistic future (B; ) metabolic quantitative trait loci (mQTL) dataset sample sizes. The x-axis shows the proportion () of direct () to total () effect (i.e., effect not mediated by the metabolite) ranging from –2 to 2, arrows indicating increasing proportion of direct effect. The y-axis shows the ratio () between the transcript-to-metabolite () and the metabolite-to-phenotype () effects, ranging from 0.1 to 10. Red vs. gray indicates higher power for TWMR vs. mediation analysis, respectively, while white represents equal power between the two approaches. Data related to Figure 4 panels A and B are available in Figure 4—source data 1 and Figure 4—source data 2, respectively.
-
Figure 4—source data 1
Difference in statistical power between transcriptome-wide Mendelian randomization (TWMR) and mediation analysis at N = 8000 metabolic quantitative trait locus (mQTL) dataset sample size.
Each cell represents the mean difference in power between TWMR and mediation analysis for a given scenario across 10 simulations. Rows reflect decreasing ratio between transcript-to-metabolite and metabolite-to-phenotype effects from 10 to 0.1 (sigma). Columns reflect increasing proportion of direct to total effect from –2 to 2 (rho). This file relates to Figure 4A.
- https://cdn.elifesciences.org/articles/81097/elife-81097-fig4-data1-v1.xlsx
-
Figure 4—source data 2
Difference in statistical power between transcriptome-wide Mendelian randomization (TWMR) and mediation analysis at N = 90,000 metabolic quantitative trait locus (mQTL) dataset sample size.
Each cell represents the mean difference in power between TWMR and mediation analysis for a given scenario across 10 simulations. Rows reflect decreasing ratio between transcript-to-metabolite and metabolite-to-phenotype effects from 10 to 0.1 (sigma). Columns reflect increasing proportion of direct to total effect from –2 to 2 (rho). This file relates to Figure 4A.
- https://cdn.elifesciences.org/articles/81097/elife-81097-fig4-data2-v1.xlsx
Figure 4—figure supplement 1
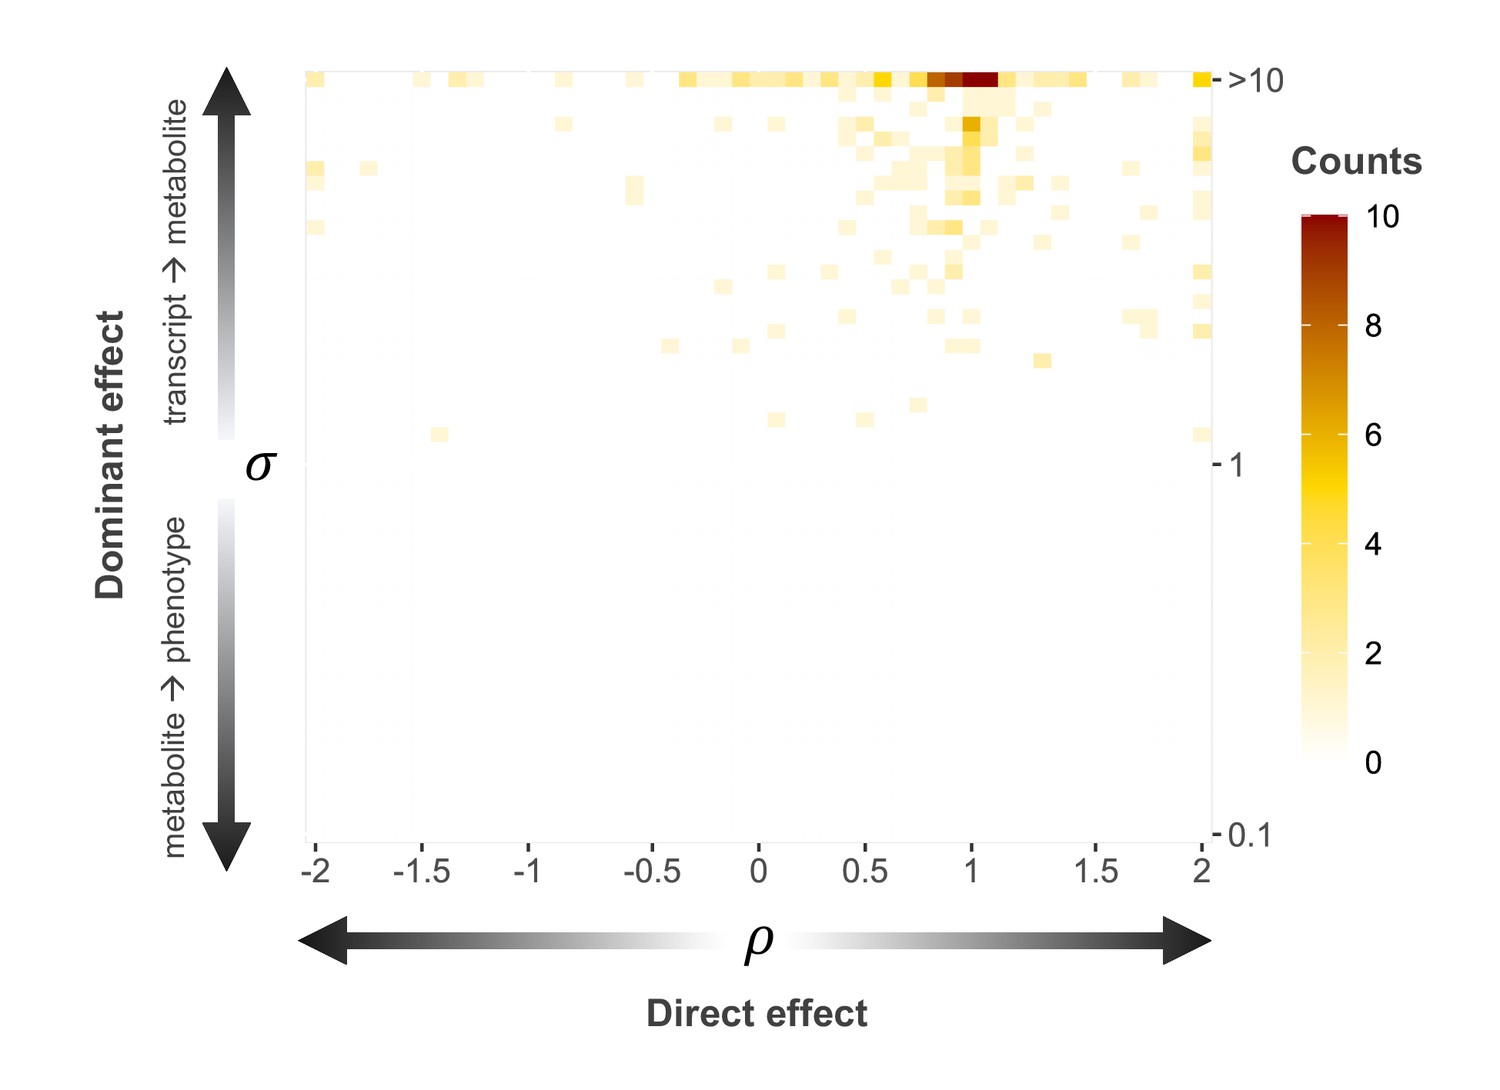
Distribution of empirical causal triplets along tested regime parameters.
Distribution of the proportion () of direct () to total () effect (i.e., effect not mediated by the metabolite with arrows indicating increasing proportion of direct effect; x-axis) and ratio () between the transcript-to-metabolite () and the metabolite-to-phenotype () effects (top row indicates larger than 10; y-axis) for the 216 identified putative causal triplets. Color indicates the number of triplets under each combination of parameters, ranging from 0 (white). Data related to Figure 4—figure supplement 1 are available in Figure 4—figure supplement 1—source data 1.
-
Figure 4—figure supplement 1—source data 1
Distribution of empirical causal triplets along tested regime parameters.
Each cell counts the number of empirical causal traits that fall within a certain parameter regime. Rows reflect decreasing ratio between transcript-to-metabolite and metabolite-to-phenotype effects () from 10 to 0.1 (top row indicating ). Columns reflect increasing proportion of direct to total effect () from –2 to 2 . This file relates to Figure 4—figure supplement 1.
- https://cdn.elifesciences.org/articles/81097/elife-81097-fig4-figsupp1-data1-v1.xlsx
Figure 4—figure supplement 2
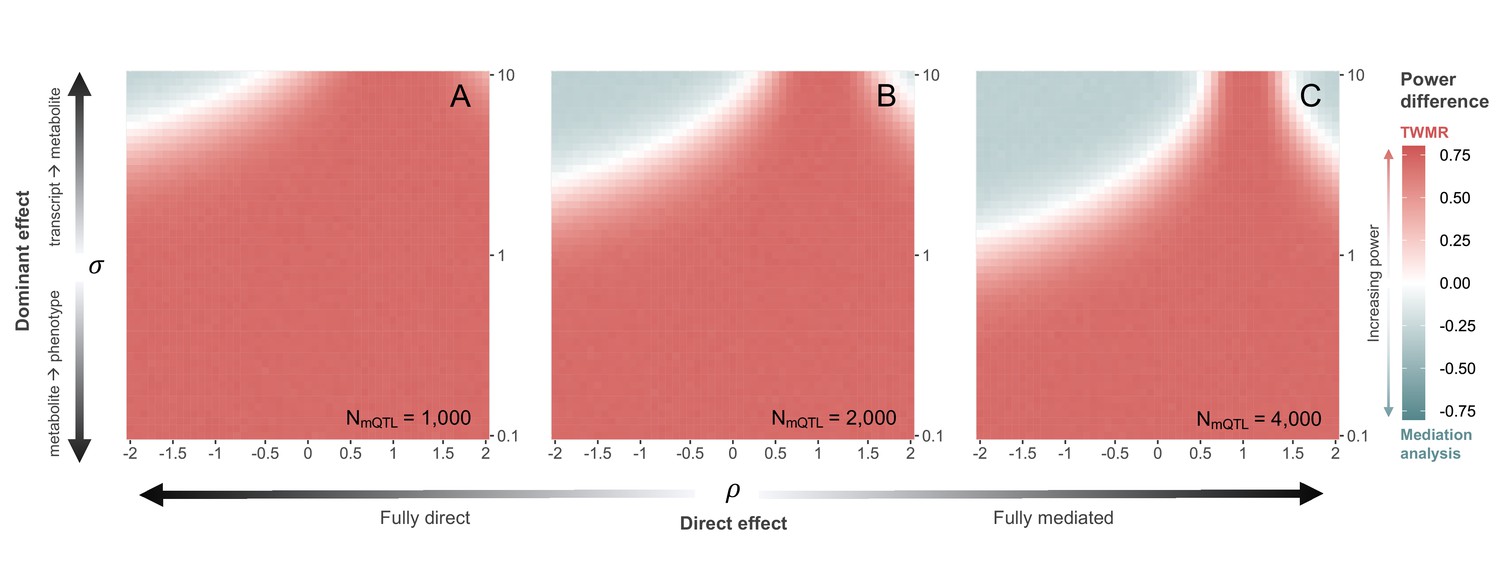
Power comparison between transcriptome-wide Mendelian randomization (TWMR) and multivariable Mendelian randomization (MVMR) at smaller sample sizes.
Heatmap showing the difference in statistical power between TWMR and mediation analysis through MVMR at metabolic quantitative trait locus (mQTL) dataset sample sizes smaller than the one in the main analysis: (A) N = 1000; (B) N = 2000; (C) N = 4000. The x-axis shows the proportion () of direct () to total () effect (i.e., effect not mediated by the metabolite) ranging from –2 to 2. The y-axis shows the ratio () between the transcript-to-metabolite () and the metabolite-to-phenotype () effects, ranging from 0.1 to 10. Red vs. gray indicates higher power for TWMR vs. mediation analysis, respectively, while white represents equal power between the two approaches. Data related to Figure 4—figure supplement 2 panels A, B, and C are available in Figure 4—figure supplement 2—source data 1–3, respectively.
-
Figure 4—figure supplement 2—source data 1
Difference in statistical power between transcriptome-wide Mendelian randomization (TWMR) and mediation analysis at N = 1000 metabolic quantitative trait locus (mQTL) dataset sample size.
Each cell represents the mean difference in power between TWMR and mediation analysis for a given scenario across 10 simulations. Rows reflect decreasing ratio between transcript-to-metabolite and metabolite-to-phenotype effects from 10 to 0.1 (sigma). Columns reflect increasing proportion of direct to total effect from –2 to 2 (rho). This file relates to Figure 4—figure supplement 2A.
- https://cdn.elifesciences.org/articles/81097/elife-81097-fig4-figsupp2-data1-v1.xlsx
-
Figure 4—figure supplement 2—source data 2
Difference in statistical power between transcriptome-wide Mendelian randomization (TWMR) and mediation analysis at N = 2000 metabolic quantitative trait locus (mQTL) dataset sample size.
Each cell represents the mean difference in power between TWMR and mediation analysis for a given scenario across 10 simulations. Rows reflect decreasing ratio between transcript-to-metabolite and metabolite-to-phenotype effects from 10 to 0.1 (sigma). Columns reflect increasing proportion of direct to total effect from –2 to 2 (rho). This file relates to Figure 4—figure supplement 2B.
- https://cdn.elifesciences.org/articles/81097/elife-81097-fig4-figsupp2-data2-v1.xlsx
-
Figure 4—figure supplement 2—source data 3
Difference in statistical power between transcriptome-wide Mendelian randomization (TWMR) and mediation analysis at N = 4000 metabolic quantitative trait locus (mQTL) dataset sample size.
Each cell represents the mean difference in power between TWMR and mediation analysis for a given scenario across 10 simulations. Rows reflect decreasing ratio between transcript-to-metabolite and metabolite-to-phenotype effects from 10 to 0.1 (sigma). Columns reflect increasing proportion of direct to total effect from –2 to 2 (rho). This file relates to Figure 4—figure supplement 2C.
- https://cdn.elifesciences.org/articles/81097/elife-81097-fig4-figsupp2-data3-v1.xlsx
Additional files
-
MDAR checklist
- https://cdn.elifesciences.org/articles/81097/elife-81097-mdarchecklist1-v1.docx
-
Supplementary file 1
Supplementary tables.
a. Annotation of metabolites measured in Shin et al., 2014 with Human Metabolome Database (HMDB) identifiers. b. Significant transcript-to-metabolite causal effects (FDR 5%) identified through univariable Mendelian randomization. Both original effects (ORIGINAL) and those after excluding outliers (N_outlier) are reported. The FDR column reports the adjusted p-value used to select significant associations (FDR ≤0.05). The HMDB and PubMed columns indicate the PMID of publications reporting a link between the tested transcript and metabolite, as identified per automated literature review, with ‘1*’ indicating associations reported without referencing a specific publication. c. List of the 28 medically relevant phenotypes assessed in this study. d. Significant metabolite-to-phenotype causal effects (FDR 5%) identified through univariable metabolome-wide Mendelian randomization (MWMR). Both original effects (ORIGINAL) and those after excluding outliers (N_outlier) are reported. The FDR column reports the adjusted p-value used to select significant associations (FDR ≤0.05). e. Significant transcript-to-phenotype causal effects (FDR 5%) identified through univariable transcriptome-wide Mendelian randomization (TWMR). Both original effects (ORIGINAL) and those after excluding outliers (N_outlier) are reported. The FDR column reports the adjusted p-value used to select significant associations (FDR ≤0.05). f. Identified causal transcript-metabolite-phenotype triplets. Effect size and p-value for the transcript-to-metabolite, metabolite-to-phenotype, and transcript-to-phenotype relations among the 216 identified causal triplets, along with estimated direct and indirect effects. Rows colored in beige were identified by our automated literature review of transcript-to-metabolite pairs and were subjected to an automated literature review of the transcript-phenotype relation. The PubMed column reports the PMID of publications identified per automated literature review for the involved gene and phenotype (using the synonyms in PubMed_PHENO) after manual curation of abstracts to exclude findings in which search terms were used in an erroneous context. g. Metabolites integrating the effect of multiple transcripts. Twelve metabolites integrate the effect of multiple transcripts to in turn influence one or several phenotypes. Transcripts in bold in the same color are encoded by genes in close genomic proximity.
- https://cdn.elifesciences.org/articles/81097/elife-81097-supp1-v1.xlsx
Download links
A two-part list of links to download the article, or parts of the article, in various formats.
Downloads (link to download the article as PDF)
Open citations (links to open the citations from this article in various online reference manager services)
Cite this article (links to download the citations from this article in formats compatible with various reference manager tools)
Exploiting the mediating role of the metabolome to unravel transcript-to-phenotype associations
eLife 12:e81097.
https://doi.org/10.7554/eLife.81097


