Endocytic trafficking determines cellular tolerance of presynaptic opioid signaling
- Department of Cellular and Molecular Pharmacology, University of California, San Francisco School of Medicine, United States
- Department of Psychiatry and Behavioral Sciences, University of California, San Francisco School of Medicine, United States
- Tetrad graduate program, University of California, San Francisco, United States
- Quantitative Biology Institute, University of California, San Francisco, United States
Figures
Figure 1
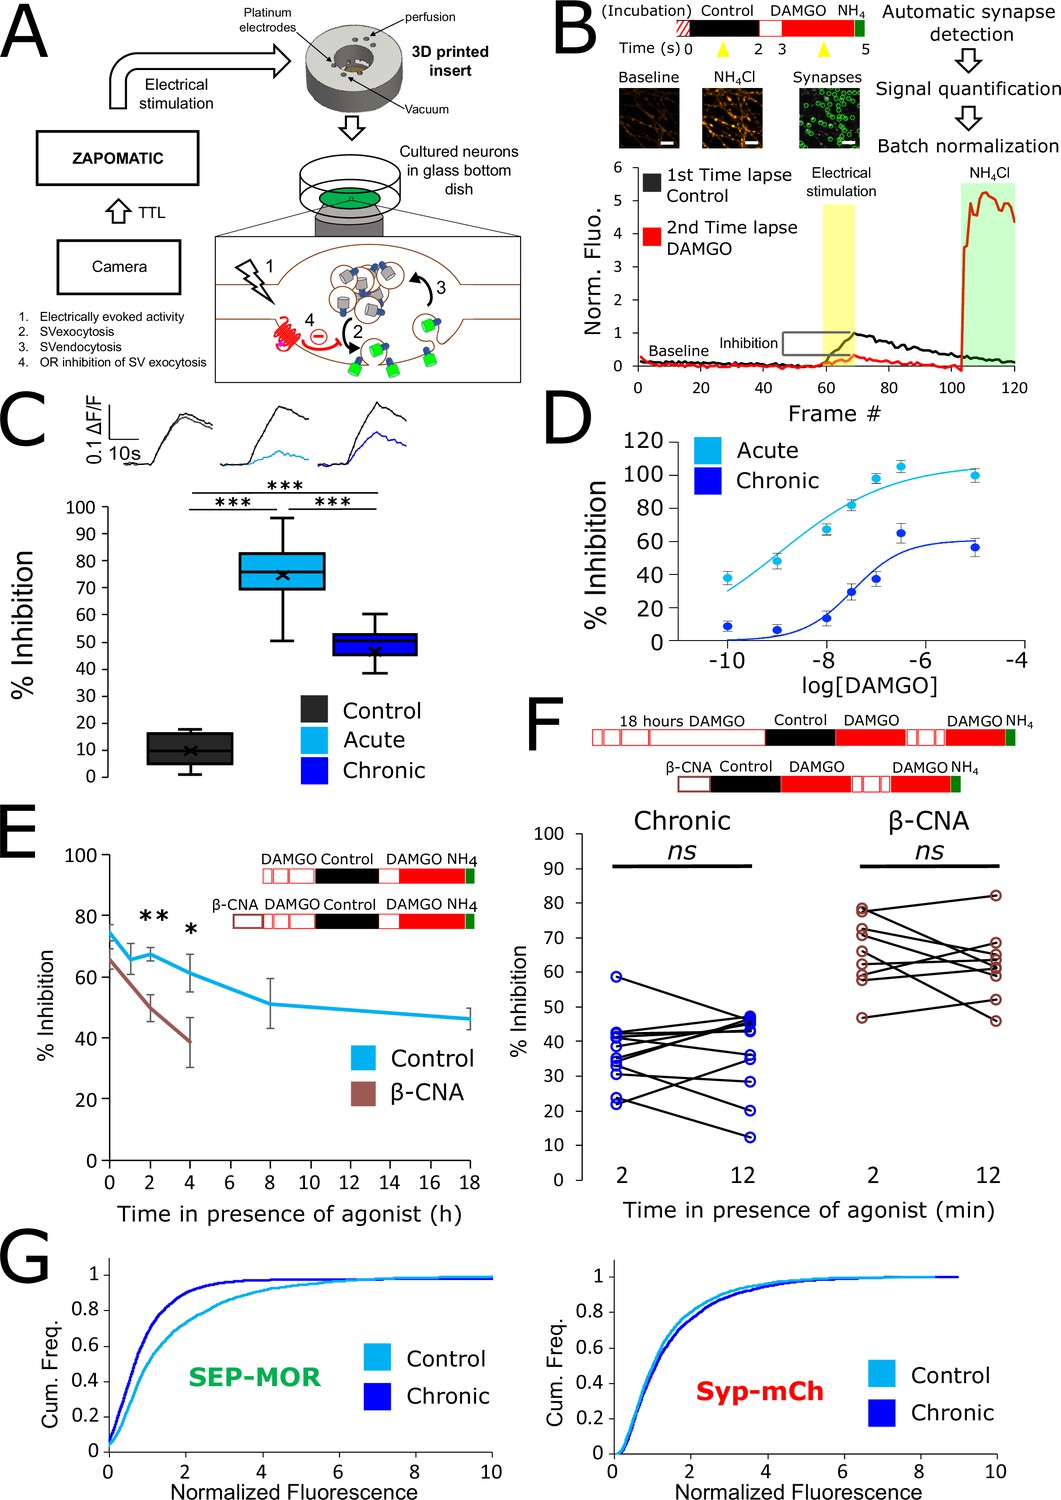
Loss of MOR mediated presynaptic inhibition under chronic activation conditions is paralleled by a reduction in surface receptor number in axons.
(A) Schematic of the experimental setup, with highlighted open-source hardware used for electrical stimulation in synchronicity with image acquisition (zapomatic) and perfusion of solution onto cultured primary cultured neurons (3D printed insert) transfected with opioid receptors and VAMP2-SEP. The enlarged diagram depicts the biological process of electrically stimulated synaptic vesicle recycling (1) monitored with widefield fluorescence microscopy. Exocytosis of VAMP2-SEP containing synaptic vesicles causes (2) an increase in fluorescence intensity (green), which returns to baseline after recapture of VAMP2-SEP by endocytosis (3) and quenching of the fluorescence (gray). Active opioid receptors (red) inhibit exocytosis of synaptic vesicles (4). (B) Description of the experiment design and automated analysis pipeline. For measurement of acute inhibition, neurons are directly placed in imaging solution on the imaging system. For measurement of inhibition after chronic treatment, neurons are pre-treated with agonist for 18 hr (unless specified otherwise). A first time lapse (120 frames, 1 Hz) is acquired in control imaging solution (black box, black curve) and neurons are electrically stimulated at 10 Hz for 10 s 1 min into the time lapse. One minute after perfusion of a solution containing DAMGO 10 μM (open red box), a second time lapse is acquired (red box, red curve) with the same electrical stimulation and imaging paradigm, and for the last 20 frames the solution is exchanged for ammonium chloride (NH4Cl). A differential image NH4Cl – baseline is used to automatically detect putative synapses, representative images are shown. Signal is quantified over multiple tens of putative synapses and used to validate real synapses. Normalized data are pooled for the same condition. For each acquisition, we obtain curves as depicted after normalization by the maximum amplitude of the control condition (n=508 synapses for this acquisition). Note the difference in maximal amplitude in the presence of DAMGO compared to control, which reflects inhibition of synaptic vesicle exocytosis by opioid receptors. Scale bar is 10 μm. (C) Upper panel shows average fluorescence curves normalized over NH4Cl (ΔF/F) for all synapses, lower panel displays percentage whisker plots of inhibition of SV exocytosis for each acquisition (4 quartiles +mean marker “X”). Inhibition of SV exocytosis, compared to control baseline as explained in B, for cells perfused with control solution (Control, inset n=1,603 synapses, n=6 acquisitions), cells perfused with DAMGO 10 μM (Acute, inset n=3,236 synapses, n=20 acquisitions), and cells pretreated with DAMGO 10 μM for 18 hr and perfused with DAMGO (Chronic, inset n=2025 synapses, n=13 acquisitions). (D) Normalized concentration-response curves of MOR mediated presynaptic inhibition acutely or after the induction of tolerance (Acute n=6/6/10/9/10/9, Chronic n=19/19/9/9/9/9 for 0.1,1,10,30,100,300 nM, respectively. 10 μM replotted from C). (E) To assess rapid desensitization, 3 acquisitions were performed as depicted in the inset. Cells were perfused for 10 min in the continuous presence of DAMGO 10 μM between stimulations. Paired measurements are shown for cells pretreated with DAMGO 10 μM for 18 hr before acquisition (chronic, n=12 acquisitions), and cells pretreated with β-CNA (50 nM for 5 min) before acquisition (β-CNA, n=9 acquisitions). (F) Time course of MOR mediated presynaptic inhibition for cells incubated with DAMGO 10 μM (n=20/11/10/11/9/13 acquisitions for 0/1/2/4/8/18 hr, respectively. Time zero and 18 hr replotted from C) or cells pretreated with β-CNA (50 nM for 5 min) before incubation with DAMGO (n=9/7/6 acquisitions for 0/2/4 hr, respectively. Time zero replotted from t=2 min in F). (G) Cumulative frequency curves of the normalized fluorescence at individual synapses for SEP-MOR signal (left panel) and synaptophysin-mCherry (syp-mCh, right panel) for naïve cells (n=3520 synapses) or cells pretreated with DAMGO 10 μM for 18 hr (n=3053 synapses). Note the left shift for SEP-MOR fluorescence after pretreatment indicating a loss of surface receptors. Syp-mCh fluorescence remains similar between conditions, reflecting appropriate sampling of the expression levels of recombinant fluorescent protein among synapses. *, **, *** represent p<0.05, 0.01, 0.001, respectively. See also Figure 1—source data 1.
-
Figure 1—source data 1
Source data for results graphed in Figure 1.
- https://cdn.elifesciences.org/articles/81298/elife-81298-fig1-data1-v2.xlsx
Figure 2 with 1 supplement
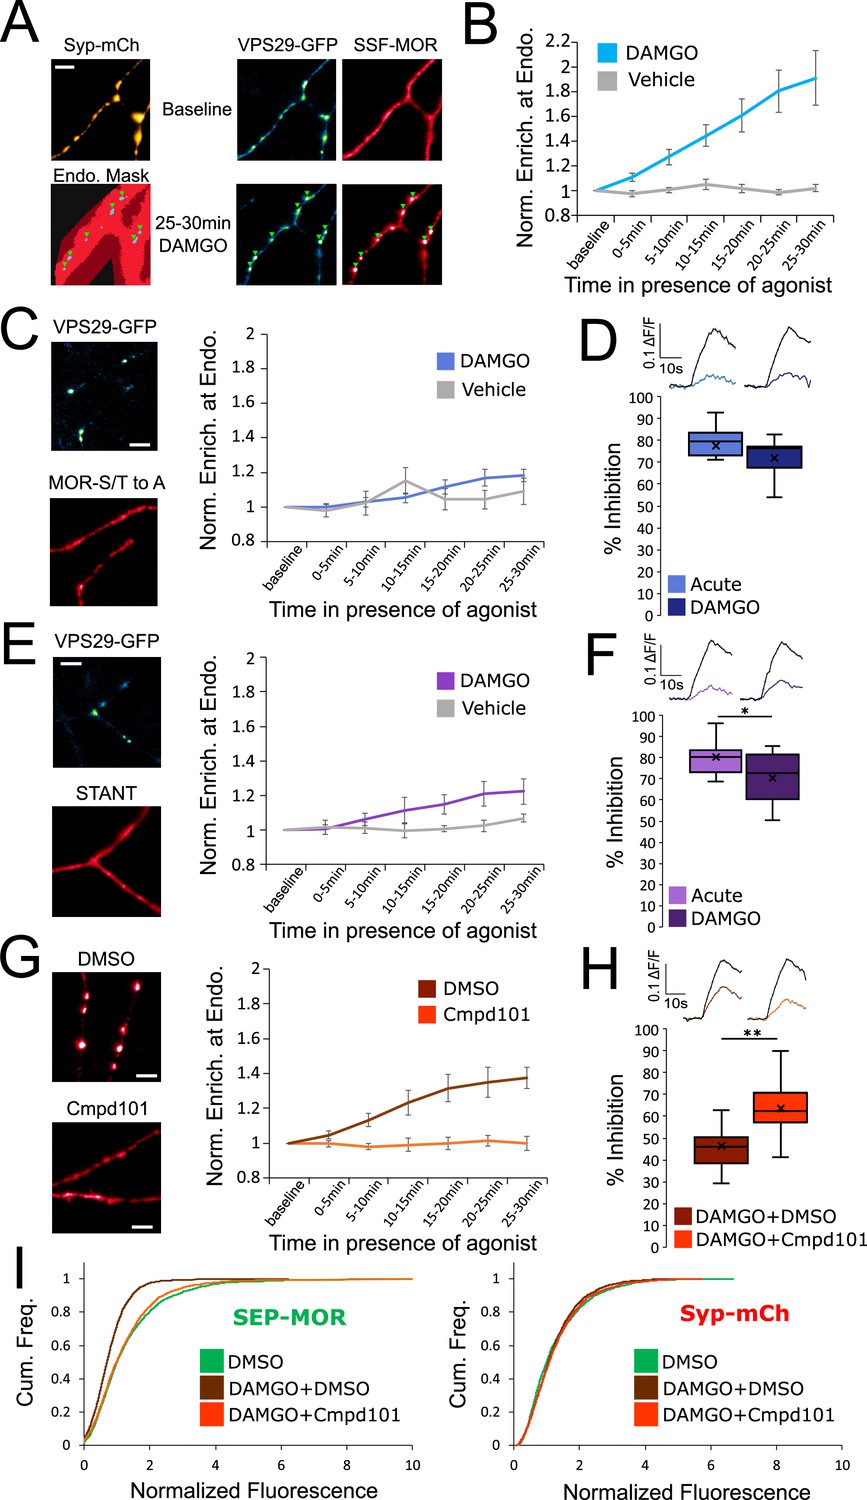
Phosphorylation of MOR is required for endocytosis of receptors, loss of surface receptors upon chronic activation, and the development of presynaptic tolerance.
(A) Representative images of axons of neurons marked with syp-mCh, expressing the endosomal marker VPS29-GFP andFLAG-tagged opioid receptors (SSF-MOR), surface labeled with a primary anti-FLAG antibody conjugated to Alexa 647. Neurons were imaged using oblique illumination at a frequency of 1 frame/min. Note the uniform distribution of the receptor before agonist addition (baseline) and the punctate distribution overlapping with a segmented mask of the endosomal marker after 25–30 min of incubation with DAMGO 10 μM. Scale bar is 5 μm. See also Figure 2—video 1. (B) Quantification of the enrichment of surface labeled SSF-MOR at VPS29-GFP marked structures along axons for cells treated with vehicle (n=5 acquisitions) or cells treated with DAMGO 10 μM (n=8 acquisitions). Right axis indicates p-values for unpaired t-test between the two conditions. (C) Same as A,B, for FLAG-tagged mutant opioid receptors where all serine and threonine residues of the C-terminal tail have been mutated to alanine (MOR S/T to A), for vehicle (n=5 acquisitions) or DAMGO 10 μM (n=7 acquisitions) treated cells. Note the diffused distribution of surface labeled MOR-S/T to A after 25–30 min of incubation with DAMGO 10 μM. (D) Quantification of presynaptic inhibition mediated by the MOR S/T to A mutant acutely (inset n=717 synapses, n=7 acquisitions) or after 18 hr of incubation with DAMGO 10 μM (inset n=2360 synapses, n=11 acquisitions). (E) Same as A,B, for FLAG-tagged mutant opioid receptors where serine and threonine residues of STANT motif on the C-terminal tail have been mutated to alanine (STANT), for vehicle (n=5 acquisitions) or DAMGO 10 μM treated cells (n=6 acquisitions). Note the diffused distribution of surface labeled STANT after 25–30 min of incubation with DAMGO 10 μM. (F) Quantification of presynaptic inhibition mediated by the STANT MOR mutant acutely (inset n=1,882 synapses, n=11 acquisitions) or after 18 hr of incubation with DAMGO 10 μM (inset n=2605 synapses, n=14 acquisitions). (G) Same as A,B, for SSF-MOR in neurons treated with Cmpd101 30 μM (n=8 acquisitions) or DMSO control (n=6 acquisitions) and incubated with DAMGO 10 μM. Note the difference in distribution between the two conditions after 25–30 min of incubation with DAMGO. (H) Quantification of presynaptic inhibition mediated by wild type MOR in cells incubated with Cmpd101 30 μM (inset n=2157 synapses, n=15 acquisitions) or DMSO control (inset n=2346 synapses, n=17 acquisitions) together with DAMGO 10 μM for 18 hr. (I) Cumulative frequency curves of the normalized fluorescence at individual synapses for SEP-MOR signal (left panel) and syp-mCh for cells incubated with DMSO only (n=2273 synapses), cells pretreated with DMSO +DAMGO 10 μM for 18 hr (n=2209 synapses) and cells treated with Cmpd101 30 μM+DAMGO 10 μM for 18 hr (n=2456 synapses). Note that the left shift for SEP-MOR fluorescence after pretreatment with DMSO control +DAMGO is blocked by Cmpd101 while syp-mCh control signal is stable across conditions. *, ** represent p<0.05, 0.01, respectively. See also Figure 2—source data 1.
-
Figure 2—source data 1
Source data for results graphed in Figure 2.
- https://cdn.elifesciences.org/articles/81298/elife-81298-fig2-data1-v2.xlsx
Figure 2—video 1
SSF-MOR internalization in axons.
Same as for Figure 2A, DAMGO 10 μM is added after frame 6.Upper left panel is the syp-mCh image taken before the time lapse. Upper right panel is the anti-FLAG M1-Alexa 647 image series (receptor). Bottom right panel is VPS29-GFP image series (endosome). Bottom left panel is the segmentation of endosome signal on which the quantification is performed. Dark red is manually selected polygon, light red is the refined region of interest (thresholding of the maximal projection of the receptor channel), white is segmented endosomes (thresholding of VPS29-GFP signal within the refined mask). Full frames are shown for each panel (~80 μm*80 μm), total length of the time lapse is 35 min imaged at 1 frame per minute, movie is 10 frames per second.
Figure 3

Partial and biased MOR agonists fail to elicit tolerance to the same degree as full agonists peptides.
(A) Same experimental setup as in Figure 2, except the agonist used was morphine 10 μM (n=8 acquisitions), control replotted from Figure 2B. Inset show images of VPS29-GFP and surface labeled SSF-MOR after 25–30 min of incubation with morphine 10 μM. (B) DAMGO induced MOR inhibition exhibits tolerance after incubation with morphine 10 μM+DMSO vehicle (inset n=3,400 synapses, n=21 acquisitions) and tolerance is blocked by incubation of morphine 10 μM together with Cmpd101 30 μM (inset n=2441 synapses, n=19 acquisitions). Acute condition replotted from Figure 1C, DMSO +DAMGO condition replotted from Figure 2H. (C) Morphine 10 μM+DMSO (n=2076 synapses) induces a loss of surface SEP-MOR in axons after 18 hr of incubation compared to DMSO only control (replotted from Figure 2I). The loss is less pronounced than when induced by incubation by DAMGO 10 μM+DMSO (replotted from Figure 2I) for 18 hr, and is blocked by incubation of DAMGO 10 μM together with Cmpd101 30 μM (n=2872 synapses). Syp-mCh signal is similar across conditions. (D) Same as A except cells were stimulated with PZM21 10 μM (n=5 acquisitions). Note the diffuse distribution of surface labeled SSF-MOR after 25–30 min of incubation with PZM21 10 μM. (E) Same as for B for cells incubated for 18 hours with PZM21 10 μM together with Cmpd101 30 μM for 18 hr (inset n=883 synapses, n=8 acquisitions) or DMSO vehicle (inset n=1089 synapses, n=8 acquisitions). Acute condition replotted from Figure 1C. (F) Same as A except cells were stimulated with TRV130 10 μM (n=5 acquisitions). Note the diffuse distribution of surface labeled SSF-MOR after 25–30 min of incubation with TRV130 10 μM. (G) Same as for B for cells incubated for 18 hr with TRV130 10 μM together with Cmpd101 30 μM for 18 hr (inset n=1,076 synapses, n=7 acquisitions) or DMSO vehicle (inset n=1280 synapses, n=8 acquisitions). Acute condition replotted from Figure 1C. Scale bars are 5 μm. **, *** represent p<0.01, 0.001, respectively. See also Figure 3—source data 1.
-
Figure 3—source data 1
Source data for results graphed in Figure 3.
- https://cdn.elifesciences.org/articles/81298/elife-81298-fig3-data1-v2.xlsx
Figure 4 with 1 supplement
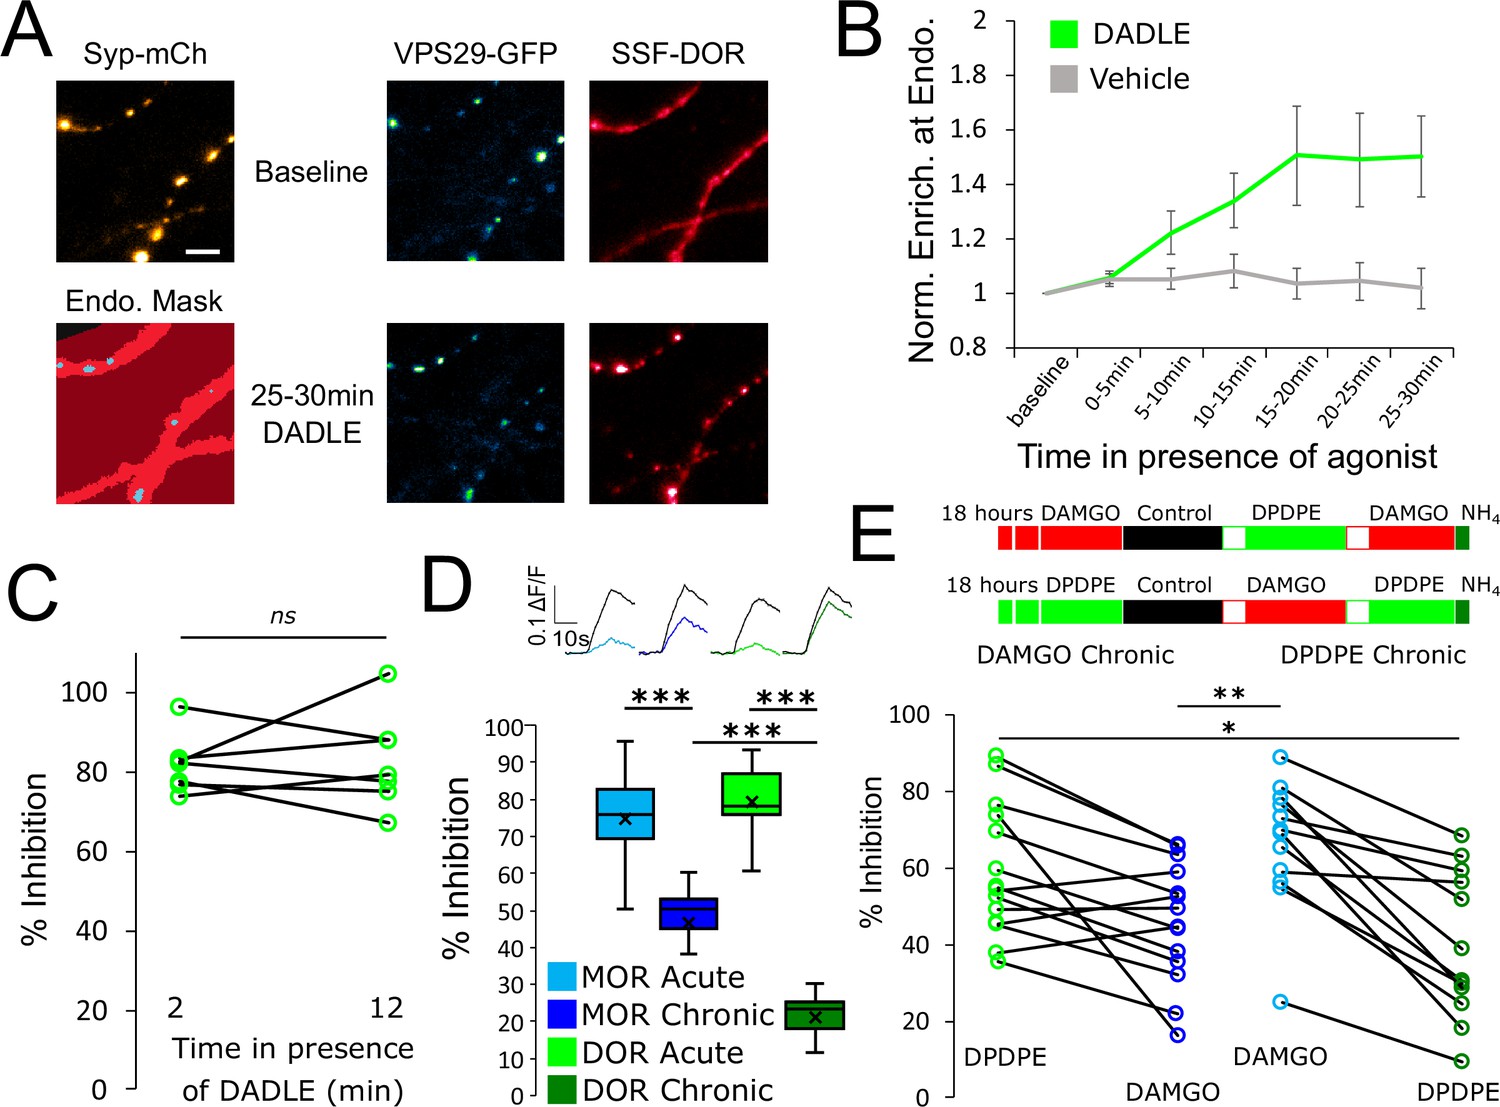
Tolerance is an homologous process conserved between opioid receptors.
(A) Representative images of axons of neurons marked with syp-mCh, expressing the endosomal marker VPS29-GFP and FLAG-tagged DOR (SSF-DOR) surface labeled with a primary anti-FLAG antibody conjugated to alexa647. Imaging was performed as described before. Note the uniform distribution of surface SSF-DOR before agonist addition (baseline) and the punctate distribution overlapping with a segmented mask of the endosomal marker after 25–30 min of incubation with DADLE 10 μM. Scale bar is 5 μm. See also Figure 4—video 1. (B) Time course of surface labeled SSF-DOR recruitment at VPS29-GFP marked presynaptic endosomes, as in A. There is a significant increase in colocalization of SSF-DOR with the retromer marker after addition of DADLE 10 μM (n=11 acquisitions) compared to the vehicle control (n=7 acquisitions). (C) Inhibition of electrically evoked exocytosis of synaptic vesicles by DOR is sustained over 10 min in presence of agonist. Desensitization of presynaptic DOR was assessed using a similar protocol as in Figure 1E. Neurons expressing SSF-DOR and VAMP2-SEP were electrically stimulated to induce SV exocytosis in control solution. Cells were then perfused with a solution containing DADLE 10 μM and inhibition of the fluorescence increase was quantified to reflect DOR mediated presynaptic inhibition. After 10 more minutes of perfusion with DADLE, cells were stimulated again to estimate the degree of acute desensitization (n=7 acquisitions). (D) Quantification of the presynaptic inhibition mediated by MOR in acute and chronic conditions (replotted from Figure 1C) compared to DOR, acutely (inset n=1,482 synapses, n=10 acquisitions) or after 18 hr of treatment with DADLE 10 μM (inset n=2,529 synapses, n=11 acquisitions). (E) Assessment of cross-tolerance using optical measurement of presynaptic inhibition. Inset describes experimental setup. Neurons expressing VAMP2-SEP together with SSF-DOR and SSF-MOR were incubated for 18 hr with either DAMGO 10 μM (n=14 acquisitions) or DPDPE 10 μM (n=12 acquisitions). Cells treated chronically with DAMGO were electrically stimulated while imaged in control solution, then 2 min after perfusion with 10 μM DPDPE, then 2 min after exchange for a solution containing 10 μM DAMGO. Cells treated chronically with DPDPE were submitted to the same protocol, except that the order of solution perfusion was reversed (DAMGO first, DPDPE second). *, **, *** represent p<0.05, 0.01, 0.001, respectively. See also Figure 4—source data 1.
-
Figure 4—source data 1
Source data for results graphed in Figure 4.
- https://cdn.elifesciences.org/articles/81298/elife-81298-fig4-data1-v2.xlsx
Figure 4—video 1
SSF-DOR internalization in axons.
Same as for Figure 4A, DADLE 10 μM is added after frame 6. Upper right panel is the anti-FLAG M1-Alexa 647 image series (receptor). Bottom right panel is VPS29-GFP image series (endosome). Bottom left panel is the segmentation of endosome signal on which the quantification is performed. Dark red is manually selected polygon, light red is the refined region of interest (thresholding of the maximal projection of the receptor channel), white is segmented endosomes (thresholding of VPS29-GFP signal within the refined mask). Full frames are shown for each panel (~80 μm*80 μm), total length of the time lapse is 35 min imaged at 1 frame per minute, movie is 10 frames per second.
Figure 5
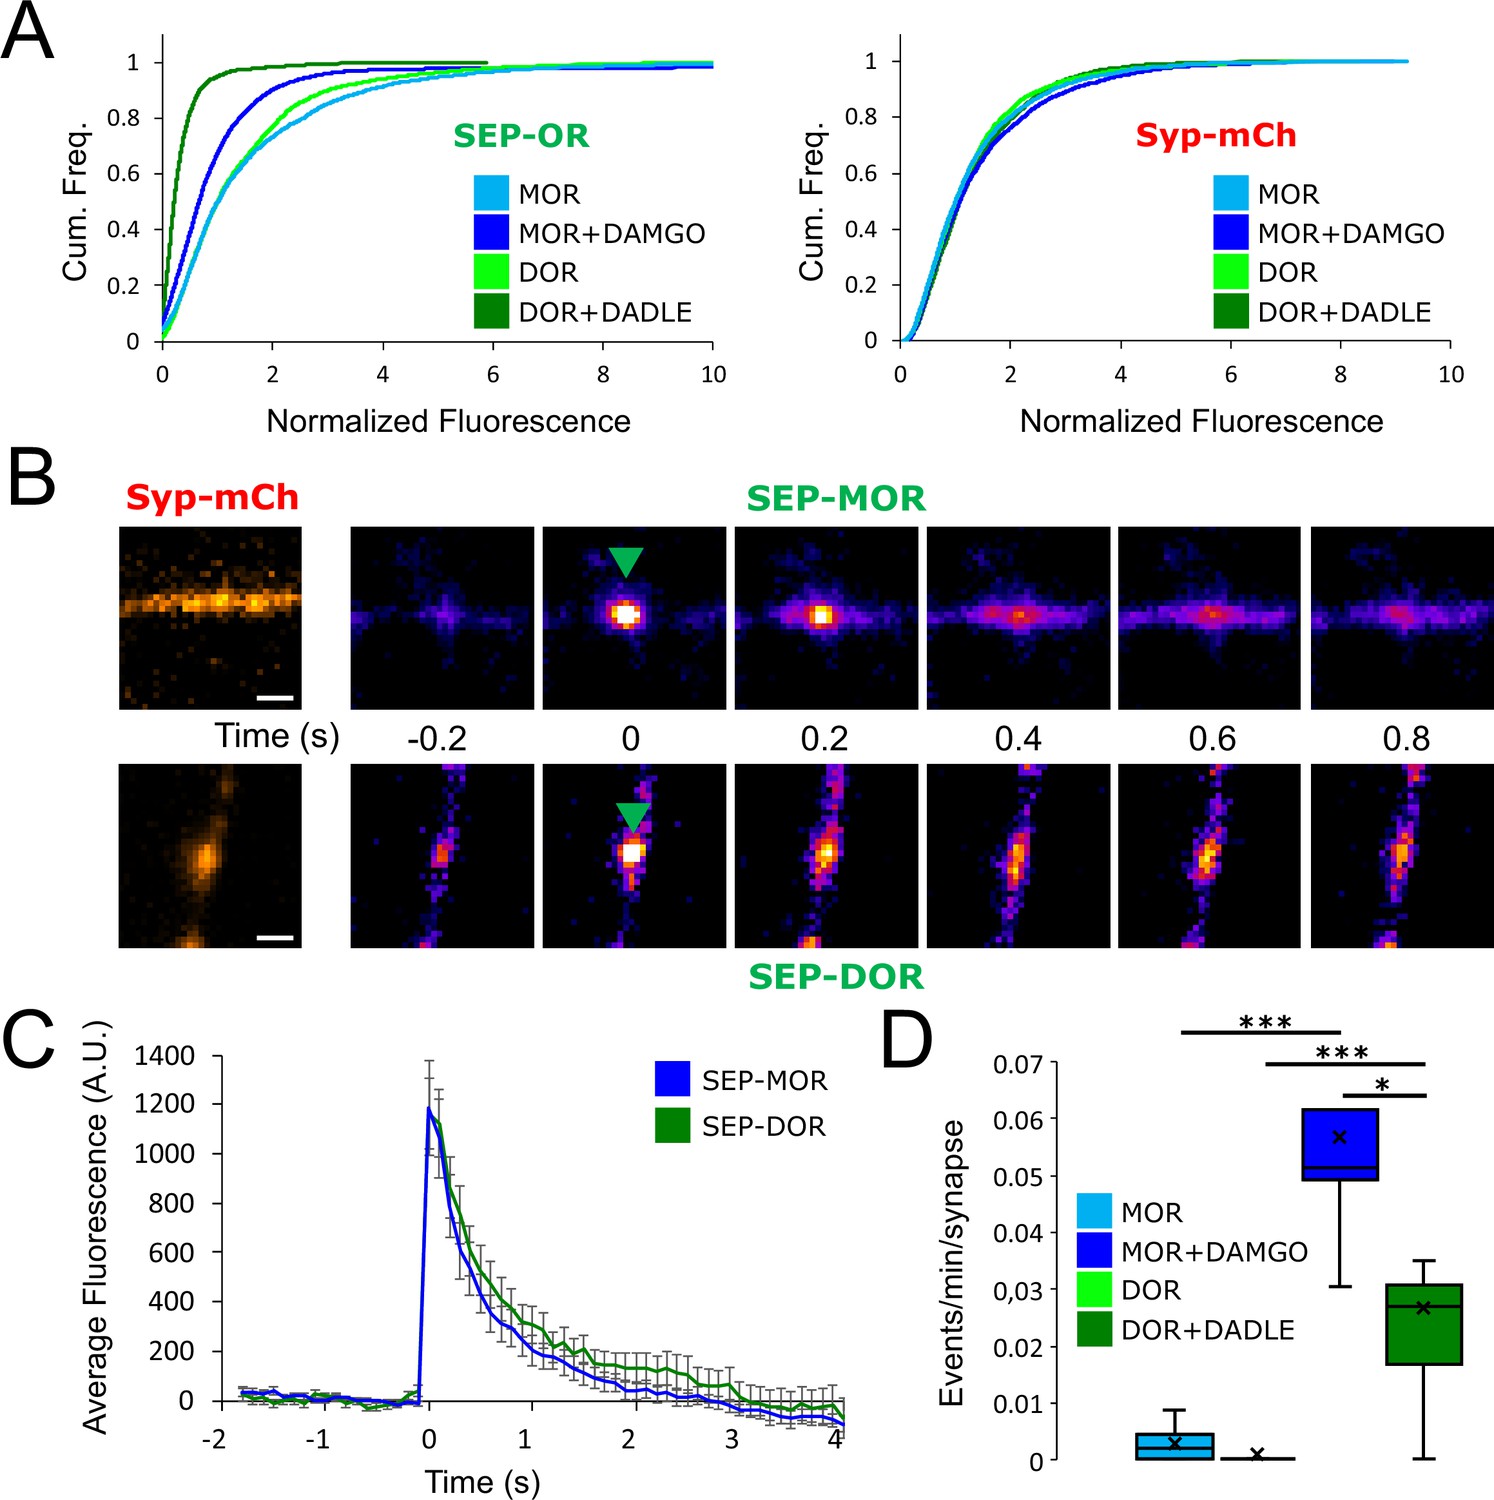
DOR is less efficiently recycled to the plasma membrane compared to MOR.
(A) Eighteen hr of incubation with DADLE 10 μm (n=2934 synapses) induces a marked loss of surface SEP-DOR in axons compared to the untreated control (n=3,376 synapses). The loss is more pronounced than what is observed after chronic treatment of SEP-MOR with DAMGO (replotted from Figure 1G). Syp-mCh fluorescence control remains similar across conditions. (B) Representative examples of surface insertion of SEP-tagged opioid receptors. Neurons were incubated for 20 min with either DAMGO 10 μM (for SEP-MOR) or DADLE 10 μM (for SEP-DOR), and imaged at 10 Hz using oblique illumination. Insertion events appear as bursts of fluorescence (green arrow). Scale bar is 1 μm. (C) Average fluorescence intensity profile at the site of insertion for SEP-MOR (n=59 events) and SEP-DOR (n=49 events), for events imaged as described in B. Error bars represent SEM. (D) Whisker plots of the normalized frequency of surface insertion events for neurons imaged as described in B. Frequency of recycling events was increased for both MOR (n=5 acquisitions) and DOR (n=8 acquisitions) compared to the no agonist pretreatment condition (MOR n=6 acquisitions, DOR n=8 acquisitions). *, *** represent p<0.05, 0.001, respectively. See also Figure 5—source data 1.
-
Figure 5—source data 1
Source data for results graphed in Figure 5.
- https://cdn.elifesciences.org/articles/81298/elife-81298-fig5-data1-v2.xlsx
Figure 6 with 1 supplement
DOR C-terminal tail phosphorylation is not necessary for presynaptic endocytosis, surface receptor depletion or tolerance.
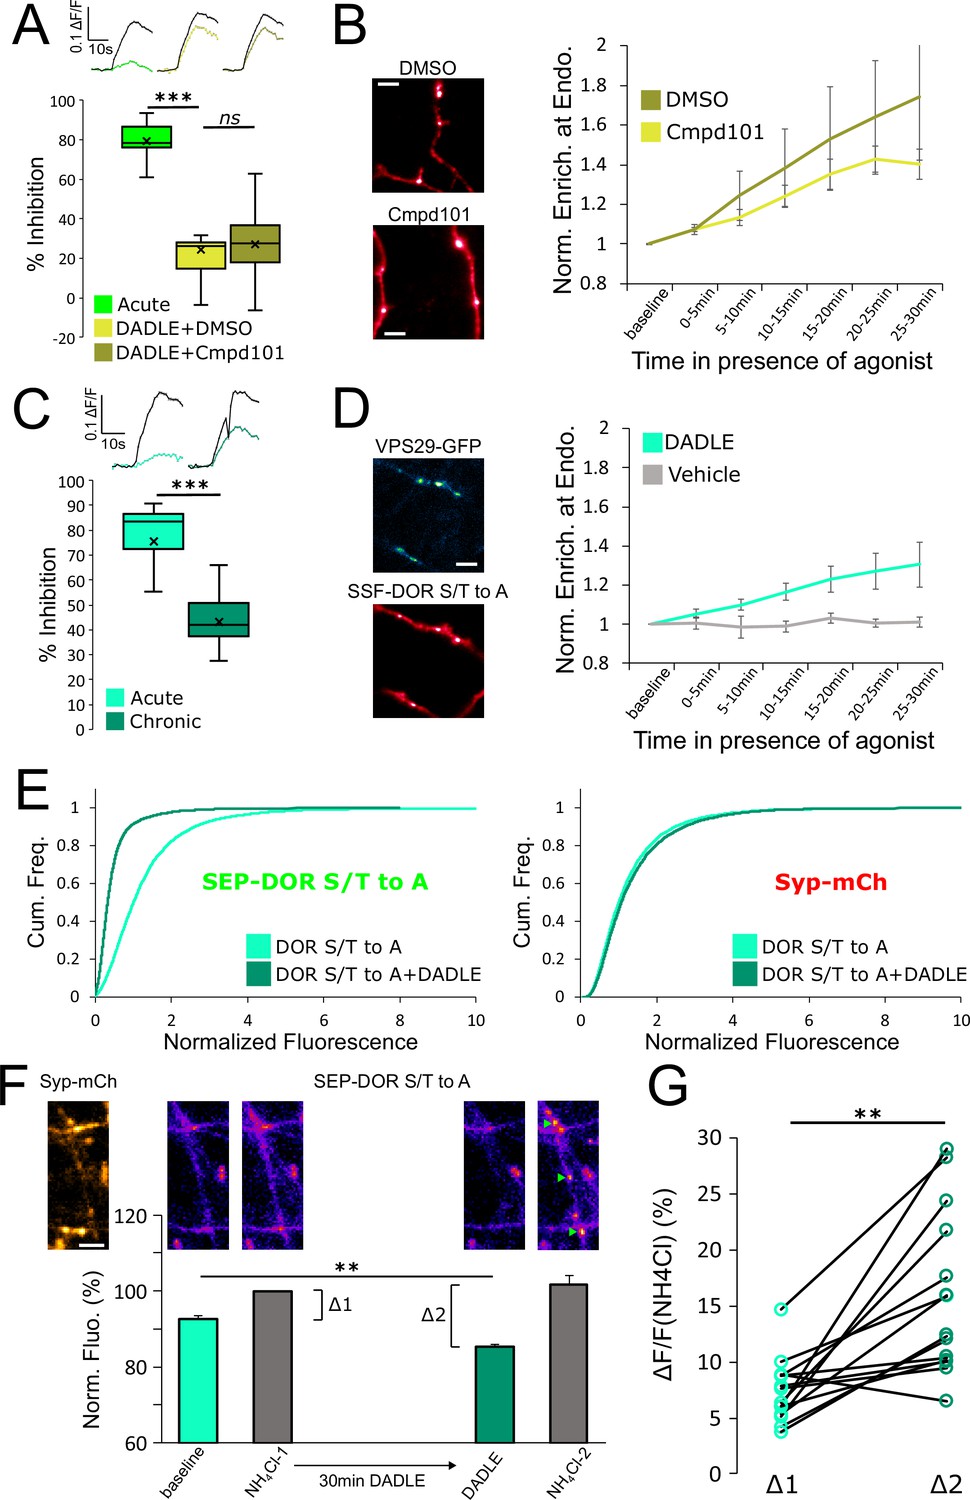
(A) Inhibition of GRK2/3 activity does not block DOR tolerance. Neurons were incubated with Cmpd101 30 μM+DADLE 10 μM (inset n=2481 synapses, n=15 acquisitions) or DMSO vehicle +DADLE 10 μM (inset n=2353 synapses, n=13 acquisitions) for 18 hr, and inhibition of presynaptic activity measured as described previously. Acute condition is replotted from Figure 4D. (B) Effect of GRK2/3 inhibition on the accumulation of surface labeled SSF-DOR at VPS29-GFP marked endosomes, as previously described. Neurons were incubated with Cmpd101 30 μM (n=7 acquisitions) or DMSO vehicle (n=7 acquisitions) and DADLE 10 μM was added after baseline. Note the punctate distribution for both conditions after 25–30 min of incubation with agonist. Scale bar is 5 μm. (C) DOR S/T to A develops tolerance after chronic activation. Presynaptic inhibition mediated by a phosphorylation-deficient mutant of DOR was assessed in neurons treated acutely (inset n=1,673 synapses, n=8 acquisitions) or in neurons pretreated for 18 hr with DADLE (inset n=3017 synapses, n=12 acquisitions). (D) Endocytosis of DOR S/T to A, as described previously. Neurons expressing the mutant were stimulated with DADLE 10 μM (n=7 acquisitions) or vehicle control (n=6 acquisitions). Note the punctate distribution overlapping the endosomal marker signal after 25–30 min of incubation with agonist.Scale bar is 5 μm. See also Figure 6—video 1. (E) Normalized fluorescence of SEP-DOR S/T to A at synapses marked by syp-mCh in naive neurons (n=7,200 synapses) or in neurons pretreated with DADLE 10 μM for 18 hr (n=8904 synapses). Note the left shift in SEP-DOR S/T to A fluorescence after chronic activation while the syp-mCh signal remains stable. (F) Endocytosis of SEP-DOR S/T to A assessed by pHluorin unquenching. Axons were identified by syp-mCh staining and perfused with imaging solution, and a baseline image acquired. One min after perfusion of NH4Cl solution, another image was taken (NH4Cl-1) showing little increase in fluorescence (Δ1). Cells were then perfused for 30 min with DADLE 10 μM in imaging solution, and another frame acquired (DADLE). One last frame was acquired after 1 min of perfusion with NH4Cl (NH4Cl-2) showing a larger increase in fluorescence (Δ2). Inset shows representative images for each step, green arrows point to fluorescent punctates that represent endosomes. Scale bar is 5 μm, n=14 acquisitions. (G) Paired measurement of the fluorescence increase induced by NH4Cl at baseline (Δ1) or after 30 min of incubation with DADLE 10 μM (Δ2), as described in E, same dataset. **, *** represent p<0.01, 0.001, respectively. See also Figure 6—source data 1.
-
Figure 6—source data 1
Source data for results graphed in Figure 6.
- https://cdn.elifesciences.org/articles/81298/elife-81298-fig6-data1-v2.xlsx
Figure 6—video 1
SSF-DOR S/T to A internalization in axons.
Same as for Figure 6D, DADLE 10 μM is added after frame 6. Upper right panel is the anti-FLAG M1-Alexa 647 image series (receptor). Bottom right panel is VPS29-GFP image series (endosome). Bottom left panel is the segmentation of endosome signal on which the quantification is performed. Dark red is manually selected polygon, light red is the refined region of interest (thresholding of the maximal projection of the receptor channel), white is segmented endosomes (thresholding of VPS29-GFP signal within the refined mask). Full frames are shown for each panel (~80 μm*80 μm), total length of the time lapse is 35 min imaged at 1 frame per minute, movie is 10 frames per second.
Figure 7
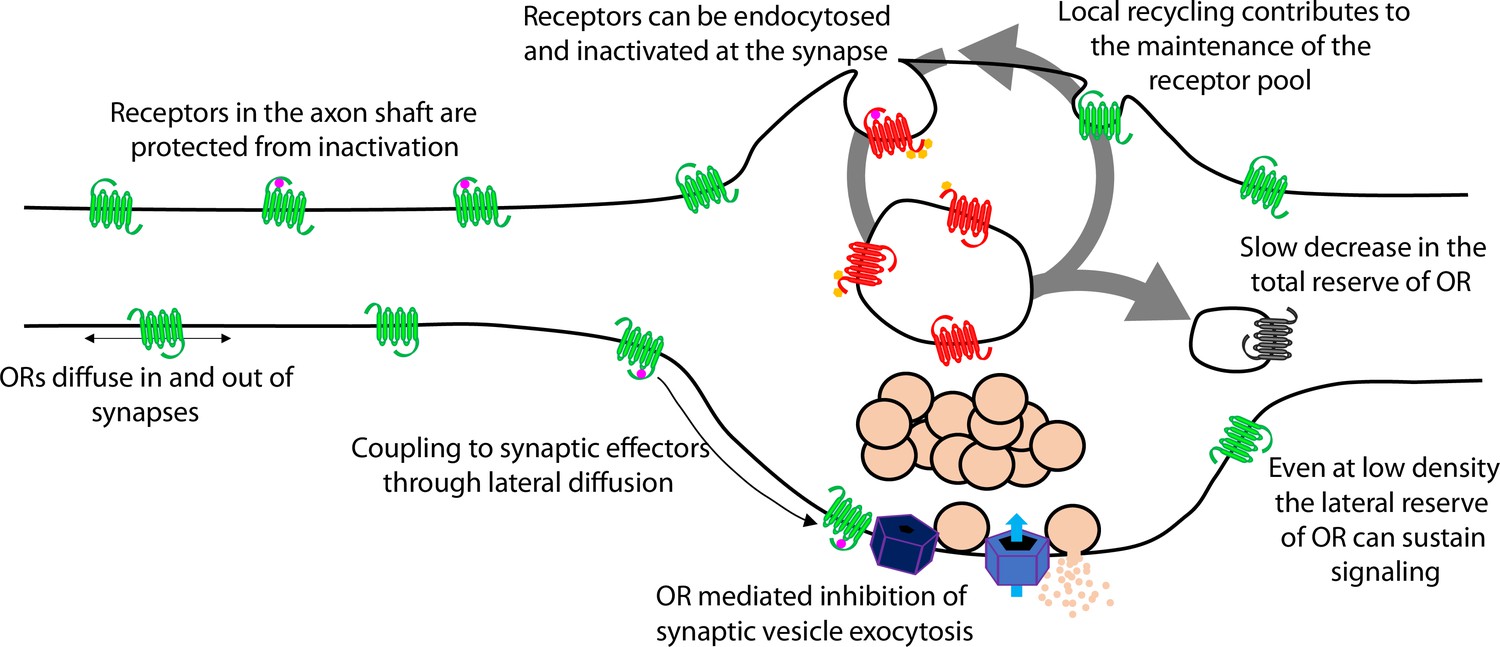
Proposed model of opioid receptor signaling and trafficking in axons.
Appendix 1—figure 1
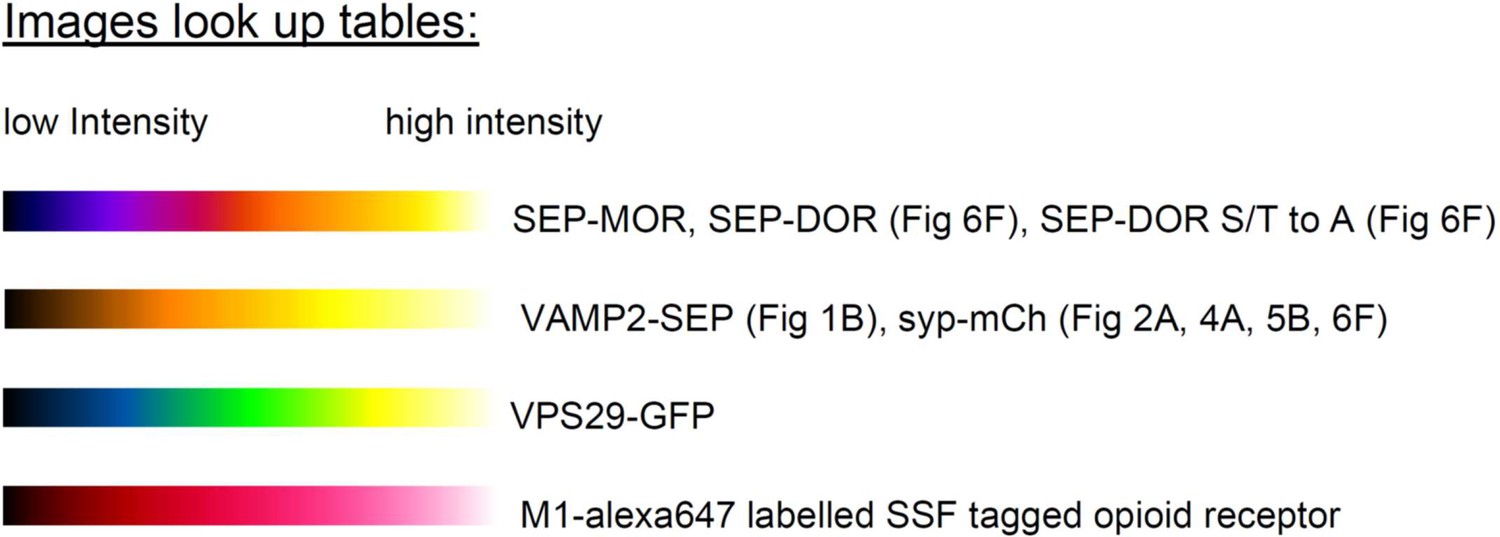
Images look up tables.
Appendix 1—figure 2
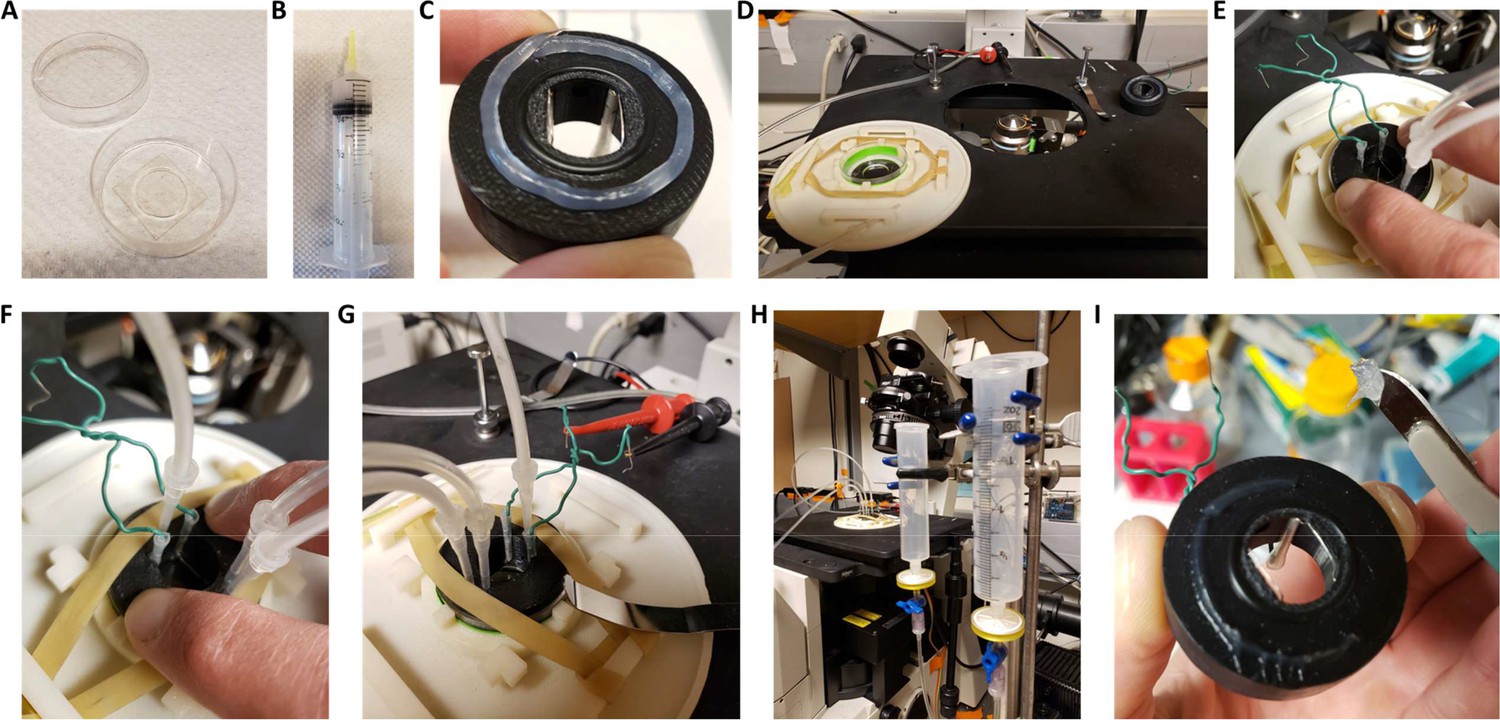
Insert for perfusion coupled to electrical stimulation.
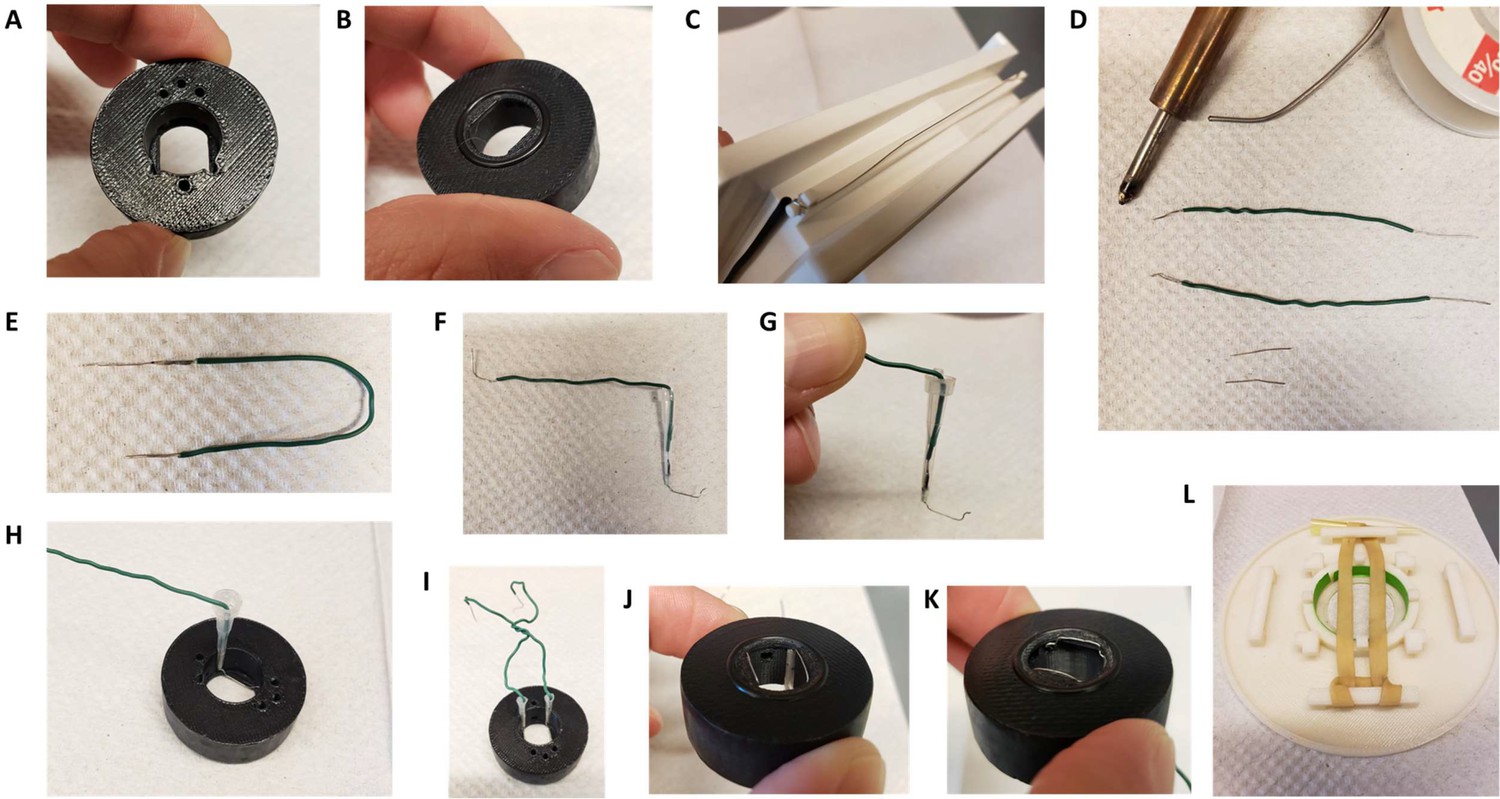
(A) Top view of the insert, with 3 holes for perfusion entry in the insert (top), one hole for vacuum suction (bottom), and 2 semi-open holes for electrodes (bottom). (B) Bottom view of the insert with O-ring in place. (C) Broken gel electrophoresis with platinum wire. (D) Electrodes are made by soldering 2 platinum wires (bottom) to regular electric wire. (E) Platinum wire soldered to the electric wire. (F) Electrode secured and ready to be installed. (G) Close up view of the electrode, note the angle. (H) Insert with one electrode installed. (I) Insert with both electrodes installed, we recommend you twist the electrical wires together to solidify the installation and make sure the hole for vacuum stays easily accessible. (J,K) Bottom view of the insert with the two electrodes installed. (L) Dish holder for 35 mm dishes with rubber band installed.
Appendix 1—figure 3
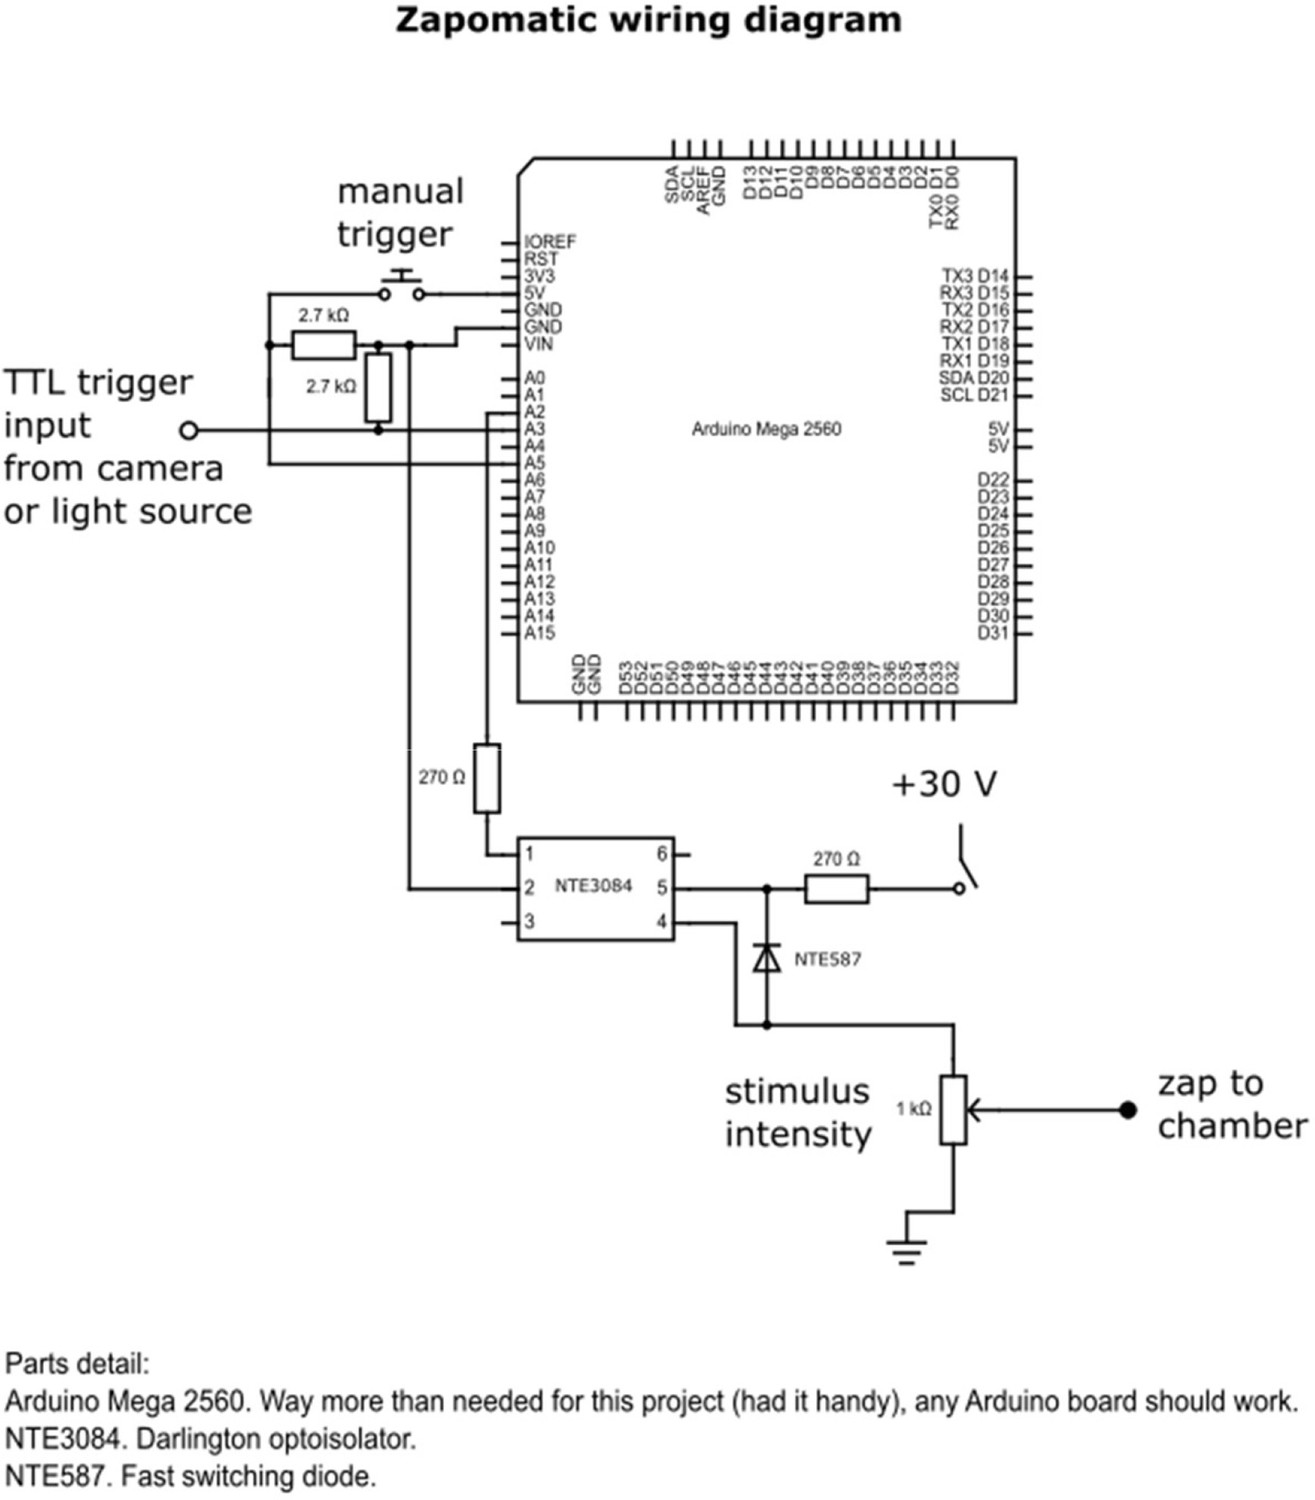
circuit diagram of the zapomatic.
Appendix 1—figure 4
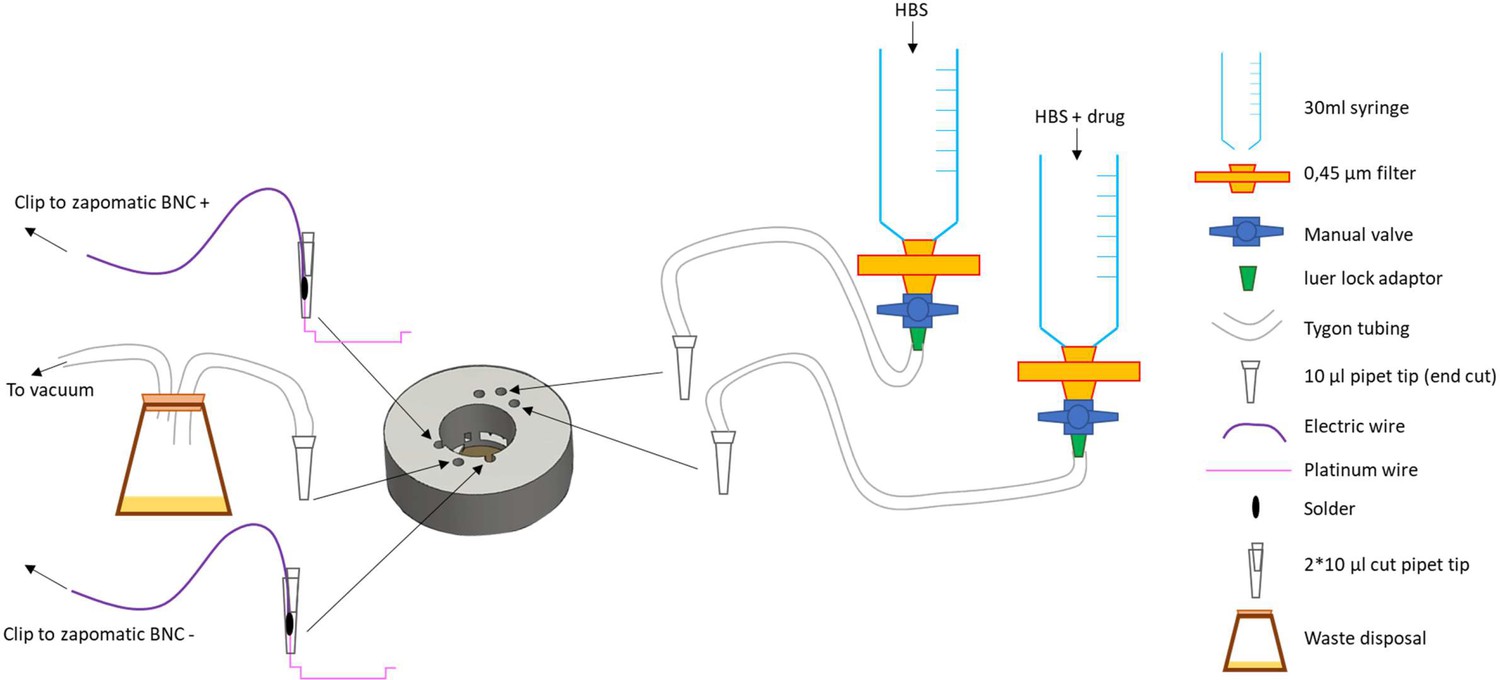
schematic of the perfusion installation.
Appendix 1—figure 5
Setting up of the insert.
(A) 35 mm glass bottom dish with 14 mm coverslip, note the plastic area surrounding the coverslip that needs to be completely dry for the vacuum grease to create a good seal. (B) Vacuum grease loaded into a 30 ml syringe completed with a cut pipet tip. (C) Grease applied to the bottom of the insert. (D) Dish setup in the holder with the insert ready to be installed. (E) Insert with perfusion lines installed, keep pressure on the insert to maintain a good seal. (F) Vacuum line installed and rubber band securing the insert, after this step it is no longer necessary to keep pressure on the insert. (G) Dish older with insert installed on the optics and electrodes connected to the alligator test clips. (H) View of the whole system in place. (I) After removing the insert use a scalped to remove the excess grease for the bottom of the insert, finish cleaning with a kimwipe.
Appendix 1—figure 6

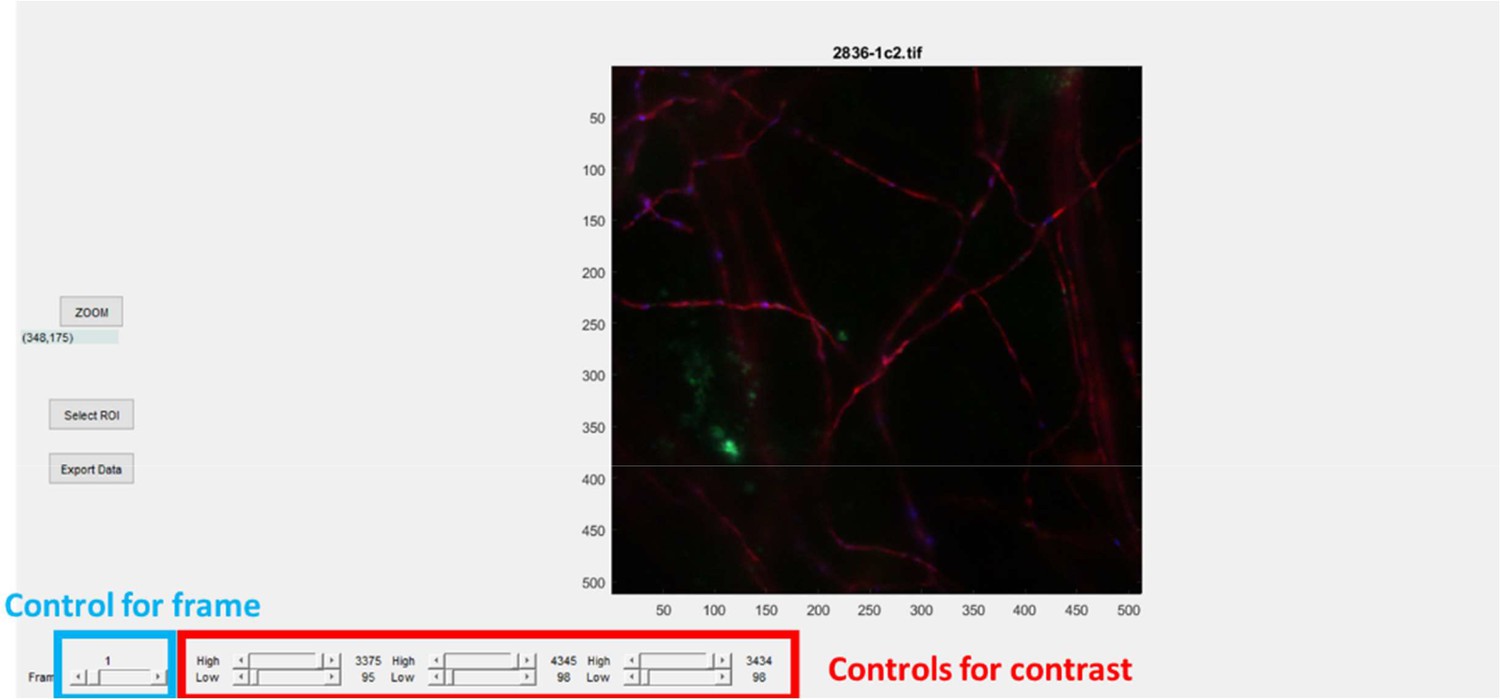
Zap100_1_2 user interface.
Title is name of the file, # indicates the frame (here 1). Lower list of buttons (Track synapses, Pick, Rem_rgn, Save Syn) are controls to select synapses. Lower left buttons are controls for the frame and play the movie. Middle lower controls are to set the contrast.
Appendix 1—figure 7
User interface for Manon.
Appendix 1—figure 8
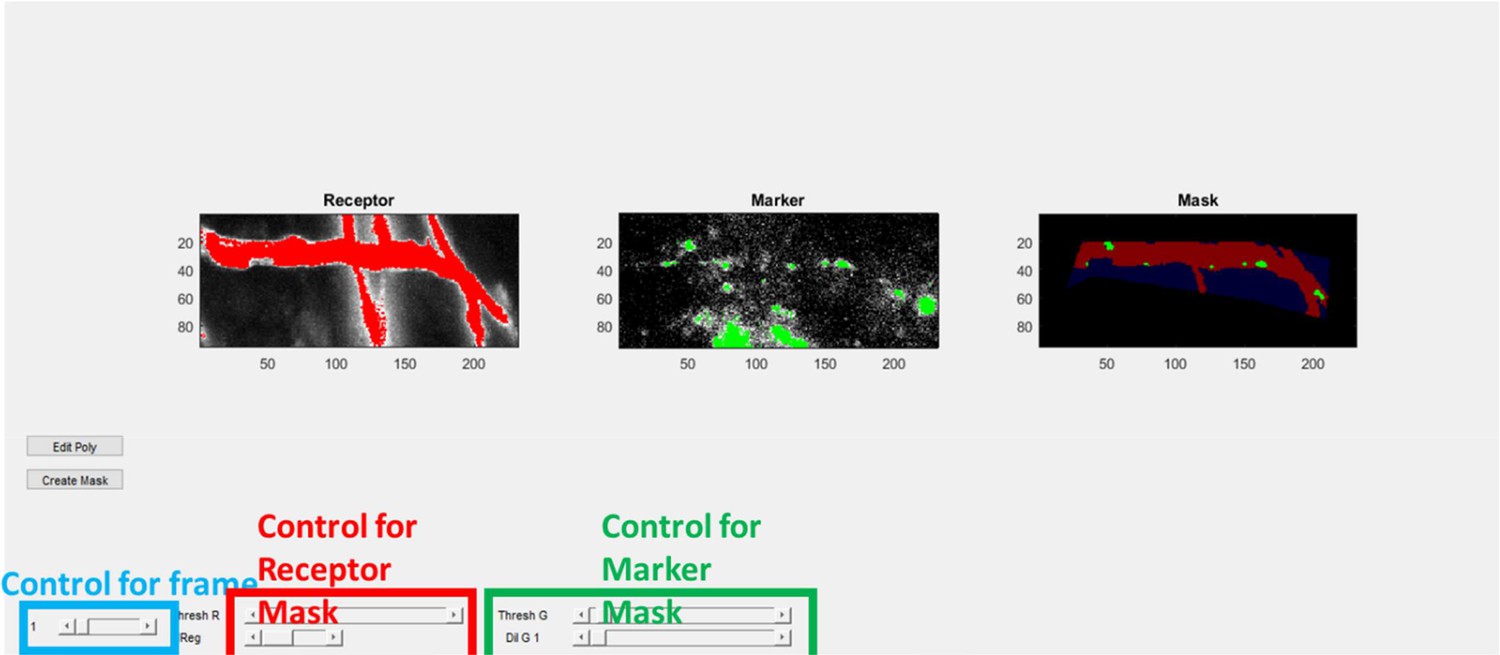
segmentation interface for Manon.
Additional files
Download links
A two-part list of links to download the article, or parts of the article, in various formats.
Downloads (link to download the article as PDF)
Open citations (links to open the citations from this article in various online reference manager services)
Cite this article (links to download the citations from this article in formats compatible with various reference manager tools)
Endocytic trafficking determines cellular tolerance of presynaptic opioid signaling
eLife 11:e81298.
https://doi.org/10.7554/eLife.81298


