Peripheral and central employment of acid-sensing ion channels during early bilaterian evolution
- Michael Sars Centre, University of Bergen, Norway
- Department of Biological Sciences, University of Bergen, Norway
- Hopkins Marine Station, Department of Biology, Stanford University, United States
Figures
Figure 1
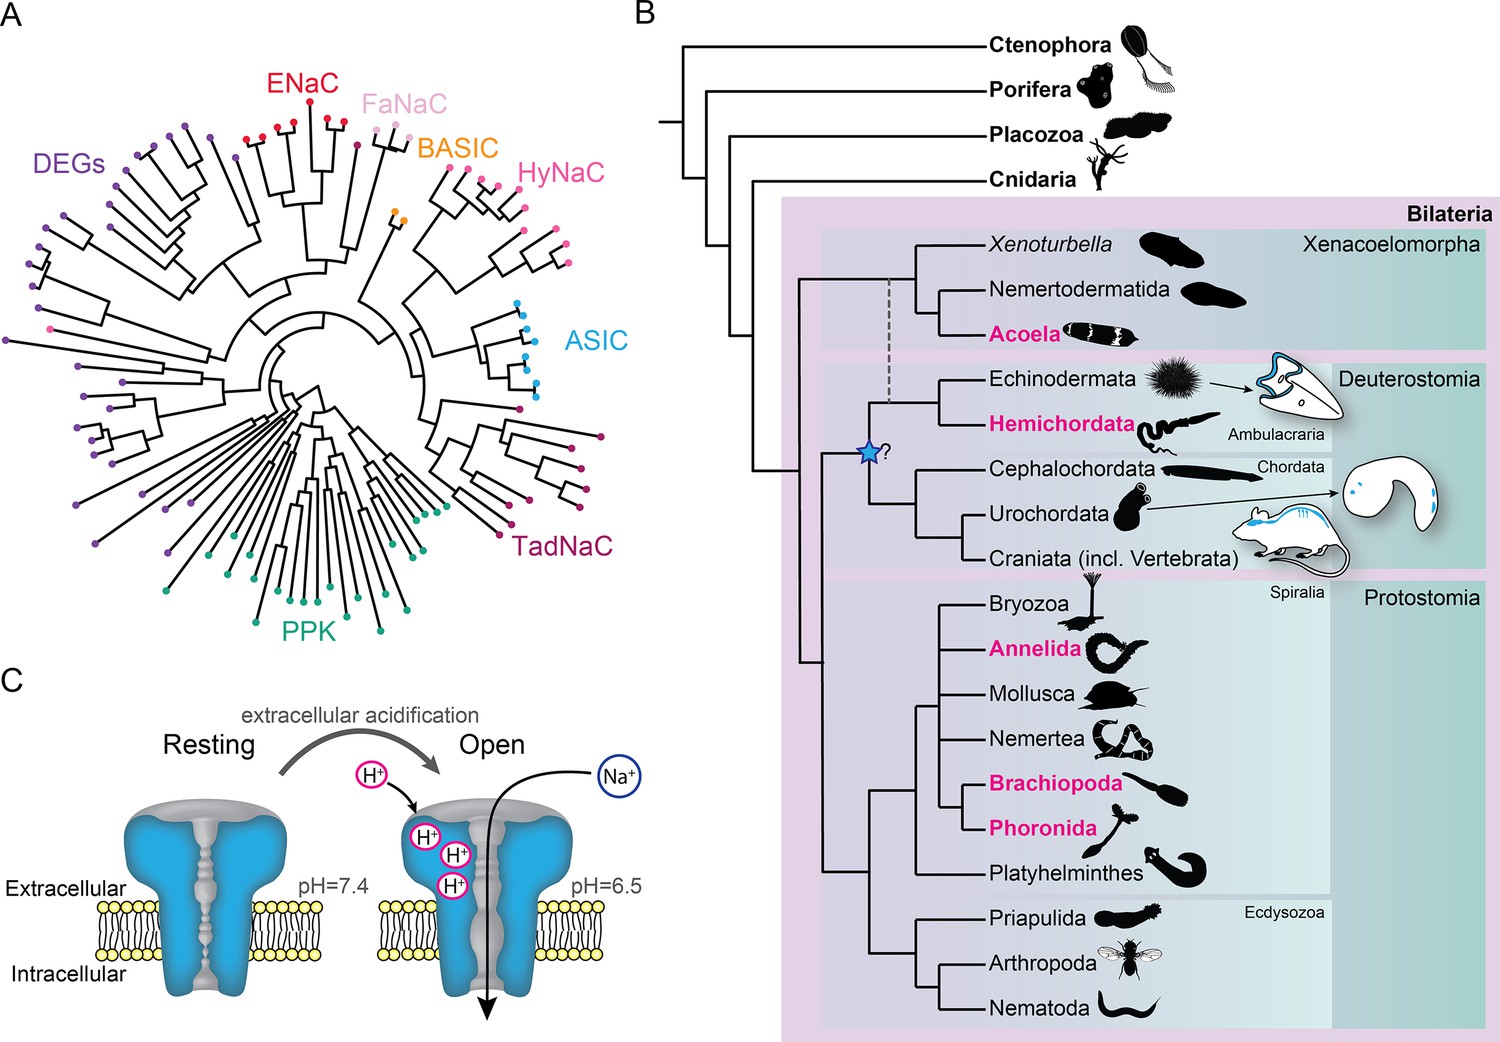
Overview of acid-sensing ion channels (ASICs) in Metazoa.
(A) Abridged phylogenetic tree of the degenerin/epithelial sodium channel (DEG/ENaC) family showing major expansions of previously studied members (after Assmann et al., 2014; Elkhatib et al., 2019). (B) Phylogenetic tree of main animal groups highlighting groups studied in this work (magenta), known ASIC expression (blue), and previously suggested ASIC emergence (blue star). Dotted lines show alternative positions for Xenacoelomorpha. Cartoons show previously described and well-established ASIC protein and/or RNA expression in Chordata (rodent brain, spinal cord, and sensory ganglia, Foster et al., 2021; urochordate larva sensory vesicle and bipolar tail neurons, Coric et al., 2008) and Ambulacraria (echinoderm larva ciliary band, Slota et al., 2020). (C) ASIC function. At rest, the channel is closed and impermeable. Upon extracellular acidification, certain amino acid side chains in the ASIC extracellular domain are protonated, causing conformational changes that open the channel, allowing sodium ions to flow down their chemo-electric gradient across the membrane.
Figure 2 with 2 supplements

The acid-sensing ion channel (ASIC) branch of the degenerin/epithelial sodium channel (DEG/ENaC) family includes only bilaterian genes.
ASIC branch from phylogenetic tree of DEG/ENaC family including 700 amino acid sequences from 47 metazoans (Figure 2—figure supplement 1). Genes analyzed experimentally in this study are in magenta (gene expression) and/or bold (electrophysiology). Scale bar: amino acid substitutions per site. aBayes (left) and aLRT SH-like (right) likelihood-based support values indicated.
Figure 2—figure supplement 1

Degenerin/epithelial sodium channel (DEG/ENaC) gene tree.
Maximum likelihood trees of 700 DEG/ENaC amino acid sequences from 47 animals (using LG + G substitution model; see Materials and methods, Survey and phylogenetic analysis). Branch support inferred by fast likelihood-based methods aBayes (A and C) and aLRT SH-like (D). Aaur, Aurelia aurita (Cnidaria); Agra, Acanthopleura granulata (Mollusca); Apla, Acanthaster planci (Echinodermata); Aque, Amphimedon queenslandica (Porifera); Bbel, Branchiostoma belcheri (Chordata); Bpli, Brachionus plicatilis (Rotifera); Cele, Caenorhabditis elegans (Nematodea); Cgig, Crassostrea gigas (Mollusca); Cmac, Convolutriloba macropyga (Xenacoelomorpha); Crob, Ciona robusta (Chordata); Cscu, Centruroides sculpturatus (Arthropoda); Csub, Childia submaculatum (Xenacoelomorpha); Dgig, Dendronephthya gigantea (Cnidaria); Dgyr, Dinophilus gyrociliatus (Annelida); Dmel, Drosophila melanogaster (Arthropoda); Dpul, Daphnia pulex (Arthropoda); Esen, Epiphanes senta (Rotifera); Hmia, Hofstenia miamia (Xenacoelomorpha); Hspi, Halicryptus spinulosus (Priapulida); Hvul, Hydra vulgaris (Cnidaria); Ipul, Isodiametra pulchra (Xenacoelomorpha); Lana, Lingula anatina (Brachiopoda); Llon, Lineus longissimus (Nemertea); Lsqu, Lepidodermella squamata (Gastrotricha); Lvir, Lineus viridis (Nemertea); Mlei, Mnemiopsis leidyi (Ctenophora); Mmem, Membranipora membranacea (Bryozoa); Msti, Meara stichopi (Xenacoelomorpha); Nano, Novocrania anomala (Brachiopoda); Ngen, Notospermus geniculatus (Nemertea); Nvec, Nematostella vectensis (Cnidaria); Nwes, Nemertoderma westbladi (Xenacoelomorpha); Odio, Oikopleura dioica (Chordata); Ofus, Owenia fusiformis (Annelida); Pbac, Pleurobranchia bachei (Ctenophora); Pcau, Priapulus caudatus (Priapulida); Pfla, Ptychodera flava (Hemichordata); Phar, Phoronopsis harmeri (Phoronida); Pvit, Prostheceraeus vittatus (Platyhelminthes); Pvul, Pontonema vulgare (Nematoda); Rnor, Rattus norvegicus (Chordata); Scal, Schizocardium californicum (Hemichordata); Smed, Schmidtea mediterranea (Platyhelminthes); Spad, Spadella sp (Chaetognatha); Tadh, Trichoplax adhaerens (Placozoan); Ttra, Terebratalia transversa (Brachiopoda); Xboc, Xenoturbella bocki (Xenacoelomorpha); Xpro, Xenoturbella profunda (Xenacoelomorpha). Reponses to increased proton concentrations at oocytes expressing channels closely related to acid-sensing ion channels (ASICs) are shown: heterotrimeric cnidarian Hydra vulgaris Na+ channel (HyNaC) (pink); rat bile acid-sensitive ion channel (BASIC) (orange). Other ligands are the peptide Hydra-RFamide-I ((pE)WLGGRFamide; pE; pyroglutamate) and the bile acid sodium ursodeoxycholic acid (NaUDCA). Schematic phylogenetic tree of main animal groups (B).
Figure 2—figure supplement 2

Sequence alignment of relevant domains in acid-sensing ion channels (ASICs).
(A) Protein sequence alignment of the wrist/lower palm, the acidic pocket, intersubunit palm-thumb, and pre-M1/M1/M2 of Group A and B ASICs and selected bile acid-sensitive ion channels (BASICs) and Hydra vulgaris Na+ channels (HyNaCs). Selected rat ASIC1a residues implicated in proton sensitivity and channel function are numbered above (see references in the main text). Verified proton-activated channels in bold. Colors refer to B. (B) Schematic phylogenetic tree of main animal groups used in A. (C) Cartoon diagram of the chick ASIC1 homotrimeric channel crystal structure, PDB number 6VTL. Regions compared in A in pink boxes.
Figure 3 with 1 supplement
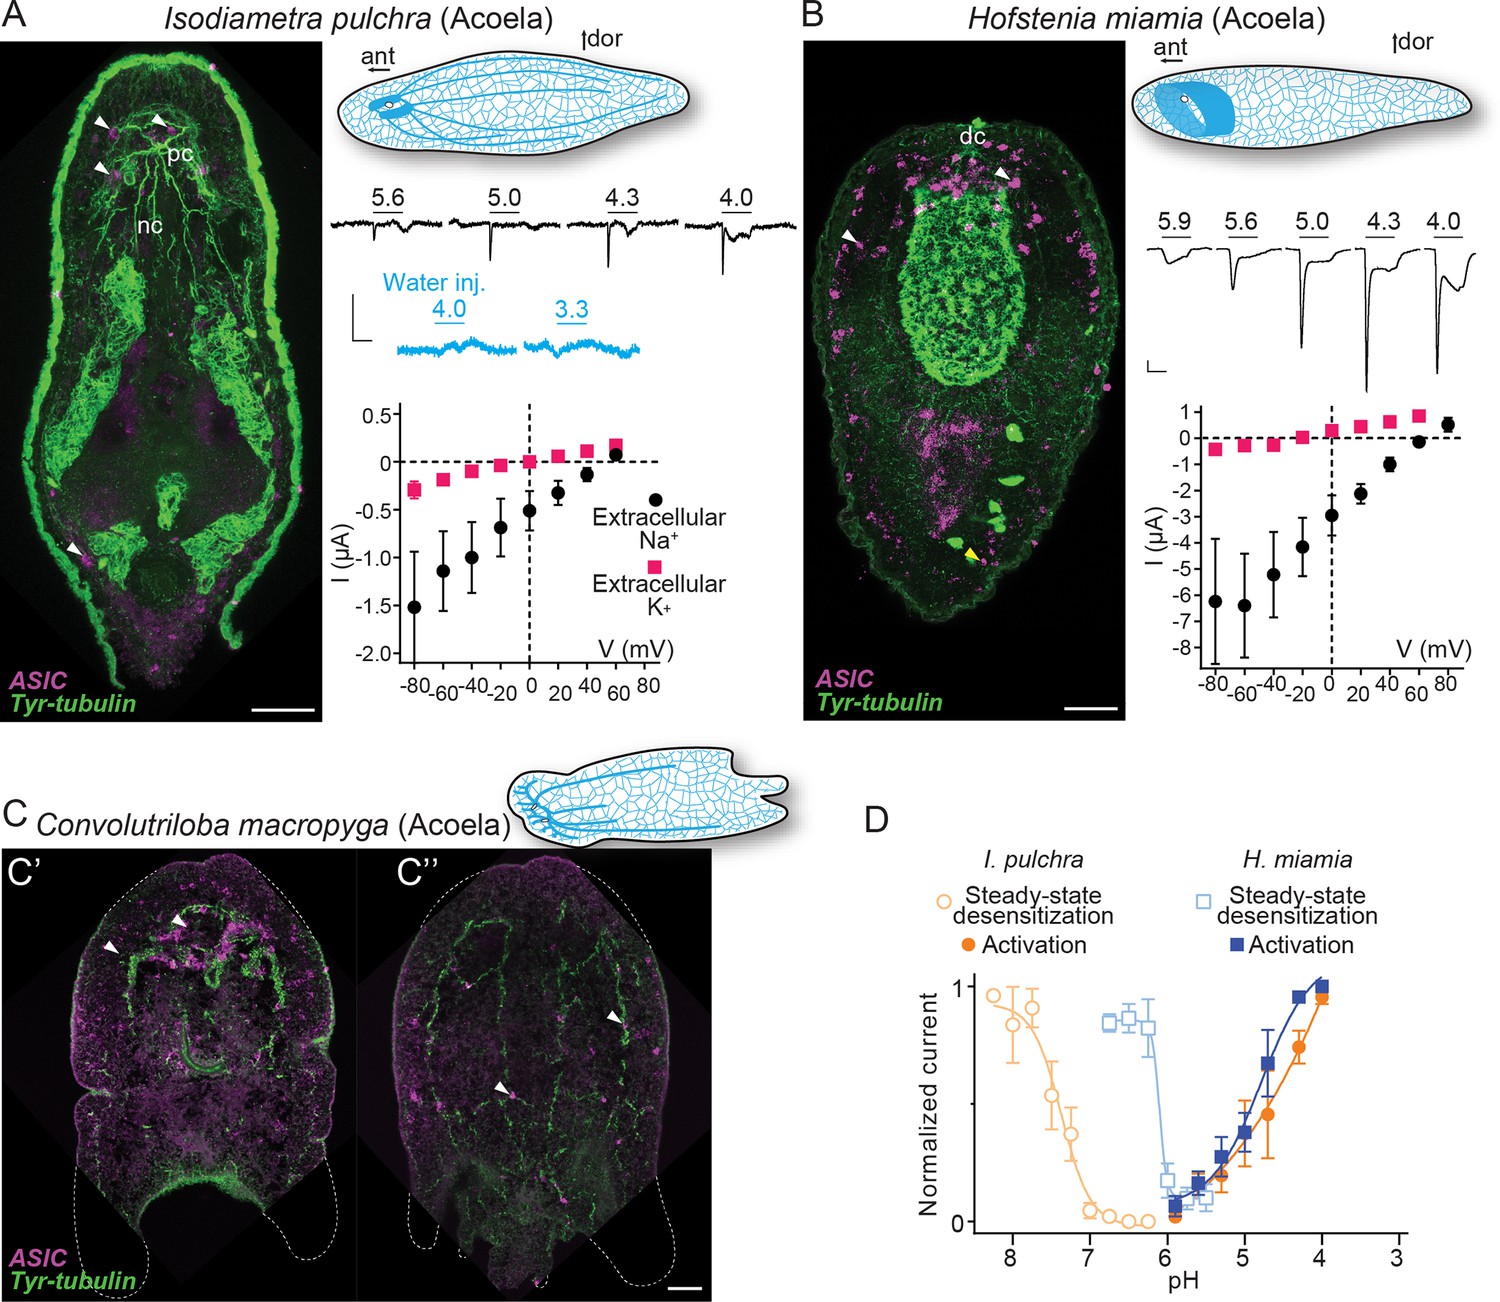
Expression and function of acid-sensing ion channels (ASICs) in Xenacoelomorpha.
(A,B) Left: Fluorescent confocal micrograph showing ASIC mRNA expression (magenta) and tyrosinated tubulin immunoreactivity (green), scale bar: 40 µm. Upper right: Cartoons illustrating morphology and nervous system (blue) after Martín-Durán et al., 2018. ant, anterior; dor, dorsal; dc, dorsal commissure; nb, neurite bundles; pc, posterior commissure. Mid-right: Proton-gated currents in xenacoelomorph ASIC-expressing or water-injected Xenopus laevis oocytes (scale bars: x, 5 s; y, 0.5 μA). Lower right: Mean (± SEM) pH 4-gated current (I, μA) at different membrane potentials (V, mV) in the presence of 96 mM extracellular NaCl or KCl (n=5–7). Reversal potential (Vrev) was read off these plots and the difference between Vrev,NaCl and Vrev,KCl was used to calculate relative ion permeability (PNa+/PK+, Materials and methods). (C) ASIC mRNA expression (magenta) and tyrosinated tubulin immunoreactivity (green) in Convolutriloba macropyga. As C. macropyga is larger, images of slightly ventral (C') and dorsal (C'') planes are shown. (D) Filled symbols: Mean (± SEM) normalized current amplitude in response to increasing proton concentrations (activation, n=6–8). Open symbols: Mean (± SEM) normalized current amplitude in response to pH 4 following pre-incubation in decreasing pH (steady-state desensitization, n=5–6).
-
Figure 3—source data 1
Numerical data contributing to Figure 3.
- https://cdn.elifesciences.org/articles/81613/elife-81613-fig3-data1-v1.xlsx
Figure 3—figure supplement 1
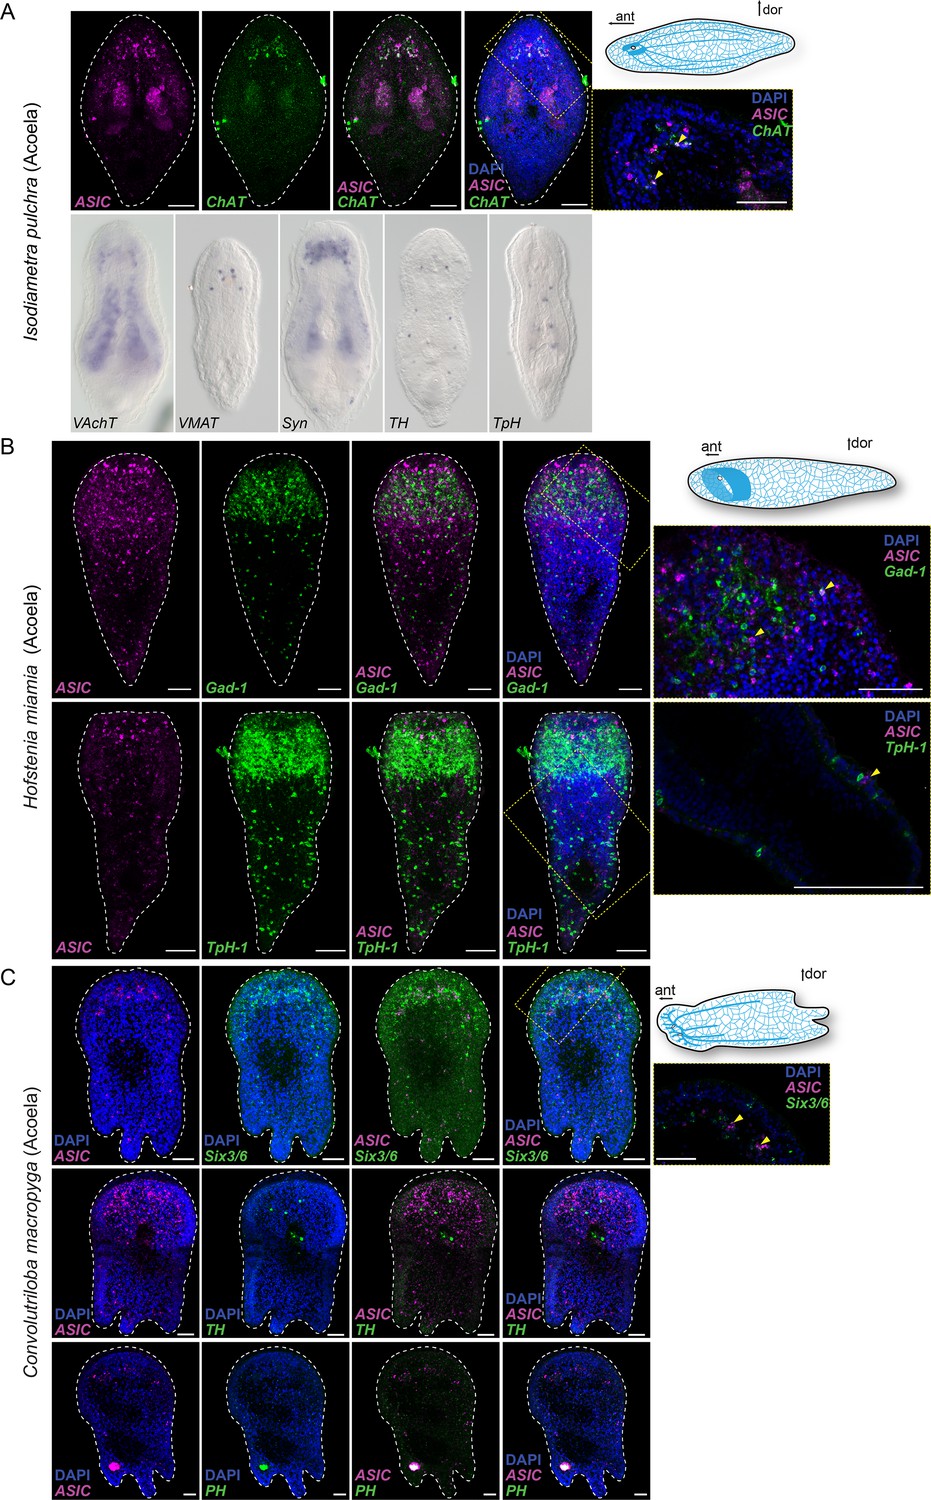
Expression of neuronal markers in Xenacoelomorpha: Isodiametra pulchra (A), Hofstenia miamia (B), and Convolutriloba macropyga (C).
The neuronal markers choline acetyltransferase (ChAT), vesicular acetylcholine transporter (VAchT), vesicular monoamine transporter (VMAT), synaptotagmin (Syn), tyrosine hydroxylase (TH), tryptophan hydroxylase (TpH), glutamate decarboxylase (Gad-1), phenylalanine hydroxylase (PH), and the transcription factor sine-oculis like 3/6 (Six3/6) are mostly expressed in the neuronal ganglia and nerve cords comparable to ASIC expression in these species. Arrowheads (black in A, yellow in B) highlight acid-sensing ion channel (ASIC) expression. Nuclei are stained blue with DAPI. Yellow dashed frame images are magnifications of the yellow dashed line boxes. Scale bar: 50 µm. ant, anterior; dor, dorsal.
Figure 4 with 1 supplement
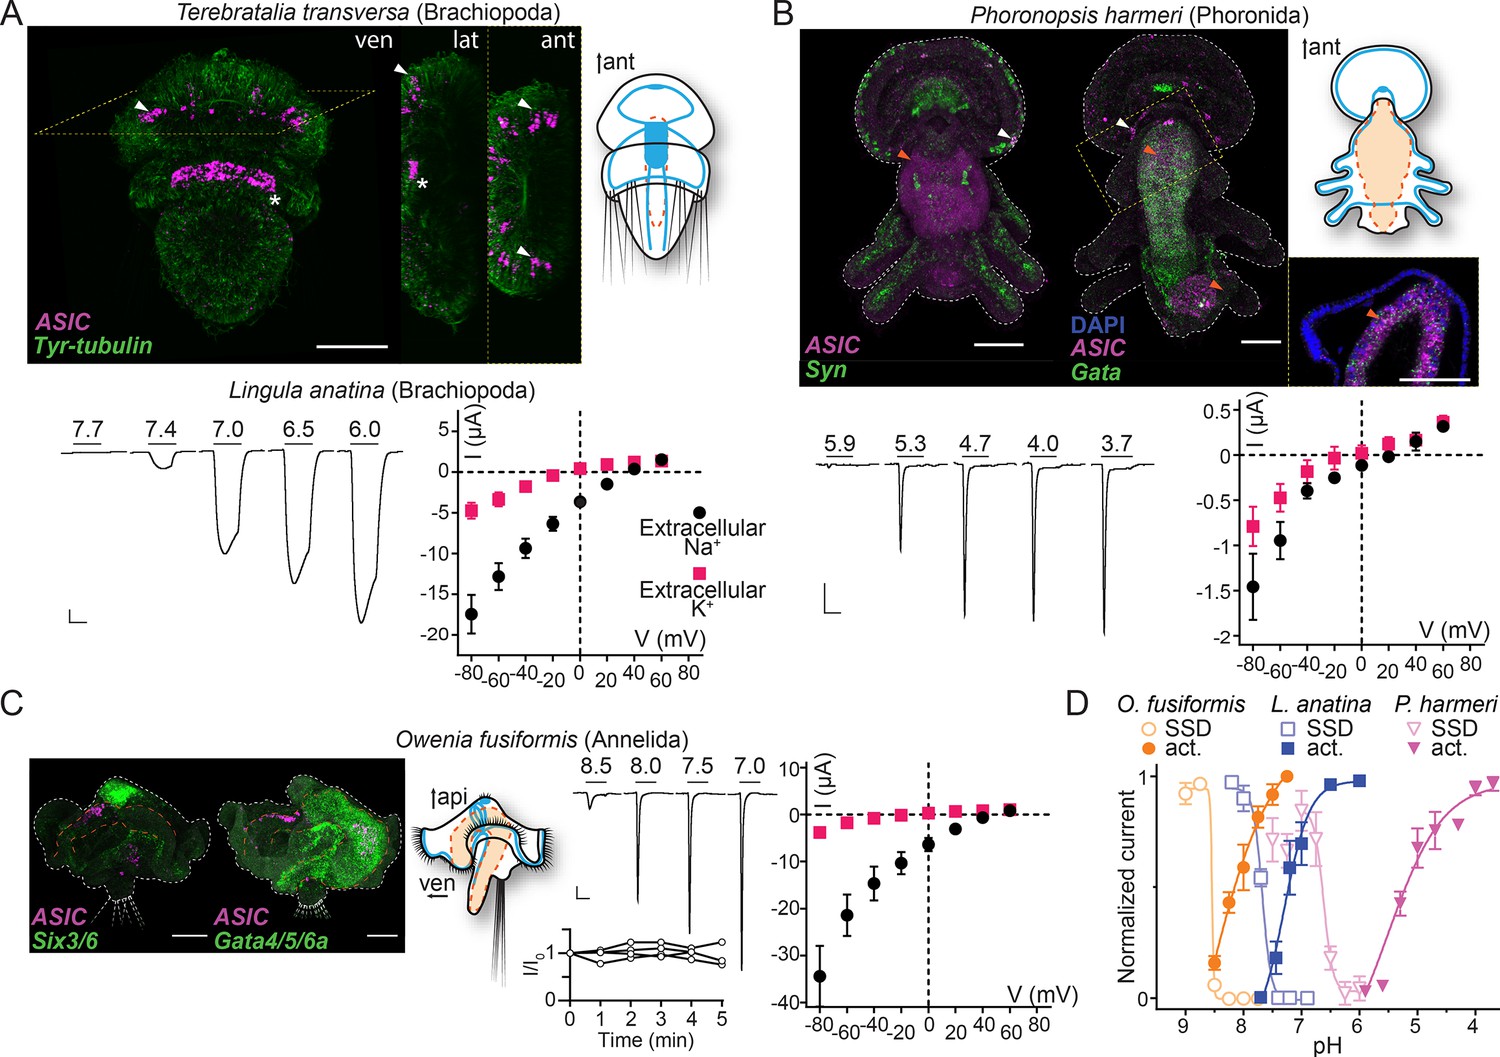
Expression and function of acid-sensing ion channels (ASICs) in Spiralia.
(A,B) Upper left: ASIC mRNA expression (magenta) and the neuronal (synaptotagmin, Syn; sine-oculis like 3/6, Six3/6; in green) and endodermal markers (Gata, in green). Tyrosinated tubulin immunoreactivity (green) (ant, anterior; api, apical; lat, lateral; ven, ventral; scale bar: 40 µm). Arrowheads, ASIC expression; asterisks, unspecific staining common in Terebratalia transversa (Martín-Durán et al., 2018). Yellow dashed frame images are magnifications of the yellow dashed line boxes. Upper right: Cartoons illustrating nervous system (blue) and digestive system (orange; Anlage only in T. transversa) after Gąsiorowski et al., 2021; Helm et al., 2016. Lower left: Proton-gated currents in Xenopus laevis oocytes expressing indicated spiralian ASICs (scale bars: x, 5 s; y, 1 μA). Lower right: Mean (± SEM) pH 6.5- (Lingula anatina) or 4- (Phoronopsis harmeri ASIC) gated current (I, μA) at different membrane potentials (V, mV) in the presence of 96 mM extracellular NaCl or KCl (n=5–8). Reversal potential (Vrev) was read off these plots and the difference between Vrev,NaCl and Vrev,KCl was used to calculate relative ion permeability (PNa+/PK+). (C) Left to right: ASIC expression, animal morphology, proton-gated currents (top), and normalized current amplitude, that is, amplitude of the current at certain time (-I) divided by the current amplitude at the start of the experiment (I0), in response to same proton concentration (pH 7.0) in oocytes perfused with pH 9.0 solution for 5 min (bottom), lines connect data from individual oocytes, and pH 6.5-gated current at different membrane potentials, as in (A,B) at Owenia fusiformis ASIC. (D) Filled symbols: Mean (± SEM) normalized current amplitude in response to increasing proton concentrations (activation, ‘act.’, n=6–10). Open symbols: Mean (± SEM) normalized current amplitude in response to pH 7 for O. fusiformis, 6.5 for L. anatina, and 4 for P. harmeri ASIC following pre-incubation in decreasing pH (steady-state desensitization, ‘SSD’, n=4–5).
-
Figure 4—source data 1
Numerical data contributing to Figure 4.
- https://cdn.elifesciences.org/articles/81613/elife-81613-fig4-data1-v1.xlsx
Figure 4—figure supplement 1
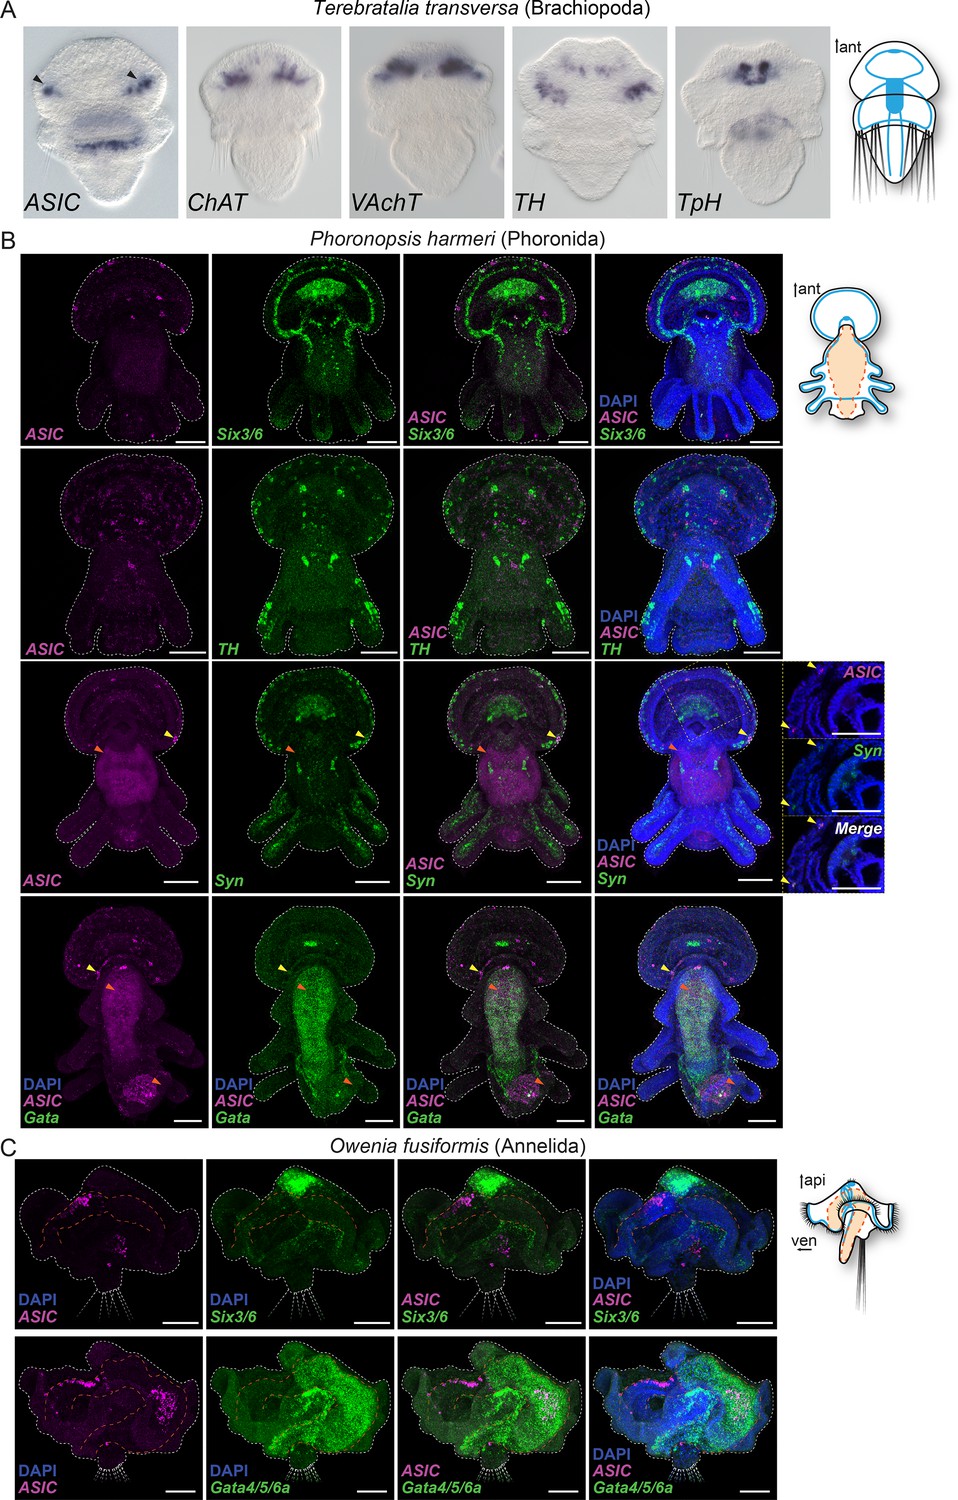
Expression of neuronal and endodermal markers in Spiralia: Terebratalia transversa (A), Phoronopsis harmeri (B), and Owenia fusiformis (C).
The neuronal markers choline acetyltransferase (ChAT), vesicular acetylcholine transporter (VAchT), tyrosine hydroxylase (TH), tryptophan hydroxylase (TpH), synaptotagmin (Syn), and the transcription factor sine-oculis like 3/6 (Six3/6) are mostly expressed in the neuronal ganglia and nerve cords comparable to ASIC expression in these species, whereas the transcription factor Gata is expressed in the digestive system. Colocalization of two genes expression is visually identified in the regions of the image that appear white. Arrowheads highlight ASIC expression in nervous system (black in A, yellow in B and C) and in the digestive system (orange). ant. anterior; api, apical; ven, ventral. Yellow dashed frame images are magnifications of the yellow dashed line boxes.
Figure 5 with 1 supplement

Expression and function of hemichordate acid-sensing ion channel (ASIC).
(A) Cartoon illustrating nervous system (blue) and digestive system (orange) in Schizocardium californicum, after Gonzalez et al., 2017, and hybridization chain reaction (HCR) showing expression of S. californicum ASIC and the neuronal markers synaptotagmin (Syn) or sine-oculis like (Six3). White arrowheads highlight ASIC expression. Colocalization of two genes’ expression is visually identified in the regions of the image that appear white. Nuclei are stained blue with Hoescht. Scale bar: 50 μm. (B) Proton-gated currents in Xenopus laevis oocytes expressing S. californicum ASIC. Scale bars: x, 5 s; y, 2 μA. (C) Filled symbols: Mean (± SEM) normalized current amplitude in response to increasing proton concentrations (activation, ‘act.’, n=3). Open symbols: Mean (± SEM) normalized current amplitude in response to pH 4 following pre-incubation in decreasing pH (steady-state desensitization, n=4). (D) Mean (± SEM) pH 4-gated current (I, μA) at different membrane potentials (V, mV) in the presence of 96 mM extracellular NaCl or KCl (n=5).
-
Figure 5—source data 1
Numerical data contributing to Figure 5.
- https://cdn.elifesciences.org/articles/81613/elife-81613-fig5-data1-v1.xlsx
Figure 5—figure supplement 1

Expression of acid-sensing ion channel (ASIC) and neuronal markers in Hemichordata: Colorimetric in situ hybridization for ASIC (A) and hybridization chain reactions (HCRs) for ASIC (B), synaptotagmin (Syn) (C), sine-oculis like (Six3) (D), and the merge (E).
Arrowheads (black in A, white in B to E) highlight ASIC expression. Colocalization of two genes expression is visually identified in the regions of the image that appear white. Nuclei are stained blue with Hoescht. Scale bar: 50 µm.
Figure 6
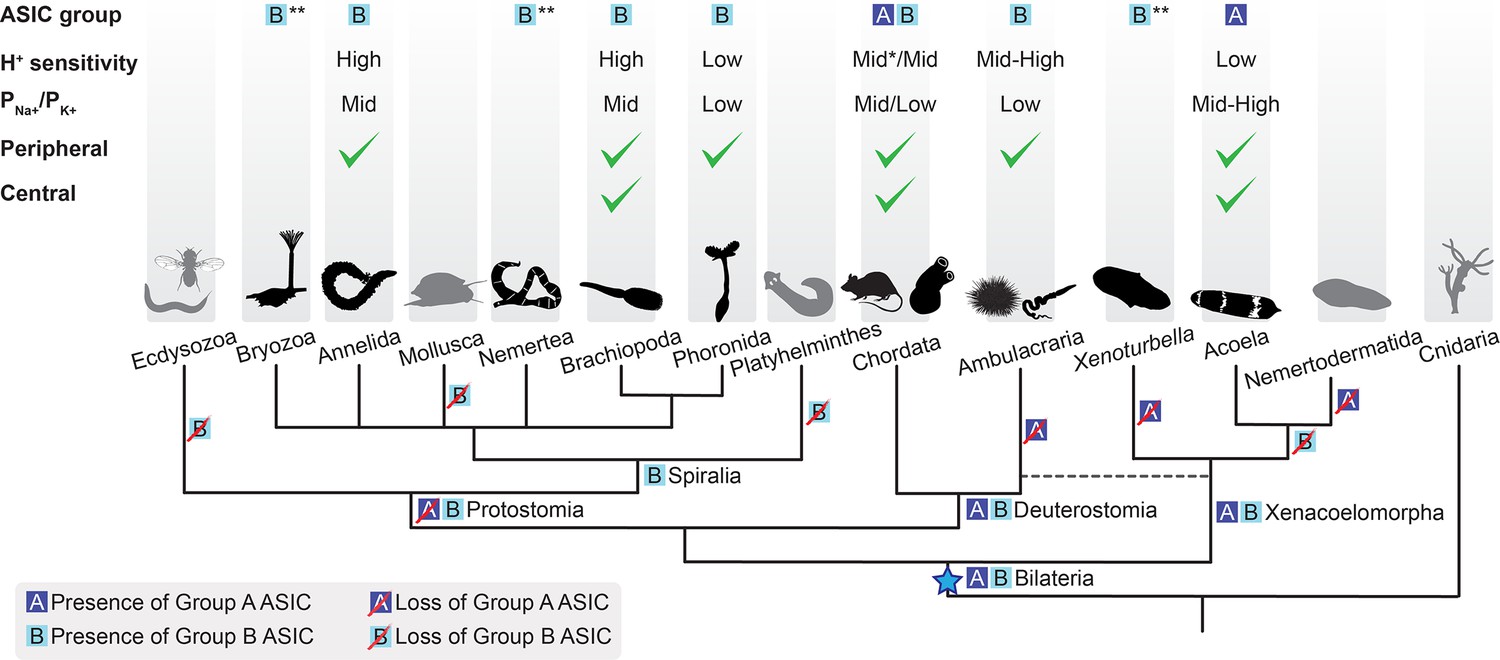
Evolutionary history of acid-sensing ion channel (ASIC) function in Metazoa.
Upper half of diagram indicates characteristic properties of ASIC in different lineages: degenerin/epithelial sodium channel (DEG/ENaC) gene tree position (‘ASIC group A or B’); proton (H+) sensitivity; relative ion permeability (‘PNa+/PK+’); native expression pattern (‘Peripheral’, ciliary or gastrointestinal epithelia and/or peripheral neurons; ‘Central’, brain and/or nerve cords). Lower half shows phylogenetic relationships of the different animal phyla studied here. Blue star, putative emergence of ASICs in the last common ancestor of all bilaterians after Cnidaria/Bilateria split. For H+ sensitivity, ‘low’, ‘mid’, and ‘high’ correspond to pH50 <5.3, 5.3–7, and >7, respectively. *, a minority of characterized chordate ASICs have low H+ sensitivity (Gründer and Pusch, 2015; Paukert et al., 2004). For relative ion permeability, ‘low’, ‘mid’, and ‘high’ correspond to PNa+/PK+≤3, 3–15, and >15, respectively. **, channel function not experimentally tested.
Tables
Table 1
Biophysical characteristics of bilaterian acid-sensing ion channels (ASICs) (mean ± SEM).
| Proton sensitivity | Permeability | |||||||||||||||
|---|---|---|---|---|---|---|---|---|---|---|---|---|---|---|---|---|
| Animal | Imax (Low-Ca2+; µA) | n | Imax (µA) | n | pH50a (Low-Ca2+) | n | pH50a | n | pH50SSD | n | T50%(s)* | n | Isus/Itra† | n | PNa+/PK+ | n |
| Xenacoelomorph | ||||||||||||||||
| Isodiametra pulchra | 3.6±0.8 | 5 | 0.8±0.2 | 7 | 5.3±0.2 | 5 | 4.9±0.2 | 8 | 7.4±0.1 | 5 | 0.09±0.02 | 6 | 0.25±0.04 | 6 | 8.3±2.0 ≥8‡,§ | 7 6‡ |
| Hofstenia miamia | 46.1±11.6 | 5 | 7.3±1.5 | 6 | 5.6±0.1 | 4 | 4.8±0.1 | 6 | 6.1±0.1 | 6 | 0.18±0.02 | 6 | 0.18±0.03 | 6 | 30.1±5.9 27.7±6.2‡ | 5 4‡ |
| Spiralian | ||||||||||||||||
| Lingula anatina | 32.1±4.8 | 6 | 11.5±1.9 | 5 | 7.5±0.01 | 6 | 7.3±0.2 | 6 | 7.7±0.03 | 4 | 8.96±0.42 | 5 | 0.02±0.01 | 5 | 9.0±1.7 | 8 |
| Phoronopsis harmeri | 10.4±0.6 | 5 | 7.0±1.3 | 10 | 5.7±0.3 | 5 | 5.2±0.1 | 10 | 6.5±0.05 | 5 | 0.22±0.02 | 4 | 0.03±0.01 | 4 | 3.0±1.0 | 5 |
| Owenia fusiformis | 56.6±11.1 | 6 | 21.3±2.7 | 7 | 8.3±0.1 | 6 | 8.1±0.1 | 5 | 8.6±0.02 | 5 | 0.15±0.01 | 4 | 0.00±0.00 | 4 | 12.0±0.3 | 6 |
| Hemichordate | ||||||||||||||||
| Schizocardium californicum | 25.8±3.3 | 6 | 7.9±2.0 | 3 | 6.05±0.3 | 6 | 5.3±0.1 | 3 | 7.4±0.17 | 4 | 0.18±0.02 | 6 | 0.01±0.00 | 6 | 2.9±0.5 | 5 |
-
*
Time to half-maximal desensitization (half the time from peak transient current to plateaued, sustained current).
-
†
Relation between current amplitudes for sustained and transient peaks (Isus/Itra).
-
‡
Values for the sustained current.
-
§
For I. pulchra ASIC, sustained current with extracellular NaCl clearly reversed at 60 mV, and sustained currents with extracellular KCl were small, generally outward, and difficult to quantify. Together this leads us to conclude that PNa+/PK+ is high.
-
Table 1—source data 1
Numerical data contributing to Table 1 that is not already in Figure Source Data files.
- https://cdn.elifesciences.org/articles/81613/elife-81613-table1-data1-v1.xlsx
Key resources table
| Reagent type (species) or resource | Designation | Source or reference | Identifiers | Additional information |
|---|---|---|---|---|
| gene (Isodiametra pulchra) | ASIC | NCBI | OQ259901.1 | |
| gene (Isodiametra pulchra) | ChAT | NCBI | KY709762.1 | |
| gene (Isodiametra pulchra) | VAchT | NCBI | KY709763.1 | |
| gene (Isodiametra pulchra) | VMAT | NCBI | KY709764.1 | |
| gene (Isodiametra pulchra) | Syn | NCBI | OQ259900.1 | |
| gene (Isodiametra pulchra) | TH | NCBI | KY709765.1 | |
| gene (Isodiametra pulchra) | TpH | NCBI | KY709766.1 | |
| gene (Hofstenia miamia) | ASIC | NCBI | OQ259911.1 | |
| gene (Hofstenia miamia) | Gad-1 | NCBI | MT657938.1 | |
| gene (Hofstenia miamia) | TpH-1 | NCBI | MT657942.1 | |
| gene (Convolutriloba macropyga) | ASIC | NCBI | OQ259902.1 | |
| gene (Convolutriloba macropyga) | Six3/6 | NCBI | OQ259903.1 | |
| gene (Convolutriloba macropyga) | TH | NCBI | OQ259904.1 | |
| gene (Convolutriloba macropyga) | PH | NCBI | OQ259905.1 | |
| gene (Terebratalia transversa) | ASIC | NCBI | OQ259906.1 | |
| gene (Terebratalia transversa) | ChAT | NCBI | KY809754.1 | |
| gene (Terebratalia transversa) | VAchT | NCBI | KY809753.1 | |
| gene (Terebratalia transversa) | TH | NCBI | OQ259907.1 | |
| gene (Terebratalia transversa) | TpH | NCBI | KY809752.1 | |
| gene (Lingula anatina) | ASIC | OIST | g20471.1 | |
| gene (Phoronopsis harmeri) | ASIC | NCBI | OQ259908.1 | |
| gene (Phoronopsis harmeri) | Six3/6 | NCBI | MN431430.1 | |
| gene (Phoronopsis harmeri) | TH | NCBI | OQ259909.1 | |
| gene (Phoronopsis harmeri) | Syn | NCBI | OQ259910.1 | |
| gene (Phoronopsis harmeri) | Gata4/5/6 | NCBI | MN431425.1 | |
| gene (Owenia fusiformis) | ASIC | NCBI | OQ259912.1 | |
| gene (Owenia fusiformis) | Six3/6 | NCBI | KR232531 | |
| gene (Owenia fusiformis) | Gata4/5/6 a | NCBI | KR232537 | |
| gene (Schizocardium californicum) | ASIC | NCBI | OQ259913.1 | |
| gene (Schizocardium californicum) | Syn | NCBI | OQ259914.1 | |
| gene (Schizocardium californicum) | Six3 | NCBI | KX845335.1 | |
| commercial assay or kit | pGEM-T Easy vector | Promega | A1360 | |
| commercial assay or kit | Ambion Megascript T7 | Invitrogen | AM1334 | |
| commercial assay or kit | Ambion Megascript SP6 | Invitrogen | AM1330 | |
| commercial assay or kit | TSA Cy3 kit | PerkinElmer | NEL744001KT | |
| commercial assay or kit | TSA Cy5 kit | PerkinElmer | NEL745001KT | |
| antibody | Monoclonal Anti-Tubulin, Tyrosine antibody produced in mouse | Sigma-Aldrich | T9028 | |
| antibody | Alexa Fluor 488 goat anti-mouse IgG | Life Technologies | A-11029 | |
| antibody | Anti-Digoxigenin-AP, Fab fragments | Roche | 11093274910 | |
| antibody | Anti-Digoxigenin-POD, Fab fragments | Roche | 11207733910 | |
| antibody | Anti-DNP HRP Conjugate | Akoya | TS-0004000 | |
| other | DAPI | Molecular Probes | D1306 | |
| sequence-based reagent | Scal_ASIC | Molecular Instruments, Inc | HCR probe | |
| sequence-based reagent | Scal_Six3 | Molecular Instruments, Inc | HCR probe | |
| sequence-based reagent | Scal_Syn | Integrated DNA Technologies | DNA oligo pool | |
| other | HCR amplifiers with fluorophores B1-Alexa Fluor-647 | Molecular Instruments, Inc | ||
| other | HCR amplifiers with fluorophores B2-Alexa Fluor-488 | Molecular Instruments, Inc | ||
| other | HCR amplifiers with fluorophores B3-Alexa Fluor-546 | Molecular Instruments, Inc | ||
| recombinant DNA reagent | modified pSP64poly(A) (plasmid) | This paper | contains 5′- and 3′-UTR sequences of the X. laevis β-globin gene, and a C-terminal Myc tag | |
| commercial assay or kit | SP6 Polymerase mMessage mMachine kit, Ambion | Fisher | 10391175 | |
| biological sample (Xenopus laevis) | Oocytes | Ecocyte Bioscience | ||
| other | OC-725C amplifier | Warner Instruments | ||
| other | LIH 8+8 digitizer | HEKA | ||
| software | Patchmaster | HEKA | ||
| software | pClamp v10.7 | Molecular Devices | ||
| chemical compound, drug | Sodium ursodeoxycholic acid | Santa Cruz Biotechnology | sc-222407 | |
| peptide, recombinant protein | (pyroE)WLGGRFamide | Genscript |
Author response table 1
| Rat | Ambulacraria | Acoel | Spiralia | ||
|---|---|---|---|---|---|
| Rat | Overall | 48-51% | 26-32% | 24-31% | 27-35% |
| TM1 | 48-60% | 16-44% | 24-36% | 20-40% | |
| ECD | 54-74% | 31-36% | 31-38% | 31-39% | |
| TM2 | 82-71% | 38-53% | 47-59% | 47-62% | |
| Ambulacraria | Overall | 35-56% | 22-23% | 27-30% | |
| TM1 | 16-52% | 12-24% | 12-28% | ||
| ECD | 42-63% | 27-29% | 31-41% | ||
| TM2 | 47-76% | 32-44% | 35-56% | ||
| Acoel | Overall | 49% | 22-28% | ||
| TM1 | 84% | 12-28% | |||
| ECD | 55% | 31-36% | |||
| TM2 | 85% | 38-56% | |||
| Spiralia | Overall | 40-42% | |||
| TM1 | 20-32% | ||||
| ECD | 42-45% | ||||
| TM2 | 59-65% |
Additional files
-
Supplementary file 1
Amino acid sequence alignment used for acid-sensing ion channel (ASIC) phylogenies.
- https://cdn.elifesciences.org/articles/81613/elife-81613-supp1-v1.zip
-
Supplementary file 2
DNA sequences of neuronal and endodermal genes utilized in in situ hybridization or hybridization chain reaction gene expression studies.
Aromatic amino acid hydroxylase gene tree.
- https://cdn.elifesciences.org/articles/81613/elife-81613-supp2-v1.docx
-
Supplementary file 3
Modified pSP64 vector and inserts used for Xenopus laevis expression and electrophysiology.
- https://cdn.elifesciences.org/articles/81613/elife-81613-supp3-v1.docx
-
MDAR checklist
- https://cdn.elifesciences.org/articles/81613/elife-81613-mdarchecklist1-v1.docx
Download links
A two-part list of links to download the article, or parts of the article, in various formats.
Downloads (link to download the article as PDF)
Open citations (links to open the citations from this article in various online reference manager services)
Cite this article (links to download the citations from this article in formats compatible with various reference manager tools)
Peripheral and central employment of acid-sensing ion channels during early bilaterian evolution
eLife 12:e81613.
https://doi.org/10.7554/eLife.81613


