Differences in the inflammatory proteome of East African and Western European adults and associations with environmental and dietary factors
- Department of Internal Medicine, Radboudumc Center for Infectious Diseases, Radboudumc Research Institute for Medical innovation (RIMI), Radboud University Medical Center, Netherlands
- Department of Medical Biochemistry and Molecular Biology, Kilimanjaro Christian Medical University College, United Republic of Tanzania
- Kilimanjaro Clinical Research Institute, Kilimanjaro Christian Medical Center, United Republic of Tanzania
- Department for Genomics and Immunoregulation, Life & Medical Sciences (LIMES) Institute, University of Bonn, Germany
- Systems Medicine, German Center for Neurodegenerative Diseases (DZNE), Germany
- Departement NEUROFARBA, University of Florence – Gastroenterology and Nutrition Unit, Meyer Children's Hospital, Italy
- Department of Biology, University of Florence, Italy
- PRECISE Platform for Single Cell Genomics and Epigenomics, German Center for Neurodegenerative Diseases (DZNE) and University of Bonn, Germany
- Department of Medical Genetics, Iuliu Hatieganu University of Medicine and Pharmacy, Romania
- Department of Paediatrics, Kilimanjaro Christian Medical University College, United Republic of Tanzania
- Department of Immunology and Metabolism, Life & Medical Sciences (LIMES) Institute, University of Bonn, Germany
Figures
Figure 1 with 3 supplements

Differentially expressed inflammatory protein profiles among Dutch and Tanzanian participants.
(A) Principal component analysis depicting the sample distribution of Dutch (N=416) vs. Tanzanian (N=318) healthy individuals across PC1 and PC2, indicating significant differences in the inflammatory protein profiles of the two cohorts. (B) Volcano plot showing differentially expressed proteins (DEPs) between the Dutch and Tanzanian cohorts (Dutch cohort; N=74 and Tanzanian cohort; N=72 inflammatory proteins; analyzed by Limma, linear models for microarray data, R package). The x-axis shows the Log2 fold change (Log2 FC) of the normalized protein expression (NPX), while the y-axis shows the -Log10 of the adjusted p-values (FDR <0.05); dotted lines represent the cut-off value Log2FC < 0.5 and> 0.5. (C) Violin plots showing concentrations of circulating adipokines and inflammatory cytokines in the Dutch and Tanzanian participants (data previously reported (Temba et al., 2022); differences analyzed by linear regression with age, sex and BMI as covariates). Results were declared significant after correcting for multiple testing using False discovered rate (FDR). AAT; alpha-1 antitrypsin; BMI; Body Mass Index.
Figure 1—figure supplement 1
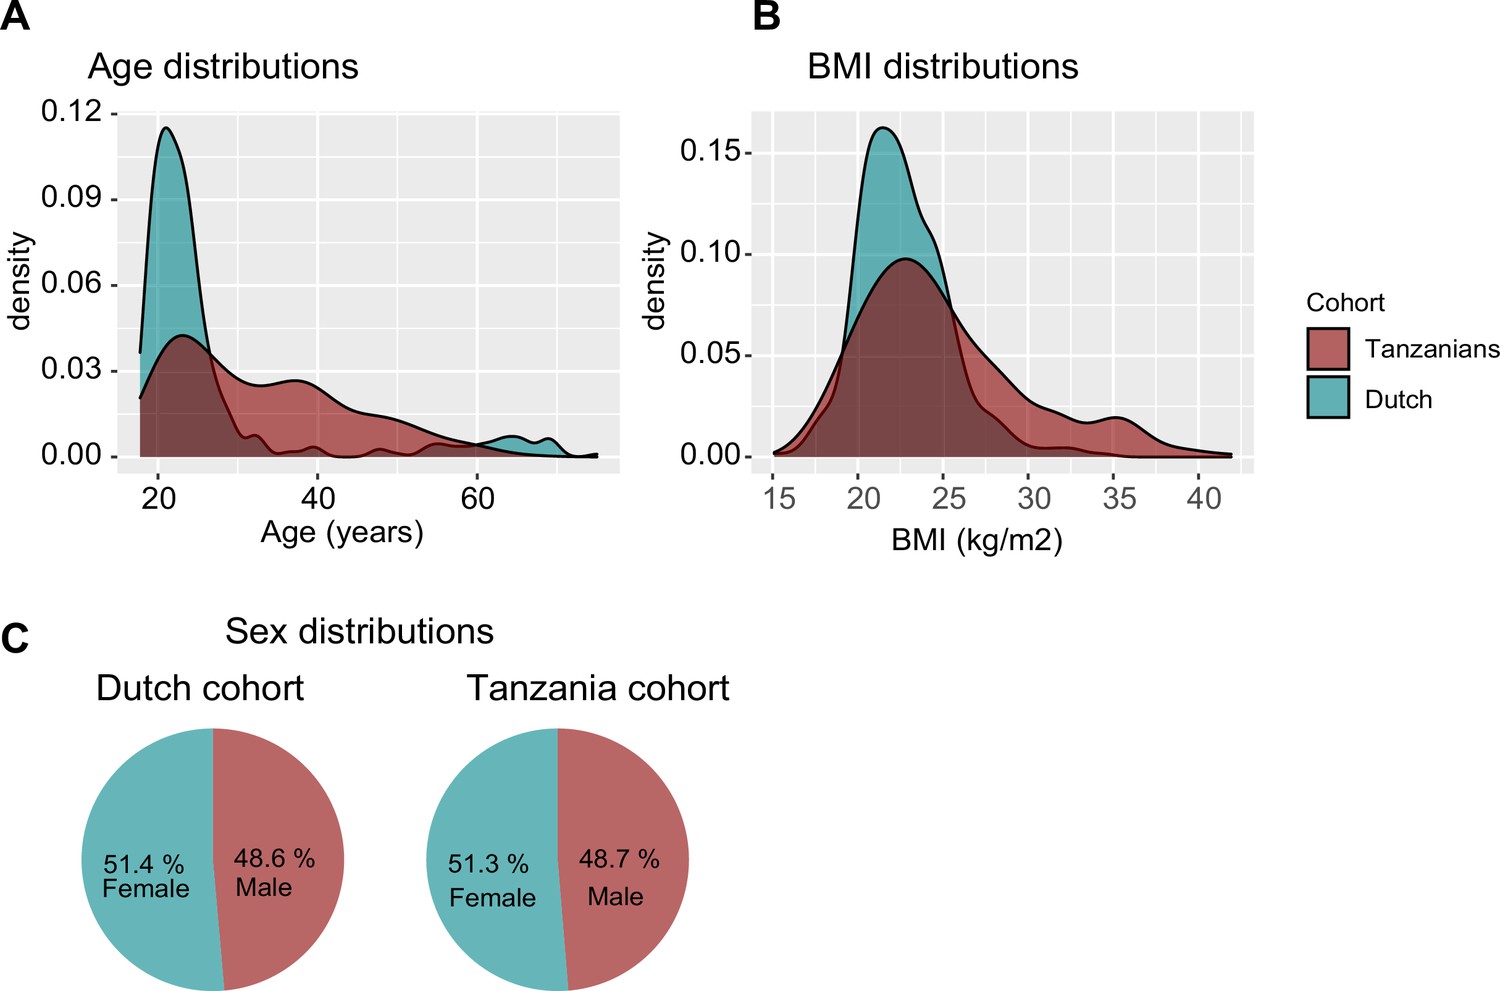
Histograms and pie charts showing the distribution of cohorts characteristics comparing Tanzanian and Dutch samples.
Histograms (A) and (B) show the age and BMI distributions of Tanzanians and Dutch subjects, respectively A pie chart comparing the gender distributions of Tanzanians and the Dutch cohort. This figure is related to the data displayed on Table 1.
Figure 1—figure supplement 2
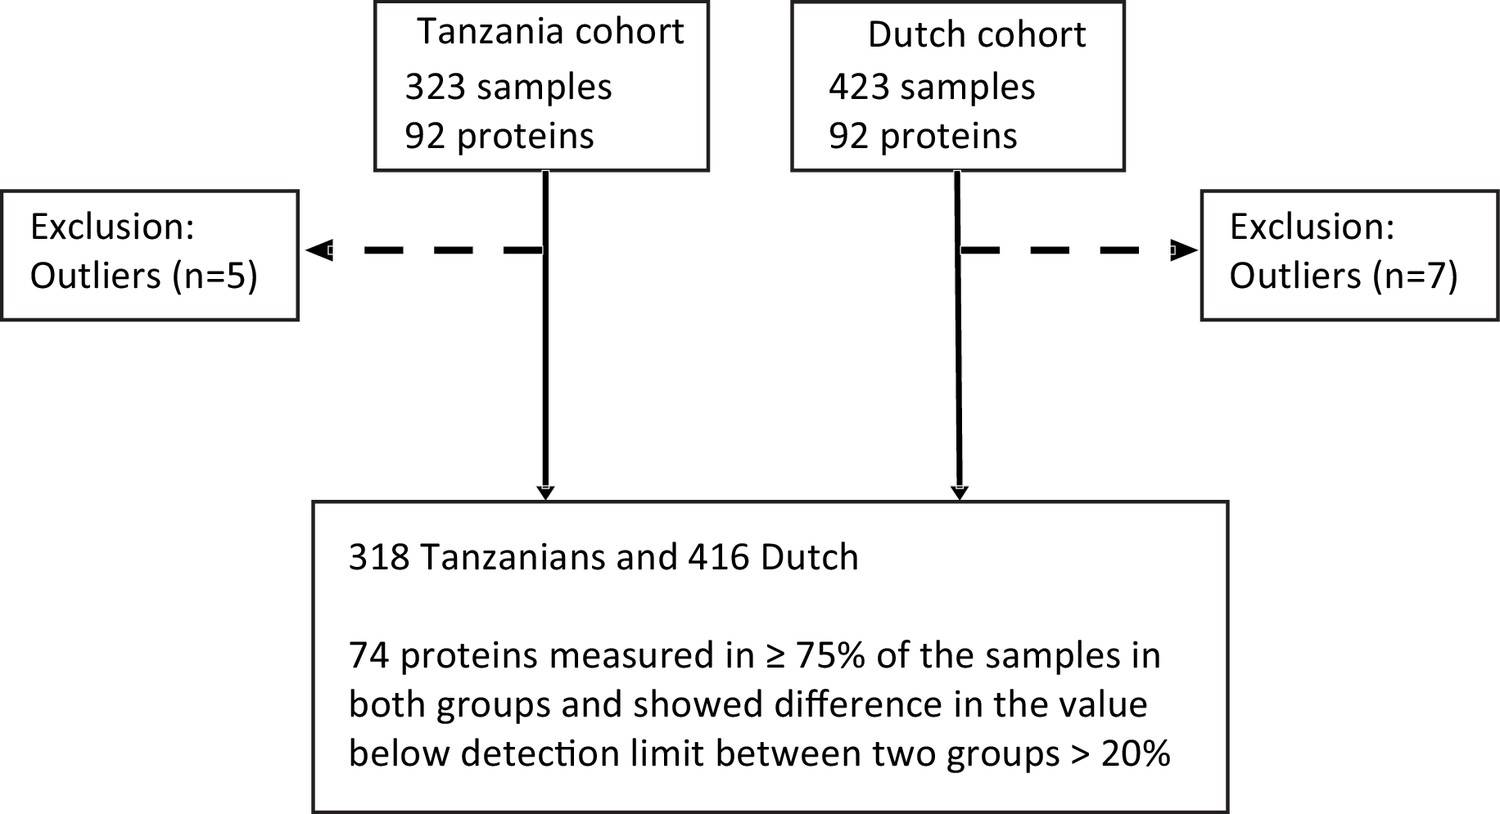
Schematic diagram showing the sample pre-processing according to the measured inflammatory protein in both cohorts.
Figure 1—figure supplement 3
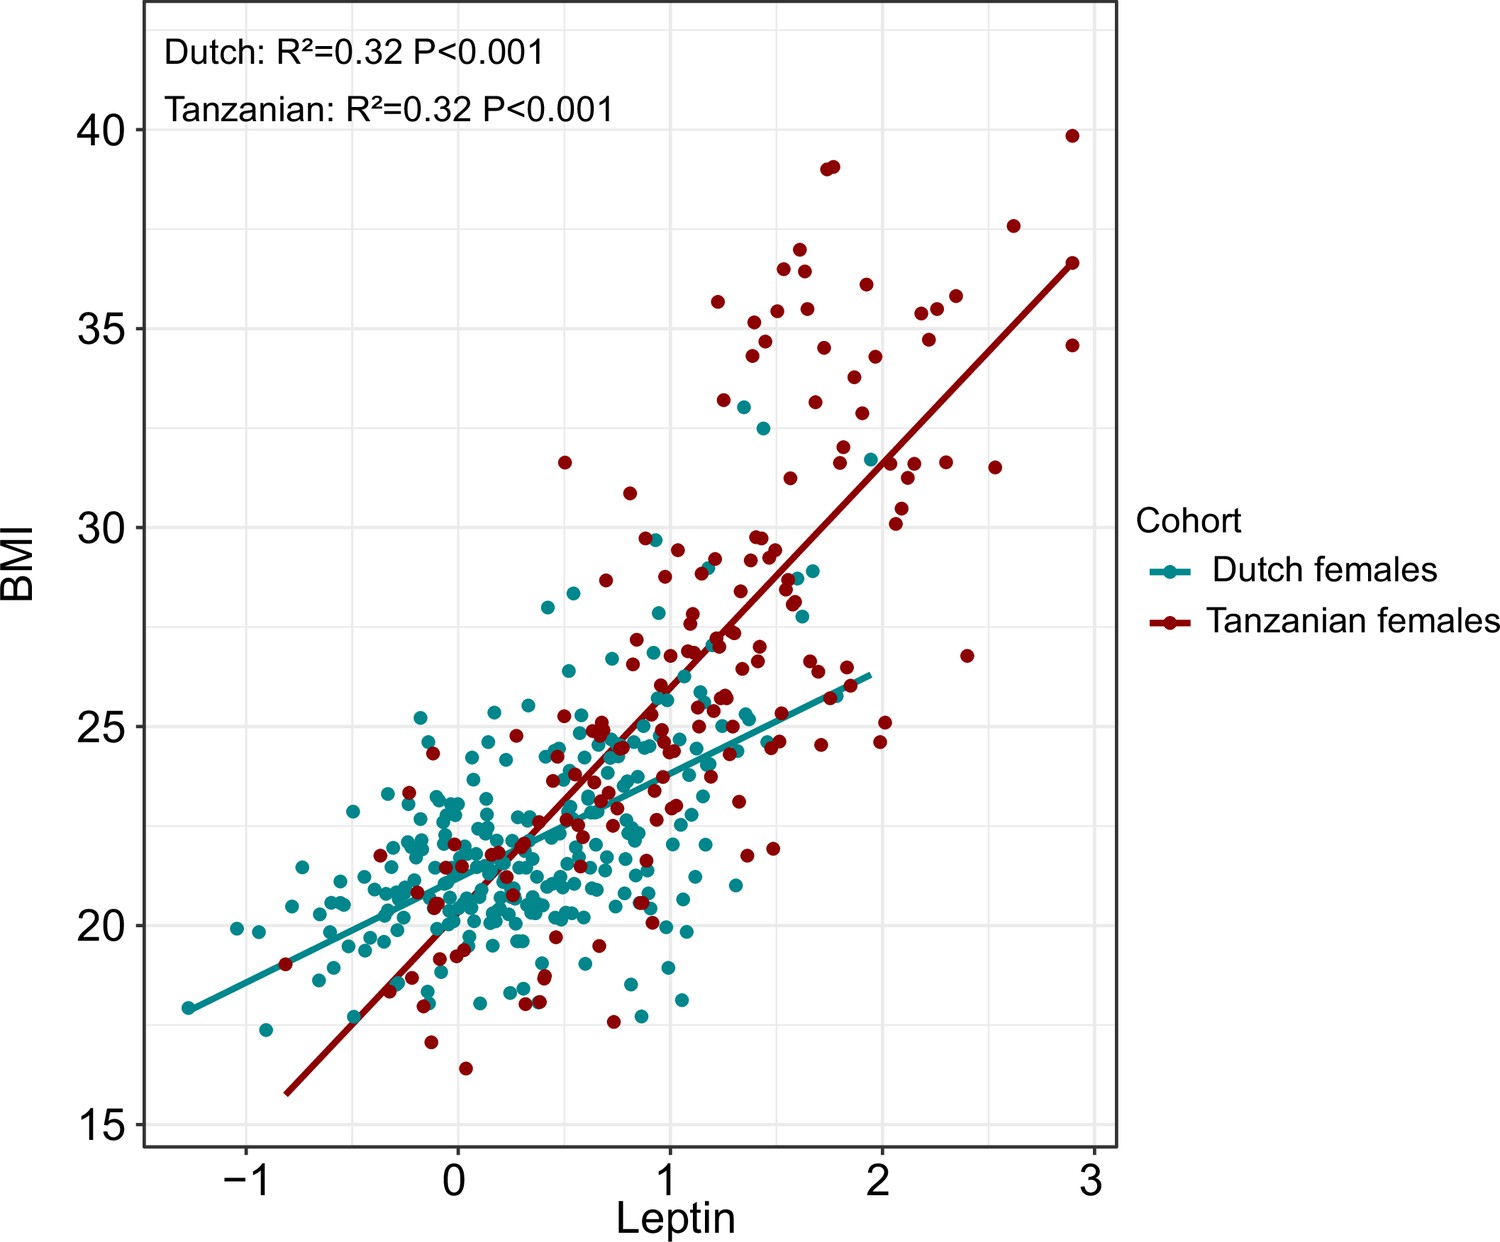
Scatter plot showing the association of plasma concentration of leptin with BMI in Tanzanian females compared to Dutch females.
The comparison was performed using linear regression (unadjusted) on the inversed ranked based values of leptin concentration.
Figure 2

Associations of age, BMI, sex and seasonality with inflammatory proteins in Dutch and Tanzanian participants.
(A) Heat map illustrating the regression beta-coefficient of plasma inflammatory proteins with host and environmental factors in the Dutch and Tanzanian cohorts. Red and turquoise indicate higher and lower concentrations of inflammatory proteins associated with seasonality, higher BMI, female sex, and advanced age in the Dutch cohort, and with urban living, rainy season, higher BMI, female sex, and advanced age in the Tanzanian cohort, respectively. p-Values of the significant associations are depicted, and the results were declared significant after correcting for multiple testing using the False discovered rate (FDR); p-value <0.05(*), <0.005(**), and <0.0001(***). (B) Four-quadrant plot depicting the association between the inflammatory protein expression with either age, sex, or BMI in the Dutch and Tanzania cohorts related to panel A.
Figure 3 with 1 supplement
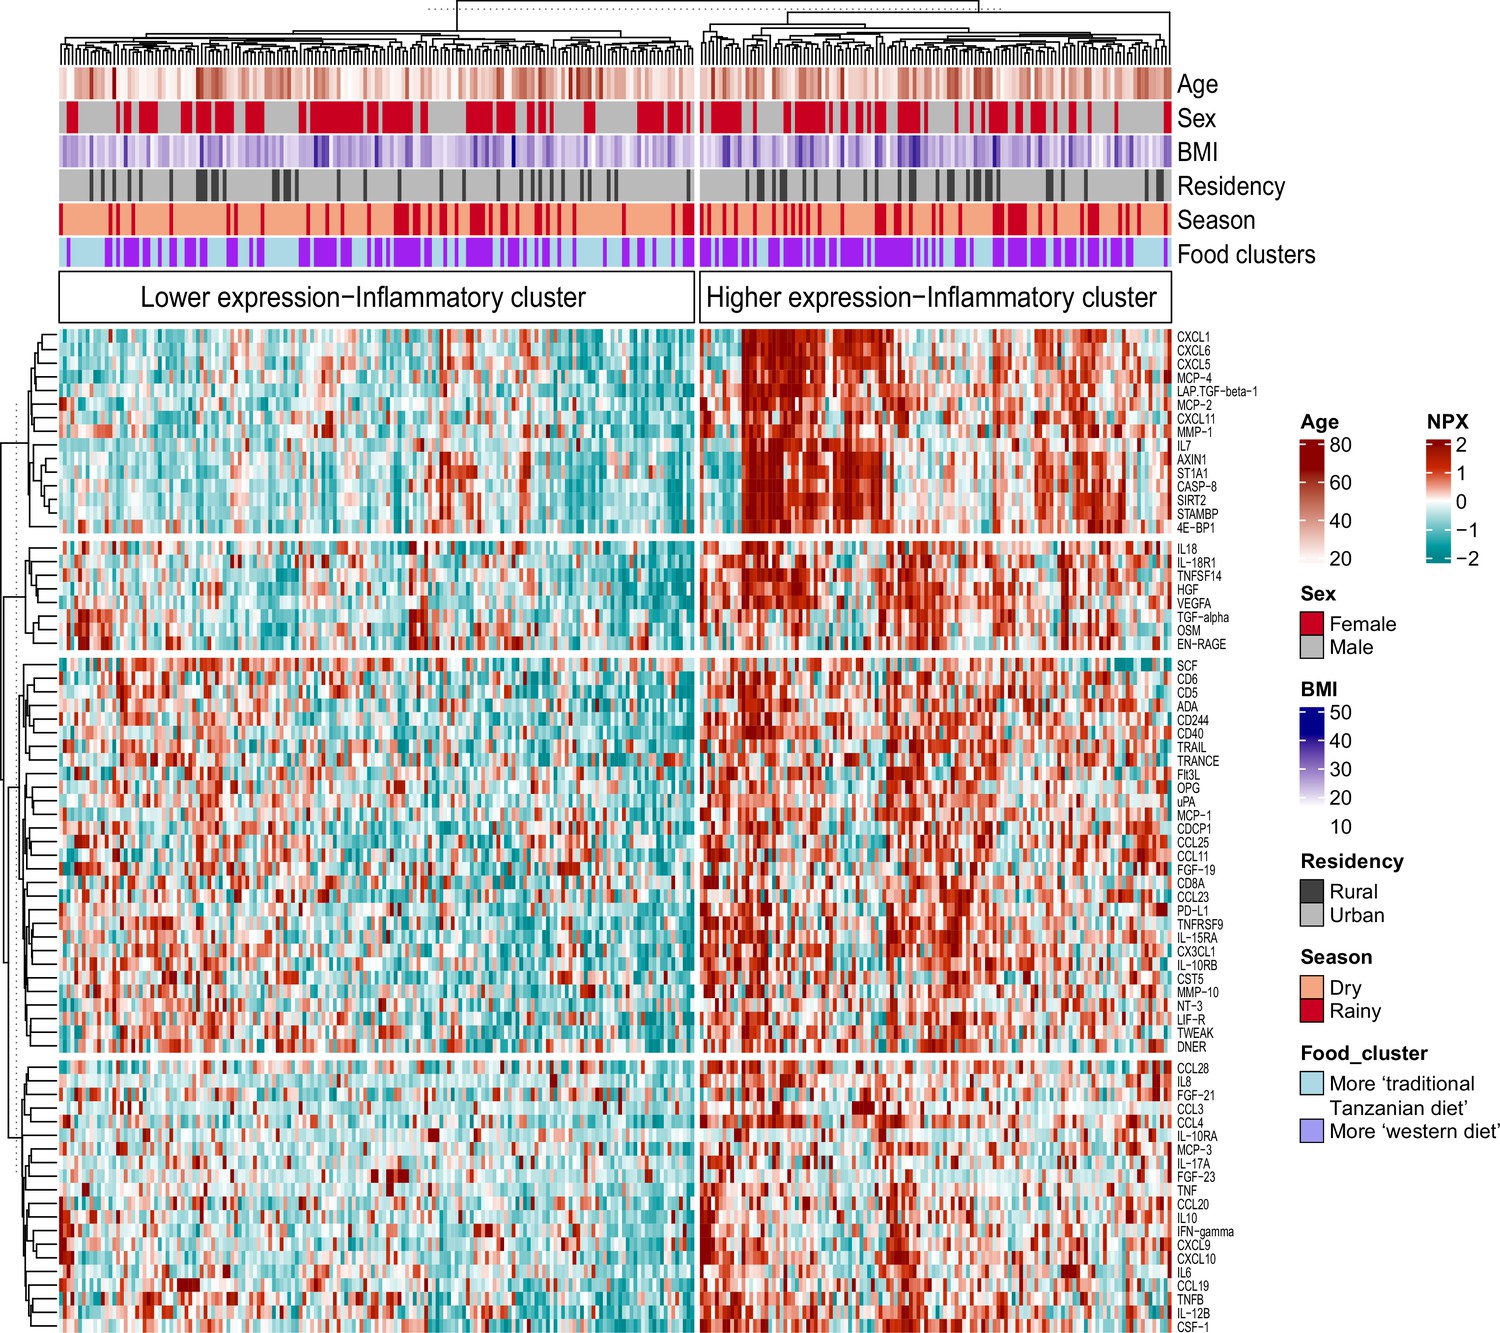
Associations between food-derived plasma metabolites and inflammation-associated proteins.
Unsupervised k-means clustering of individuals from the Tanzanian cohort (N=318) according to the inflammatory proteins (N=72 inflammatory proteins). Data are shown as normalized protein expression (NPX). The color code indicates the relative expression of the inflammatory protein across the samples of the two compared groups. Dark red and turquoise colors indicate higher and lower expression, respectively. Presented are annotations for age, sex, BMI, seasonality, geographical location (i.e. rural vs. urban) and food-derived metabolite cluster. Abbreviations: NXP; normalized protein expression; BMI; body mass index.
Figure 3—figure supplement 1

Food-metabolome clusters and their associations with weekly food consumption within the Tanzanian cohort.
(A) Heat map displaying unsupervised k-means clustering of individuals from the Tanzanian cohort (N=318) based on food-derived metabolites (N=298 food-derived metabolites). Food-derived metabolites from the untargeted plasma metabolome were clustered, which yielded two clusters (traditional Tanzanian food cluster and Western diet food cluster). Red and blue colors indicate higher and lower metabolite intensity, respectively. Presented are annotations for age, sex, BMI, and seasonality. (B) Weekly food consumption of various foods across both metabolic clusters. Differences in food consumption frequency categories were tested using the chi-squared test. The colors red and blue represent higher and lower weekly consumption frequencies of specific foods, respectively; p-values <0.05 (*), <0.005 (**). BMI, body mass index.
Figure 4
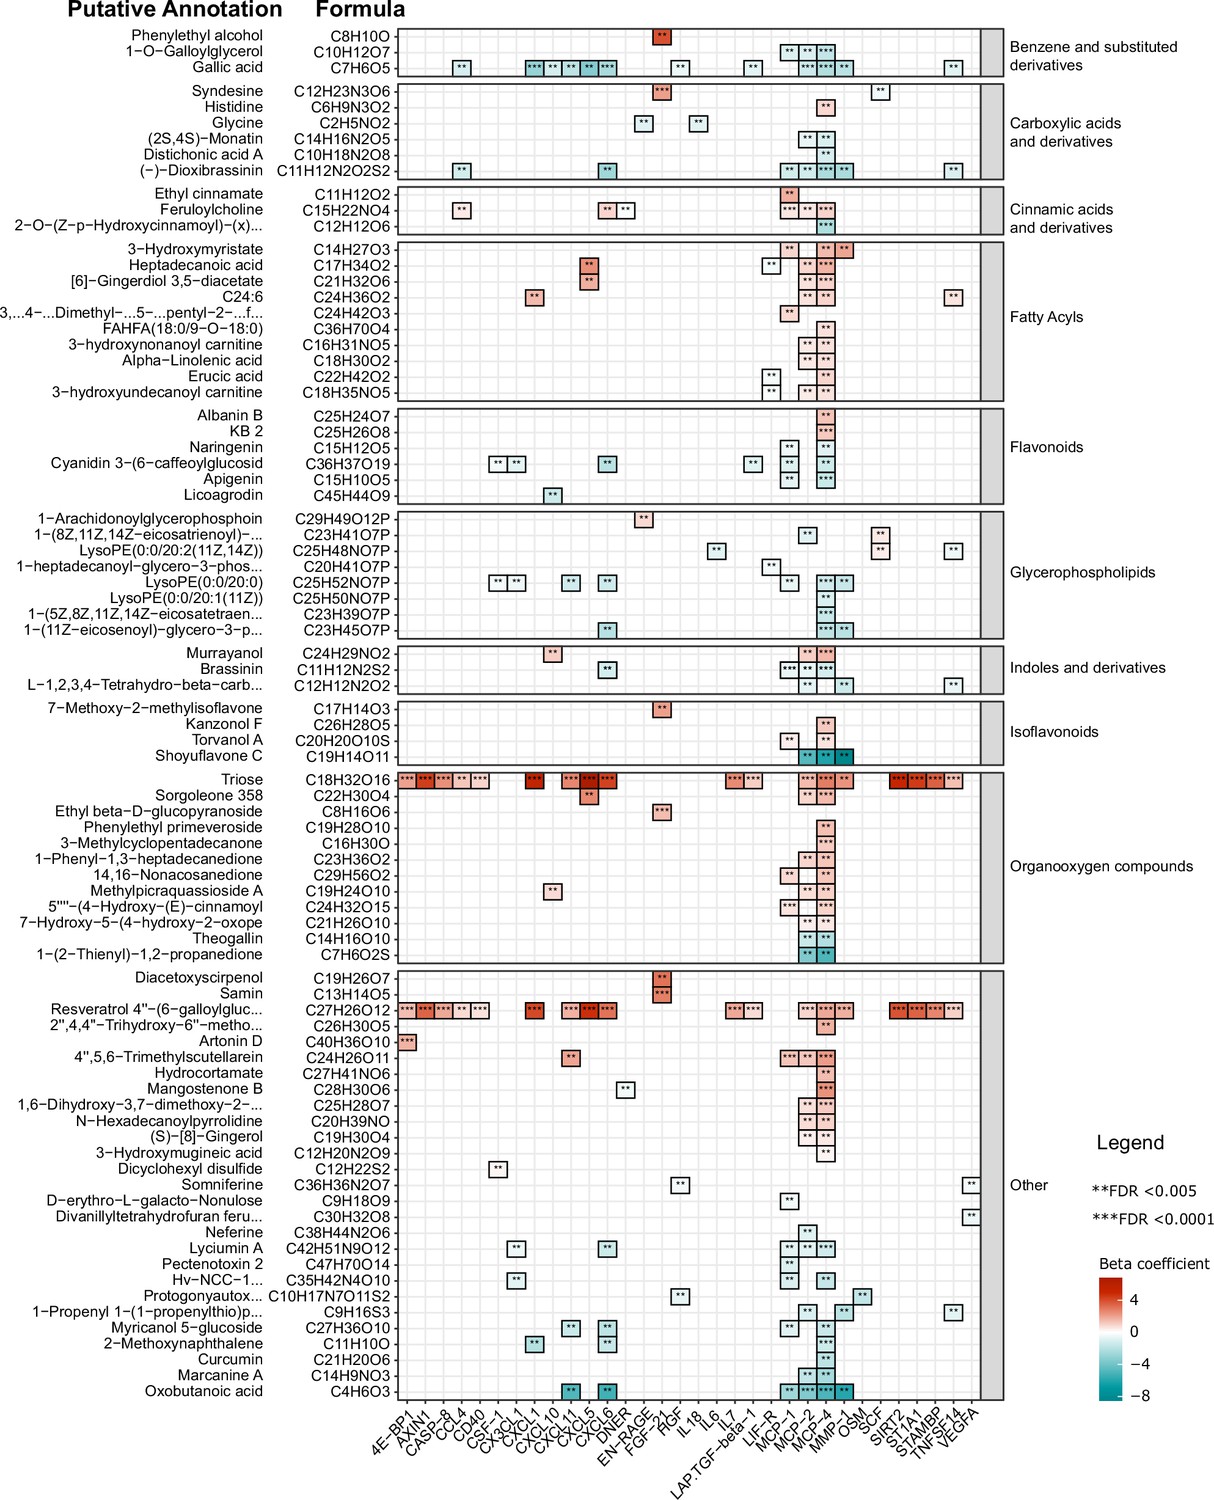
Association between inflammatory proteins and food-derived metabolites in the Tanzanian cohort.
The heat map illustrates the associations between inflammatory proteins and food-derived metabolites in Tanzanian participants. The left panel displays the formulas obtained from accurate mass and natural abundance isotopic mass spectrometry data, along with the putative annotated food-derived metabolites. The β coefficients of the multiple linear regression model, including age and sex as covariates, are shown in the heat map using red and turquoise colors to indicate positive and negative correlations, respectively. Significance was determined after correcting for multiple testing using False Discovery Rate (FDR); p-value <0.05(*),<0.005(**), and <0.0001(***).
Tables
Table 1
Descriptive characteristics of study participants.
| Tanzanians | Dutch | p-value | |
|---|---|---|---|
| Number | 318 | 416 | |
| Sex, females | 163 (51.3) | 214 (51.4) | ns |
| Age, years | 30 (23–40) | 23 (21–26) | <0.0001 |
| Age category | <0.0001 | ||
| 18–30 years | 155 (48.7) | 351 (85.8) | |
| 31–40 years | 84 (26.4) | 15 (3.7) | |
| 41–50 years | 50 (15.7) | 4 (1.0) | |
| 50–60 years | 25 (7.9) | 13 (3.2) | |
| ≥60 years | 4 (1.3) | 26 (6.4) | |
| BMI | 23.8 (21.4–27.3) | 22.3 (20.7–24.3) | <0.0001 |
| BMI category | <0.0001 | ||
| ≤24.9 | 194 (61.0) | 337 (84.0) | |
| ≥25–29.9 | 76 (23.9) | 57 (14.2) | |
| ≥30 | 48 (15.1) | 7 (1.7) | |
| BMI by sex | |||
| Male | 22.8 (20.8–24.9) | 23 (21.7–24.6) | ns |
| Female | 25.7 (22.6–29.9) | 21.5 (20.4–23.1) | <0.0001 |
| Smoking (N, %) | 50 (15.7) | 57 (13.7) | ns |
| Study characteristics only relevant for the Tanzanian cohort | |||
| Residency (N, %) | |||
| Urban | 250 (78.6) | ||
| Rural | 68 (21.4) | ||
| Highest level of education (N, %) | |||
| Primary | 119 (37.4) | ||
| Secondary | 69 (21.7) | ||
| College | 61 (19.2) | ||
| University | 25 (7.9) | ||
| In training | 44 (13.8) | ||
| Occupational status (N, %) | |||
| Student | 57 (17.9) | ||
| Employed with qualification | 66 (20.8) | ||
| Service or shop sales worker | 133 (41.8) | ||
| Elementary occupation | 62 (19.5) | ||
| Toilet facility (N, %) | |||
| Pit latrine | 75 (23.6) | ||
| Water closet | 243 (76.4) | ||
| Cooking fuel (N, %)* | |||
| Smoky | 113 (35.5) | ||
| Non-smoky | 205 (64.5) | ||
| Exposure to animals, yes (N, %) | 138 (43.4) | ||
| The course of antibiotics in the past year (N, %) | |||
| 1–3 courses | 164 (50.8) | ||
| >3 courses | 28 (8.7) | ||
| None | 131 (40.6) | ||
| Last time antibiotic use (N, %) | |||
| 3–6 months ago | 44 (13.6) | ||
| 6–12 months ago | 65 (20.1) | ||
| 12 months ago, | 83 (25.7) | ||
| None | 131 (40.6) | ||
| Access to clean water (N, %) | |||
| Tap water | 314 (97.2) | ||
| Well, canal or river water | 9 (2.8) | ||
-
Comparison between characteristics of the Tanzanian and the Dutch participants was done using Chi-square and, Mann-Whitney U tests; for categorical and continuous variables respectively.
-
*
categories of cooking fuel include firewood, charcoal or kerosene (smoky), or gas and electrical (non-smoky).
Additional files
-
Supplementary file 1
The table shows the top SNPs that were independently associated with ex vivo cytokine (Boahen et al., 2022) and its correlation with the 74 inflammatory proteins measured in the same cohort.
P- value unadjusted.
- https://cdn.elifesciences.org/articles/82297/elife-82297-supp1-v2.docx
-
Supplementary file 2
The table summarizes the analyzed data on the differentially expressed inflammatory protein among Dutch and Tanzanian participants.
This table relates to the data displayed in Figure 1.
- https://cdn.elifesciences.org/articles/82297/elife-82297-supp2-v2.xlsx
-
Supplementary file 3
The table shows the analyzed data on the associations between food-derived plasma metabolites and inflammation-associated proteins.
This table is related to the data displayed in Figure 3.
- https://cdn.elifesciences.org/articles/82297/elife-82297-supp3-v2.xlsx
-
Supplementary file 4
The table displays data from the multivariate linear regression analysis between metabolites and protein expression concentrations in the Tanzanian cohort.
This table is related to the data presented in Figure 4.
- https://cdn.elifesciences.org/articles/82297/elife-82297-supp4-v2.xlsx
-
MDAR checklist
- https://cdn.elifesciences.org/articles/82297/elife-82297-mdarchecklist1-v2.pdf
-
Source data 1
Normalized protein expression (NPX) units (log2) of the inflammatory proteins in the Tanzanian and Dutch participants.
- https://cdn.elifesciences.org/articles/82297/elife-82297-data1-v2.xlsx
Download links
A two-part list of links to download the article, or parts of the article, in various formats.
Downloads (link to download the article as PDF)
Open citations (links to open the citations from this article in various online reference manager services)
Cite this article (links to download the citations from this article in formats compatible with various reference manager tools)
Differences in the inflammatory proteome of East African and Western European adults and associations with environmental and dietary factors
eLife 12:e82297.
https://doi.org/10.7554/eLife.82297


