Phenome-wide Mendelian randomisation analysis identifies causal factors for age-related macular degeneration
- Division of Evolution, Infection and Genomics, School of Biological Sciences, Faculty of Biology, Medicine and Health, University of Manchester, United Kingdom
- Manchester Royal Eye Hospital, Manchester University NHS Foundation Trust, United Kingdom
- Department of Neuroscience, Sheffield Institute for Translational Neuroscience (SITraN), University of Sheffield, United Kingdom
- Statistical Genetics, QIMR Berghofer Medical Research Institute, Australia
- Centre for Biostatistics, Division of Population Health, Health Services Research and Primary Care, School of Health Sciences, Faculty of Biology, Medicine and Health, University of Manchester, United Kingdom
- Division of Pharmacy and Optometry, Faculty of Biology, Medicine and Health, School of Health Sciences, University of Manchester, United Kingdom
- MRC Integrative Epidemiology Unit, University of Bristol, United Kingdom
- Manchester Centre for Genomic Medicine, Saint Mary’s Hospital, Manchester University NHS Foundation Trust, United Kingdom
- European Molecular Biology Laboratory, European Bioinformatics Institute (EMBL-EBI), Wellcome Genome Campus, United Kingdom
Figures
Figure 1
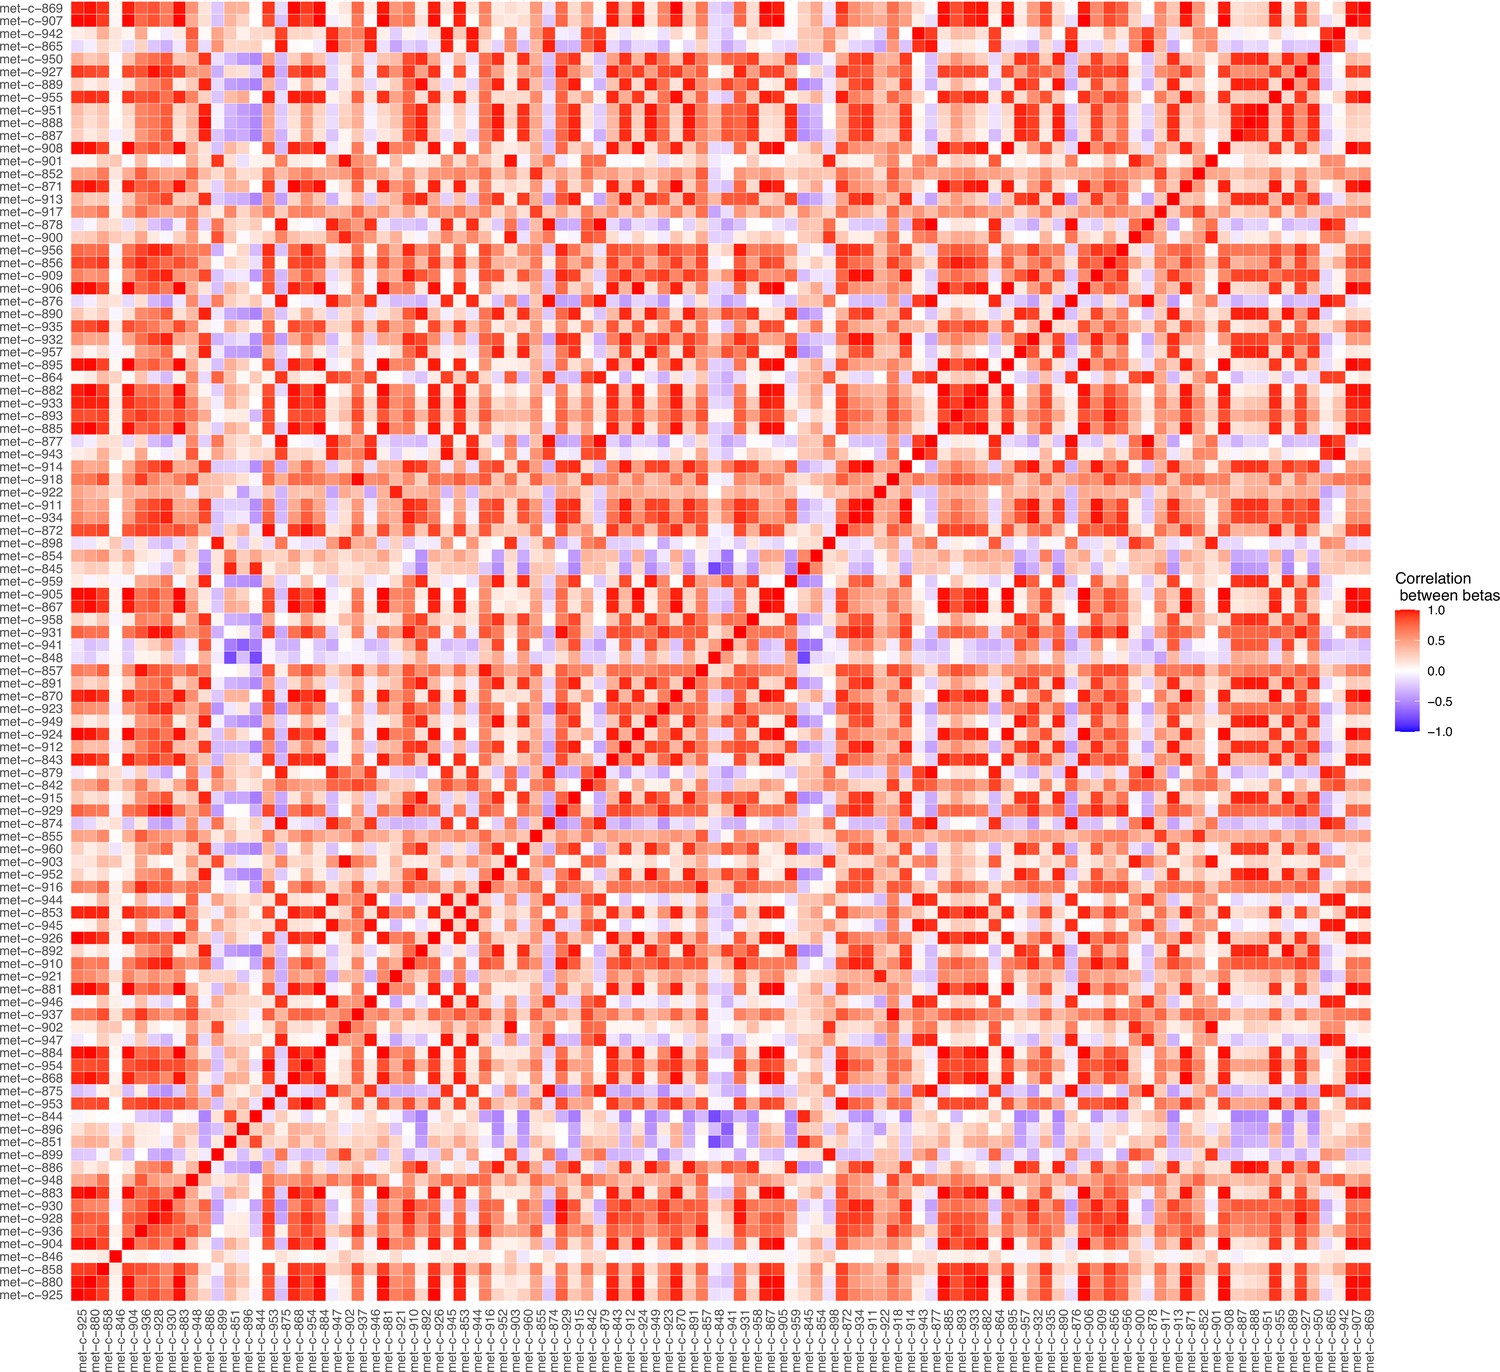
Plot illustrating the correlations between the beta values for the metabolites considered in our Mendelian randomisation Bayesian model averaging (MR-BMA) analysis for early age-related macular degeneration (AMD).
This plot visually represents the correlation matrix between the genetic associations of the exposure variables with respect to their instruments. The traits are labelled according to their ‘Trait ID’; further information can be found in the Source data 1.
Figure 2
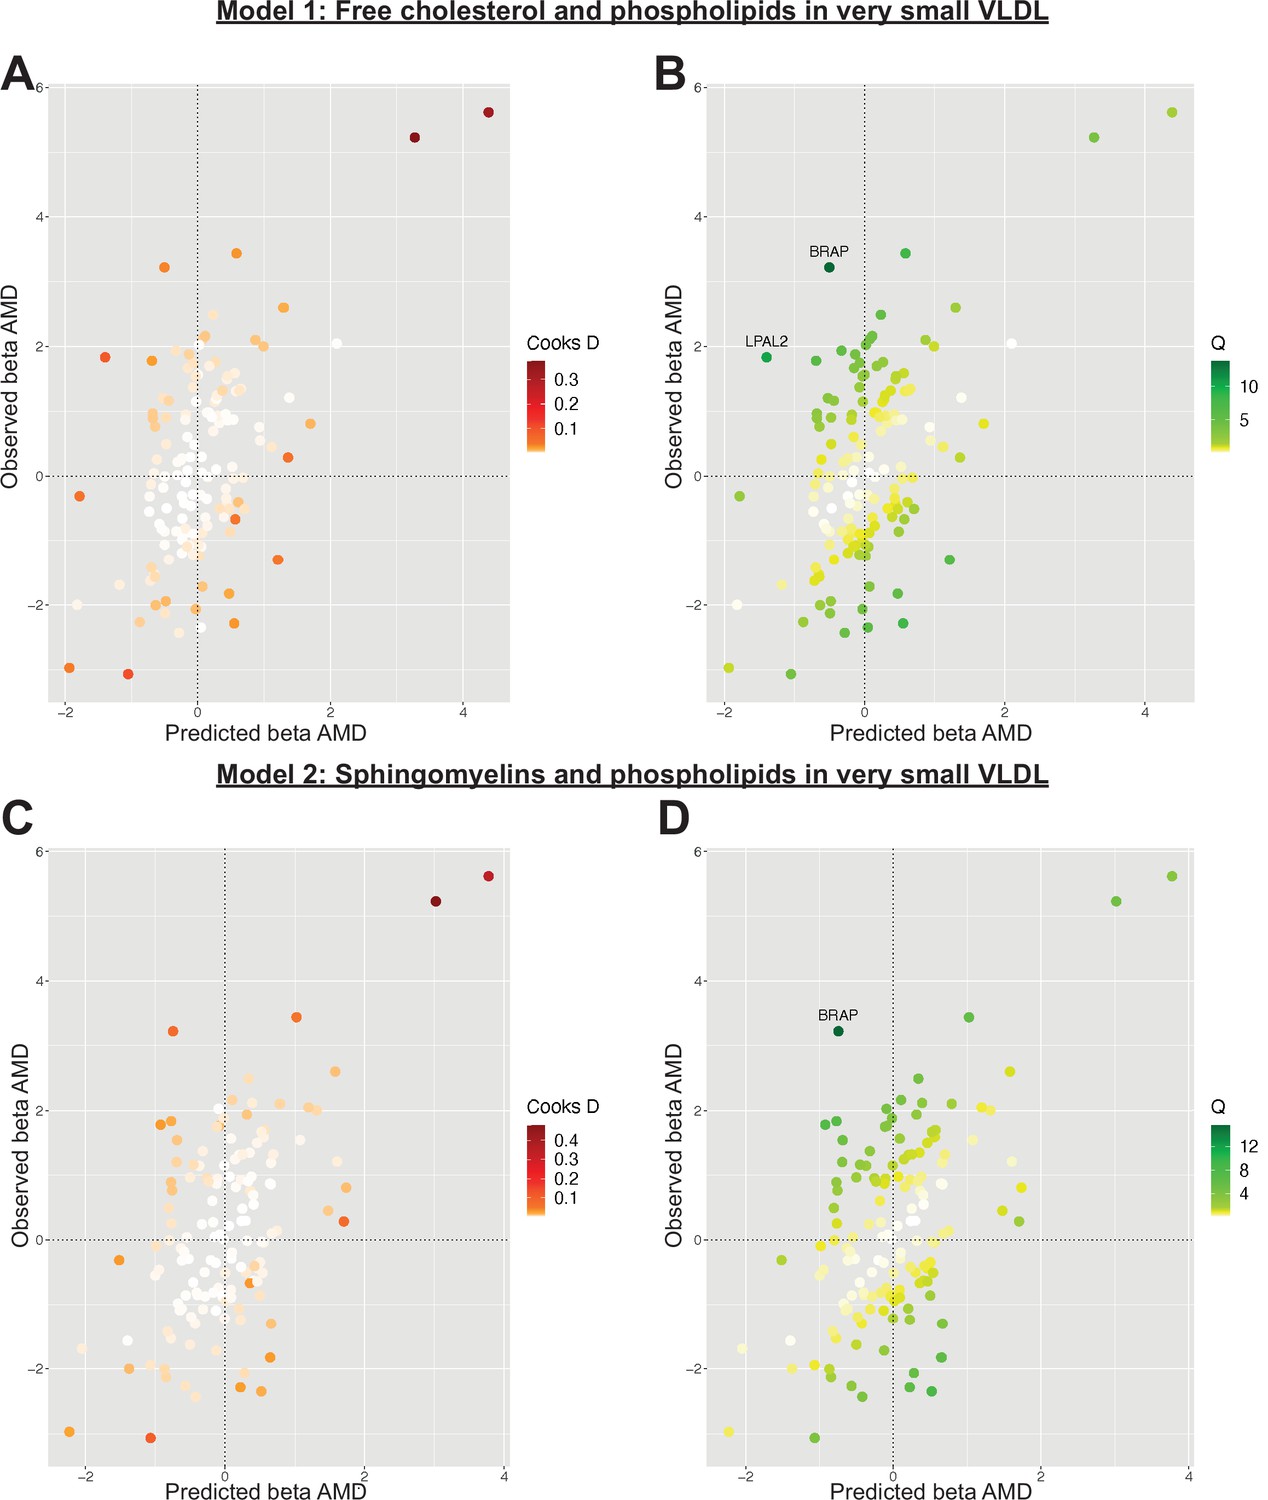
Plots outlining the top-ranking models with respect to their posterior probability in the first run of Mendelian randomisation Bayesian model averaging (MR-BMA) of lipid-related traits in early age-related macular degeneration (AMD).
Plots (A) and (C) present Cook’s distance while plots (B) and (D) present Cochran’s Q. Outlier instruments are annotated. The Cochran’s Q is a measure which serves to identify outlier variants with respect to the fit of the linear model. The Q-statistic is used to identify heterogeneity in a meta-analysis, and to pinpoint specific variants as outliers. The contribution of variants to the overall Q-statistic is measured (defined as the weighted squared difference between the observed and predicted association with the outcome) in order to identify outliers. Cook’s distance on the other hand is utilised to identify influential observations (i.e. those variants which have a strong association with the outcome). Such variants are removed from the analysis because they may have an undue influence over variable selection, leading to models which fit that variant well but others poorly.
Figure 3

Graph detailing the results of a Mendelian randomisation Bayesian model averaging (MR-BMA) analysis that aims to identify causal lipid-related risk factors for early age-related macular degeneration (AMD).
The studied phenotypes are ranked according to their marginal inclusion probability (MIP); four likely causal traits are highlighted.
Tables
Table 1
Significant results detected in a phenome-wide univariable Mendelian randomisation (MR) analysis of early age-related macular degeneration (AMD).
Only traits passing the conservative quality control criteria described in the methods are listed.
| Trait name | Odds ratio | FDR-adjusted IVW p value | MRE IVW beta |
|---|---|---|---|
| Rheumatoid arthritis | NA | 1.51E−06 | 0.08 |
| Unswitched memory B cell % B cell | 1.11 | 5.40E−05 | 0.10 |
| CD62L− dendritic cell % dendritic cell | 0.95 | 3.32E−02 | −0.05 |
| Effector memory CD8+ T cell absolute count | 1.08 | 1.79E−04 | 0.07 |
| CD25 on IgD+CD38− naive B cell | 0.93 | 1.25E−04 | −0.07 |
| CD80 on plasmacytoid dendritic cell | 0.96 | 1.63E−02 | −0.04 |
| Total cholesterol in IDL* | 0.80 | 6.48E−08 | −0.22 |
| Free cholesterol in IDL* | 0.80 | 5.51E−08 | −0.22 |
| Total lipids in IDL* | 0.79 | 3.35E−09 | −0.23 |
| Concentration of IDL particles* | 0.80 | 9.83E−09 | −0.23 |
| Phospholipids in IDL* | 0.79 | 1.86E−09 | −0.23 |
| Triglycerides in IDL* | 0.84 | 2.40E−07 | −0.18 |
| Total cholesterol in large LDL* | 0.83 | 9.85E−08 | −0.19 |
| Cholesterol esters in large VLDL* | 0.83 | 1.41E−07 | −0.19 |
| Free cholesterol in large LDL* | 0.83 | 7.07E−07 | −0.18 |
| Total lipids in large LDL* | 0.83 | 1.04E−07 | −0.19 |
| Concentration of large LDL particles* | 0.83 | 2.40E−07 | −0.19 |
| Phospholipids in large LDL* | 0.83 | 1.33E−06 | −0.18 |
| Cholesterol esters in large VLDL* | 0.82 | 6.55E−03 | −0.20 |
| 18:2 linoleic acid (LA)* | 0.80 | 2.93E−07 | −0.23 |
| Total cholesterol in LDL* | 0.82 | 4.46E−08 | −0.19 |
| Total cholesterol in medium LDL* | 0.82 | 3.64E−09 | −0.20 |
| Cholesterol esters in medium LDL* | 0.82 | 5.93E−09 | −0.20 |
| Total lipids in medium LDL* | 0.81 | 3.35E−09 | −0.21 |
| Concentration of medium LDL particles* | 0.81 | 3.64E−09 | −0.21 |
| Phospholipids in medium LDL* | 0.81 | 1.86E−09 | −0.21 |
| Total cholesterol in small LDL* | 0.81 | 9.85E−08 | −0.21 |
| Total lipids in small LDL* | 0.81 | 2.65E−07 | −0.21 |
| Total cholesterol in small VLDL* | 0.85 | 2.54E−02 | −0.16 |
| Serum total cholesterol* | 0.77 | 3.67E−08 | −0.26 |
| Total phosphoglycerides* | 0.81 | 3.93E−03 | −0.21 |
| Triglycerides in very large HDL* | 0.87 | 4.37E−04 | −0.14 |
| Total lipids in very small VLDL* | 0.84 | 1.97E−03 | −0.18 |
| Concentration of very small VLDL particles* | 0.84 | 9.04E−04 | −0.18 |
| Phospholipids in very small VLDL* | 0.83 | 3.63E−03 | −0.19 |
| Interferon alpha-10 | 1.14 | 1.83E−02 | 0.13 |
| Protein S100-A5 | 1.07 | 6.94E−04 | 0.07 |
| Serine palmitoyltransferase 2 | 0.86 | 3.17E−02 | −0.15 |
| CD59 glycoprotein | 1.10 | 1.77E−03 | 0.09 |
| Complement factor H-related protein 5 | 1.09 | 9.30E−05 | 0.09 |
| Cathepsin F | 1.10 | 4.44E−03 | 0.10 |
| Benign neoplasm: skin, unspecified | NA | 8.23E−03 | 0.07 |
| Psychiatric diseases | NA | 8.54E−05 | −0.43 |
| Myotonic disorders | NA | 2.32E−02 | 0.00 |
-
FDR, false discovery rate; IVW, inverse variance weighted; MRE, multiplicative random effects; %, as a proportion of; NA, not applicable (as exposure traits of binary nature do not produce accurate odds ratios; beta values can be used instead to infer direction of effect but not necessarily magnitude).
-
*
These traits (trait ID group ‘met-c’ in Source data 1) had 1.9% sample overlap with the early AMD dataset, a minor degree of overlap which is unlikely to bias results; the remaining causal traits had no sample overlap with early AMD.
Table 2
Lead causal traits identified by Mendelian randomisation Bayesian model averaging (MR-BMA) of lipid-related phenotypes in early age-related macular degeneration (AMD) ranked according to their marginal inclusion probability (MIP).
| Rank | Risk factor (trait ID) | MIP | Average effect | Nominal p-value | FDR-adjusted p-value |
|---|---|---|---|---|---|
| 1 | Sphingomyelins (met-c-935) | 0.76 | 0.30 | 2.40E−04 | 5.76E−03 |
| 2 | Phospholipids in very small VLDL (met-c-955) | 0.63 | −0.31 | 1.00E−05 | 7.20E−04 |
| 3 | Triglycerides in IDL (met-c-872) | 0.32 | −0.16 | 2.10E−04 | 5.76E−03 |
| 4 | Free cholesterol (met-c-858) | 0.20 | 0.07 | 2.83E−03 | 5.09E−02 |
| 5 | Omega-3 fatty acids (met-c-855) | 0.07 | 0.01 | 3.70E−02 | 2.34E−01 |
| 6 | Free cholesterol in very large HDL (met-c-944) | 0.07 | 0.01 | 2.74E−02 | 2.34E−01 |
| 7 | Total lipids in very small VLDL (met-c-953) | 0.06 | −0.02 | 2.08E−02 | 2.34E−01 |
| 8 | Cholesterol esters in medium VLDL (met-c-910) | 0.05 | 0.01 | 3.66E−02 | 2.34E−01 |
| 9 | Cholesterol esters in very large HDL (met-c-943) | 0.05 | 0.01 | 4.87E−02 | 2.34E−01 |
| 10 | Ratio of bisallylic groups to double bonds (met-c-844) | 0.05 | 0.01 | 4.41E−02 | 2.34E−01 |
Additional files
Download links
A two-part list of links to download the article, or parts of the article, in various formats.
Downloads (link to download the article as PDF)
Open citations (links to open the citations from this article in various online reference manager services)
Cite this article (links to download the citations from this article in formats compatible with various reference manager tools)
Phenome-wide Mendelian randomisation analysis identifies causal factors for age-related macular degeneration
eLife 12:e82546.
https://doi.org/10.7554/eLife.82546


