Polygenic risk scores for the prediction of common cancers in East Asians: A population-based prospective cohort study
- Genome Institute of Singapore (GIS), Agency for Science, Technology and Research (A*STAR), Singapore
- Saw Swee Hock School of Public Health, National University of Singapore and National University Health System, Singapore
- Department of Surgery, Yong Loo Lin School of Medicine, National University of Singapore, Singapore
- Program in Cancer and Stem Cell Biology, Duke-National University of Singapore Medical School, Singapore
- Division of Medical Oncology, National Cancer Centre Singapore, Singapore
- Duke-NUS Medical School Singapore, Singapore
- UPMC Hillman Cancer Center, United States
- Department of Epidemiology, University of Pittsburgh Graduate School of Public Health, United States
- Healthy Longevity Translational Research Programme; Yong Loo Lin School of Medicine, National University of Singapore, Singapore
- Singapore Institute for Clinical Sciences, Agency for Science Technology and Research (A*STAR), Singapore
Figures
Figure 1

Site-specific polygenic risk scores (PRSs) performance assessment.
(A) Distribution, (B) discrimination, (C) absolute risk association, and (D) calibration for each of the four common cancers studied (from left to right: breast, prostate, lung [female], lung [male], colorectal [female], and colorectal [male]). Two-sided, two-sample t-tests with a type I error of 0.05 were used to examine whether there was a difference in the distribution of standardised PRS (subtraction of mean value followed by the division by the standard deviation) between site-specific cancer cases and non-cancer controls (A). The PRSs showcased are the best-performing scores based on area under the receiver operator characteristic curve (AUC) values in the female and male populations, (i) unadjusted [solid line], and (ii) adjusted for age at recruitment [dashed line] (B). Each colored line in the plots for absolute risk association denotes a five percentile increase in the standardised PRS score in (C). Calibration calculated based on 5-year absolute risk by PRS deciles in (D). A prediction tool is considered more accurate when the AUC is larger. An AUC of 0.9–1.0 is considered excellent, 0.8–0.9 very good, 0.7–0.8 good, 0.6–0.7 sufficient, 0.5–0.6 bad, and less than 0.5 considered not useful (PMID: 27683318).
-
Figure 1—source data 1
Tables on absolute risk for breast cancer.
- https://cdn.elifesciences.org/articles/82608/elife-82608-fig1-data1-v2.zip
-
Figure 1—source data 2
Tables on absolute risk for colorectal cancer.
- https://cdn.elifesciences.org/articles/82608/elife-82608-fig1-data2-v2.zip
-
Figure 1—source data 3
Tables on absolute risk for lung cancer.
- https://cdn.elifesciences.org/articles/82608/elife-82608-fig1-data3-v2.zip
-
Figure 1—source data 4
Tables on absolute risk for prostate cancer.
- https://cdn.elifesciences.org/articles/82608/elife-82608-fig1-data4-v2.zip
-
Figure 1—source data 5
Tables on polygenic risk scores (PRS) performance assessment.
- https://cdn.elifesciences.org/articles/82608/elife-82608-fig1-data5-v2.zip
Author response image 1
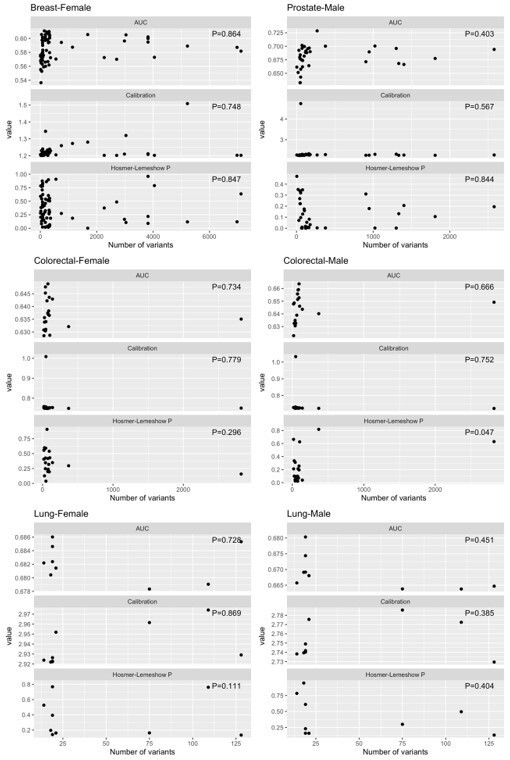
Distributions of AUC, calibration (expected/ observed), and Hosmer-Lemeshow p-values for features of performance, by cancer type.
Tables
Table 1
Demographics of our study population by gender and cancer site.
Demographics variables were collected using structured questionnaire at recruitment. Family history for lung cancer was not available. Information on cancer occurrence (number of cancer and age at cancer occurrence) was obtained through linkage with the Singapore Cancer Registry in December 2015. Follow-up time was calculated from age at recruitment. IQR: Interquartile range.
| Entire cohort | Individuals who developed cancer | ||||||||
|---|---|---|---|---|---|---|---|---|---|
| Breast | Prostate | Colorectal | Lung | ||||||
| All | Female | Male | Female | Male | Female | Male | Female | Male | |
| n | 21,694 | 12,084 | 9610 | 495 | 308 | 332 | 409 | 181 | 381 |
| Age at recruitment in years, median (IQR) | 54 (49–61) | 54 (48–60) | 55 (49–62) | 53 (48–59) | 59 (54–64) | 58 (52–64) | 59 (52–65) | 59 (55–64) | 60 (55–64) |
| Number of cancers developed | |||||||||
| 0 (did not develop cancer) | 19633 (90) | 11096 (92) | 8537 (89) | – | – | – | – | – | – |
| 1 | 2013 (9) | 968 (8) | 1045 (11) | 476 (96) | 293 (95) | 317 (95) | 387 (95) | 175 (97) | 362 (95) |
| 2 | 48 (0) | 20 (0) | 28 (0) | 19 (4) | 15 (5) | 15 (5) | 22 (5) | 6 (3) | 19 (5) |
| Age at diagnosis among individuals who develop cancer(s) (earliest age for those with multiple cancers) in years, median (IQR) | 70 (64–77) | 68 (62–76) | 72 (67–77) | 65 (59–70) | 72 (67–77) | 71 (64–78) | 71 (65–6) | 74 (66–79) | 74 (68–78) |
| Length of follow-up (longest follow-up for those with multiple cancers) in years, median (IQR) | 20 (18–22) | 20 (18–22) | 19 (17–21) | 11 (6–16) | 13 (9–17) | 13 (8–17) | 11 (7–16) | 14 (9–17) | 14 (10–17) |
| Dialect group (%) | |||||||||
| Hokkien | 10663 (49) | 6132 (51) | 4531 (47) | 260 (53) | 153 (50) | 185 (56) | 164 (40) | 95 (52) | 162 (43) |
| Cantonese | 11031 (51) | 5952 (49) | 5079 (53) | 235 (47) | 155 (50) | 147 (44) | 245 (60) | 86 (48) | 219 (57) |
| Highest education (%) | |||||||||
| No | 4629 (21) | 3878 (32) | 751 (8) | 128 (26) | 20 (6) | 123 (37) | 46 (11) | 85 (47) | 57 (15) |
| Primary level | 9760 (45) | 5082 (42) | 4678 (49) | 206 (42) | 146 (47) | 138 (42) | 232 (57) | 62 (34) | 228 (60) |
| Secondary or above | 7305 (34) | 3124 (26) | 4181 (44) | 161 (33) | 142 (46) | 71 (21) | 131 (32) | 34 (19) | 96 (25) |
| Body mass index in kg/m2, median (IQR) | 23 (21–25) | 23 (21–25) | 23 (21–25) | 23 (21–25) | 23 (21–25) | 23 (21–24) | 23 (21–25) | 23 (20–24) | 23 (20–24) |
| Smoking status (%) | |||||||||
| Never | 15553 (72) | 11235 (93) | 4318 (45) | 472 (95) | 166 (54) | 296 (89) | 153 (37) | 129 (71) | 63 (17) |
| Ex-smoker | 2374 (11) | 261 (2) | 2113 (22) | 8 (2) | 66 (21) | 14 (4) | 108 (26) | 9 (5) | 74 (19) |
| Current smoker | 3767 (17) | 588 (5) | 3179 (33) | 15 (3) | 76 (25) | 22 (7) | 148 (36) | 43 (24) | 244 (64) |
| Number of cigarettes smoked (%) | |||||||||
| Does not smoke | 15553 (72) | 11235 (93) | 4318 (45) | 472 (95) | 166 (54) | 296 (89) | 153 (37) | 129 (71) | 63 (17) |
| <12 | 2408 (11) | 581 (5) | 1827 (19) | 14 (3) | 54 (18) | 26 (8) | 85 (21) | 36 (20) | 81 (21) |
| 13–22 | 2344 (11) | 206 (2) | 2138 (22) | 6 (1) | 53 (17) | 9 (3) | 108 (26) | 15 (8) | 135 (35) |
| ≥23 | 1389 (6) | 62 (1) | 1327 (14) | 3 (1) | 35 (11) | 1 (0) | 63 (15) | 1 (1) | 102 (27) |
| Alcohol consumption (%) | |||||||||
| Never/ occasionally | 19079 (88) | 11506 (95) | 7573 (79) | 470 (95) | 253 (82) | 315 (95) | 303 (74) | 174 (96) | 296 (78) |
| Weekly | 1885 (9) | 437 (4) | 1448 (15) | 20 (4) | 44 (14) | 10 (3) | 66 (16) | 5 (3) | 49 (13) |
| Daily | 730 (3) | 141 (1) | 589 (6) | 5 (1) | 11 (4) | 7 (2) | 40 (10) | 2 (1) | 36 (9) |
| Moderate physical activity (%) | |||||||||
| No | 16584 (76) | 9446 (78) | 7138 (74) | 380 (77) | 208 (68) | 269 (81) | 295 (72) | 143 (79) | 294 (77) |
| 1–3 hr/week | 3274 (15) | 1679 (14) | 1595 (17) | 69 (14) | 62 (20) | 43 (13) | 68 (17) | 23 (13) | 53 (14) |
| ≥ 3 hr/week | 1836 (8) | 959 (8) | 877 (9) | 46 (9) | 38 (12) | 20 (6) | 46 (11) | 15 (8) | 34 (9) |
| Vigorous physical activity/ strenuous sports at least once a week (%) | |||||||||
| No | 18467 (85) | 11221 (93) | 7246 (75) | 452 (91) | 239 (78) | 311 (94) | 342 (84) | 175 (97) | 314 (82) |
| Yes | 3227 (15) | 863 (7) | 2364 (25) | 43 (9) | 69 (22) | 21 (6) | 67 (16) | 6 (3) | 67 (18) |
| Family history of any cancer in first-degree relatives (%) | |||||||||
| No | 18193 (84) | 10141 (84) | 8052 (84) | 404 (82) | 236 (77) | 281 (85) | 336 (82) | 165 (91) | 333 (87) |
| Yes | 3501 (16) | 1943 (16) | 1558 (16) | 91 (18) | 72 (23) | 51 (15) | 73 (18) | 16 (9) | 48 (13) |
Table 2
Hazard ratios (HR) and corresponding 95% confidence intervals (CI) associated with polygenic risk score quintiles (Q) compared to the population median, using the Cox proportional hazards model and censored at 20 years after recruitment.
Individuals were categorised into cancer-specific quintiles based on their cancer-specific polygenic risk score (PRS). All models were adjusted for age at recruitment.
| Cancer site – gender | Q1 | Q2 | Q3 | Q4 | Q5 |
|---|---|---|---|---|---|
| Breast – female | |||||
| Number of cases | 55 | 73 | 86 | 107 | 145 |
| HR (95% CI) | 0.61 (0.44–0.86) | 0.80 (0.59–1.09) | 1.00 (Referent) | 1.25 (0.94–1.66) | 1.64 (1.26–2.14) |
| Prostate – male | |||||
| Number of cases | 15 | 31 | 55 | 59 | 129 |
| HR (95% CI) | 0.28 (0.16–0.50) | 0.57 (0.37–0.88) | 1.00 (Referent) | 1.11 (0.77–1.60) | 2.52 (1.84–3.46) |
| Colorectal – female | |||||
| Number of cases | 47 | 43 | 53 | 66 | 101 |
| HR (95% CI) | 0.84 (0.57–1.25) | 0.80 (0.53–1.20) | 1.00 (Referent) | 1.27 (0.88–1.82) | 1.91 (1.37–2.67) |
| Colorectal – male | |||||
| Number of cases | 36 | 70 | 71 | 87 | 114 |
| HR (95% CI) | 0.51 (0.34–0.77) | 1.00 (0.72–1.39) | 1.00 (Referent) | 1.29 (0.94–1.76) | 1.67 (1.24–2.25) |
| Lung – female | |||||
| Number of cases | 25 | 26 | 41 | 36 | 40 |
| HR (95% CI) | 0.56 (0.34–0.92) | 0.55 (0.34–0.91) | 1.00 (Referent) | 0.89 (0.57–1.39) | 0.95 (0.61–1.47) |
| Lung – male | |||||
| Number of cases | 51 | 58 | 68 | 80 | 103 |
| HR (95% CI) | 0.72 (0.50–1.04) | 0.79 (0.56–1.13) | 1.00 (Referent) | 1.14 (0.82–1.57) | 1.46 (1.07–1.98) |
Table 3
Associations between per standard deviation (SD) increase in site-specific polygenic risk scores and cancer occurrence.
Hazard ratios (HR) and corresponding 95% confidence intervals (CI) were estimated using Cox proportional hazard models, adjusted for age at recruitment, dialect group, highest education attained, body mass index, smoking status, alcohol consumption, and physical activity. Follow-up time was censored at 20 years after recruitment. Significant results are shown in bold.
| Cancer site | ||||||||||||
|---|---|---|---|---|---|---|---|---|---|---|---|---|
| Breast | Prostate | Colorectal – female | Colorectal – male | Lung – female | Lung – male | |||||||
| HR (95% CI) | p-Value | HR (95% CI) | p-Value | HR (95% CI) | p-Value | HR (95% CI) | p-Value | HR (95% CI) | p-Value | HR (95% CI) | p-Value | |
| Site-specific polygenic risk score, per SD increase | 1.47 (1.34–1.60) | 5.80E-17 | 2.08 (1.85–2.34) | 1.56E-33 | 1.39 (1.24–1.55) | 1.06E-08 | 1.44 (1.30–1.59) | 5.41E-12 | 1.21 (1.04–1.40) | 1.10E-02 | 1.35 (1.22–1.49) | 1.01E-08 |
| Age at recruitment, years | 1.00 (0.99–1.02) | 5.82E-01 | 1.09 (1.07–1.10) | 6.34E-23 | 1.07 (1.05–1.09) | 7.24E-17 | 1.06 (1.05–1.08) | 9.53E-18 | 1.07 (1.05–1.10) | 1.65E-10 | 1.09 (1.07–1.10) | 1.46E-27 |
| Dialect group (Cantonese vs Hokkien) | 0.88 (0.73–1.05) | 1.61E-01 | 0.98 (0.78–1.24) | 8.86E-01 | 0.78 (0.62–0.99) | 3.96E-02 | 1.22 (0.99–1.50) | 6.78E-02 | 0.92 (0.67–1.25) | 5.78E-01 | 1.07 (0.87–1.33) | 5.21E-01 |
| Highest education (primary vs no) | 1.21 (0.95–1.53) | 1.20E-01 | 1.32 (0.81–2.14) | 2.65E-01 | 1.08 (0.83–1.41) | 5.60E-01 | 0.98 (0.70–1.37) | 8.91E-01 | 0.83 (0.58–1.19) | 3.11E-01 | 0.87 (0.64–1.18) | 3.67E-01 |
| Highest education (secondary or above vs no) | 1.54 (1.18–2.01) | 1.57E-03 | 1.60 (0.98–2.63) | 6.17E-02 | 1.06 (0.76–1.48) | 7.46E-01 | 0.80 (0.55–1.16) | 2.33E-01 | 1.10 (0.69–1.74) | 6.87E-01 | 0.63 (0.44–0.90) | 1.16E-02 |
| Body mass index, kg/m2 | 1.04 (1.02–1.07) | 1.28E-03 | 1.01 (0.98–1.05) | 5.15E-01 | 0.99 (0.96–1.02) | 5.33E-01 | 1.02 (0.98–1.05) | 3.19E-01 | 0.97 (0.92–1.01) | 1.58E-01 | 0.97 (0.93–1.00) | 5.60E-02 |
| Smoking status (ex-smoker vs non-smoker) | 0.90 (0.45–1.83) | 7.81E-01 | 0.68 (0.50–0.92) | 1.32E-02 | 1.51 (0.86–2.66) | 1.55E-01 | 1.17 (0.90–1.52) | 2.36E-01 | 2.16 (1.04–4.48) | 3.86E-02 | 1.99 (1.41–2.83) | 1.09E-04 |
| Smoking status (current smoker vs non-smoker) | 0.83 (0.49–1.39) | 4.72E-01 | 0.70 (0.52–0.93) | 1.52E-02 | 1.10 (0.69–1.75) | 6.85E-01 | 1.22 (0.96–1.56) | 1.08E-01 | 5.78 (3.98–8.38) | 2.69E-20 | 5.15 (3.83–6.91) | 1.17E-27 |
| Alcohol consumption (weekly vs never/ occasionally) | 1.04 (0.65–1.67) | 8.74E-01 | 0.98 (0.70–1.39) | 9.29E-01 | 0.76 (0.38–1.54) | 4.46E-01 | 1.31 (1.00–1.73) | 5.39E-02 | 0.72 (0.27–1.96) | 5.23E-01 | 0.89 (0.65–1.22) | 4.81E-01 |
| Alcohol consumption (daily vs never/ occasionally) | 0.71 (0.27–1.91) | 5.00E-01 | 0.74 (0.40–1.36) | 3.32E-01 | 1.55 (0.69–3.49) | 2.89E-01 | 1.64 (1.15–2.34) | 6.54E-03 | 0.66 (0.16–2.68) | 5.63E-01 | 1.21 (0.85–1.73) | 2.81E-01 |
| Moderate physical activity (1–3 hr/week vs no) | 0.98 (0.75–1.28) | 8.80E-01 | 1.17 (0.87–1.57) | 2.97E-01 | 0.88 (0.63–1.24) | 4.74E-01 | 1.02 (0.78–1.35) | 8.79E-01 | 0.99 (0.62–1.58) | 9.73E-01 | 0.90 (0.67–1.23) | 5.17E-01 |
| Moderate physical activity (≥3 hr/week vs no) | 1.17 (0.86–1.60) | 3.20E-01 | 0.99 (0.68–1.45) | 9.78E-01 | 0.59 (0.37–0.96) | 3.33E-02 | 1.10 (0.80–1.52) | 5.45E-01 | 0.96 (0.54–1.70) | 8.78E-01 | 0.86 (0.59–1.26) | 4.36E-01 |
| Vigorous physical activity/ strenuous sports at least once a week (yes vs no) | 1.24 (0.90–1.70) | 1.89E-01 | 1.05 (0.79–1.41) | 7.16E-01 | 1.09 (0.68–1.74) | 7.25E-01 | 0.75 (0.57–1.00) | 5.06E-02 | 0.58 (0.24–1.42) | 2.30E-01 | 0.95 (0.72–1.26) | 7.37E-01 |
| Family history (yes vs no) | 1.14 (0.90–1.45) | 2.67E-01 | 1.53 (1.16–2.02) | 2.47E-03 | 1.08 (0.79–1.48) | 6.20E-01 | 1.24 (0.95–1.62) | 1.09E-01 | 0.67 (0.40–1.13) | 1.33E-01 | 0.97 (0.71–1.33) | 8.63E-01 |
Author response table 1
Linear associations between features performance (AUC, calibration [expected/ observed], and Hosmer-Lemeshow p-values) and the number of variants in the polygenic risk score, by cancer type.
| Cancer site – gender | Feature | Linear association p-value | Max value of feature |
| Breast – Female | AUC | P=0.864 | 0.61075098 |
| Breast – Female | Calibration (E/O) | P=0.748 | 1.50854654 |
| Breast – Female | Hosmer-Lemeshow p-value | P=0.847 | 0.960221 |
| Prostate – Male | AUC | P=0.403 | 0.72849342 |
| Prostate – Male | Calibration (E/O) | P=0.567 | 4.74364593 |
| Prostate – Male | Hosmer-Lemeshow p-value | P=0.844 | 0.4708587 |
| Colorectal – Female | AUC | P=0.734 | 0.64886163 |
| Colorectal – Female | Calibration (E/O) | P=0.779 | 1.00833383 |
| Colorectal – Female | Hosmer-Lemeshow p-value | P=0.296 | 0.9056375 |
| Colorectal – Male | AUC | P=0.666 | 0.66361296 |
| Colorectal – Male | Calibration (E/O) | P=0.752 | 1.03242402 |
| Colorectal – Male | Hosmer-Lemeshow p-value | P=0.047 | 0.8180789 |
| Lung – Female | AUC | P=0.728 | 0.68602239 |
| Lung – Female | Calibration (E/O) | P=0.869 | 2.97417751 |
| Lung – Female | Hosmer-Lemeshow p-value | P=0.111 | 0.8170288 |
| Lung – Male | AUC | P=0.451 | 0.68032583 |
| Lung – Male | Calibration (E/O) | P=0.385 | 2.78560993 |
| Lung – Male | Hosmer-Lemeshow p-value | P=0.404 | 0.9451139 |
Additional files
-
Supplementary file 1
Supplementary files a-g, presenting supplementary figure and tables.
- https://cdn.elifesciences.org/articles/82608/elife-82608-supp1-v2.xlsx
-
MDAR checklist
- https://cdn.elifesciences.org/articles/82608/elife-82608-mdarchecklist1-v2.docx
-
Source code 1
R codes on the statistical analysis.
- https://cdn.elifesciences.org/articles/82608/elife-82608-code1-v2.zip
Download links
A two-part list of links to download the article, or parts of the article, in various formats.
Downloads (link to download the article as PDF)
Open citations (links to open the citations from this article in various online reference manager services)
Cite this article (links to download the citations from this article in formats compatible with various reference manager tools)
Polygenic risk scores for the prediction of common cancers in East Asians: A population-based prospective cohort study
eLife 12:e82608.
https://doi.org/10.7554/eLife.82608


