Contrasting effects of Ksr2, an obesity gene, on trabecular bone volume and bone marrow adiposity
- VA Loma Linda Healthcare System, United States
- Loma Linda University Medical Center, United States
- University of Nebraska Medical Center, United States
- Lexicon Pharmaceuticals, United States
Figures
Figure 1

Ksr2 regulates bone mass in females.
(A) Schematic of Ksr2 knocked out in the C57BL/6J-Tyrc-Brd × 129SvEvBrd hybrid strain with exon 13 deleted (X), and accompanying ventral view of genotyped mice at 4 months of age exhibiting differences in weight gain. (B) Representative 3D micro-computed tomography (microCT) reconstruction images of the secondary spongiosa at the distal femoral metaphysis in wild-type (Ksr2+/+, WT) or knockout (Ksr2-/-, KO) females at 11 and 15 weeks, revealing a prominent increase in trabecular bone in KOs. Scale bar: 100 μm. (C–H) MicroCT measurements from the trabecular bone as represented in panel (B) (n = 6–10/group), BV/TV, bone volume/tissue volume; CONN.D, connectivity density; SMI, structural model index; Tb.N, trabecular number; Tb.Th, trabecular thickness; Tb.Sp, trabecular spacing. (I) Representative 3D reconstruction of microCT images of primary spongiosa in WT or KO mice at 15 weeks of age revealing increased bone density in KO mice. Scale bar: 100 μm. (J–M) Quantification of microCT parameters measured in panel (I) (n = 6–10/group). (N) Representative 3D reconstruction of microCT images of cortical bone at the femoral mid-diaphysis (scale bar: 100 μM), where the TV total volume (O) is not affected, while BV/TV and volumetric bone mineral density (vBMD) (P, Q) are increased in KO mice. Statistics analyzed by unpaired two-tailed Student’s t-test, and graphed lines represent the mean ± SEM, *p<0.05, **p<0.005.
-
Figure 1—source data 1
Micro-computed tomography (microCT) measurements of female trabecular bone.
Source data for Figure 1C–H.
- https://cdn.elifesciences.org/articles/82810/elife-82810-fig1-data1-v1.xlsx
-
Figure 1—source data 2
Micro-computed tomography (microCT) measurements of female primary spongiosa.
Source data for Figure 1J–M.
- https://cdn.elifesciences.org/articles/82810/elife-82810-fig1-data2-v1.xlsx
-
Figure 1—source data 3
Micro-computed tomography (microCT) measurements of female cortical bone.
Source data for Figure 1O–Q.
- https://cdn.elifesciences.org/articles/82810/elife-82810-fig1-data3-v1.xlsx
Figure 2
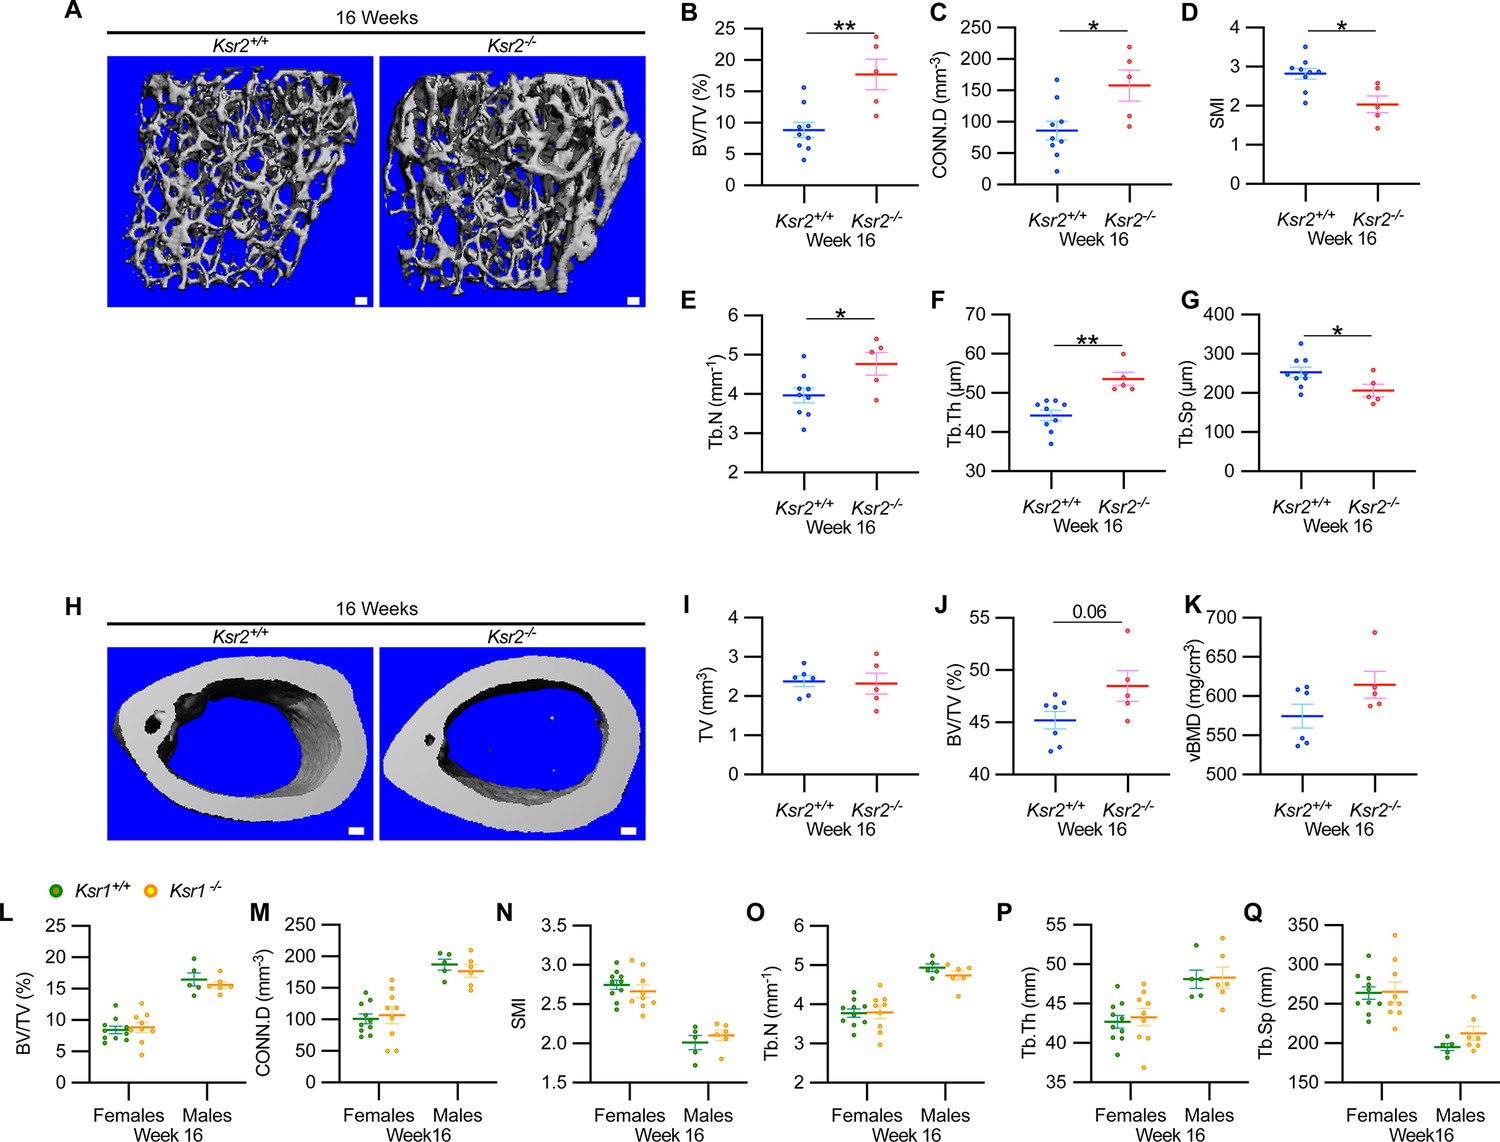
Ksr2 negatively regulates femoral bone in males, while Ksr1 deletion does not affect trabecular bone in either gender.
(A) Representative 3D micro-computed tomography (microCT) reconstruction images of the distal femoral metaphysis in wild-type (WT) or knockout (KO) male mice at 16 weeks of age revealing increased trabecular bone in KOs. Scale bar: 100 μm. (B–G) MicroCT measurements from the trabecular bone as represented in panel (A) (n = 5–9 mice per group). BV/TV, bone volume/tissue volume; CONN.D, connectivity density; SMI, structural model index; Tb.N, trabecular number; Tb.Th, trabecular thickness; Tb.Sp, trabecular spacing. (H) Representative 3D microCT reconstruction images of cortical bones at the femoral mid-diaphysis revealing that Ksr2 deletion does not affect TV total volume (I) of cortical bone in males, while BV/TV (J) and volumetric bone mineral density (vBMD) (K) are increased in Ksr2 KO mice (n = 5–6/group). Scale bar: 100 μm. (L–Q) Quantification of microCT data from the distal femoral metaphysis of WT and Ksr1 knockout mice at 16 weeks of age, showing minimal changes in trabecular bone parameters between genotypes in either gender. Statistics analyzed by two-tailed Student’s t-test, and graphed lines represent the mean ± SEM, *p<0.05, **p<0.005.
-
Figure 2—source data 1
Micro-computed tomography (microCT) measurements of male trabecular bone.
Source data for Figure 2B–G.
- https://cdn.elifesciences.org/articles/82810/elife-82810-fig2-data1-v1.xlsx
-
Figure 2—source data 2
Micro-computed tomography (microCT) measurements of male cortical bone.
Source data for Figure 2I–K.
- https://cdn.elifesciences.org/articles/82810/elife-82810-fig2-data2-v1.xlsx
-
Figure 2—source data 3
Micro-computed tomography (microCT) measurements of Ksr1 knockout mice.
Source data for Figure 2L–Q.
- https://cdn.elifesciences.org/articles/82810/elife-82810-fig2-data3-v1.xlsx
Figure 3 with 2 supplements
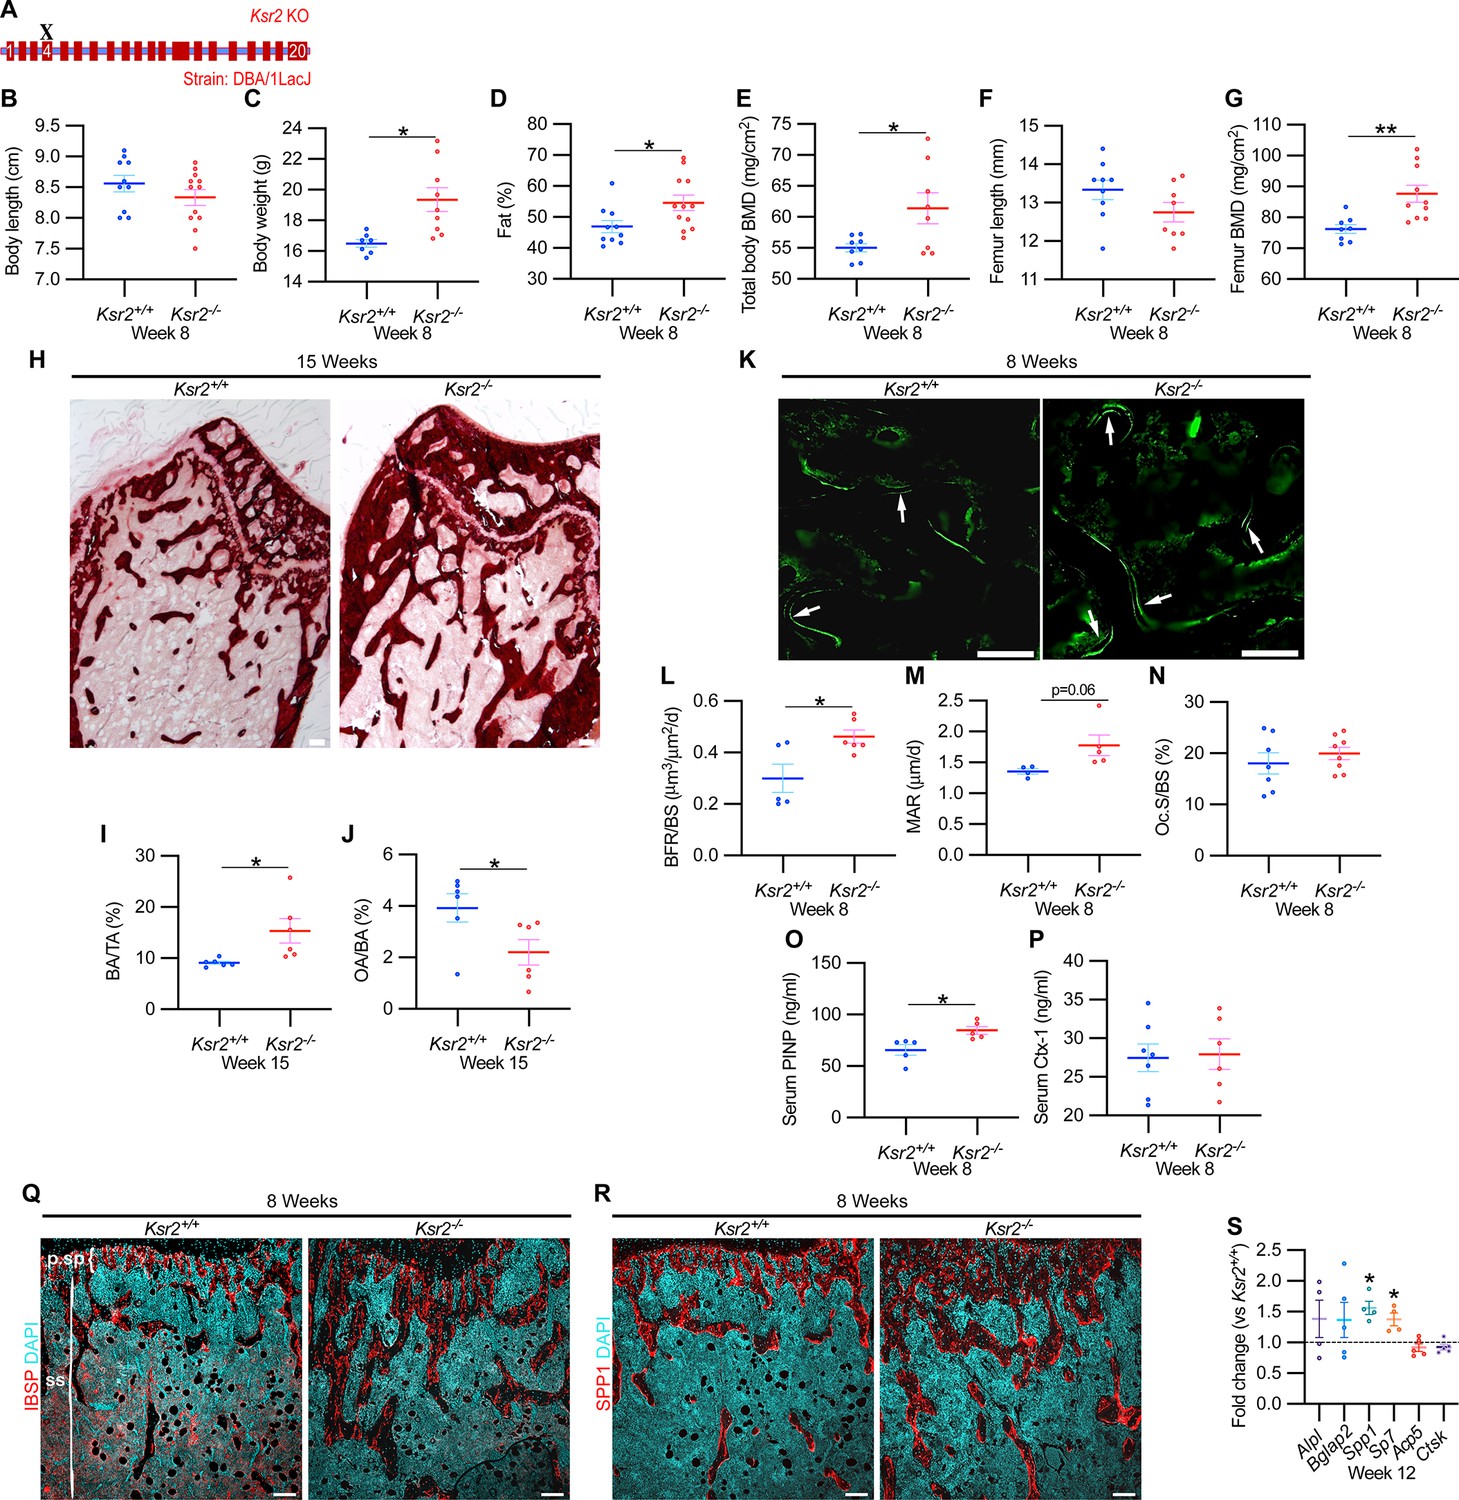
Ksr2 deletion in a different genetic background, histomorphometry, and histology validates that Ksr2 negatively regulates bone formation.
(A) Schematic of Ksr2 knocked out in the DBA/1LacJ strain with exon 4 deleted (X). (B) No differences were noted in body length at 8 weeks of age, while gains in body weight (C) and body fat percentage (D) are noted in knockouts (KOs). Bone mineral density (BMD) is increased in total body (E) and femurs (G) of KO mice, while femur length is not changed (F) (n = 7–12 mice/group; genders combined) (D–G reflect dual-energy X-ray absorptiometry measurements). (H) Representative alizarin red images at the distal femoral epiphysis show increased area of mineral staining in KO mice at 11 weeks of age. Scale bar: 100 μm. (I, J) Quantification of alizarin stain reveals an increase in bone area/total area (BA/TA) and a decrease in osteoid area/bone area (OA/BA). (K) Representative histomorphometric images of fluorescent calcein label reveal increased staining in KO mice. Scale bar: 100 μm. (L–N) Quantification of histomorphometric parameters measured, showing increased bone formation rate/bone surface (BFR/BS) and mineral apposition rate (MAR), yet no changes in the number of osteoclasts per bone surface (Oc.S/BS) (n = 4–7 mice/group). (O, P) Serum levels of bone formation marker (PINP) and bone resorption marker (Ctx-1) in 8-week-old female Ksr2 mutant and wild-type mice (n = 5–7 mice/group). (Q, R) Immunofluorescence staining at distal femoral metaphysis for (IBSP, synonym BSP2) or (SPP1, synonym OPN) (both red), counterstained with DAPI (cyan) reveals broader expression of both bone markers in KO mice; growth plate-osteoblast boundary positioned at the top. p.sp, primary spongiosa; ss, secondary spongiosa. Scale bar: 100 μm. (S) RT-qPCR reveals increased expression of osteoblast markers (Alpl, Bglap2, Spp1, and Sp7), while osteoclast markers (Acp5, Ctsk) remain unchanged in femurs of KO mice. Statistics analyzed by two-tailed Student’s t-test, and graphed lines represent the mean ± SEM, *p<0.05, **p<0.005.
-
Figure 3—source data 1
X-ray measurements of Ksr2 knockouts in DBA/1LacJ.
Source data for Figure 3B–G.
- https://cdn.elifesciences.org/articles/82810/elife-82810-fig3-data1-v1.xlsx
-
Figure 3—source data 2
Distal femur–alizarin red quantification.
Source data for Figure 3I and J.
- https://cdn.elifesciences.org/articles/82810/elife-82810-fig3-data2-v1.xlsx
-
Figure 3—source data 3
Histomorphometric measurements of Ksr2 knockout mice.
Source data for Figure 3L–N.
- https://cdn.elifesciences.org/articles/82810/elife-82810-fig3-data3-v1.xlsx
-
Figure 3—source data 4
Serum ELISA measurements of Ksr2 knockout mice.
Source data for Figure 3O and P.
- https://cdn.elifesciences.org/articles/82810/elife-82810-fig3-data4-v1.xlsx
-
Figure 3—source data 5
RT-qPCR data of 12-week-old Ksr2 knockout femurs versus wild-type.
Average fold changes plotted and t-test values are highlighted in yellow. Source data for Figure 3S.
- https://cdn.elifesciences.org/articles/82810/elife-82810-fig3-data5-v1.xlsx
Figure 3—figure supplement 1

Vertebral trabecular bone is not affected by Ksr2.
(A) Representative 3D micro-computed tomography (microCT) reconstruction images of lumbar vertebrae in wild-type (Ksr2+/+, WT) or knockout (Ksr2-/-, KO) mice at 8 weeks, revealing no change in trabecular bones by Ksr2 deletion. Scale bar: 100 μm. (B–F) MicroCT measurements from the trabecular bone as represented in panel (A) (n = 8–10/group), mixed genders. BV/TV, bone volume/tissue volume; Tb.N, trabecular number; Tb.Th, trabecular thickness; Tb.Sp, trabecular spacing; vBMD, volumetric bone mineral density. Statistics analyzed by unpaired two-tailed Student’s t-test, and graphed lines represent the mean ± SEM.
-
Figure 3—figure supplement 1—source data 1
Micro-computed tomography (microCT) measurements of lumbar vertebrae.
Average fold changes plotted and t-test values are highlighted in yellow. Source data for Figure 3—figure supplement 1.
- https://cdn.elifesciences.org/articles/82810/elife-82810-fig3-figsupp1-data1-v1.xlsx
Figure 3—figure supplement 2

Osteoid area is regulated by Ksr2.
Representative Goldner-stained longitudinal sections of distal femoral bones used to quantify osteoid area over bone area (OA/BA) in Figure 3J. Scale bar: 100 μm.
Figure 4
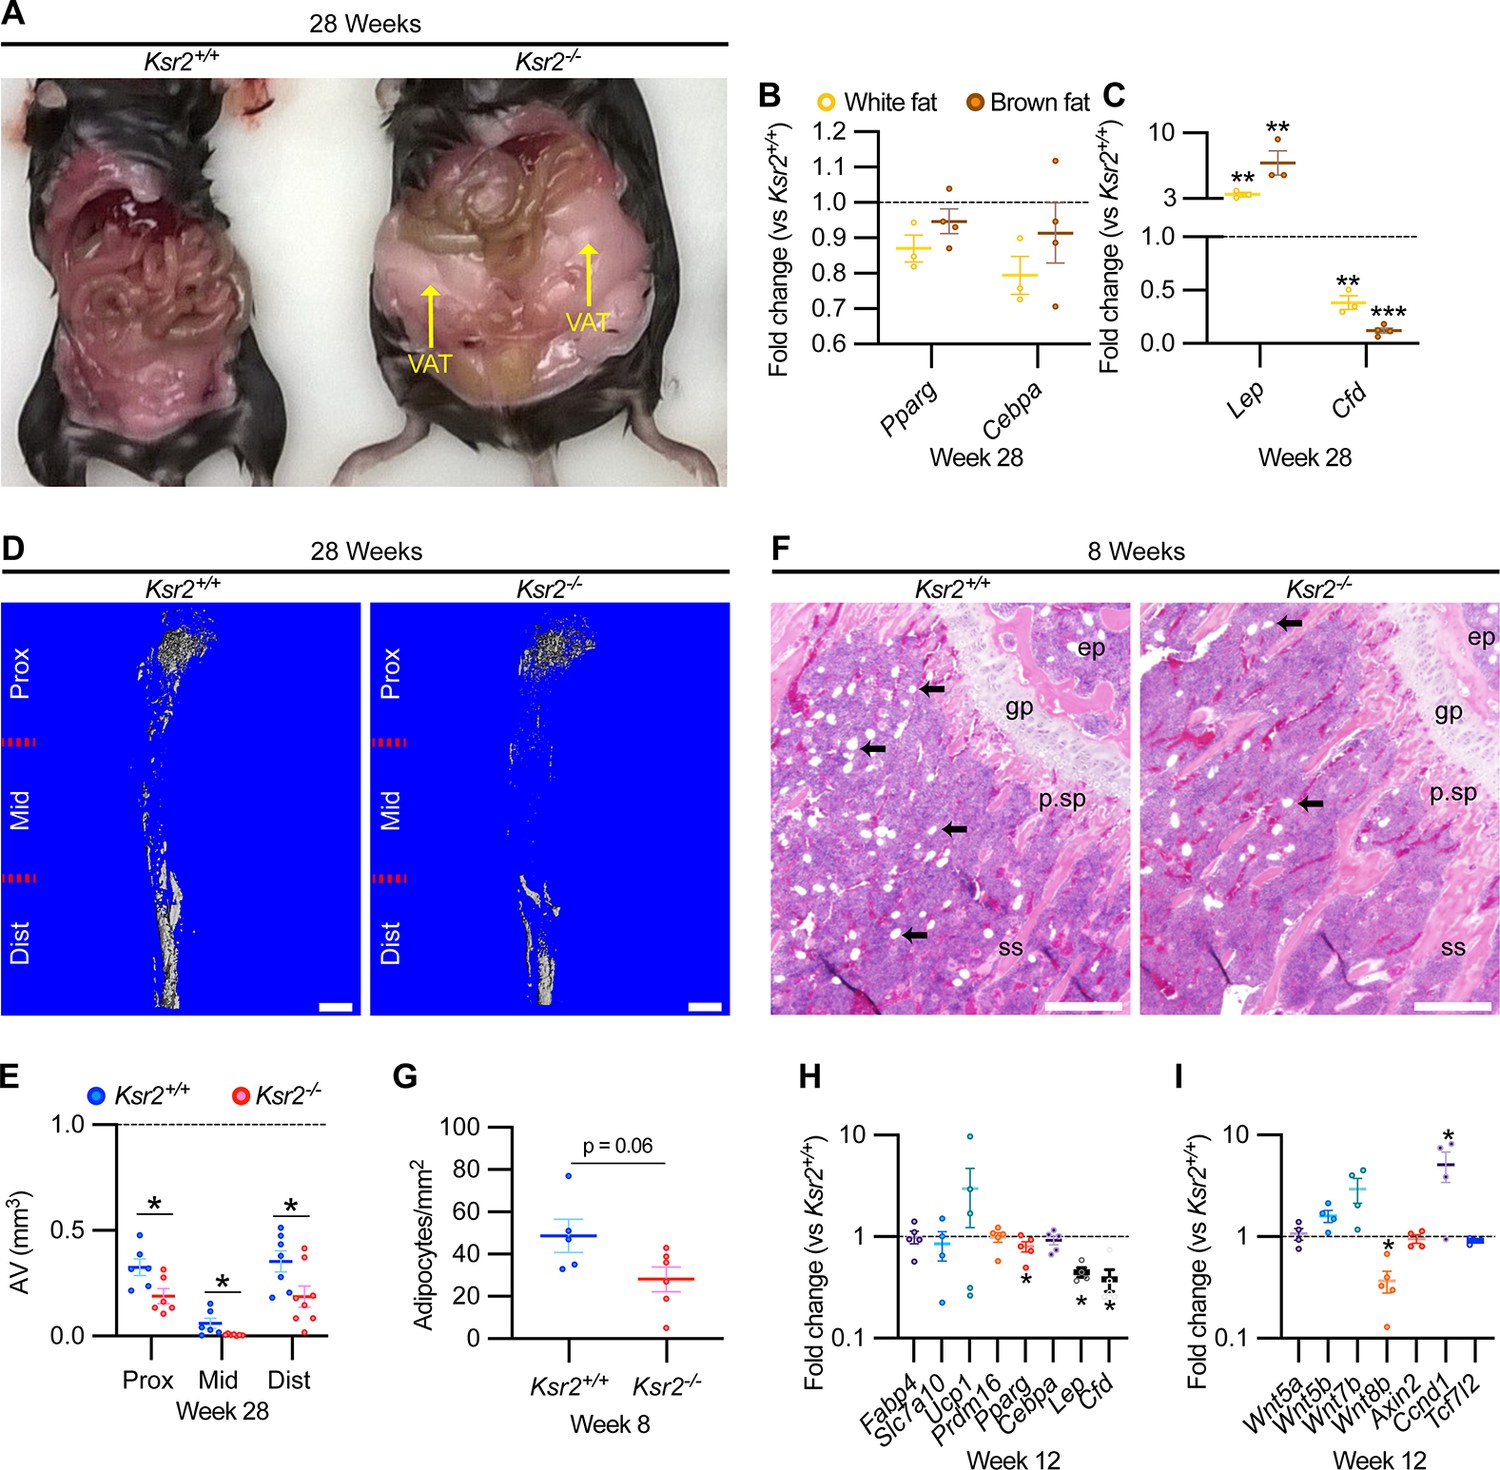
Obesity in Ksr2 null mice paradoxically presents reduced bone marrow adiposity.
(A) Representative image of mice at 28 weeks of age dissected to reveal differences in visceral adipose tissue (VAT) between wild-type (WT) and Ksr2 knockouts (KOs). (B, C) RT-qPCR assessing changes in regulators of adipogenesis (B) or adipokine genes (C), in white or brown fat of Ksr2 KO mice relative to WT at 28 weeks of age (n = 3–4/group). (D) Representative 3D micro-computed tomography (microCT) reconstruction images of osmium tetroxide-labeled femurs, revealing reductions in bone marrow adipose tissue in Ksr2 KO mice at 28 weeks of age. Scale bar: 1 mm. (E) Quantification of adipocyte volume (AV) occupied by marrow adipose tissue in femurs of mice as depicted in panel (D), at proximal (prox), middle (mid), and distal (dist) thirds of the femur with position defined in reference to the spinal cord (n = 6–8/group). (F) Representative hematoxylin and eosin-stained longitudinal distal femur sections of 8-week-old mice in which adipocytes (arrows) were compared at the secondary spongiosa, revealing reductions in KO mice. Scale bar: 100 μm. (G) Quantification of sections as represented in panel (F) (n = 5–7/group). RT-qPCR comparisons in adipogenic (H) and Wnt-related (I) genes from the secondary spongiosa of femurs as shown in (F) (n = 3–5/group). Statistics analyzed by two-tailed Student’s t-test, and lines plotted reflect the mean ± SEM, *p<0.05, **p<0.005, ***p<0.0005.
-
Figure 4—source data 1
RT-qPCR data of 28-week-old Ksr2 knockout versus wild-type (adipose tissue).
Average fold changes plotted and t-test values are highlighted in yellow. Source data for Figure 4B and C.
- https://cdn.elifesciences.org/articles/82810/elife-82810-fig4-data1-v1.xlsx
-
Figure 4—source data 2
Quantification of osmium tetroxide-labeled micro-computed tomography (microCT) of tibia.
Source data for Figure 4E.
- https://cdn.elifesciences.org/articles/82810/elife-82810-fig4-data2-v1.xlsx
-
Figure 4—source data 3
Quantification of adipocytes from H&E-stained femurs metaphysis.
Source data for Figure 4G.
- https://cdn.elifesciences.org/articles/82810/elife-82810-fig4-data3-v1.xlsx
-
Figure 4—source data 4
RT-qPCR data of 12-week-old Ksr2 knockout versus wild-type femur (adipocyte markers).
Average fold changes plotted and t-test values are highlighted in yellow. Source data for Figure 4H.
- https://cdn.elifesciences.org/articles/82810/elife-82810-fig4-data4-v1.xlsx
-
Figure 4—source data 5
RT-qPCR data of 12-week-old Ksr2 knockout versus wild-type femur (Wnt markers).
Average fold changes plotted and t-test values are highlighted in yellow. Source data for Figure 4I.
- https://cdn.elifesciences.org/articles/82810/elife-82810-fig4-data5-v1.xlsx
Figure 5
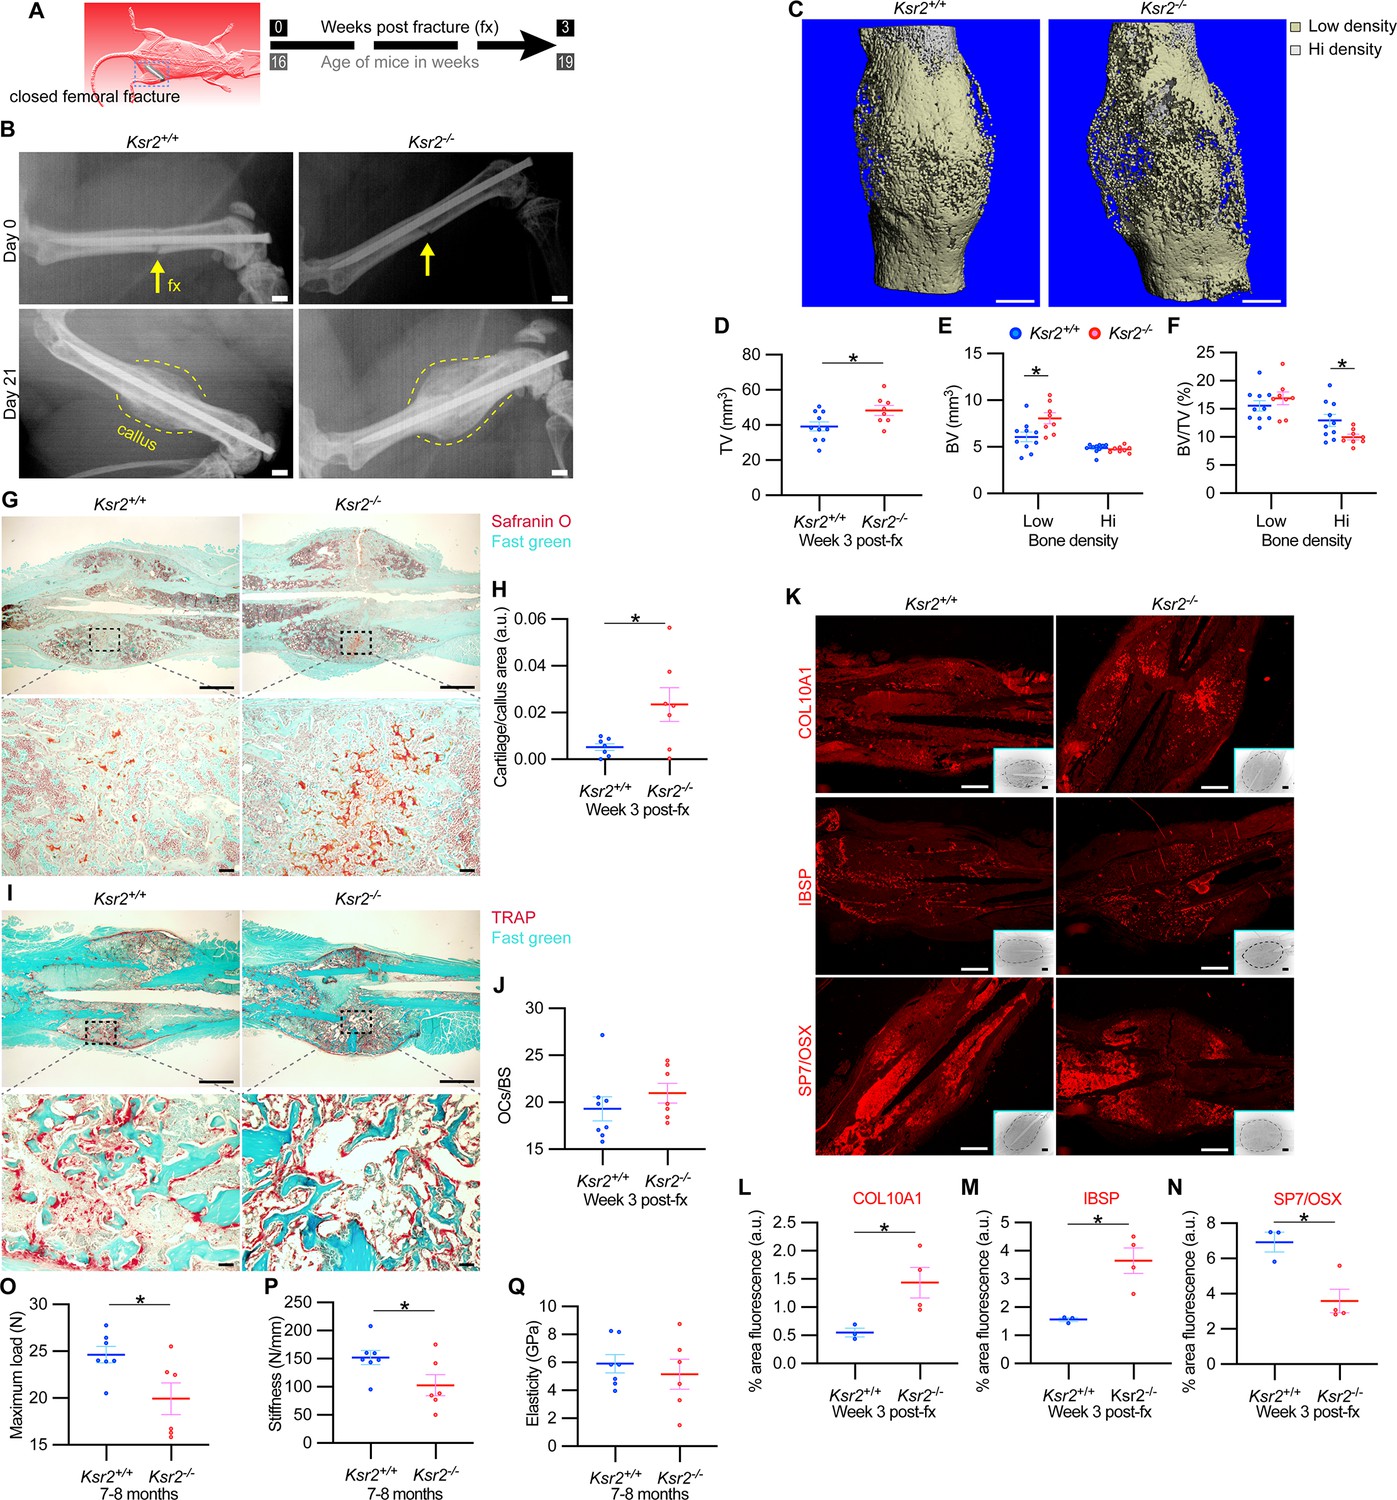
Delayed fracture healing but increased fragility in Ksr2 knockout mice.
(A) Schematic of strategy. (B) Representative X-ray images of bones that underwent closed mid-femoral fracture in wild-type (WT) and Ksr2-/- knockout (KO) mice on the day of surgery (day 0) and day 21 post-fracture (fx). Yellow arrows point to induced fracture, while calluses are outlined by dotted yellow lines. Scale bar: 1 mm. (C) Representative 3D micro-computed tomography (microCT) reconstruction images of fracture calluses at 3 weeks post-fx. Color-coded differences in bone density are indicated in the legend. (D–F) Quantification of microCT data for total volume (TV), bone volume (BV), and BV/TV (n = 8–10/group). (G) Representative Safranin O-stained chondrocytes in WT and Ksr2-/- bones at 3 weeks post-fx showing increased cartilage in KO mice and corresponding quantification (H) (n = 6–7/group). (I) Representative TRAP-stained osteoclasts in calluses at 3 weeks post-fx., showing no difference between genotypes, with corresponding quantification of osteoclasts/bone surface within callus (H) (n = 7–8/group). All histology sections were counterstained with fast green dye. Scale bars: 1 mm at low magnification (mag), top rows; or 100 μm at high magnification, bottom rows. (K) Representative immunofluorescence images for COL10A1, IBSP, SP7/OSX of fracture callus at 3 weeks post-fx. Dashed lines within the insets delineate the callus area quantified. Scale bar: 1 mm at low-magnification insets; 100 μm at high magnification. (L–N) Quantitation of fracture callus. (O–Q) Three-point bending test shows femurs of Ksr2-/- KO mice tolerate less load to fracture with reduced stiffness, while elasticity remains unchanged. N, Newton; GPa, GigaPascal (n = 6–7/group mixed genders; two males per group). Statistics were analyzed by two-tailed Student’s t-test, and graphed lines represent the mean ± SEM, * p<0.05.
-
Figure 5—source data 1
Micro-computed tomography (microCT) measurements of fracture callus after 3 weeks.
Source data for Figure 5D–F.
- https://cdn.elifesciences.org/articles/82810/elife-82810-fig5-data1-v1.xlsx
-
Figure 5—source data 2
Quantification of Safranin O and ACP5/TRAP of fracture callus after 3 weeks.
Source data for Figure 5H and J.
- https://cdn.elifesciences.org/articles/82810/elife-82810-fig5-data2-v1.xlsx
-
Figure 5—source data 3
Quantification of immunofluorescence images of fracture callus after 3 weeks.
Source data for Figure 5L–N.
- https://cdn.elifesciences.org/articles/82810/elife-82810-fig5-data3-v1.xlsx
-
Figure 5—source data 4
Quantification of three-point bending tests.
Source data for Figure 5O–Q.
- https://cdn.elifesciences.org/articles/82810/elife-82810-fig5-data4-v1.xlsx
Figure 6
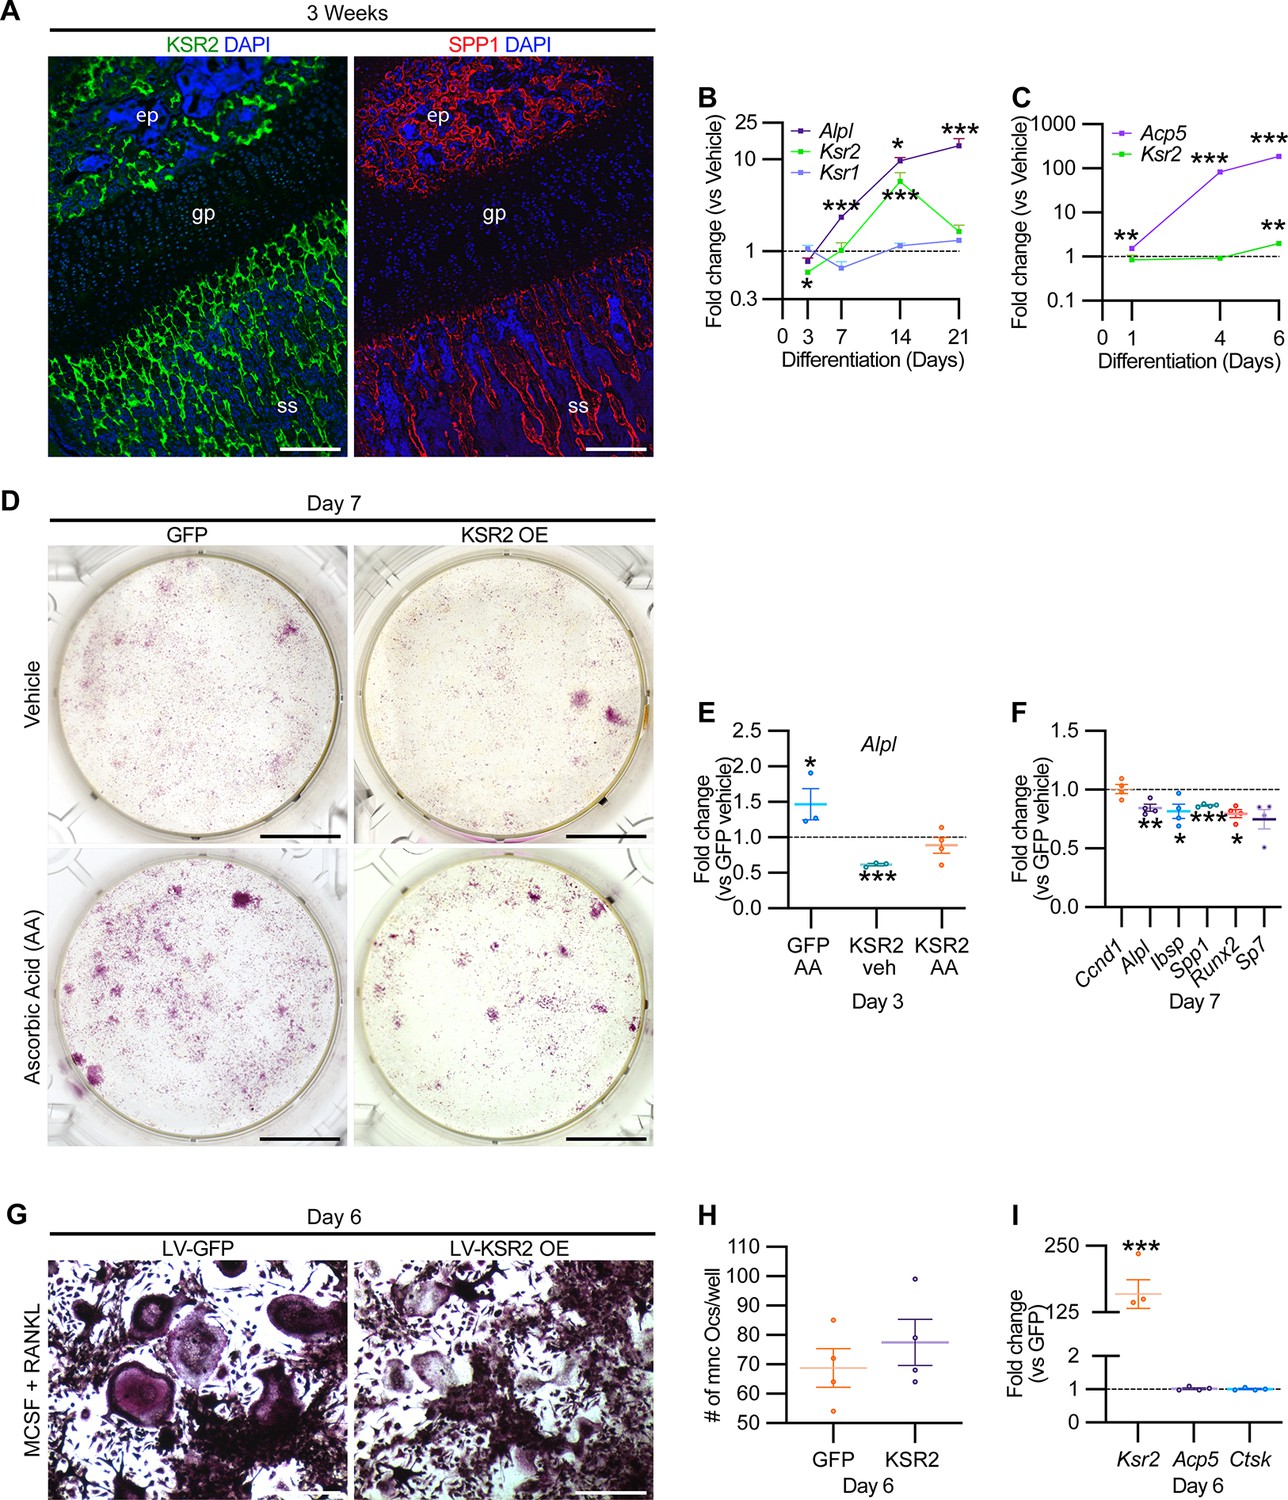
KSR2 is expressed in bone, and ex vivo gain-of-function studies demonstrate Ksr2 represses osteoblast differentiation but is dispensable for osteoclast differentiation.
(A) Representative immunofluorescence for KSR2 (green) and OPN (red) expression in longitudinal sections of distal femur epiphysis from 3-week-old wild-type (WT) mice, counterstained with DAPI (blue). ep, epiphyseal bone; gp, growth plate; ss, secondary spongiosa. Scale bar: 100 μm. (B) Ex vivo time-course RT-qPCR characterization of Alpl, Ksr2, and Ksr1 mRNA expression on calvaria pre-osteoblasts isolated from WT mice following induction with osteoblast differentiation conditions relative to vehicle treatment (n = 3–4 independent experiments). (C) Ex vivo time-course RT-qPCR characterization of Acp5 and Ksr2 on primary macrophage cells isolated from femoral bones of WT mice following osteoclast differentiation relative to vehicle treatment (n = 3–4 independent experiments). (D) Representative images of alizarin red-stained primary bone marrow stromal cells with forced expression of either GFP or KSR2 after 7 days of treatment with either vehicle or ascorbic acid (AA). Scale bar: 10 mm. (E) RT-qPCR for Alpl on day 3 or (F) various osteoblast markers on day 7 (n = 4 independent experiments). (G) Representative images of multinuclear osteoclasts stained with ACP5/TRAP following 6 days of osteoclast differentiation from macrophages isolated from femurs and transduced with either GFP or KSR2. Scale bar: 100 μm (H) Quantification of multinuclear osteoclasts (Ocs) counted/well as shown in panel (G). (I) RT-qPCR for Ksr2, or osteoclast markers Acp5, Ctsk in osteoclasts on day 6 of differentiation as represented in panel (G). Statistics analyzed by two-tailed Student’s t-test, and graphed lines represent the mean ± SEM, *p<0.05, **p<0.005, ***p<0.0005.
-
Figure 6—source data 1
RT-qPCR data of ex vivo osteoblast differentiation time course.
Average fold changes plotted and t-test values are highlighted in yellow. Source data for Figure 6B.
- https://cdn.elifesciences.org/articles/82810/elife-82810-fig6-data1-v1.xlsx
-
Figure 6—source data 2
RT-qPCR data of ex vivo osteoclast differentiation time course.
Average fold changes plotted and t-test values are highlighted in yellow. Source data for Figure 6C.
- https://cdn.elifesciences.org/articles/82810/elife-82810-fig6-data2-v1.xlsx
-
Figure 6—source data 3
RT-qPCR data for osteoblast differentiation from bone marrow stem/stromal cells (BMSCs).
Average fold changes plotted and t-test values are highlighted in yellow. Source data for Figure 6E.
- https://cdn.elifesciences.org/articles/82810/elife-82810-fig6-data3-v1.xlsx
-
Figure 6—source data 4
RT-qPCR data for osteoblast differentiation from bone marrow stem/stromal cells (BMSCs).
Average fold changes plotted and t-test values are highlighted in yellow. Source data for Figure 6F.
- https://cdn.elifesciences.org/articles/82810/elife-82810-fig6-data4-v1.xlsx
-
Figure 6—source data 5
Quantification of osteoclasts differentiated from primary macrophages.
Source data for Figure 6H.
- https://cdn.elifesciences.org/articles/82810/elife-82810-fig6-data5-v1.xlsx
-
Figure 6—source data 6
RT-qPCR data for osteoclast differentiation from primary macrophages.
Average fold changes plotted and t-test values are highlighted in yellow. Source data for Figure 6I.
- https://cdn.elifesciences.org/articles/82810/elife-82810-fig6-data6-v1.xlsx
Figure 7
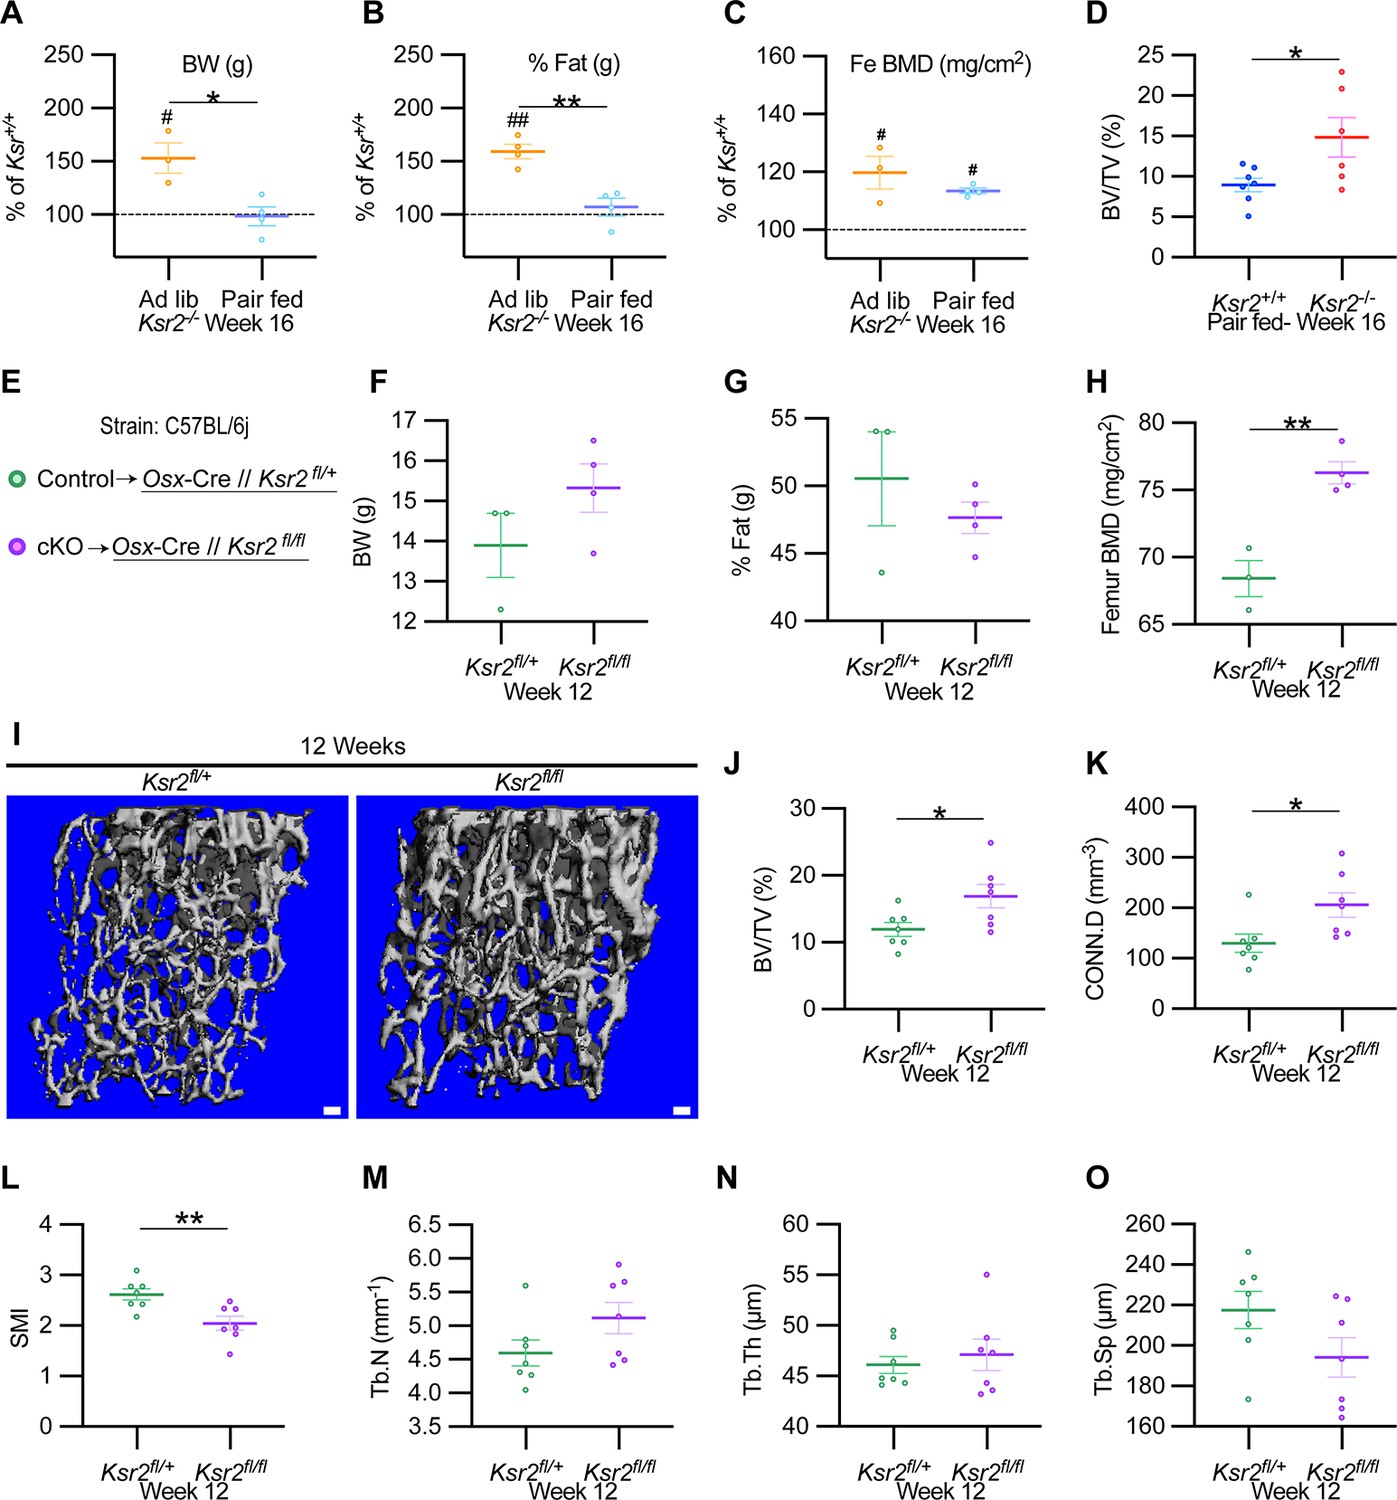
Ksr2 regulates femoral trabecular bone autonomously.
(A–C) Pair-feeding experiments reveal that gains in mineral density are acquired independently of eating-induced weight gains in knockout (KO) mice fed at will (Ad lib) or pair-fed according to the amount eaten by wild-type (WT) mice. Panels (A–C) are represented as a percentage relative to WT. BW, body weight; Fe BMD, femur bone mineral density; BV/TV, bone volume/total volume (n = 3–6/group). (D) BV/TV from femoral metaphysis of WT and KO at end of pair-feeding. (E) Conditional knockout strategy. (F–H) Differences between control (Ksr2fl/+) and conditional knockout, cKO (Ksr2fl/fl), mice in percent body fat (F), body weight (G), and femur bone mineral density (H) (n = 3–4/group). (Note: B, C, G, H reflect dual-energy X-ray absorptiometry measurements.) (I) Representative 3D micro-computed tomography (microCT) reconstruction images of distal femoral metaphysis in control and cKO mice at 12 weeks of age, revealing increased trabecular bone in cKO mice. Scale bar: 100 μm. (J–O) MicroCT measurements from the trabecular bone as represented in panel (I) (n = 7 mice per group; mixed genders). CONN.D, connectivity density; SMI, structural model index; Tb.N, trabecular number; Tb.Th, trabecular thickness; Tb.Sp, trabecular spacing. Statistics were analyzed by two-tailed Student’s t-test, and graphed lines represent the mean ± SEM, *p<0.05, **p<0.005 for comparisons between groups labeled on the x-axis. In panels (A–C), significance between Ksr2 KO and WT for a given condition is represented by #p<0.05 or ##p<0.005.
-
Figure 7—source data 1
X-ray measurements of Ksr2 knockout mice after pair-feeding experiments and micro-computed tomography (microCT) of femur metaphysis in pair-fed mice.
Source data for Figure 7A–D.
- https://cdn.elifesciences.org/articles/82810/elife-82810-fig7-data1-v1.xlsx
-
Figure 7—source data 2
X-ray measurements of osteoblast-specific Ksr2-conditional knockout mice.
Source data for Figure 7F-H.
- https://cdn.elifesciences.org/articles/82810/elife-82810-fig7-data2-v1.xlsx
-
Figure 7—source data 3
Micro-computed tomography (microCT) measurements of distal femoral metaphysis from osteoblast-specific Ksr2-conditional knockout mice.
Source data for Figure 7J–O.
- https://cdn.elifesciences.org/articles/82810/elife-82810-fig7-data3-v1.xlsx
Figure 8
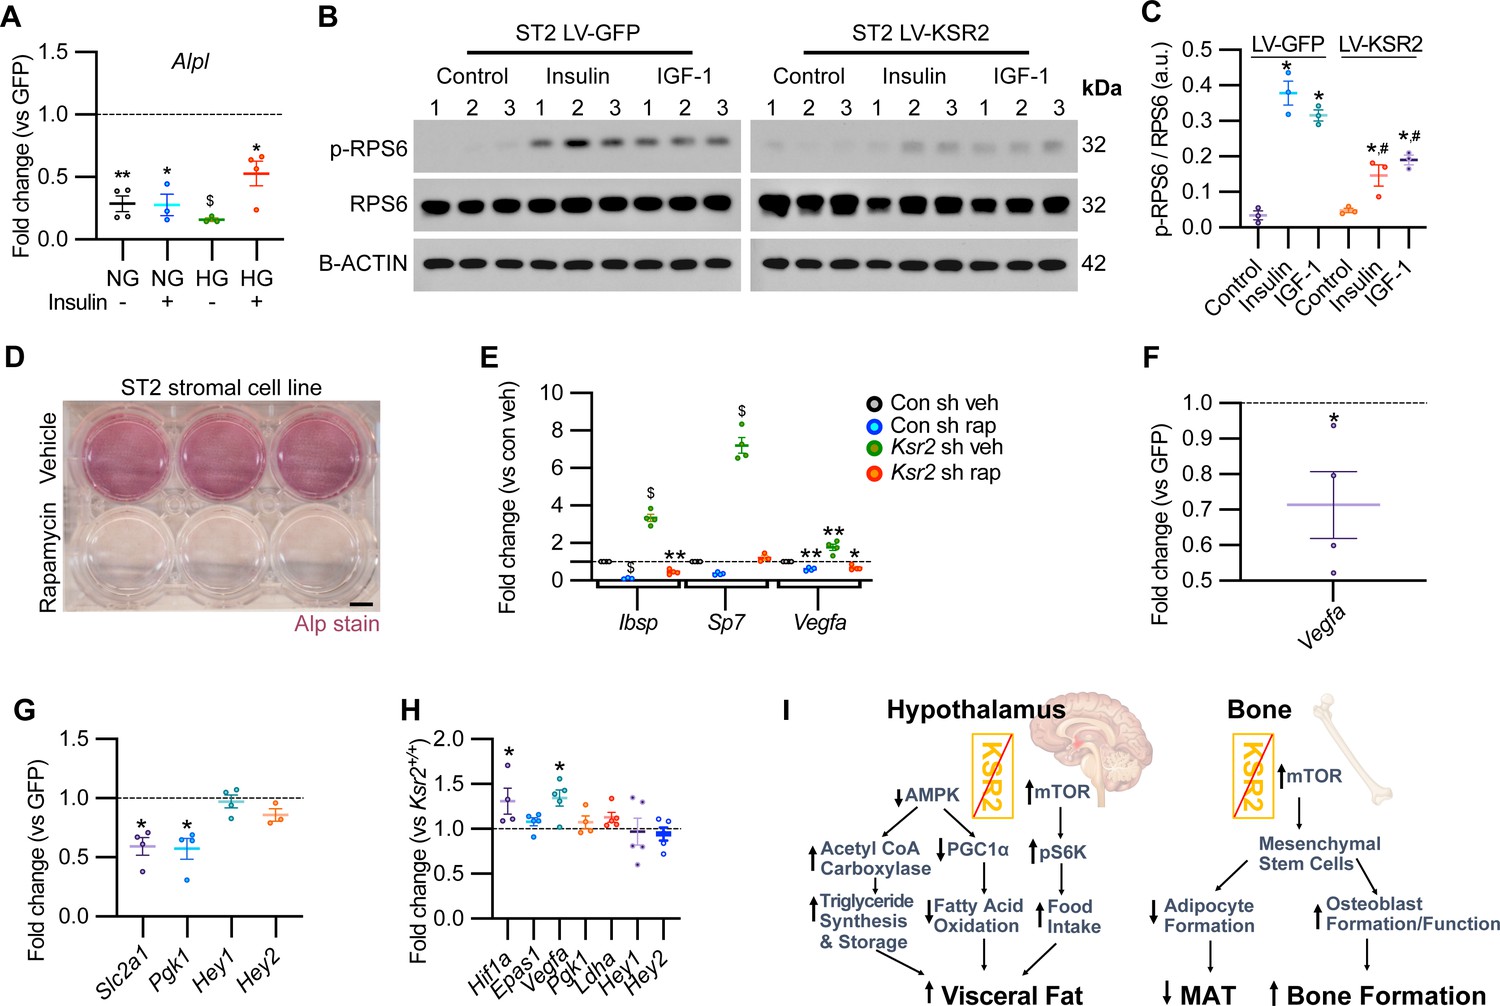
KSR2 promotes osteoblast differentiation through mTOR signaling affecting Hif1a and Vegfa, but not Notch signaling in the process.
(A) RT-qPCR for Alp from ST2 stromal cells overexpressing KSR2 or GFP by lentivirus (LV) on day 3 in normal glucose (NG) or high glucose (HG) without (-) or with (+) insulin. (B) Western blot for ST2 cells overexpressing GFP or KSR2 after 30 min in vehicle control, 100 μg/ml Insulin, or 100 ng/ml IGF-1, for the mTOR response target phosphorylated p-RPS6, total RPS6, or loading control, β-actin; 1,2,3 indicate biological replicates. (C) Quantification of WB comparing p-RPS6/RPS6 ratios. Within-group (*), between-group (#) comparisons (n = 3/group). (D) Representative image of ALP activity for ST2 stromal cells in osteoblast differentiation conditions on day 7 treated with vehicle (top row) or 10 nM rapamycin (bottom row). Scale bar: 10 mm. (E) RT-qPCR quantification of ST2 cells transduced with empty vector control (Con) or Ksr2 shRNA and treated with either vehicle or 10 nM rapamycin following 48 hr of osteoblast differentiation (n = 4/group). (F, G) RT-qPCR from ST2 stromal cells with KSR2 overexpression following 72 hr of osteoblast differentiation, plotted as a function of level detected in GFP controls (n = 4/group). (H) RT-qPCR on genes related with hypoxia or Notch signaling on RNA extracted from whole femurs of 12-week-old wild-type (WT) or Ksr2 knockout (KO) mice. Values represent fold change for KO relative to WT (set to 1, dashed line). (I) Model diagram summarizing results where high levels of KSR2 lead to low levels of mTOR activity, resulting in low bone density, while the absence of KSR2 results in high levels of mTOR activity, resulting in high bone density. All statistics analyzed by two-tailed Student’s t-test, graphed lines represent mean ± SEM. #p<0.05, *p<0.05, **p<0.005, $p<10–6.
-
Figure 8—source data 1
RT-qPCR data for ST2 stromal cells following osteoblast differentiation in low glucose or high glucose and either no insulin or with insulin.
Average fold changes plotted and t-test values are highlighted in yellow. Source data for Figure 8A.
- https://cdn.elifesciences.org/articles/82810/elife-82810-fig8-data1-v1.xlsx
-
Figure 8—source data 2
Images of Western blot film used in Figure 8B.
Note that membranes probed for RPS6 and p-RPS6 were exposed simultaneously, as were corresponding membranes probed with β-actin. Western blot.
- https://cdn.elifesciences.org/articles/82810/elife-82810-fig8-data2-v1.xlsx
-
Figure 8—source data 3
Original Western blot scan of RPS6.
- https://cdn.elifesciences.org/articles/82810/elife-82810-fig8-data3-v1.zip
-
Figure 8—source data 4
Original Western blot scan of β-actin.
- https://cdn.elifesciences.org/articles/82810/elife-82810-fig8-data4-v1.zip
-
Figure 8—source data 5
Quantification of Western blot data.
Source data for Figure 8C.
- https://cdn.elifesciences.org/articles/82810/elife-82810-fig8-data5-v1.xlsx
-
Figure 8—source data 6
RT-qPCR data for ST2 stromal cells with Ksr2 shRNA vs. control shRNA, following osteoblast differentiation in the absence or presence of rapamycin.
Average fold changes plotted and t-test values are highlighted in yellow. Source data for Figure 8E.
- https://cdn.elifesciences.org/articles/82810/elife-82810-fig8-data6-v1.xlsx
-
Figure 8—source data 7
RT-qPCR data for ST2 stromal cells with Ksr2 OE vs. GFP, following osteoblast differentiation in the absence or presence of rapamycin.
Average fold changes plotted and t-test values are highlighted in yellow. Source data for Figure 8F, G.
- https://cdn.elifesciences.org/articles/82810/elife-82810-fig8-data7-v1.xlsx
-
Figure 8—source data 8
RT-qPCR data of 12-week-old Ksr2 knockout versus wild-type femur (hypoxia and Notch pathway-related genes).
Average fold changes plotted and t-test values are highlighted in yellow. Source data for Figure 8H.
- https://cdn.elifesciences.org/articles/82810/elife-82810-fig8-data8-v1.xlsx
Tables
Key resources table
| Reagent type (species) or resource | Designation | Source or reference | Identifiers | Additional information |
|---|---|---|---|---|
| Antibody | Anti-COL10A1 (rabbit polyclonal) | Abcam | Cat# ab58632; RRID:AB_879742 | IF (1:100) |
| Antibody | Anti-IBSP (rabbit polyclonal) | Dr. Reny Franceschi, University of Michigan | IF (1:100) rabbit serum | |
| Antibody | Anti-SPP1 (rabbit polyclonal) | Kerafast | Cat# ENH094-FP | IF (1:300) |
| Antibody | Anti-SP7/OSX (rabbit polyclonal) | Abcam | Cat# ab22552; RRID:AB_2194492 | IF (1:100) |
| Antibody | Anti-KSR2 (rabbit polyclonal) | Novus Biologicals | Cat# nbp1-83553; RRID:AB_11034779 | IF (1:100) |
| Antibody | Anti-goat IgG (H+L) (horse polyclonal) | Vector Laboratories | Cat# DI-3088; RRID:AB_2336400 | IF (1×) |
| Antibody | Anti-rabbit IgG (horse polyclonal) | Vector Laboratories | Cat# DI-1794; RRID:AB_2336784 | IF (1×) |
| Other | DAPI stain | Invitrogen | Cat# D1306; RRID:AB_2629482 | (1 µg/ml) |
| Antibody | Anti-S6 ribosomal protein (rabbit monoclonal) | Cell Signaling Technology | Cat# 2217; RRID:AB_331355 | WB (1:1000) |
| Antibody | Anti-phospho S6 ribosomal protein (rabbit polyclonal) | Cell Signaling Technology | Cat# 2215; RRID:AB331682 | WB (1:1000) |
| Antibody | Anti-β-actin (mouse monoclonal) | Sigma-Aldrich | Cat# A1978; RRID:AB476692 | WB (1:1000) |
| Antibody | Anti-rabbit IgG HRP (goat polyclonal) | Sigma-Aldrich | Cat# A9169; RRID:AB_258434 | WB (1:15,000) |
| Antibody | Anti-mouse IgG HRP (rabbit polyclonal) | Novus Biologicals | Cat# NB720-H; RRID:AB_524513 | WB (1:15,000) |
| Other | PINP-ELISA kit | Immunodiagnostic Systems | Cat# AC-33F1 | |
| Other | CTX-1-ELISA kit | Immunodiagnostic Systems | Cat# AC-06F1 | |
| Cell line (Mus musculus) | ST2 | ATCC | Cat# PTA-10431 | |
| Recombinant DNA reagent | pRRLin-CPPT-SFFV-E2A-GFP-wpre | Addgene | 12252; RRID:Addgene_12252 | |
| Recombinant DNA reagent | pCDNA3.1 KSR2 | Addgene | 25968; RRID:Addgene_25968 | |
| Other | shRNA for Ksr2 (Mus musculus) | MilliporeSigma | TRCN0000378606 | Refseq target: NM_001114545 |
| Other | shRNA control (Mus musculus) | MilliporeSigma | SHC002V |
Additional files
-
Supplementary file 1
Real-time quantitative PCR primers used in this study.
Methods Table 1.
- https://cdn.elifesciences.org/articles/82810/elife-82810-supp1-v1.xlsx
-
MDAR checklist
- https://cdn.elifesciences.org/articles/82810/elife-82810-mdarchecklist1-v1.docx
Download links
A two-part list of links to download the article, or parts of the article, in various formats.
Downloads (link to download the article as PDF)
Open citations (links to open the citations from this article in various online reference manager services)
Cite this article (links to download the citations from this article in formats compatible with various reference manager tools)
Contrasting effects of Ksr2, an obesity gene, on trabecular bone volume and bone marrow adiposity
eLife 11:e82810.
https://doi.org/10.7554/eLife.82810


