Future COVID19 surges prediction based on SARS-CoV-2 mutations surveillance
- High-Performance Computing Center, Oklahoma State University, United States
- Department of Physiological Sciences, Oklahoma State University, United States
- University College London School of Pharmacy, Pharmaceutical and Biological Chemistry, United Kingdom
- University College London Centre for Advanced Research Computing, United Kingdom
Figures
Figure 1 with 6 supplements
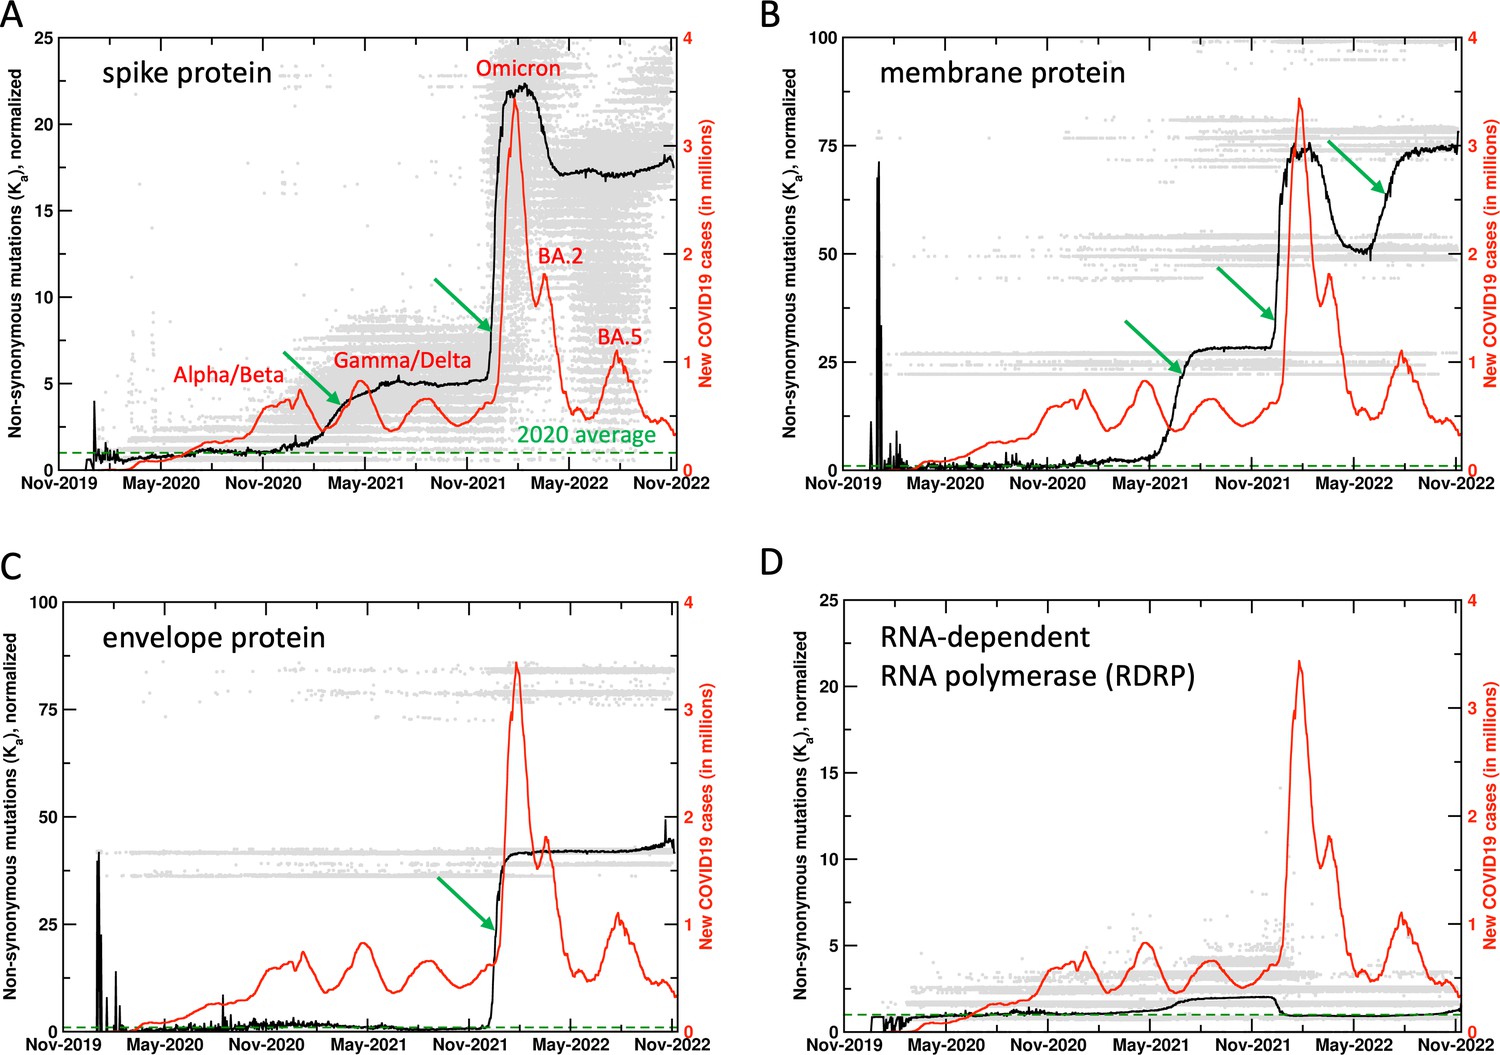
Mutations in SARS-CoV-2 proteins increase before COVID19 surges.
Non-synonymous mutations over the course of the COVID19 outbreak were identified by analysis of 6.4 million sequences. Gray dots indicate individual mutations, while black lines show weighted means for each day. Red lines show new COVID19 cases (averaged weekly) across the world. The green arrows mark the time when new mutations occurred in significant numbers before the outbreaks, allowing prediction of future outbreaks. The mutation values have been normalized using average of all mutations in the year 2020 (the first full year of the pandemic) as 1 (marked by dashed lines). Raw results are available in Figure 1—figure supplement 1. Values of 0 indicate same sequence as the Wuhan sequence, while larger values indicate more mutations. Note that each gray dot corresponds to a unique sequence, and there can be multiple records showing the same mutation. The weighted mean for the day is calculated by using all sequences reported for the day. The peaks for COVID19 cases are labeled with prevalent variants. Alpha/Beta, Omicron, and Omicron BA.2, BA.5 were the prevalent variants at the time of labeled peaks. For the two peaks in 2021 the case was less clear, with Gamma and Delta variants being observed at different times in different parts of the world.
Figure 1—figure supplement 1
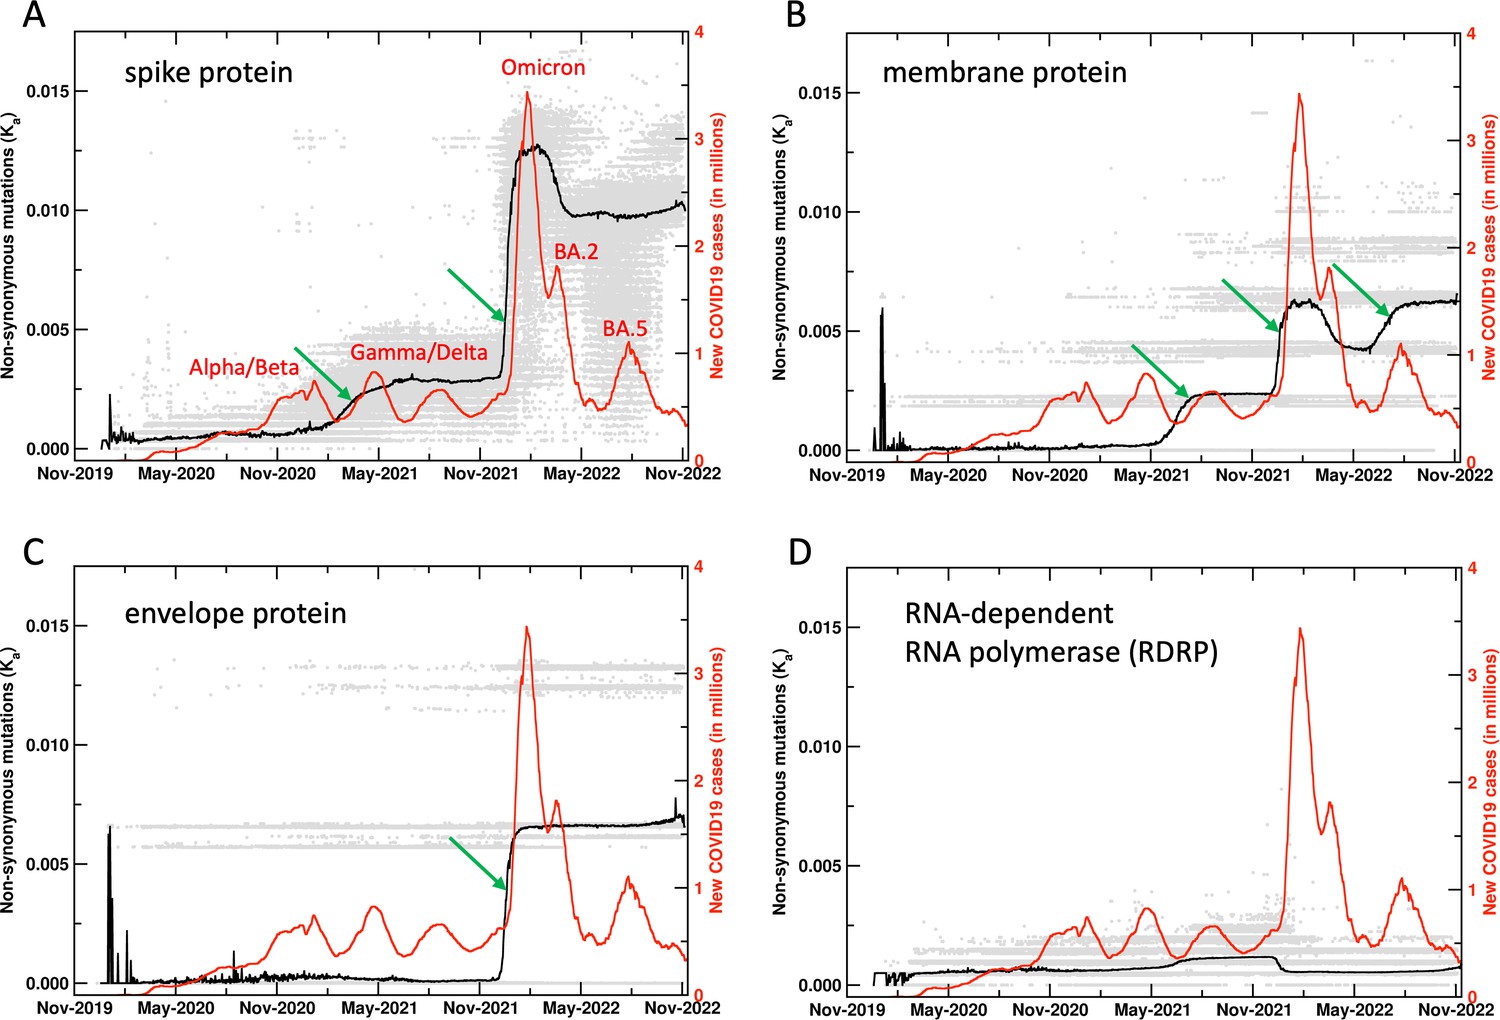
Unnormalized results for the mutations in SARS-CoV-2 proteins.
See Figure 1 in the main manuscript for more details. Here, the raw results for the four proteins are plotted for the non-synonymous mutations. Note that the same y-axis scale is used for comparison of the mutations across all the four proteins shown.
Figure 1—figure supplement 2

Ratio of non-synonymous mutations/synonymous mutations in SARS-CoV-2 proteins.
This commonly used indicator did not provide a reliable signal for surge prediction for most proteins. The ratio for only the membrane protein shows increase before the surges associated with some variants. The information from this ratio can be used as a secondary signal to support the primary signal from Ka.
Figure 1—figure supplement 3
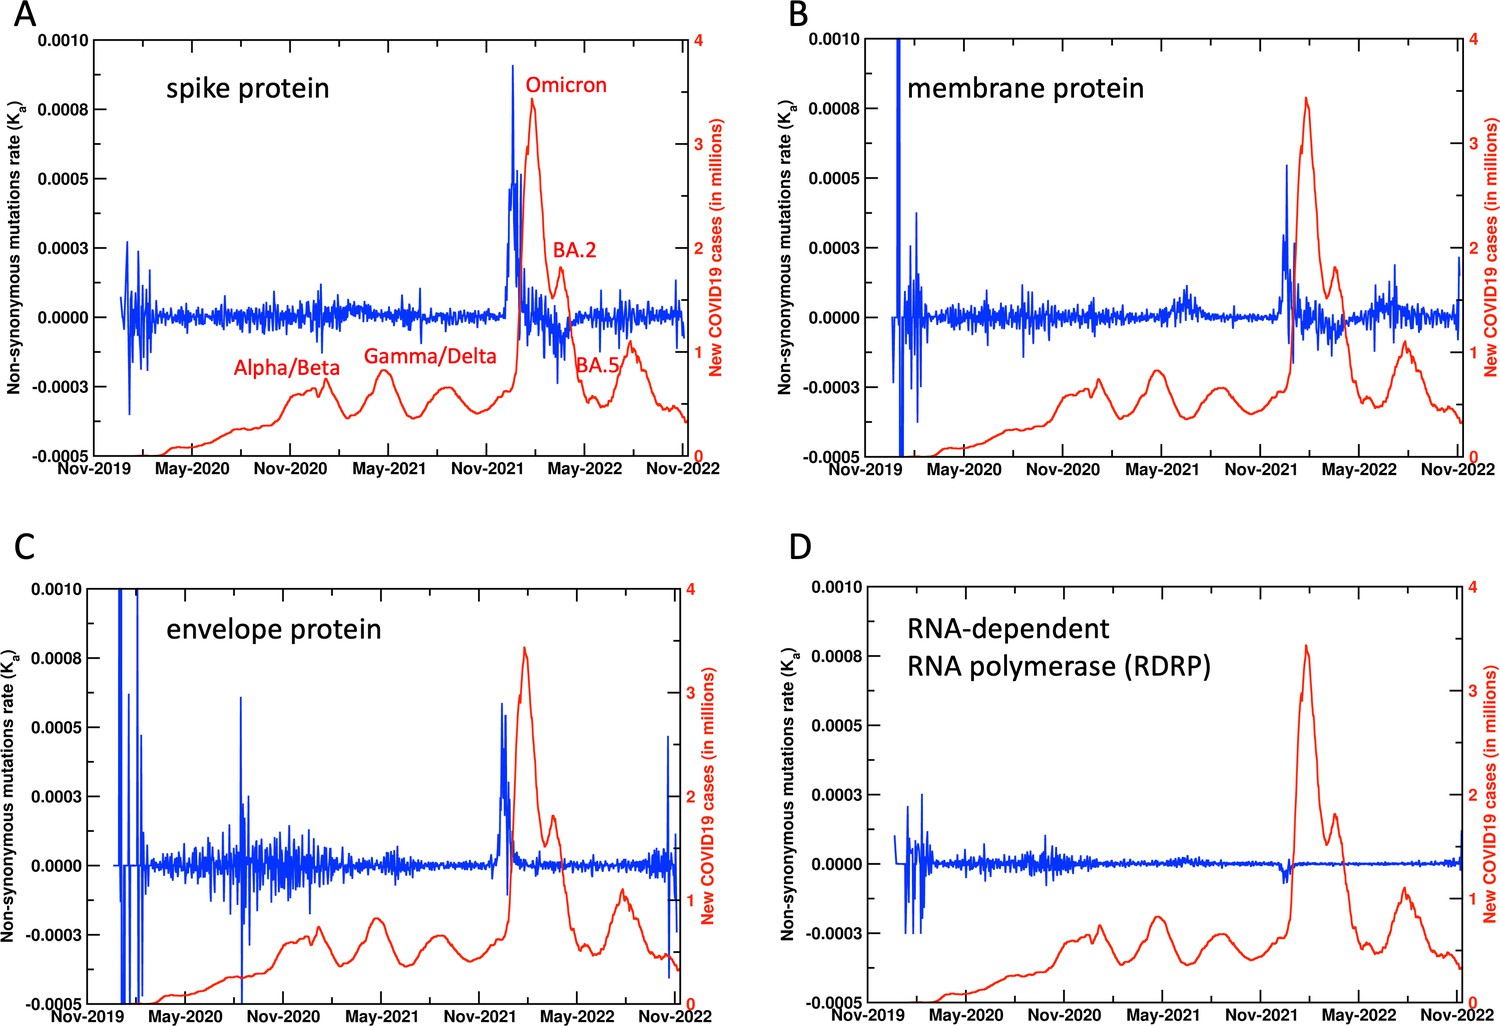
Daily rate of non-synonymous mutations in SARS-CoV-2 proteins.
The rate is calculated as a numerical derivative of data shown in Figure 1—figure supplement 1. The rate shows most noticeable increase before the Omicron surge, other periods are inconclusive. Note that the nature of ongoing current data is expected to be noisy (few samples, weightings that change over days), therefore, the rate of mutations appears to be unreliable in predicting surges.
Figure 1—figure supplement 4

Side-by-side comparison of various metrics considered in this study.
The quantities shown here are same as depicted in Figure 1 (main manuscript) and Figure 1—figure supplements 2 and 3. See the legends of other figures for details.
Figure 1—figure supplement 5
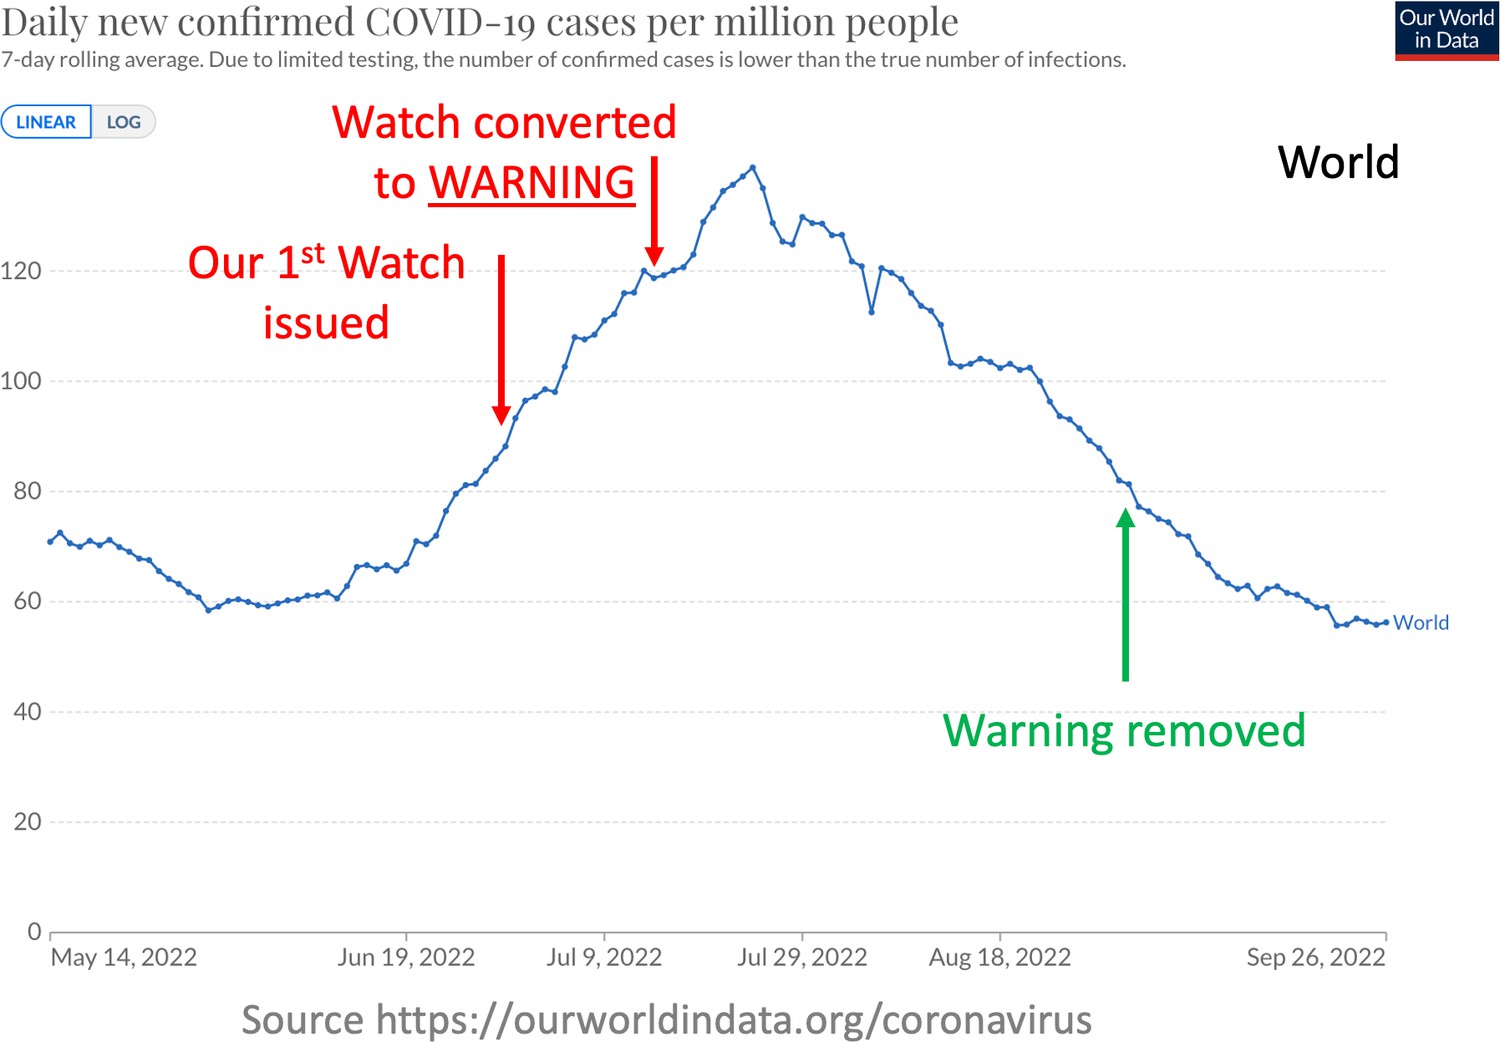
Performance of the surge watch and warning issued on June 29, 2022, and July 14, 2022, respectively.
The number of infection cases showed a sustained increase after the issue of our watch on June 29. This watch was elevated to a warning on July 14 (note, warning is considered more severe than a watch) and the number of cases showed a further increase. The warning was removed on August 30, 2022. The number of cases peaked roughly a month after our watch was issued.
Figure 1—figure supplement 6
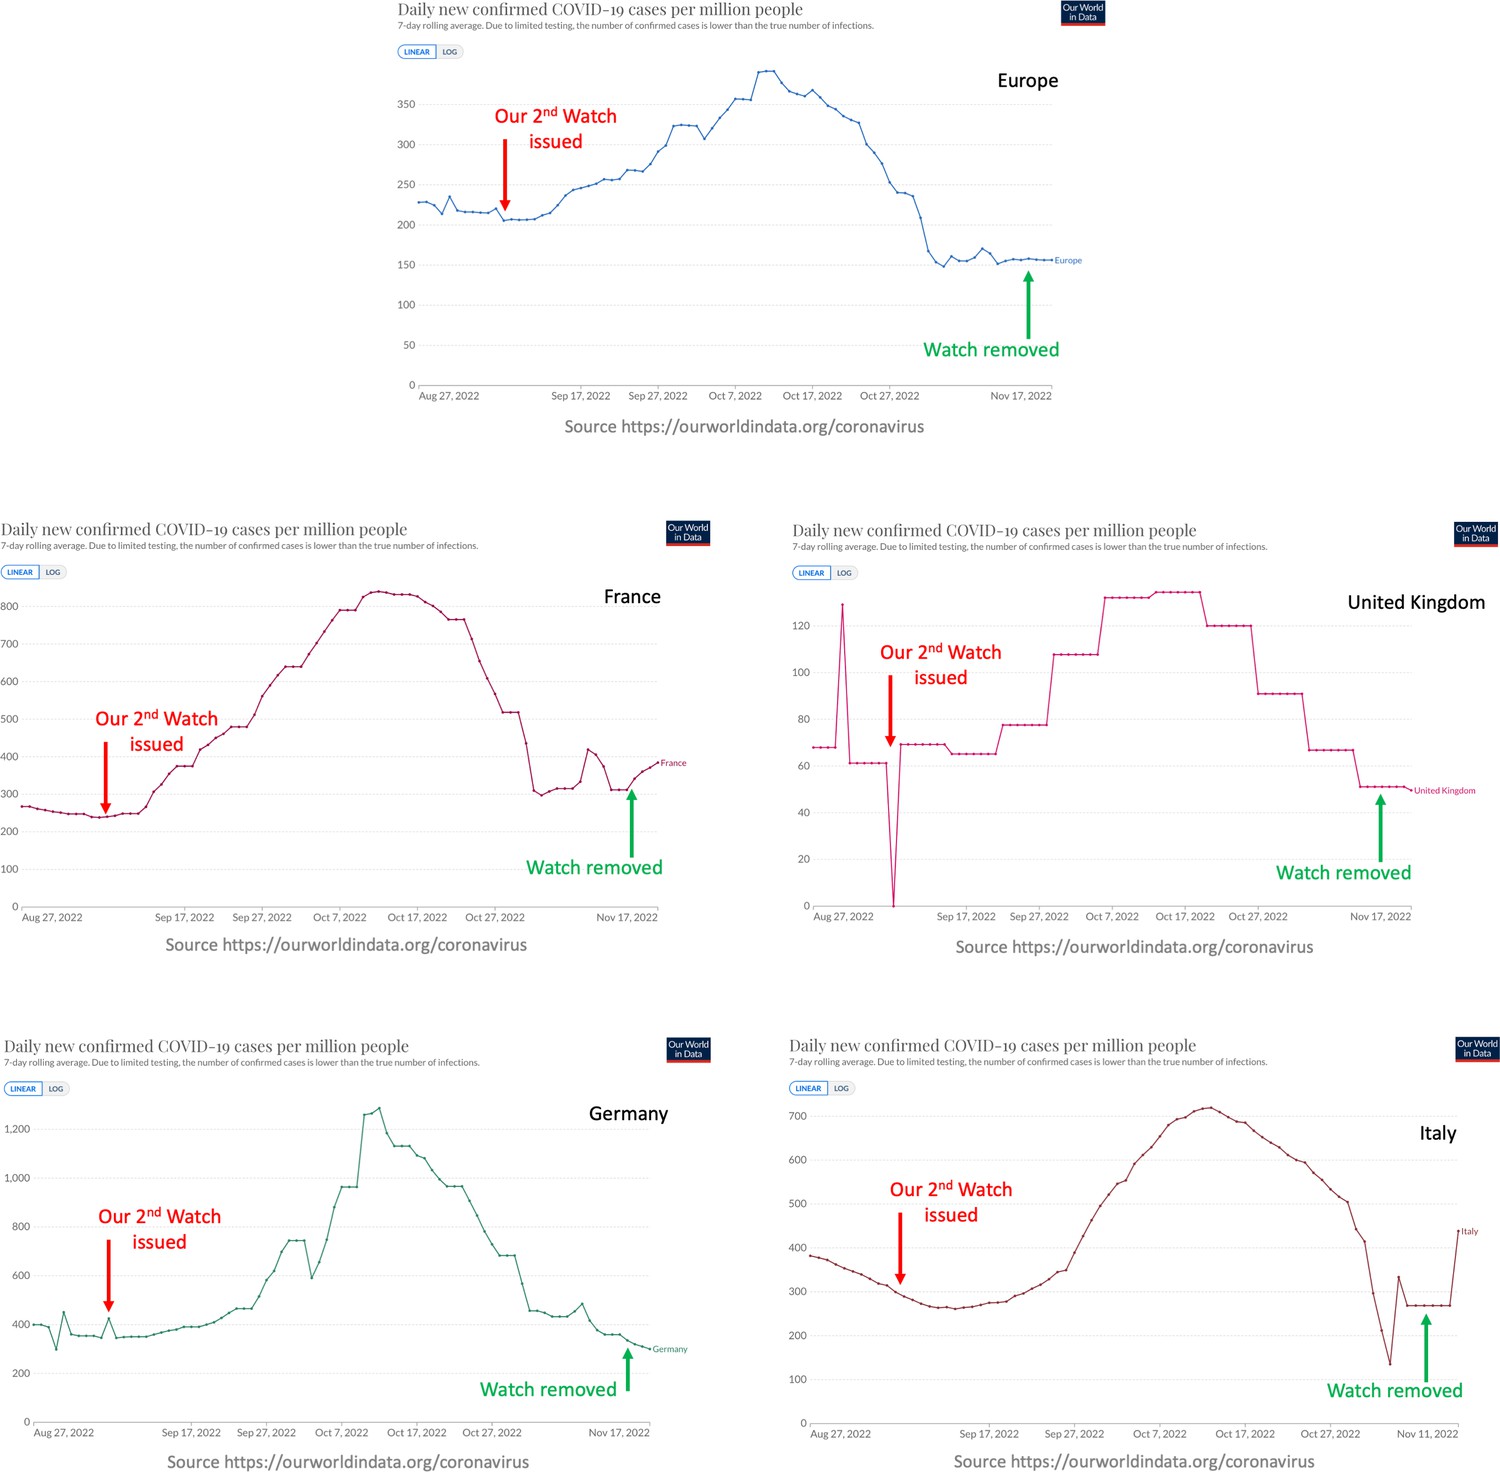
Performance of the surge watch issued on September 7, 2022.
The number of infection cases showed a sustained increase in Europe and several individual countries, after we issued our watch. The data did not warrant a further elevation and this watch was eventually removed on November 14, 2022.
Tables
Table 1
Number of unique records for the 26 proteins/open reading frames (ORFs).
Total number of quality-controlled SARS-CoV-2 sequences analyzed: 3,126,129 (as of November 21, 2022). Only three proteins showing the most relevant results and one other protein (marked by *) for comparison are depicted in the figures. These proteins are shown in bold.
| Name | Unique records |
|---|---|
| Envelope protein | 1314 |
| Membrane protein | 11,338 |
| Nucleocapsid protein | 70,579 |
| Spike protein | 188,166 |
| Non-structural protein 1 (NSP1), leader protein | 11,656 |
| NSP2 | 67,837 |
| NSP3 | 245,627 |
| NSP4 | 31,257 |
| NSP5, 3C-like proteinase | 11,879 |
| NSP6 | 16,479 |
| NSP7 | 1304 |
| NSP8 | 4490 |
| NSP9 | 2848 |
| NSP10 | 2429 |
| NSP11 | 88 |
| NSP12, RNA-dependent RNA polymerase (RDRP)* | 60,575 |
| NSP13, helicase | 35,421 |
| NSP14, 3'-to-5' exonuclease | 28,501 |
| NSP15, endoRNAse | 12,901 |
| NSP16, 2'-O-ribose methyltransferase | 7636 |
| ORF3a | 41,694 |
| ORF6 | 2117 |
| ORF7a | 9312 |
| ORF7b | 1368 |
| ORF8 | 7036 |
| ORF10 | 710 |
Additional files
Download links
A two-part list of links to download the article, or parts of the article, in various formats.
Downloads (link to download the article as PDF)
Open citations (links to open the citations from this article in various online reference manager services)
Cite this article (links to download the citations from this article in formats compatible with various reference manager tools)
Future COVID19 surges prediction based on SARS-CoV-2 mutations surveillance
eLife 12:e82980.
https://doi.org/10.7554/eLife.82980


