Down-regulated GAS6 impairs synovial macrophage efferocytosis and promotes obesity-associated osteoarthritis
- Department of Orthopedics, Academy of Orthopedics·Guangdong Province, Guangdong Provincial Key Laboratory of Bone and Joint Degeneration Diseases, The Third Affiliated Hospital of Southern Medical University, China
- Department of Joint Surgery, Center for Orthopedic Surgery, Orthopedic Hospital of Guangdong Province, The Third School of Clinical Medicine, Southern Medical University, The Third Affiliated Hospital of Southern Medical University, China
- Department of Biochemistry and Molecular Biology, School of Basic Medical Sciences, Southern Medical University, China
Figures
Figure 1
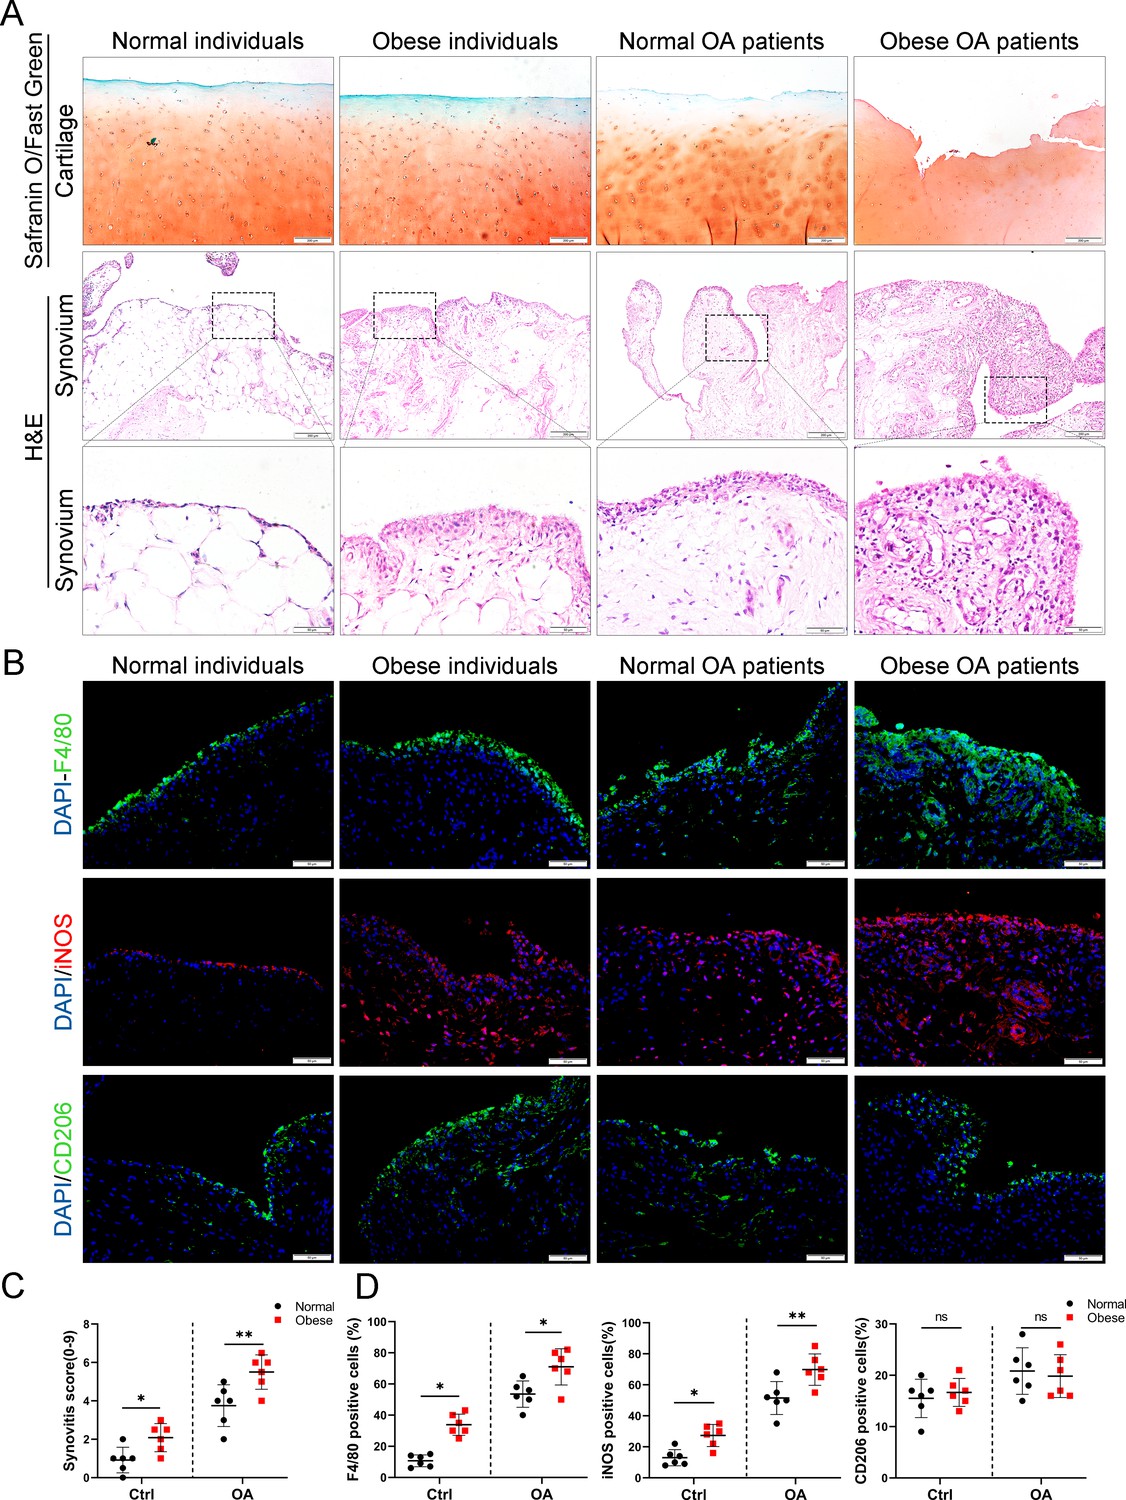
Synovial hyperplasia and macrophage polarization in obese OA patients.
(A) Safranin O and Fast Green staining (top) of human articular cartilage, hematoxylin and eosin (H&E) staining (lower) of synovial tissue from normal individuals, OA patients without obesity, obese individuals, and OA patients with obesity. Scale bar: 200 µm, 50 µm. (B) Immunofluorescence of F4/80, inducible nitric oxide synthase (iNOS), and CD206 in normal and OA synovial tissues from normal and obese patients. F4/80: green; iNOS: red; DNA: blue. Scale bar: 50 µm. (C) Quantification of synovitis score in normal individuals, OA patients without obesity, obese individuals, and OA patients with obesity (n = 6 per group). (D) Quantification of F4/80, iNOS, and CD206 positive macrophages as a proportion of total lining cell population in (B). *p < 0.05, **p < 0.01, ns = not significant. One-way analysis of variance (ANOVA) was performed. Data are shown as mean ± standard deviation (SD).
Figure 2 with 2 supplements
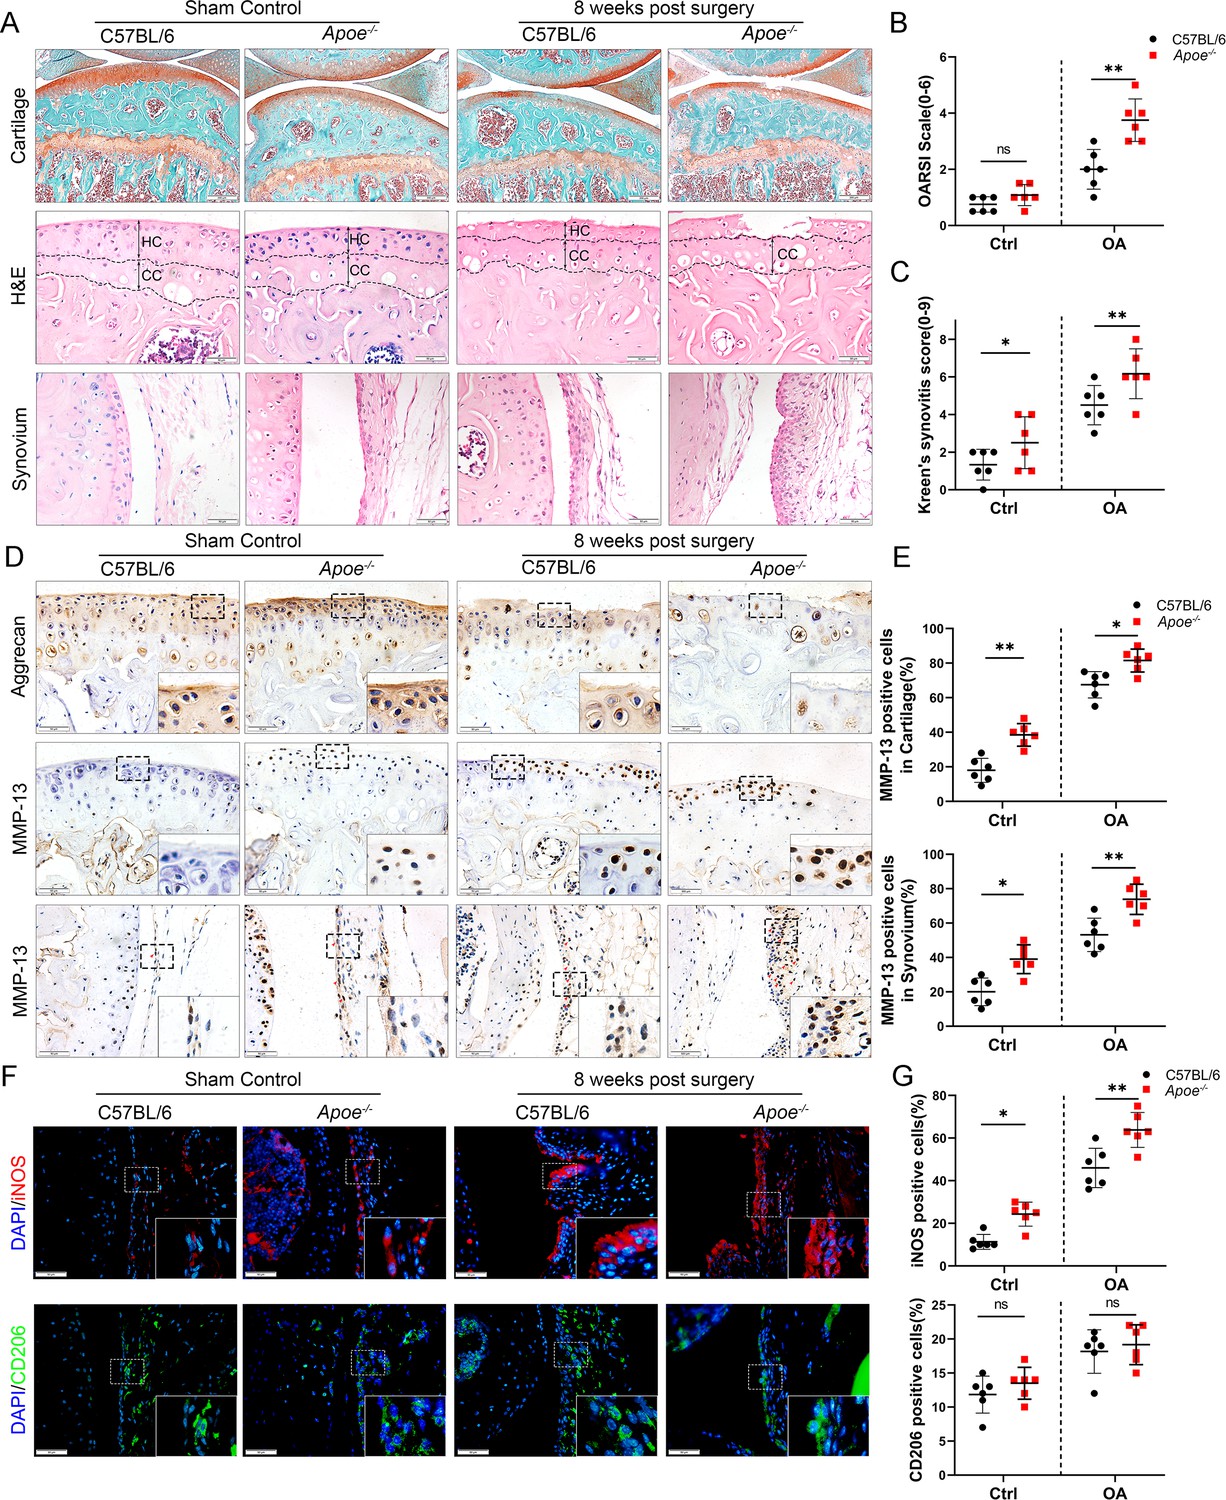
Cartilage loss, synovial hyperplasia, and macrophage polarization in Apoe−/− OA.
(A) Safranin O and Fast Green (first line) and hematoxylin and eosin (H&E; second line) staining of controls and destabilization of medial meniscus (DMM) knee cartilage or synovial membrane from normal and Apoe−/− mice. Scale bar: 200 µm, 50 µm. (B) Quantitative analysis of Osteoarthritis Research Society International (OARSI) scale in A (second line), n = 6 per group. (C) Synovitis score for joints described in (A) (third line), n = 6 per group. (D) Immunohistochemical staining for aggrecan (first line) and MMP-13 (middle and bottom) in controls and DMM knee cartilage from normal and Apoe−/− mice. Scale bar: 50 µm. (E) Quantification of MMP13-positive cells from cartilage or synovium in (D), n = 6 per group. (F) Immunofluorescence staining for inducible nitric oxide synthase (iNOS; first line) and CD206 (second line) in controls and DMM synovial tissues from normal and Apoe−/− mice. Scale bar: 50 µm; (G) Quantification of iNOS- and CD206-positive cells as a proportion of lining cell population in (F), n = 6 per group. *p < 0.05, **p < 0.01, ns = not significant. One-way analysis of variance (ANOVA) was performed. Data are shown as mean ± standard deviation (SD).
Figure 2—figure supplement 1
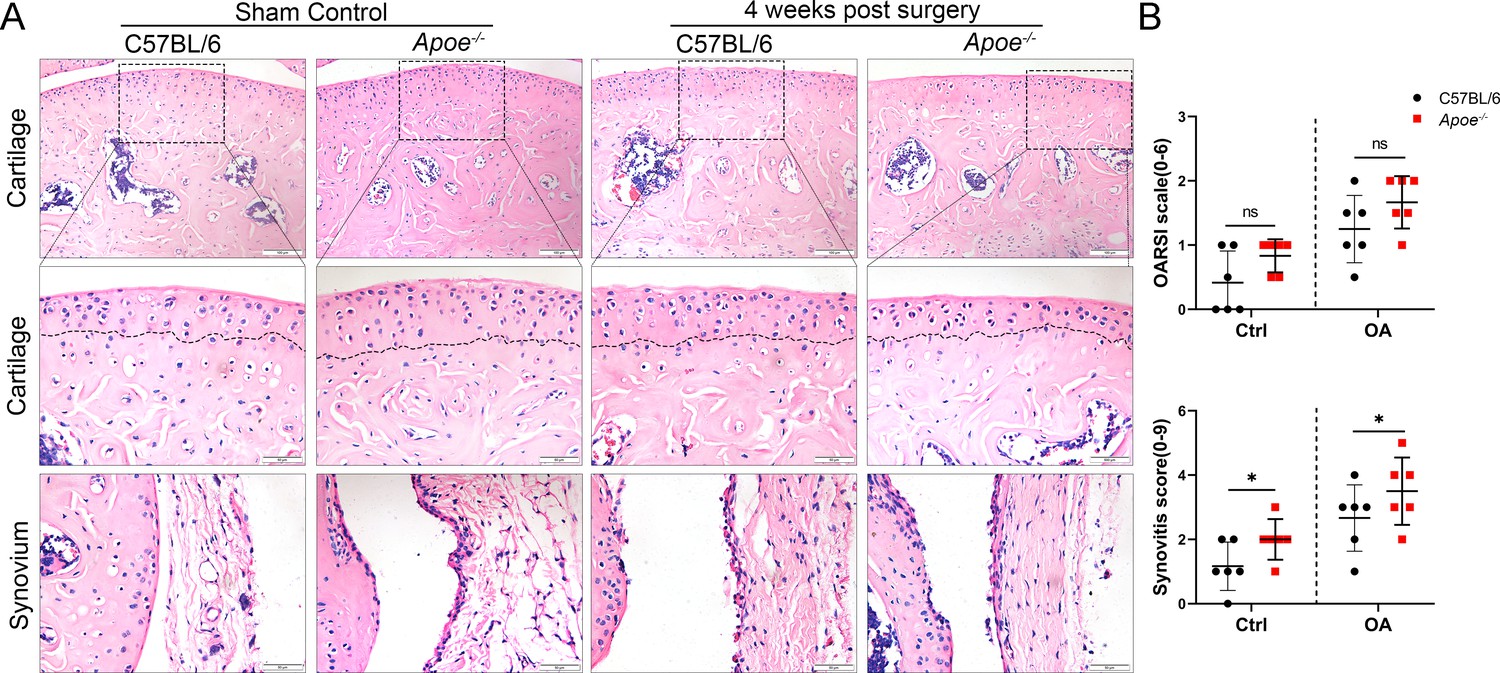
Cartilage loss and synovial hyperplasia in 4 week-old Apoe−/− OA mice.
(A) Hematoxylin and eosin (H&E) staining of cartilage and synovial tissue in controls and destabilization of medial meniscus (DMM) from normal and Apoe−/− mice 4 weeks after surgery. Scale bar: 200 µm, 50 µm. (B) Quantitative analysis of Osteoarthritis Research Society International (OARSI) scale and synovitis score described in (A). n = 6 per group. *p < 0.05, ns = not significant. One-way analysis of variance (ANOVA) was performed. Data are shown as mean ± standard deviation (SD).
Figure 2—figure supplement 2
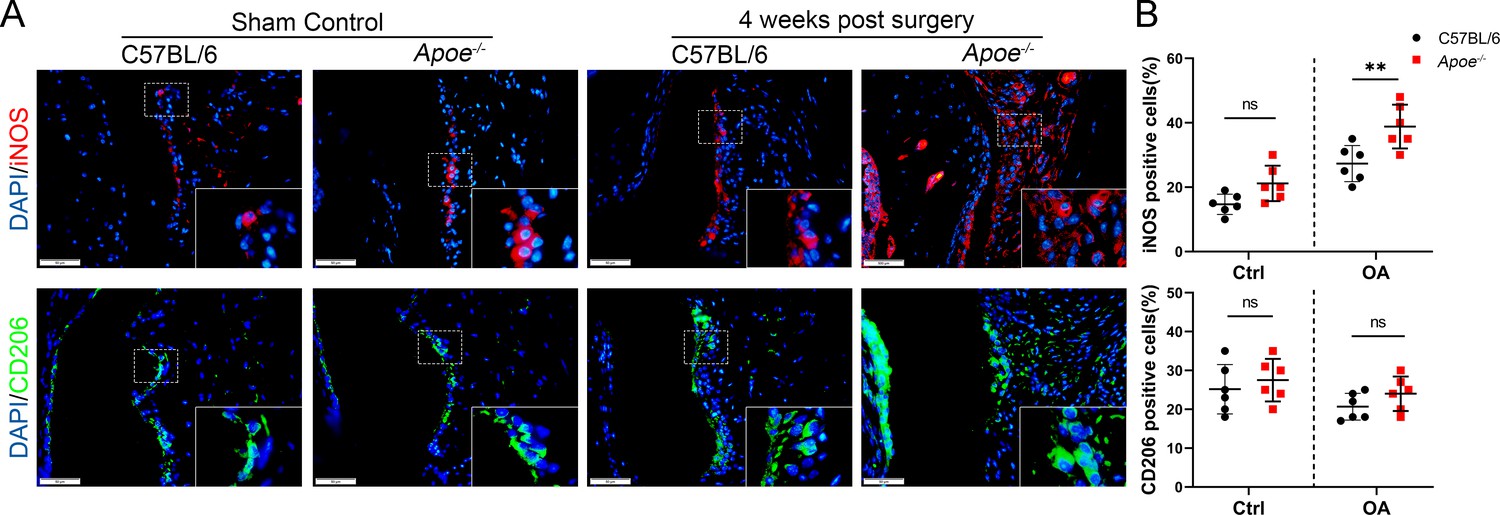
Macrophage polarization in 4 week-old Apoe−/− OA mice.
(A) Immunofluorescence of inducible nitric oxide synthase (iNOS) and CD206 in controls and destabilization of medial meniscus (DMM) synovial tissues from normal and Apoe−/− mice 4 weeks after surgery. Scale bar: 50 µm. (B) Quantification of iNOS- and CD206-positive cells as a proportion of lining cells in (A). n = 6 per group. **p < 0.01, ns = not significant. One-way analysis of variance (ANOVA) was performed. Data are shown as mean ± standard deviation (SD).
Figure 3 with 3 supplements
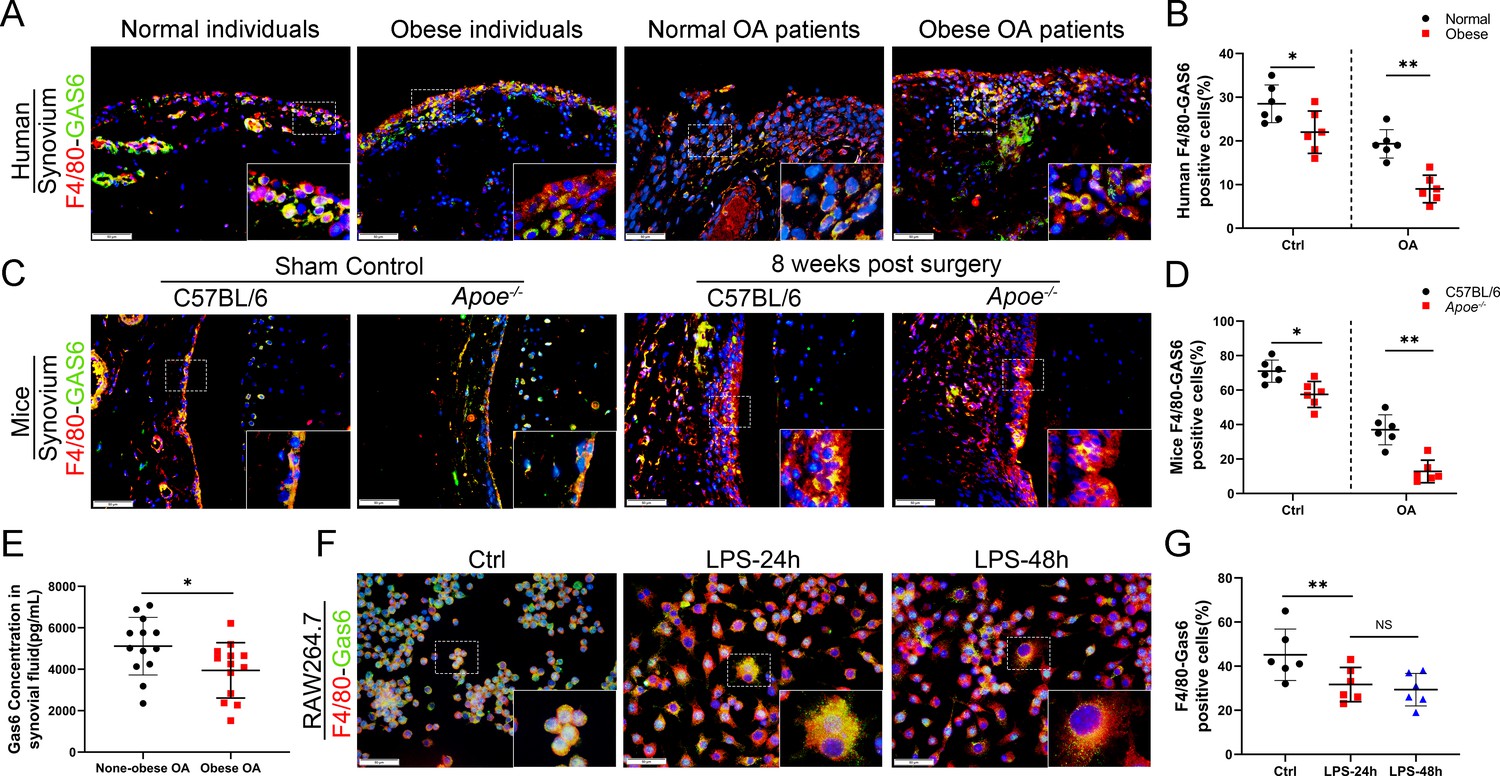
Loss of GAS6 expression in synovium of obese OA patients and Apoe−/− OA mice.
(A) Immunofluorescence staining for F4/80 (red) and GAS6 (green) in synovial tissue from normal individuals, OA patients without obesity, obese individuals, and OA patients with obesity. Scale bar: 50 µm. (B) Quantification of F4/80-GAS6-positive macrophages as a proportion of total lining cell population in (A), n = 6 per group. (C) Immunofluorescence staining (first line) for F4/80 (red) and GAS6 (green) in synovial tissue of controls and destabilization of medial meniscus (DMM) from C57BL/6 and Apoe−/− mice. Scale bar: 50 µm. (D) Quantification of F4/80-GAS6-positive macrophages (yellow) as a proportion of total F4/80-positive cells in (C) (first line). Quantification of GAS6-positive cells in (C) (second line), n = 6 per group. (E) Enzyme-linked immunosorbent assay (ELISA) for GAS6 in synovial fluid of non-obese and obese OA patients, n = 13 per group. (F) Immunofluorescence staining for F4/80(red) and GAS6 (green) in RAW264.7 cells treated with LPS for 24 and 48 hr. Scale bar: 50 µm. (G) Quantification of F4/80-GAS6-positive macrophages (yellow) as a proportion of total F4/80-positive cells (red), n = 6 per group. *p < 0.05, **p < 0.01, NS = not significant. One-way analysis of variance (ANOVA) was performed. Data are shown as mean ± standard deviation (SD).
Figure 3—figure supplement 1

Differentially expressed mRNA in bone marrow-derived macrophages from normal controls or LPS treatment based on GSE53986.
-
Figure 3—figure supplement 1—source data 1
Results of GSE53986.
- https://cdn.elifesciences.org/articles/83069/elife-83069-fig3-figsupp1-data1-v2.zip
Figure 3—figure supplement 2
The expression of GAS6 and inflammatory cytokines in M1/M2 polarized macrophages.
(A) Relative mRNA expression level of GAS6 in LPS-treated RAW264.7 cells, n = 3 per group. (B) Western blot and quantification of CD86, inducible nitric oxide synthase (iNOS), and GAS6 in RAW264.7 cells after LPS or IL-4 stimulation, n = 3 per group. (C) Relative mRNA expression level of IL-1β, IL-6, and TNF-α in LPS, rmGAS6, or R428-treated RAW264.7 cells, n = 6 per group. *p < 0.05, **p < 0.01, ***p < 0.001, ****p < 0.0001. One-way analysis of variance (ANOVA) was performed. Data are shown as mean ± standard deviation (SD).
-
Figure 3—figure supplement 2—source data 1
Primary blots related to Figure 3—figure supplement 2.
- https://cdn.elifesciences.org/articles/83069/elife-83069-fig3-figsupp2-data1-v2.zip
Figure 3—figure supplement 3

AXL expression in synovium of obese OA patients and Apoe−/− OA mice.
(A) Immunofluorescence of F4/80 (red) and AXL (green) in synovial tissue from normal individuals, osteoarthritis (OA) patients without obesity, obese individuals, and OA patients with obesity. Scale bar: 50 µm. (C) Immunofluorescence staining of F4/80 (red) and AXL (green) in synovial tissue in controls and destabilization of medial meniscus (DMM) cartilage from C57BL/6 and Apoe−/− mice. Scale bar: 50 µm. (B, D) Quantification of F4/80-AXL positive macrophages (yellow) as a proportion of total F4/80-positive cells in (A, C), n = 6 per group. ns = not significant. One-way analysis of variance (ANOVA) was performed. Data are shown as mean ± standard deviation (SD).
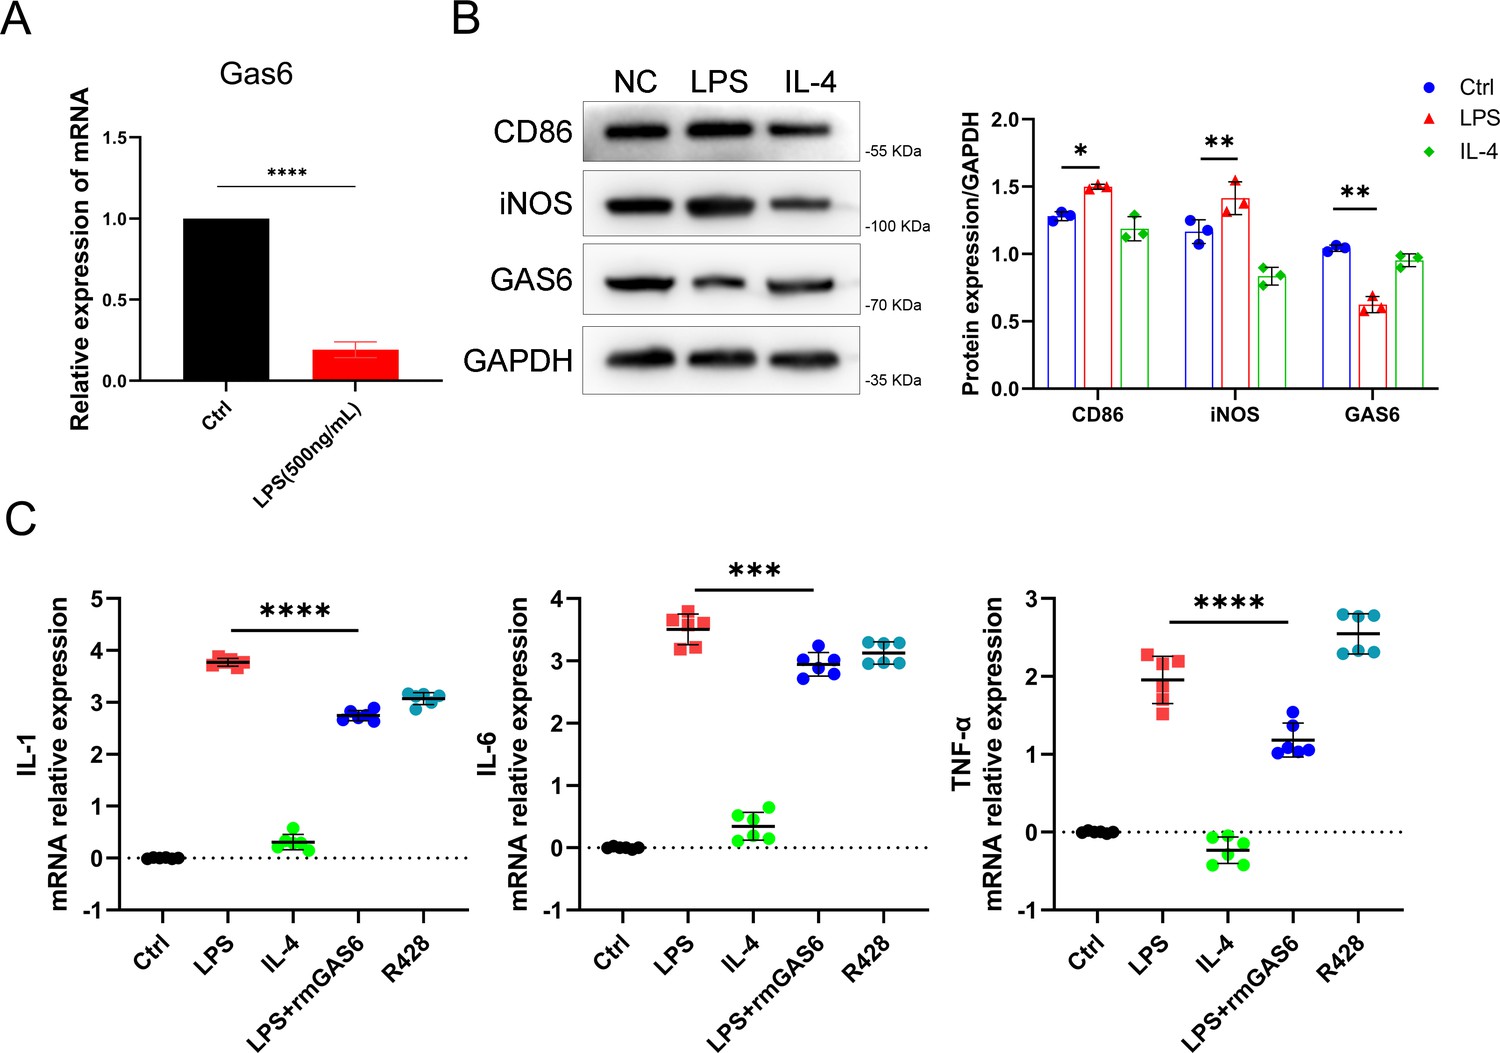
Figure 4 with 3 supplements
Accumulation of apoptotic cells in OA and impaired phagocytic ability of M1-polarized macrophages.
(A) Immunofluorescence staining for caspase-3 (top) and TUNEL (lower) in normal and OA synovial tissue from non-obese and obese patients. Scale bar: 50 µm. (B) Quantification of caspase-3- or TUNEL-positive cells as a proportion of total lining cell population in (A), n = 6 per group. (C) Immunofluorescence staining for caspase-3 (top) and TUNEL (lower) in controls and destabilization of medial meniscus (DMM) synovial tissue from C57BL/6 and Apoe−/− mice. Scale bar: 50 µm. (D) Quantification of caspase-3- or TUNEL-positive cells as a proportion of lining cell population in (C), n = 6 per group. (E) Immunofluorescence staining for F4/80 (red) in bone marrow-derived macrophages (BMDMs) extracted from Apoe−/− and C57BL/6 mice. Carboxyfluorescein succinimidyl ester (CFSE; green) in apoptotic thymocytes of C57BL/6 mice after 2 hr phagocytosis. (F) Quantification of positive BMDMs engulfing apoptotic thymocytes as a proportion of total F4/80-positive cells, n = 5 per group. (G) mRNA expression levels of inducible nitric oxide synthase (iNOS) or Arg1 after LPS, rmGAS6, or IL-4 stimulation for 24 hr. (H) Immunofluorescence staining for F4/80 (red) in RAW264.7 cells and CFSE (green) in apoptotic thymocytes after phagocytosis for 2 hr. Scale bar: 50 µm. (I) Flow cytometry analysis of CFSE-positive cells in total macrophages is shown as fluorescence‐intensity distribution plots. (J) Quantification of positive RAW264.7 cells engulfing apoptotic thymocytes as a proportion of total F4/80-positive cells, n = 6 per group. (K) Efferocytotic index was calculated as percentage of CFSE‐positive cells divided by percentage of total cells, n = 5 per group. *p < 0.05, **p < 0.01, ***p < 0.001, NS = not significant. One-way analysis of variance (ANOVA) was performed. Data are shown as mean ± standard deviation (SD).
Figure 4—figure supplement 1

The expression of MER decreased in obese OA patients and Apoe−/− OA mice.
(A) Immunofluorescence staining for F4/80 (red) and MER (green) in synovial tissue from normal individuals; osteoarthritis (OA) patients without obesity; obese individuals, and OA patients with obesity. Scale bar: 50 µm. (B) Quantification of F4/80-MER-positive macrophages as a proportion of total F4/80-positive lining cell population in (A), n = 6 per group. (C) Immunofluorescence staining for F4/80 (red) and MER (green) in synovial tissue of controls and destabilization of medial meniscus (DMM) from C57BL/6 and Apoe−/− mice. Scale bar: 50 µm. (D) Quantification of F4/80-MER-positive macrophages (yellow) as a proportion of total F4/80-positive cells in (C). n = 6 per group. *p < 0.05. One-way analysis of variance (ANOVA) was performed. Data are shown as mean ± standard deviation (SD).
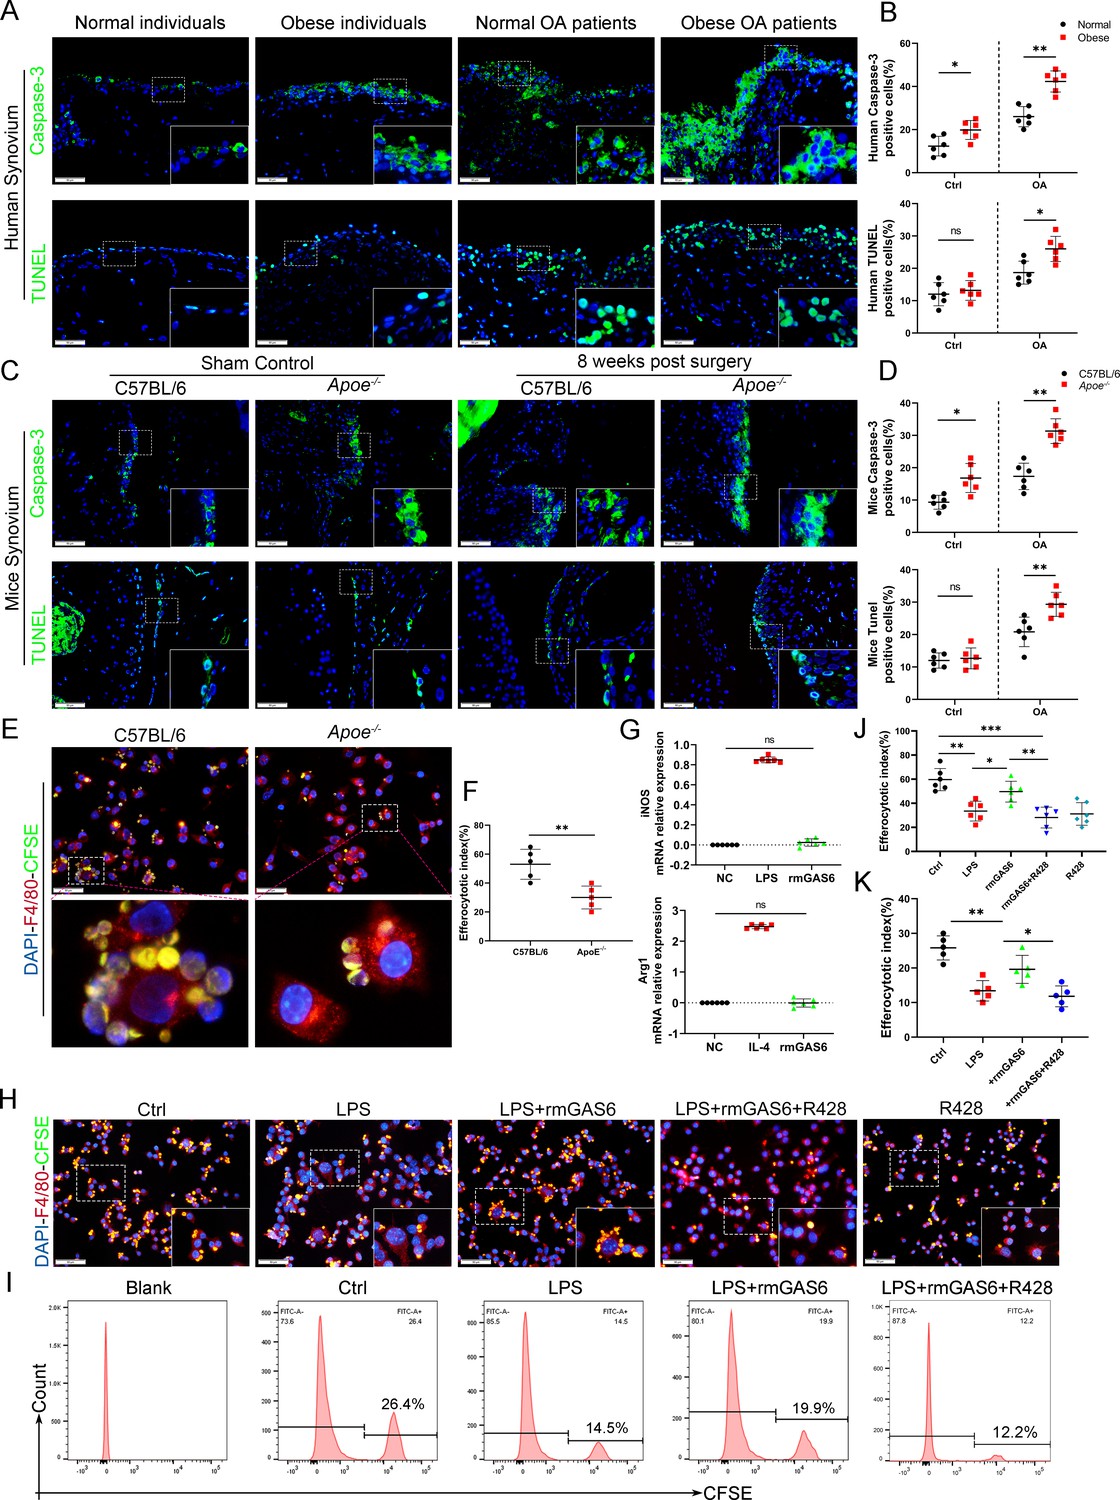
Figure 4—figure supplement 2
rmGAS6 attenuated the impaired efferocytosis induced by LPS.
(A) Immunofluorescence staining for F4/80 (red) in bone marrow-derived macrophage (BMDM) cells and carboxyfluorescein succinimidyl ester (CFSE; green) in apoptotic thymocytes after phagocytosis for 2 hr. Scale bar: 50 µm. (B) Quantification of positive BMDM cells engulfing apoptotic thymocytes as a proportion of total F4/80-positive cells, n = 5 per group. (C) Flow cytometry analysis of CFSE-positive cells in total macrophages is shown as fluorescence‐intensity distribution plots. *p < 0.05, **p < 0.01, NS = not significant. One-way analysis of variance (ANOVA) was performed. Data are shown as mean ± standard deviation (SD).
Figure 4—figure supplement 3
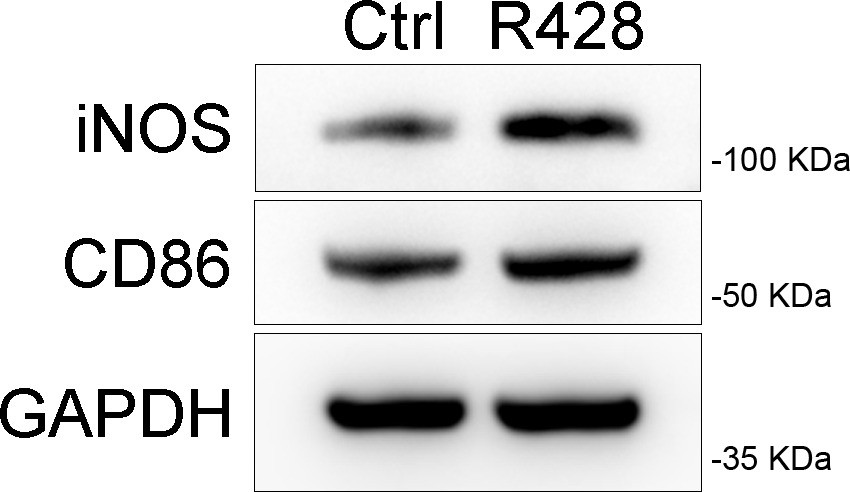
Western blot of CD86, inducible nitric oxide synthase (iNOS) in RAW264.7 cells after R428 stimulation.
-
Figure 4—figure supplement 3—source data 1
Primary blots related to Figure 4—figure supplement 3.
- https://cdn.elifesciences.org/articles/83069/elife-83069-fig4-figsupp3-data1-v2.zip
Figure 5 with 3 supplements

GAS6 restored osteoarthritis (OA) cartilage loss and decreased apoptotic cell accumulation.
(A) Safranin O and Fast Green staining (top and middle) of knee cartilage, hematoxylin and eosin (H&E) staining of synovial tissues from destabilization of medial meniscus (DMM) mice and DMM mice treated with R428, and Apoe−/− mice treated with recombinant mouse (rmGAS6) 8 weeks after surgery. Scale bar: 200 µm, 50 µm. (B) Quantitative analysis of Osteoarthritis Research Society International (OARSI) scale and synovitis score in (A), n = 6 per group. (C) Immunofluorescence staining of caspase-3 or TUNEL in synovial tissue from DMM mice, DMM mice treated with R428, and Apoe−/− mice treated with recombinant mouse (rmGAS6) 8 weeks after surgery. Scale bar: 50 µm. (D) Quantification of caspase-3- or TUNEL-positive cells as a proportion of lining cell population in (C), n = 6 per group. *p < 0.05, **p < 0.01. One-way analysis of variance (ANOVA) was performed. Data are shown as mean ± standard deviation (SD).
Figure 5—figure supplement 1

Immunoblotting and quantification of MMP13, COL2, and senescence markers (p16, p21) in primary chondrocytes treated with supernatant from bone marrow-derived macrophages (BMDMs) which co-cultured with apoptotic cells (ACs) or rmGAS6 and R428.
*p < 0.05, **p < 0.01. One-way analysis of variance (ANOVA) was performed. Data are shown as mean ± standard deviation (SD).
-
Figure 5—figure supplement 1—source data 1
Primary blots related to Figure 5—figure supplement 1.
- https://cdn.elifesciences.org/articles/83069/elife-83069-fig5-figsupp1-data1-v2.zip
Figure 5—figure supplement 2

Safranin O staining of human tibial plateaus cartilage explants treated with rhGAS6.
Scale bar: 100 µm.
Figure 5—figure supplement 3

Immunoblotting of MMP13, COL2, and senescence markers (p16, p21) in primary chondrocytes treated with rhGAS6.
-
Figure 5—figure supplement 3—source data 1
Primary blots related to Figure 5—figure supplement 3.
- https://cdn.elifesciences.org/articles/83069/elife-83069-fig5-figsupp3-data1-v2.zip
Figure 6
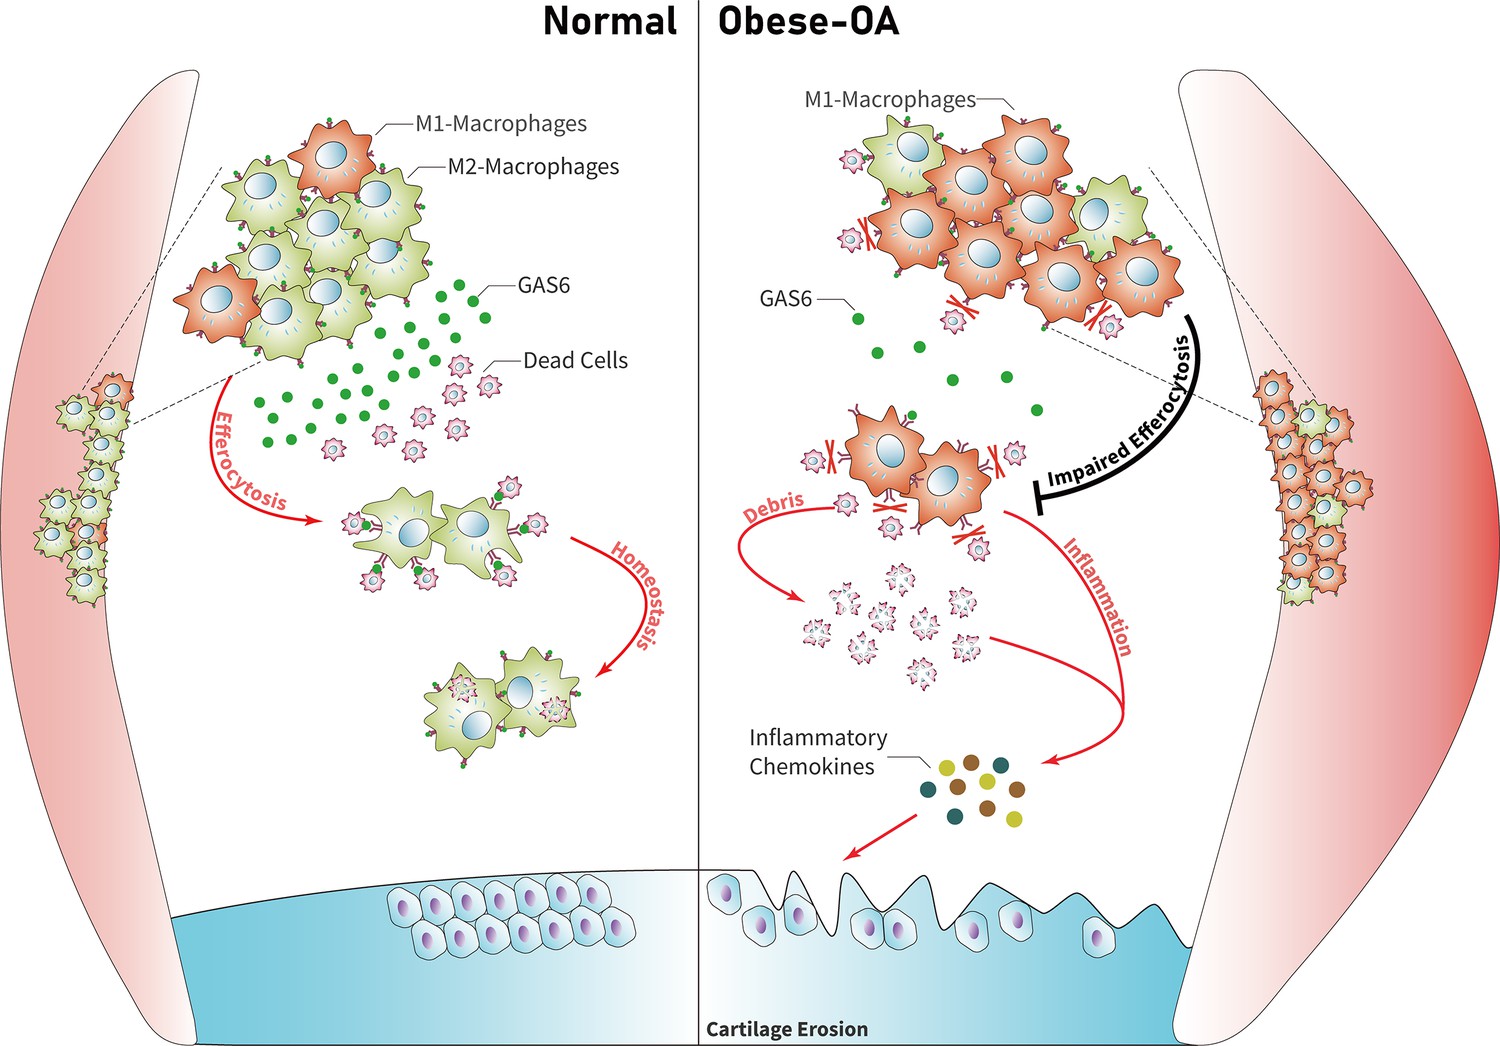
Model of GAS6 secreted by macrophages in modulating clearance of apoptotic cells and macrophage polarization during osteoarthritis (OA).
Macrophage polarization induced by obesity decreased the secretion of GAS6 and impaired the phagocytosis of apoptotic cells. The accumulation of apoptotic cell debris leads to the persistence of local inflammation and synovial hyperplasia, which aggravates the pathological process of OA.
Tables
Table 1
Blood lipids in obesity-related patients and general patients.
| Normal individuals | OA patients without obesity | Obese individuals | OA patients with obesity | |
|---|---|---|---|---|
| Total cholesterol (TC) (3.0–6.0) | 4.81 ± 0.7 | 4.7 ± 0.54 | 6.34 ± 0.79 | 6.2 ± 0.86 |
| Triglyceride (TG) (0.56–1.7) | 1.34 ± 0.32 | 1.45 ± 0.21 | 4.3 ± 0.25 | 3.19 ± 0.48 |
| BMI index | 22.9 ± 0.35 | 23.5 ± 0.22 | 28.6 ± 0.17 | 28.4 ± 0.21 |
Table 2
Comparison of specifications and energy of ordinary feed and high-fat feed.
| Ordinary feed | High-fat feed | |||
|---|---|---|---|---|
| Composition | g (%) | kcal (%) | g (%) | kcal (%) |
| Protein | 19.2 | 20 | 24 | 20 |
| Carbohydrate | 67.3 | 70 | 41 | 35 |
| Fat | 4.3 | 10 | 24 | 45 |
| Total | 100 | 100 | ||
| kcal/g | 3.85 | 4.73 | ||
Table 3
Lipid status of APOE−/− obese mice and C57BL/6 mice.
| Apoe−/− mice | C57BL/6 mice | |
|---|---|---|
| Total cholesterol (TC) (3.0–6.0) | 17.82 ± 3.3 | 2.77 ± 0.62 |
| Triglyceride (TG) (0.56–1.7) | 2.56 ± 0.43 | 0.92 ± 0.31 |
Table 4
Weight gain after feeding for 8 weeks (g).
| C57BL/6 mice | Apoe−/− mice | |
|---|---|---|
| Standard diet | 7.35 ± 1.22 | 9.13 ± 0.78 |
| High-fat diet | 16.89 ± 0.75 | 19.81 ± 1.33 |
Key resources table
| Reagent type (species) or resource | Designation | Source or reference | Identifiers | Additional information |
|---|---|---|---|---|
| Cell line (Mus musculus) | RAW264.7 | Pricella | HC2022083021 | Cell line has been authenticated by STR profiling and it did not be contaminated by mycoplasma |
| Antibody | anti-F4/80 (Mouse monoclonal) | Santa Cruz Biotechnology | Cat #: sc377009 | IF (1:100) |
| Antibody | anti-iNOS (Mouse monoclonal) | Santa Cruz Biotechnology | Cat #: sc-7271 | IF (1:100) |
| Antibody | anti-Aggrecan (Rabbit polyclonal) | Proteintech | Cat #: 13880-1-AP | IF (1:200) |
| Antibody | anti-MMP13 (Rabbit polyclonal) | Proteintech | Cat #: 18165-1-AP | IF (1:400) WB (1:1000) |
| Antibody | anti-CD206 (Rabbit polyclonal) | Proteintech | Cat #: 18704-1-AP | IF (1:100) |
| Antibody | anti-AXL (Rabbit polyclonal) | Abclone | Cat #: A20548 | IF (1:100) |
| Antibody | anti-CASPASE-3 (Rabbit polyclonal) | Proteintech | Cat #: 19677-1-AP | IF (1:200) |
| Antibody | anti-GAS6 (Rabbit polyclonal) | Abclone | Cat #: A8545 | IF (1:100) |
| Antibody | Peroxidase AffiniPure Goat Anti-Rabb (Goat polyclonal) | Jackson Immuno Research Laboratories | Cat #: 11-035-003 | IHC (1:200) WB (1:3000) |
| Antibody | Goat anti-Rabbit IgG (H+L) Cross-Adsorbed Secondary Antibody, Alexa Fluo 488 (Goat polyclonal) | Invitrogen | Cat #: A-11008 | IF (1:400) |
| Antibody | Goat anti-Mouse IgG (H+L) Cross-Adsorbed Secondary Antibody, Alexa Fluor 594 (Goat polyclonal) | Invitrogen | Cat #: A-11005 | IF (1:400) |
| Antibody | Anti-Collagen II antibody (Rabbit polyclonal) | Abcam | Cat #: ab188570 | WB (1:1000) |
| Sequence-based reagent | Gas6_F | This paper | PCR primers | CCGCGCCTACCAAGTCTTC |
| Sequence-based reagent | Gas6_R | This paper | PCR primers | CGGGGTCGTTCTCGAACAC |
| Sequence-based reagent | Gapdh _F | This paper | PCR primers | AAATGGTGAAGGTCGGTGTGAAC |
| Sequence-based reagent | Gapdh _R | This paper | PCR primers | CAACAATCTCCACTTTGCCACTG |
| Sequence-based reagent | Il-1β_F | This paper | PCR primers | GCAACTGTTCCTGAACTCAACT |
| Sequence-based reagent | Il-1β_R | This paper | PCR primers | ATCTTTTGGGGTCCGTCAACT |
| Sequence-based reagent | Il-6_F | This paper | PCR primers | ACAACCACGGCCTTCCCTACTT |
| Sequence-based reagent | Il-6_R | This paper | PCR primers | CAGGATTTCCCAGCGAACATGTG |
| Sequence-based reagent | Tnf-α_F | This paper | PCR primers | CCTCCCTCTCATCAGTTCTA |
| Sequence-based reagent | Tnf-α_R | This paper | PCR primers | ACTTGGTTTGCTACGAC |
| Commercial assay or kit | TUNEL Apoptosis Detection Kit (Alexa Fluor 488) | Yeasen | Cat #: 40307ES20 | - |
| Commercial assay or kit | Human Gas6 DuoSet ELISA | R&D | Cat #: DY885B | - |
| Commercial assay or kit | RNAiso Plus (Trizol) | Takara Bio Inc | Cat #: T9108 | - |
| Commercial assay or kit | 5× HiScript II qRT SuperMix II | Vazyme Biotech | Cat #: R223-01 | - |
| Commercial assay or kit | 2× ChamQ SYBR qPCR Master Mix | Vazyme Biotech | Cat #: Q311-02 | - |
| Chemical compound, drug | DAPI | Sigma-Aldrich | Cat #: F6057-20ML | - |
| Chemical compound, drug | Carboxyfluorescein succinimidyl ester (CFSE) | Topscience | Cat #: T6802 | - |
| Peptide, recombinant protein | R428 | Topscience | Cat #: 1037624-75-1 | - |
| Peptide, recombinant protein | Lipopolysaccharide | Med Chem Express | Cat #: HY-D1056 | - |
| Peptide, recombinant protein | IL-4 Protein, Mouse (CHO) | Med Chem Express | Cat #: HY-D1056 | - |
| Peptide, recombinant protein | Recombinant GAS6 Protein (Mouse) | Sino Biological | Cat #: 58026-M08H | - |
| Peptide, recombinant protein | Recombinant GAS6 Protein (Human) | Novoprotein | Cat #: C01W | - |
| Software, algorithm | SPSS | SPSS | SPSS 25.0 | - |
Additional files
Download links
A two-part list of links to download the article, or parts of the article, in various formats.
Downloads (link to download the article as PDF)
Open citations (links to open the citations from this article in various online reference manager services)
Cite this article (links to download the citations from this article in formats compatible with various reference manager tools)
Down-regulated GAS6 impairs synovial macrophage efferocytosis and promotes obesity-associated osteoarthritis
eLife 12:e83069.
https://doi.org/10.7554/eLife.83069


