Evidence for absence of links between striatal dopamine synthesis capacity and working memory capacity, spontaneous eye-blink rate, and trait impulsivity
- Donders Institute for Brain, Cognition and Behaviour, Radboud University Nijmegen, Netherlands
- Department of Psychology, Stockholm University, Sweden
- Department of Developmental Psychology, University of Amsterdam, Netherlands
- Department of Psychiatry, Radboud University Nijmegen Medical Centre, Netherlands
- Department of Radiology and Nuclear Medicine, Amsterdam University Medical Centers, Netherlands
- Department of Medical Imaging, Radboud University Medical Center, Netherlands
Figures
Figure 1 with 7 supplements
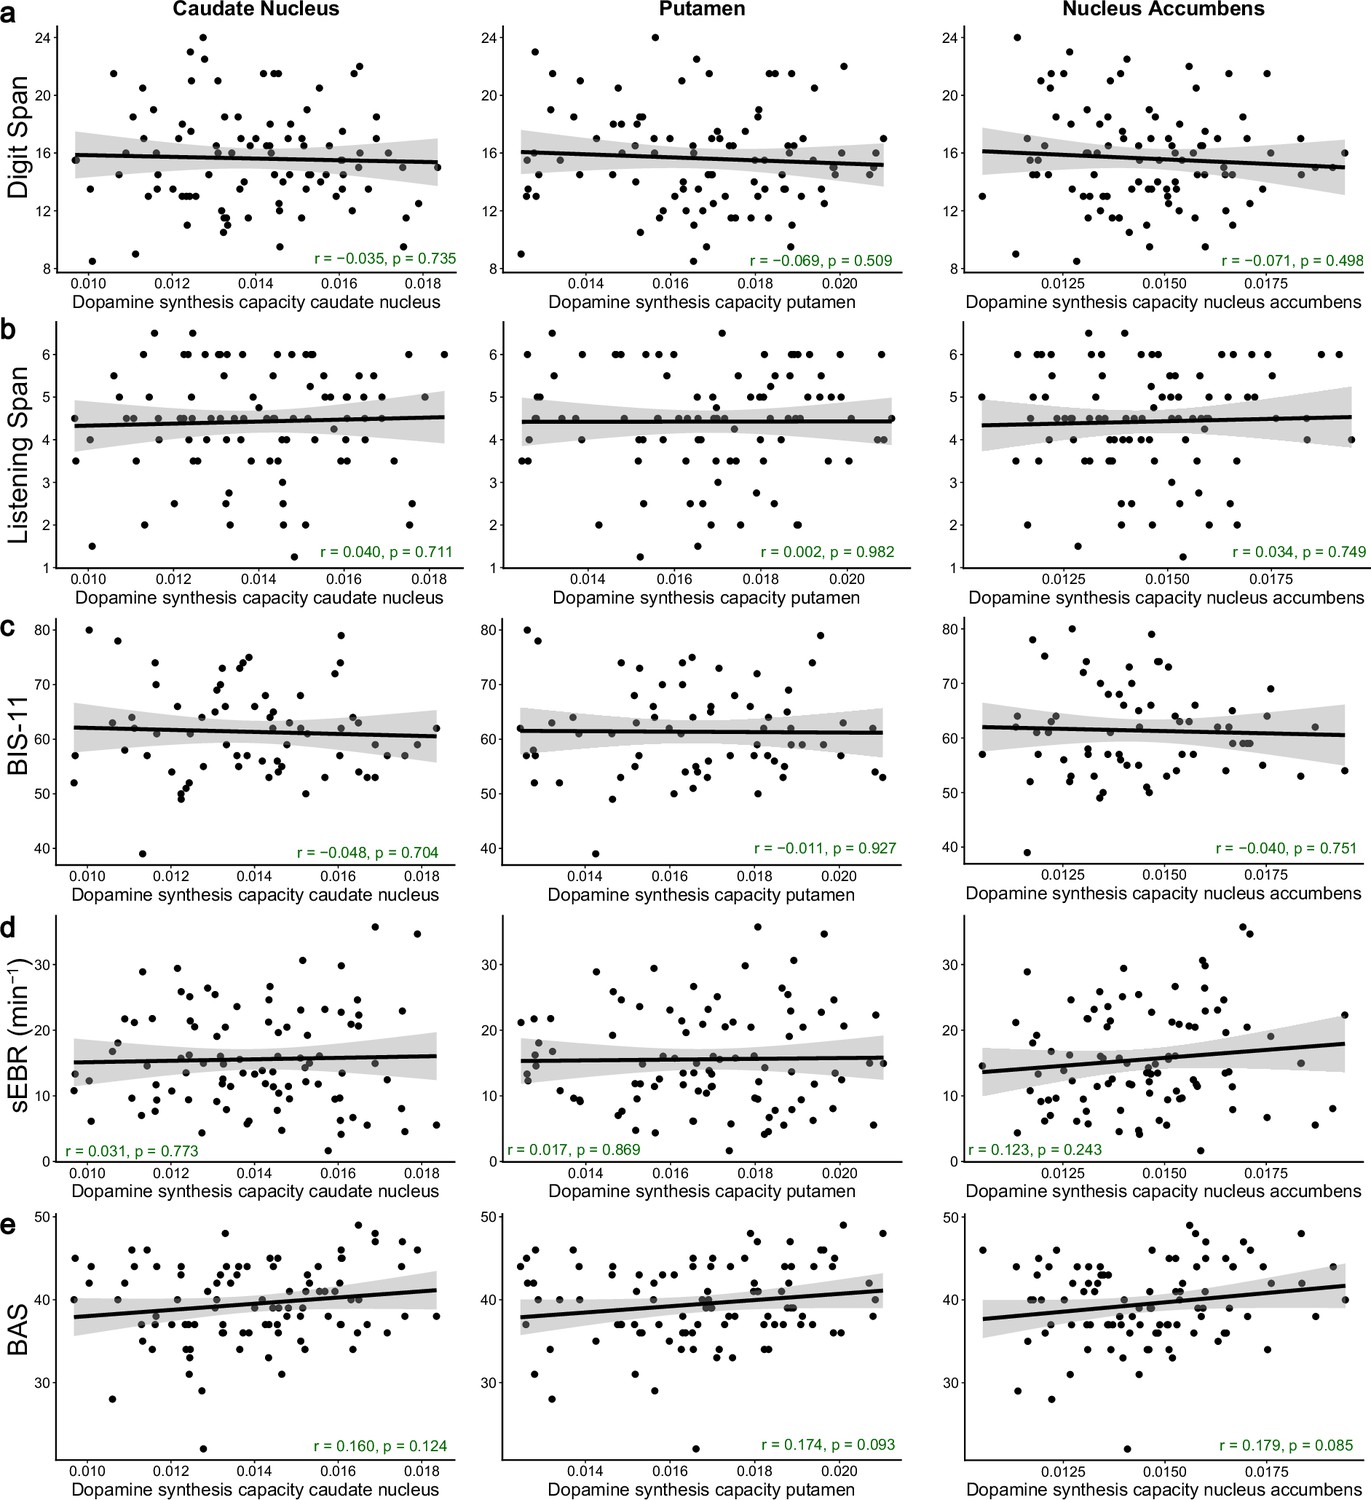
No significant correlations between striatal dopamine synthesis capacity and working memory capacity, trait impulsivity, spontaneous eye-blink rate, or subjective reward sensitivity.
Pearson correlations between dopamine synthesis capacity (kicer) in the caudate nucleus, putamen, or nucleus accumbens regions of interest (ROIs) and (a) working memory capacity measured with the Digit Span task (N = 94), (b) working memory capacity measured with the Listening Span task (N = 94), (c) trait impulsivity measured with the BIS-11 questionnaire (N = 66), (d) spontaneous eye-blink rate (N = 92), or (e) subjective reward sensitivity measured with the Behavioural Activation Scale (N = 94). The light grey shading represents the 95% confidence interval. The p-values provided in the annotations are not corrected for multiple comparisons.
Figure 1—figure supplement 1
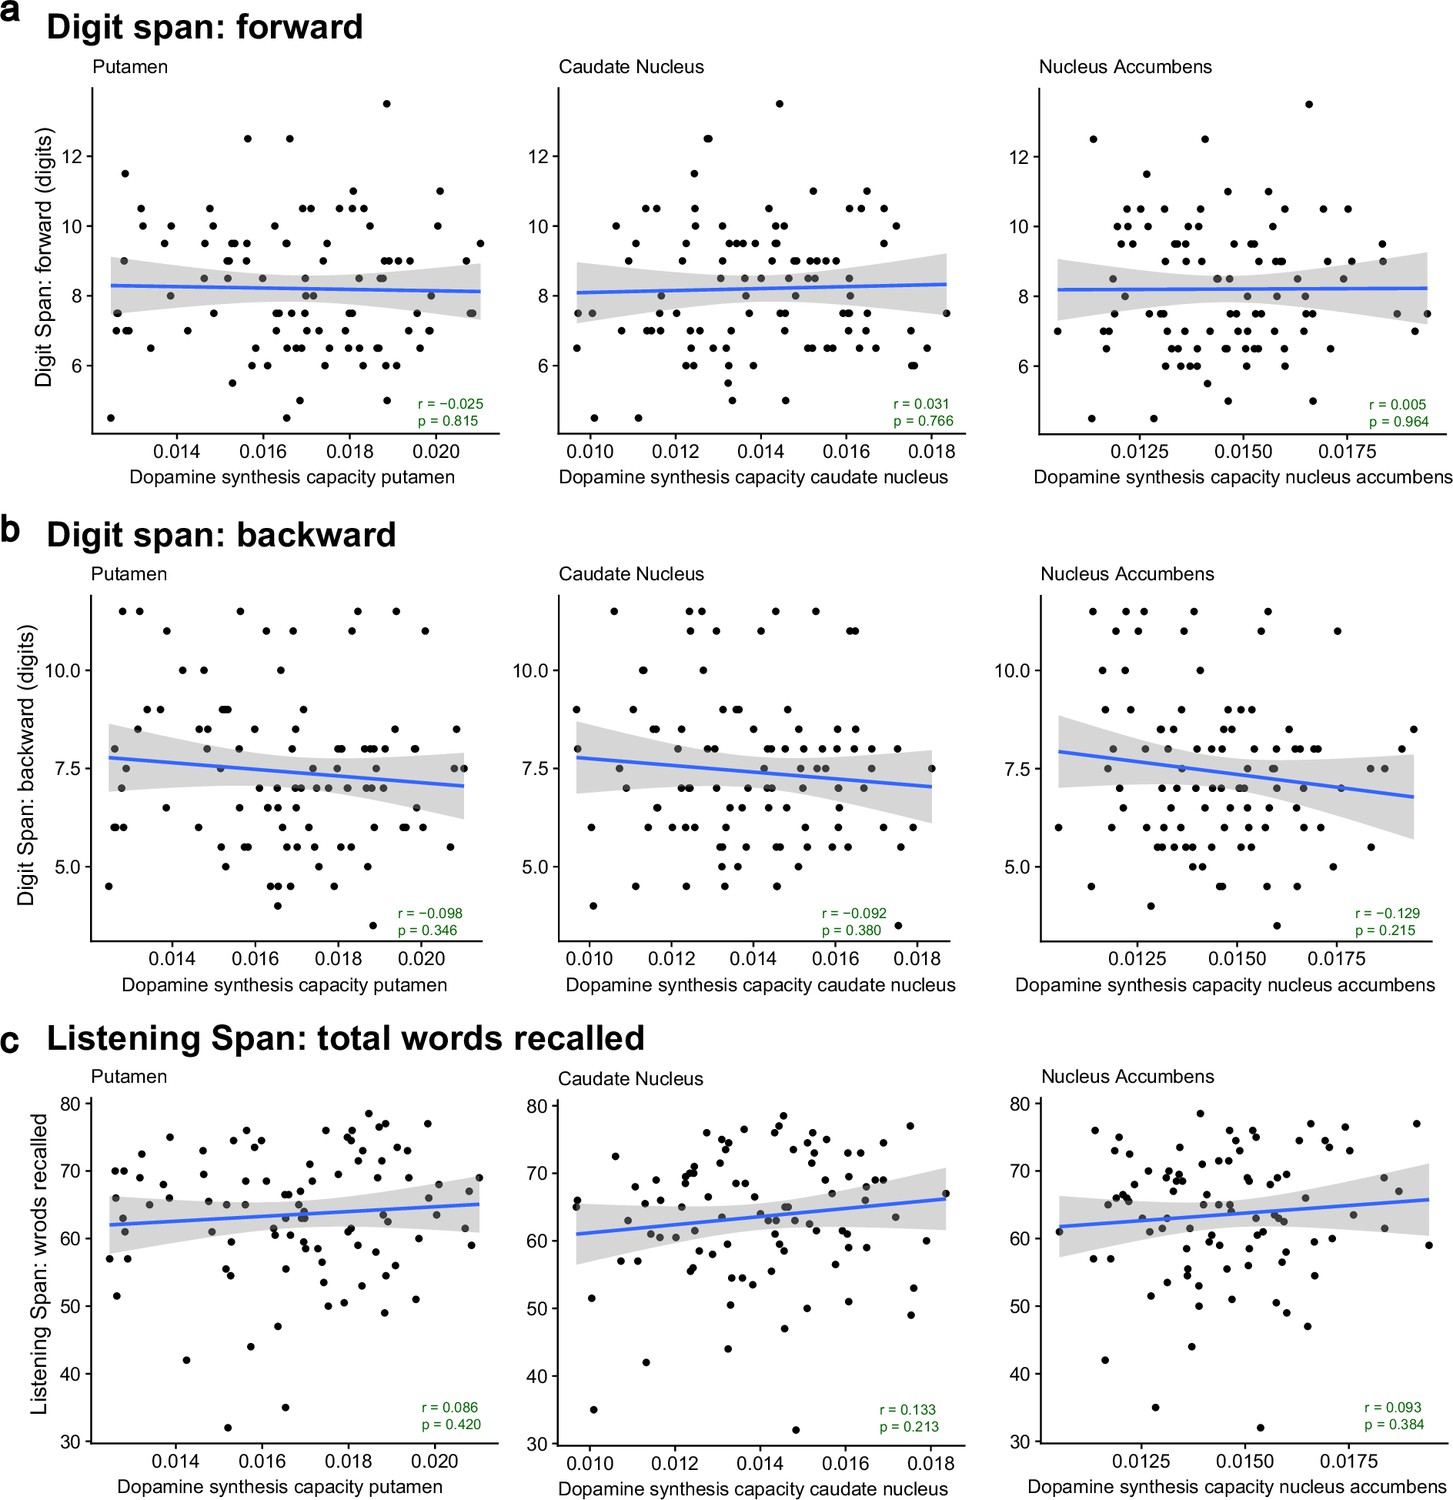
No significant correlations between striatal dopamine synthesis capacity and subsections of the working memory tasks (N = 94).
Correlations between dopamine synthesis capacity in the putamen, caudate nucleus, or nucleus accumbens regions of interest (ROIs) and (a) the forward section and (b) backward section of the Digit Span task and (c) the total number of words recalled in the Listening Span task. The light grey shading represents the 95% confidence interval. The p-values of the two-sided Pearson correlation coefficients are not corrected for multiple comparisons.
Figure 1—figure supplement 2
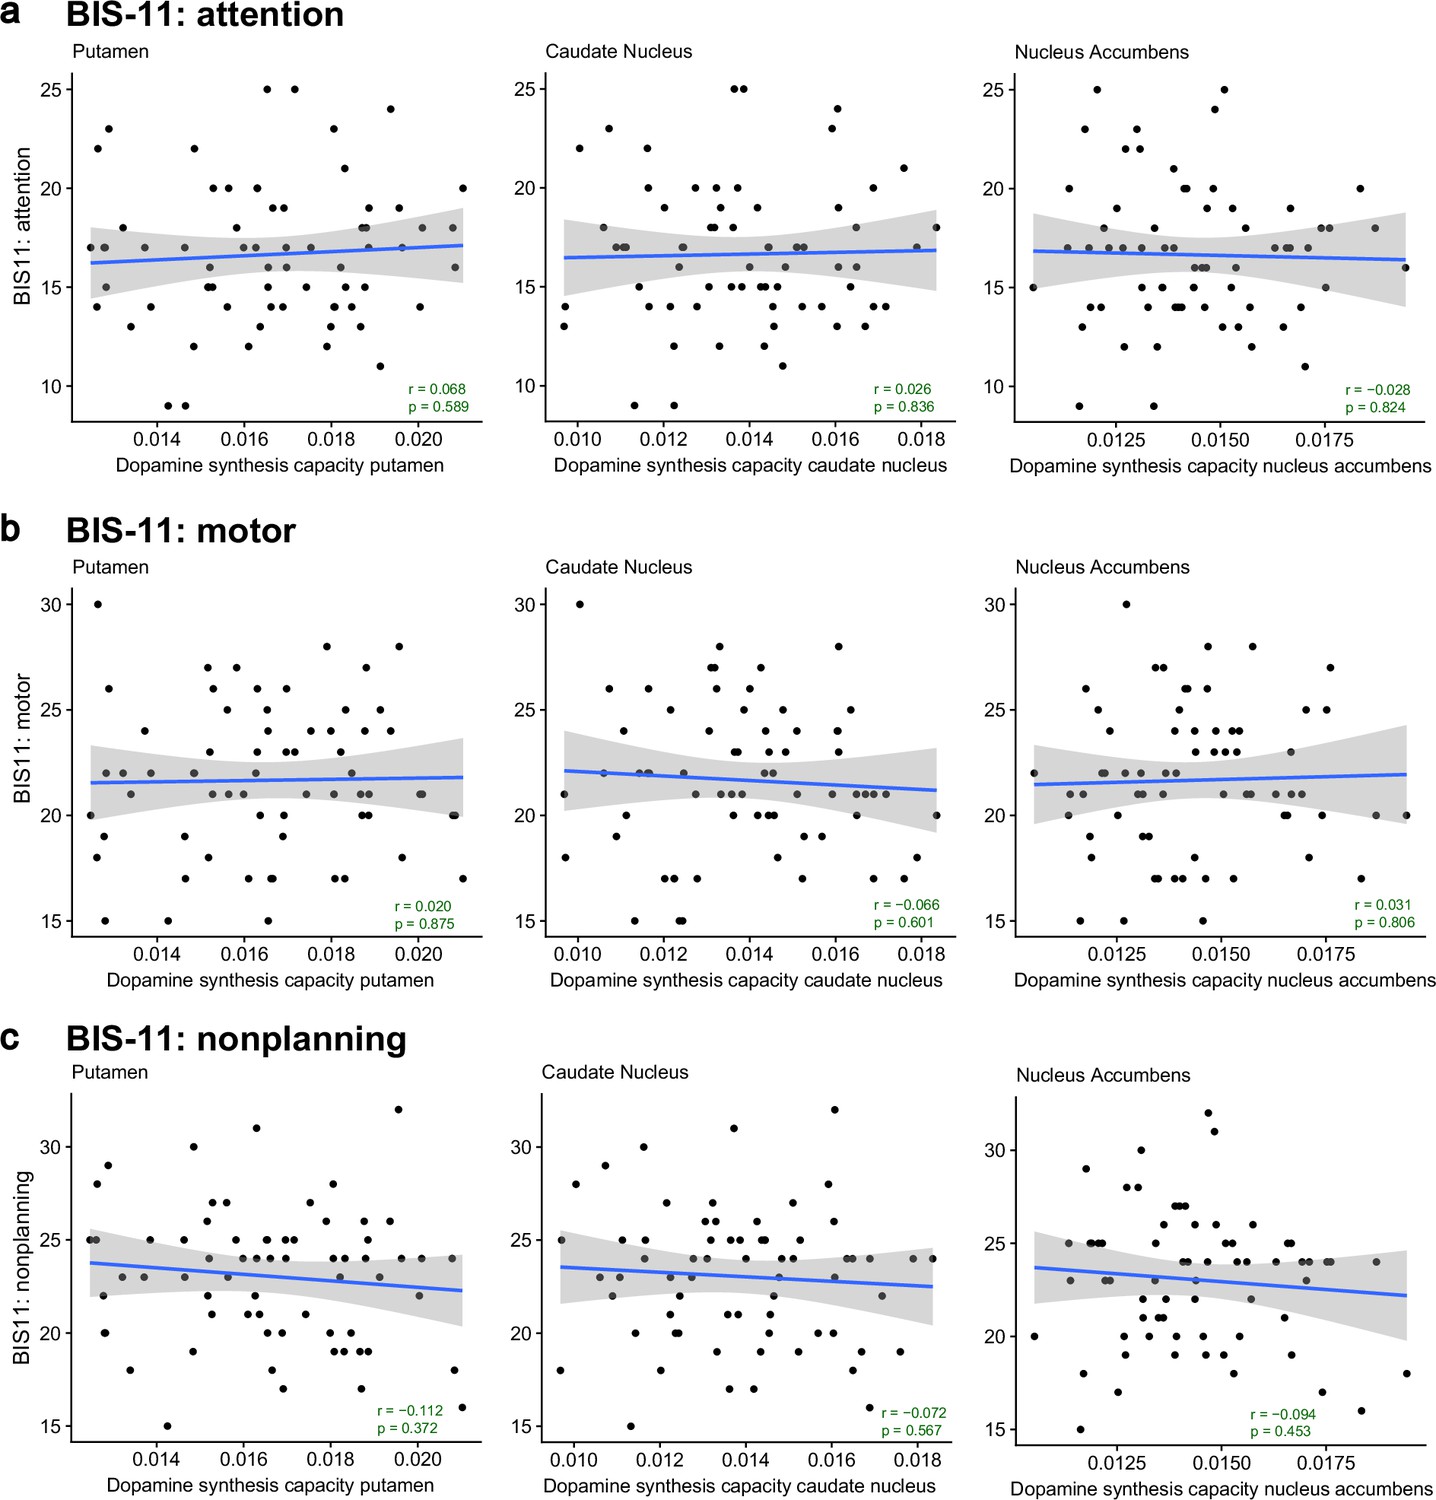
No significant correlations between striatal dopamine synthesis capacity and subsections of the BIS-11 questionnaire of trait impulsivity (N = 66).
Correlations between dopamine synthesis capacity in the putamen, caudate nucleus, or nucleus accumbens regions of interest (ROIs) and the BIS-11 sub-scale on (a) attention, (b) motor actions, and (c) nonplanning. The light grey shading represents the 95% confidence interval. The p-values of the two-sided Pearson correlation coefficients are not corrected for multiple comparisons.
Figure 1—figure supplement 3
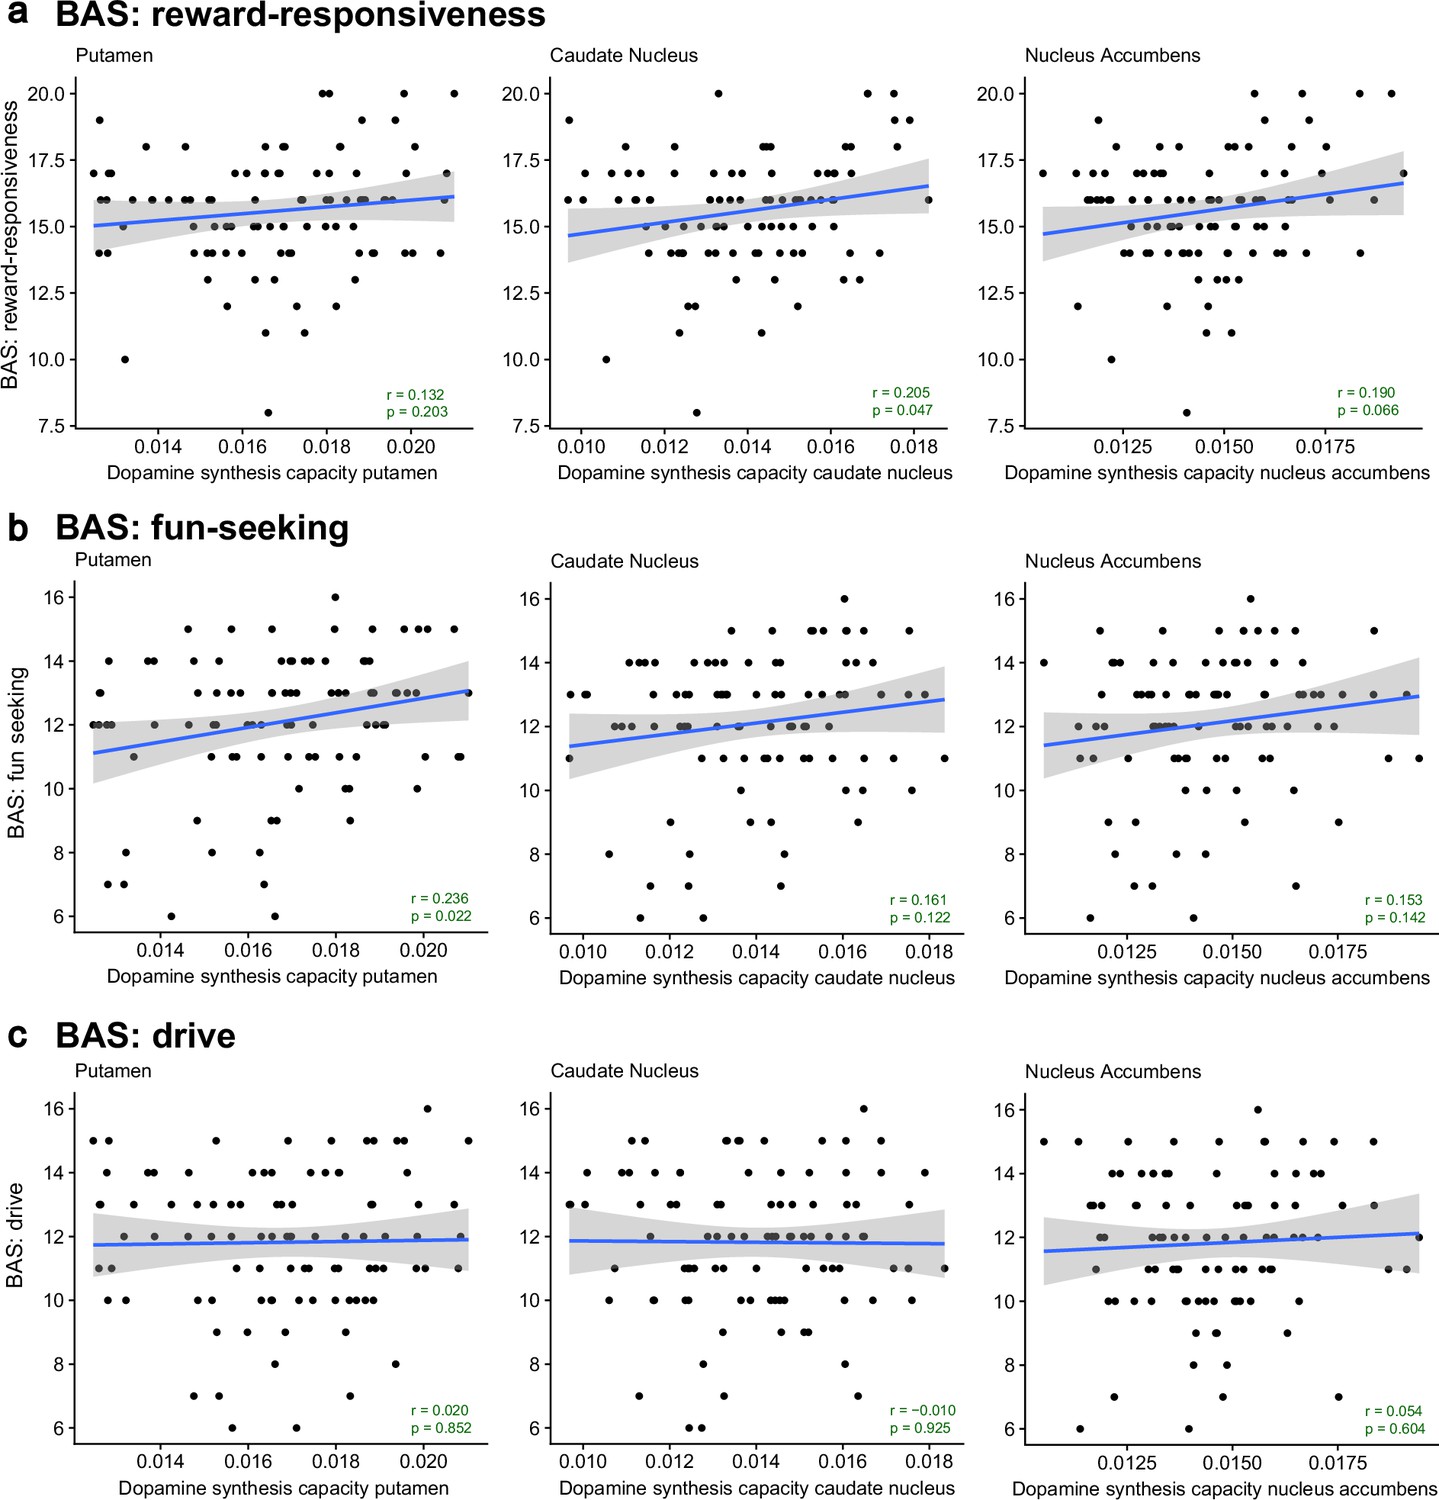
No significant correlations between striatal dopamine synthesis capacity and subsections of the BAS questionnaire of trait reward sensitivity (N = 94).
Correlations between dopamine synthesis capacity in the putamen, caudate nucleus, or nucleus accumbens regions of interest (ROIs) and the BAS sub-scale on (a) reward-responsiveness, (b) fun-seeking, and (c) drive. The light grey shading represents the 95% confidence interval. The p-values of the two-sided Pearson correlation coefficients are not corrected for multiple comparisons.
Figure 1—figure supplement 4
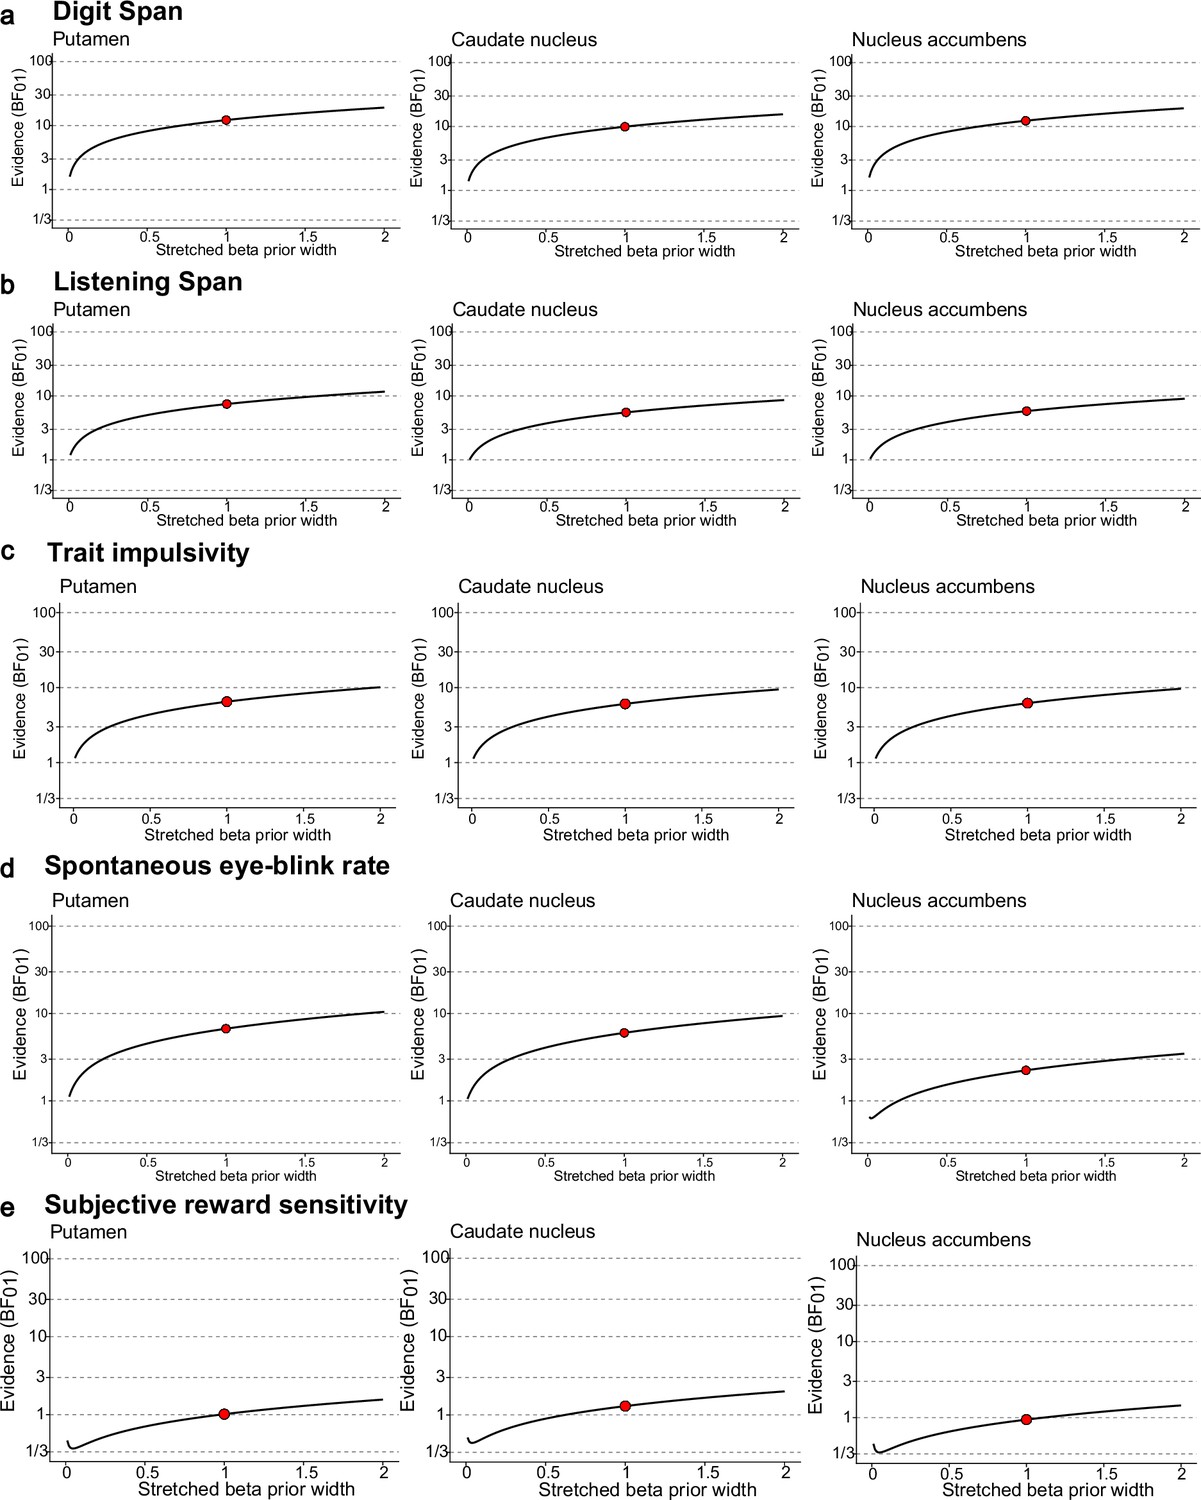
Bayes factor robustness checks.
Bayes factor results as function of varying priors for the null hypothesis of no positive correlation (H0) versus a positive correlation (H1) between striatal dopamine synthesis capacity and (a) working memory capacity measured with the Digit Span task (N = 94), (b) working memory capacity measured with the Listening Span task (N = 94), (c) trait impulsivity measured with the BIS-11 questionnaire (N = 66), (d) spontaneous eye-blink rate (N = 92), or (e) subjective reward sensitivity measured with the Behavioural Activation Scale (N = 94). The red dot corresponds to the Bayes factor for the default prior specification.
Figure 1—figure supplement 5
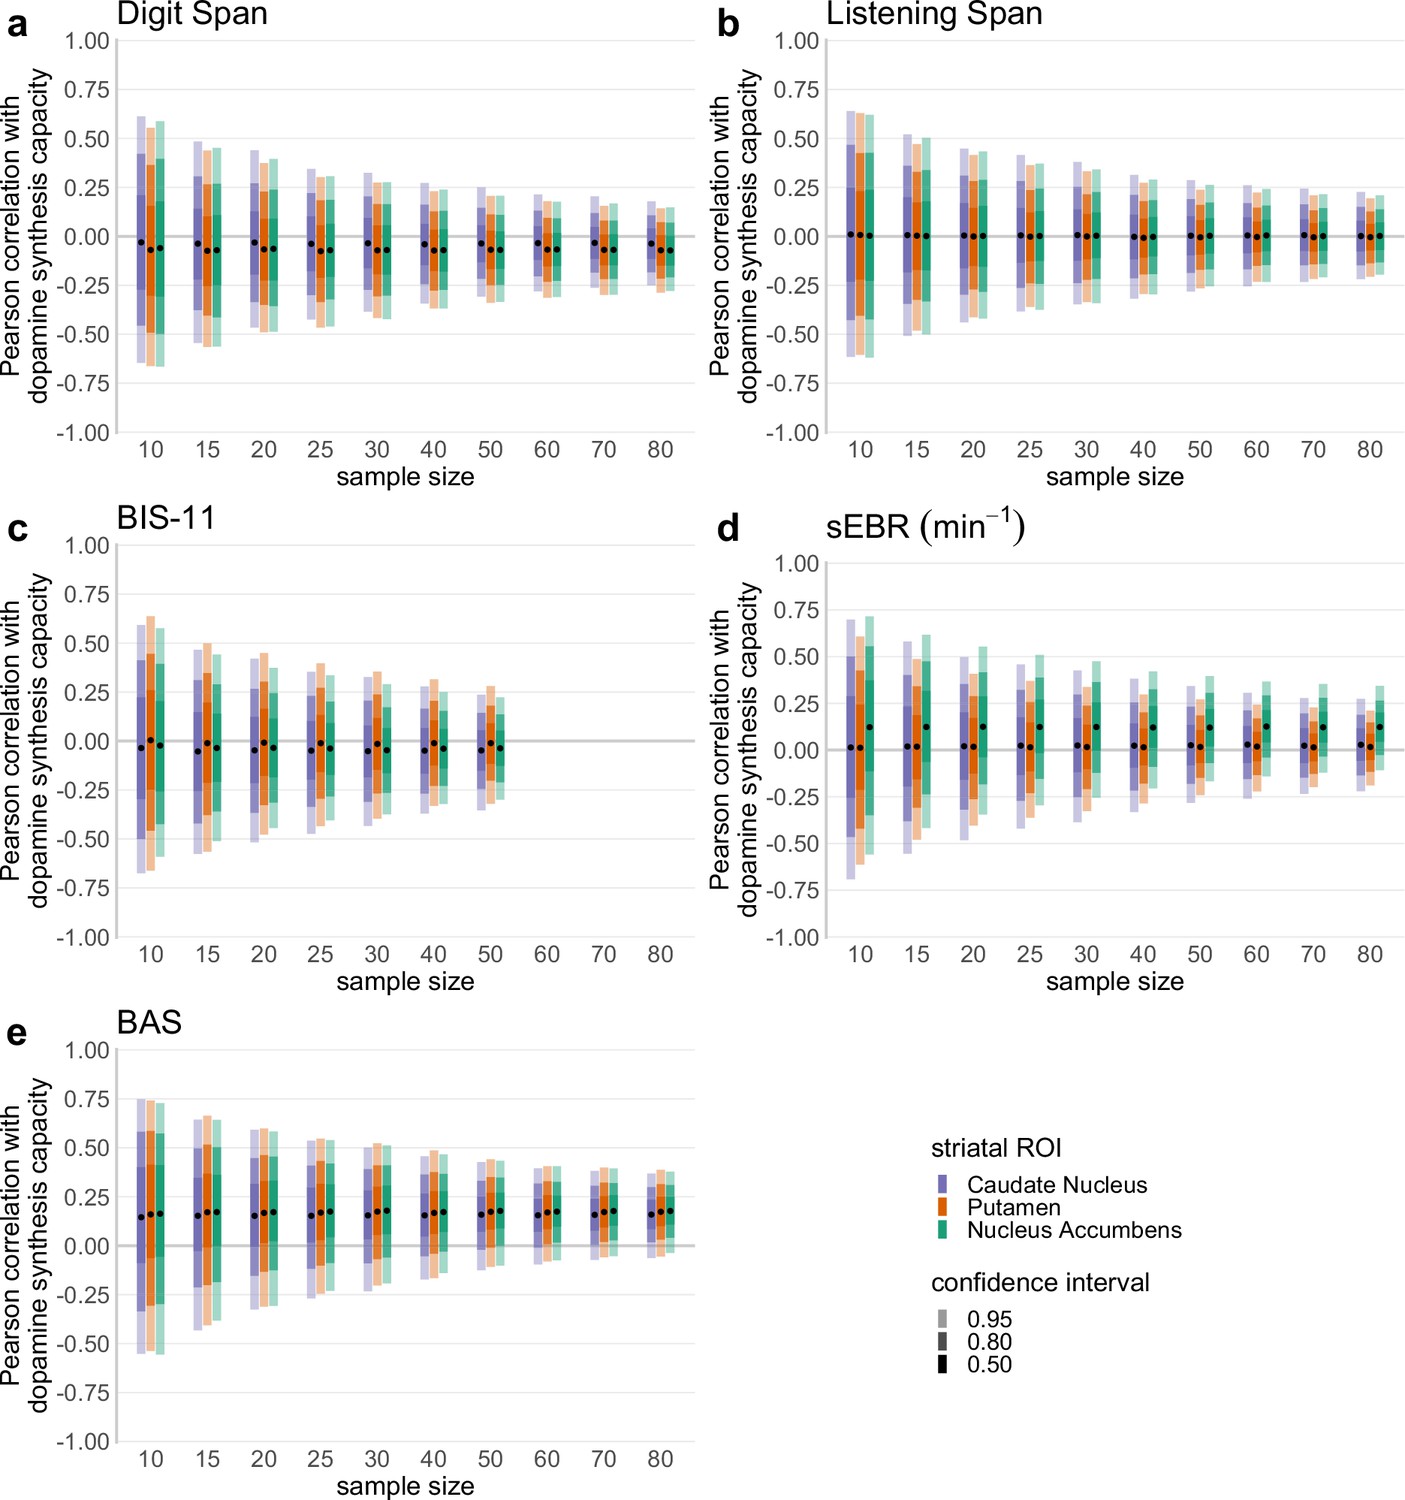
Sampling variability of the correlation between dopamine synthesis and trait measures.
From the full dataset, random subsamples were drawn for each of a series of sample sizes (N = 10, 15, 20, 25, 30, 40, 50, 60, 70, and 80), and for each subsample the correlations between the trait measures and dopamine synthesis capacity was computed. This was repeated 5000 times for each sample size to obtain distributions of the correlations between the trait measures and dopamine synthesis capacity. These distributions were then summarized with the 95, 80, and 50% confidence intervals to reveal the sampling variability of the correlations at varying sample sizes. This analysis was performed for each of the key trait measures under consideration: (a) working memory capacity measured with the Digit Span task, (b) working memory capacity measured with the Listening Span task, (c) trait impulsivity measured with the BIS-11 questionnaire, (d) spontaneous eye-blink rate, and (e) subjective reward sensitivity measured with the Behavioural Activation Scale. As indicated in the bottom-right panel, the different colours represent the striatal region of interest (ROI) in which dopamine synthesis capacity was estimated, and the opacity represents the confidence interval. The black dots represent the means across subsamples. Note that for BIS-11, the subsampling analysis was performed for a reduced range of sample sizes because the original data for this measure was limited to N = 66 (see ‘Methods’ for details).
Figure 1—figure supplement 6
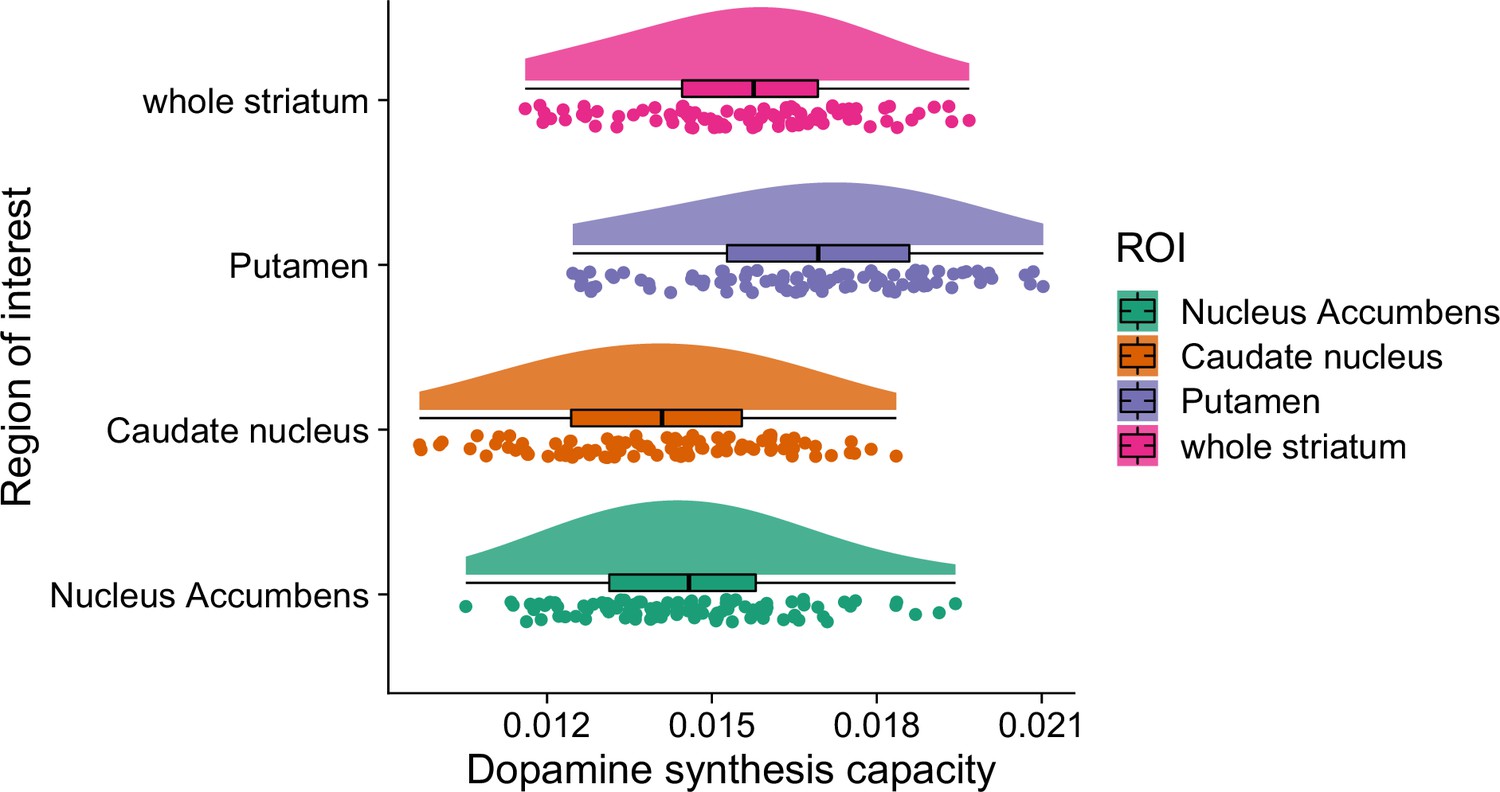
Distribution of dopamine synthesis capacity (kicer) values in the striatal regions of interest (ROI): caudate nucleus, putamen, and nucleus accumbens.
The whole striatum ROI is the combination of all three subregions of interest.
Figure 1—figure supplement 7
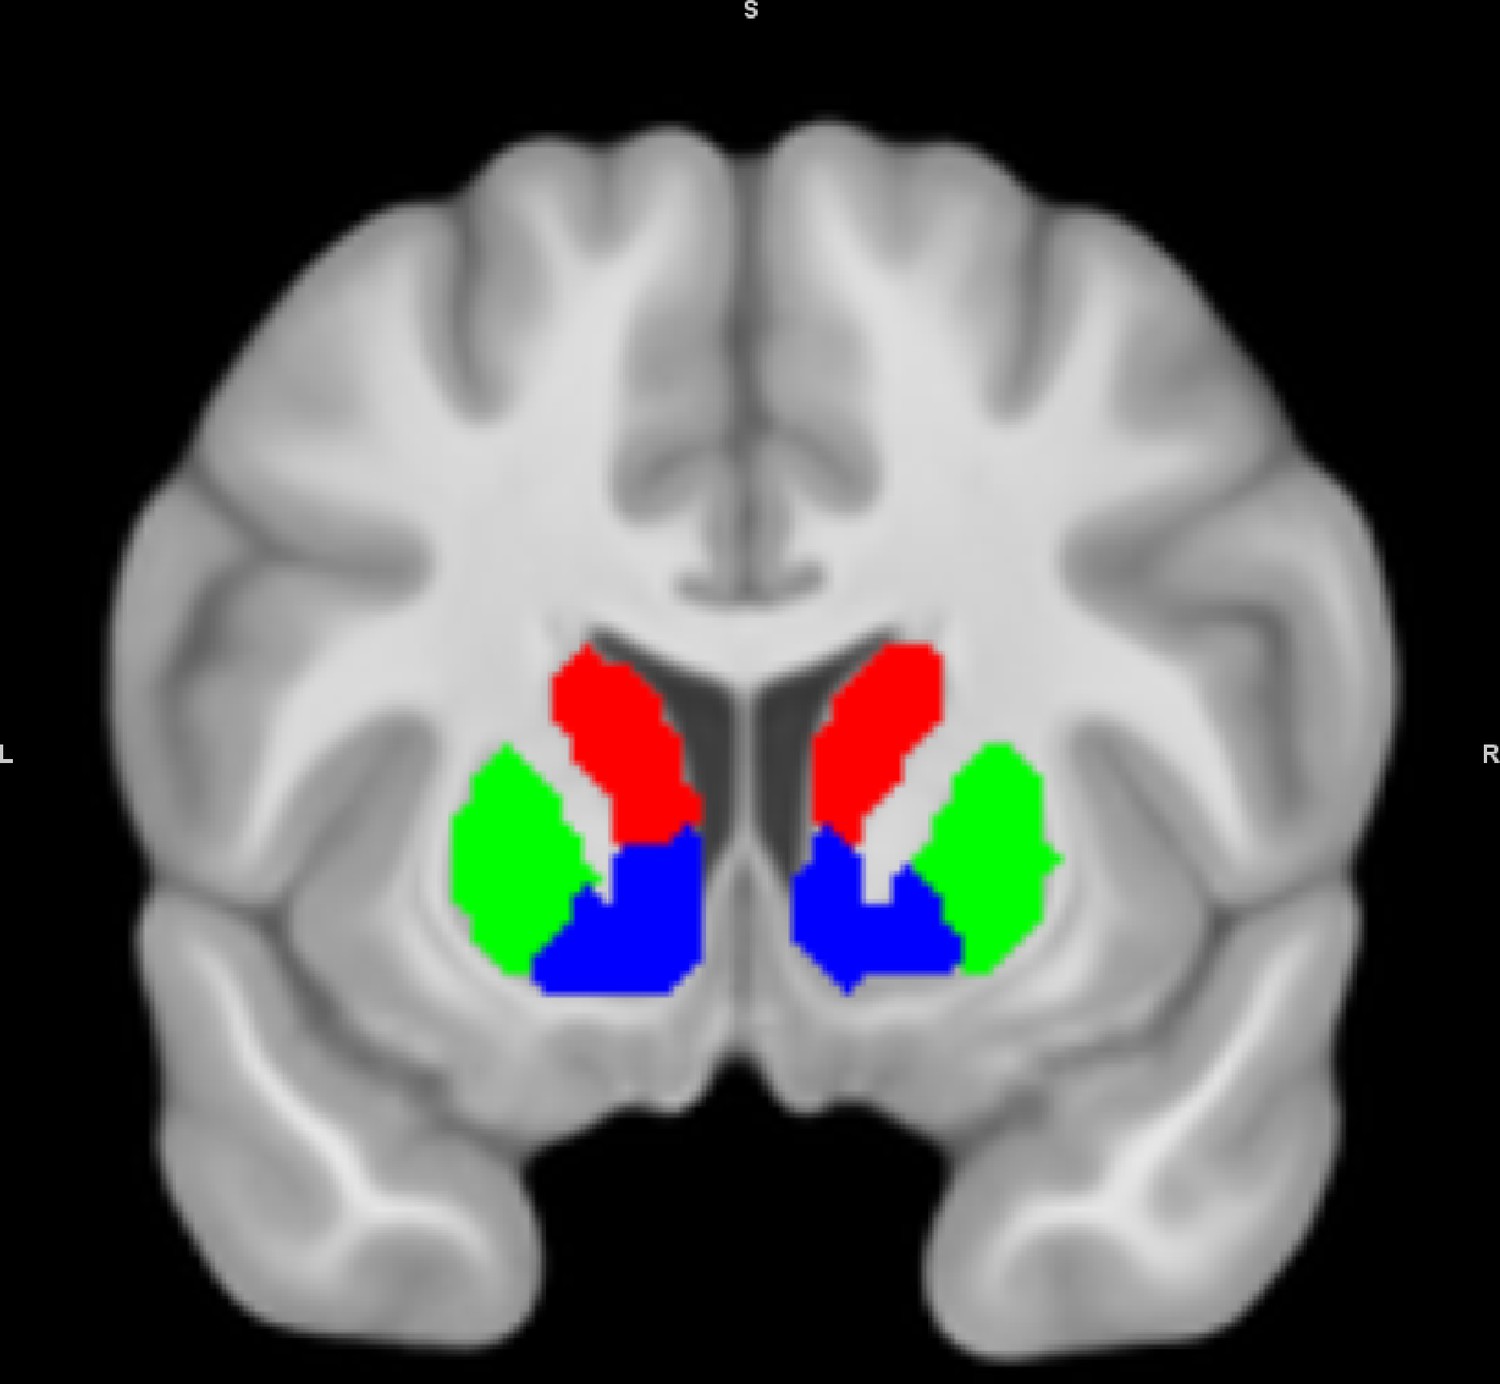
Analysis masks of the striatal regions of interest: caudate nucleus (red), putamen (green), and nucleus accumbens (ventral striatum; blue).
The masks are based on an independent, functional connectivity-based parcellation of the striatum (Piray et al., 2017).
Figure 2
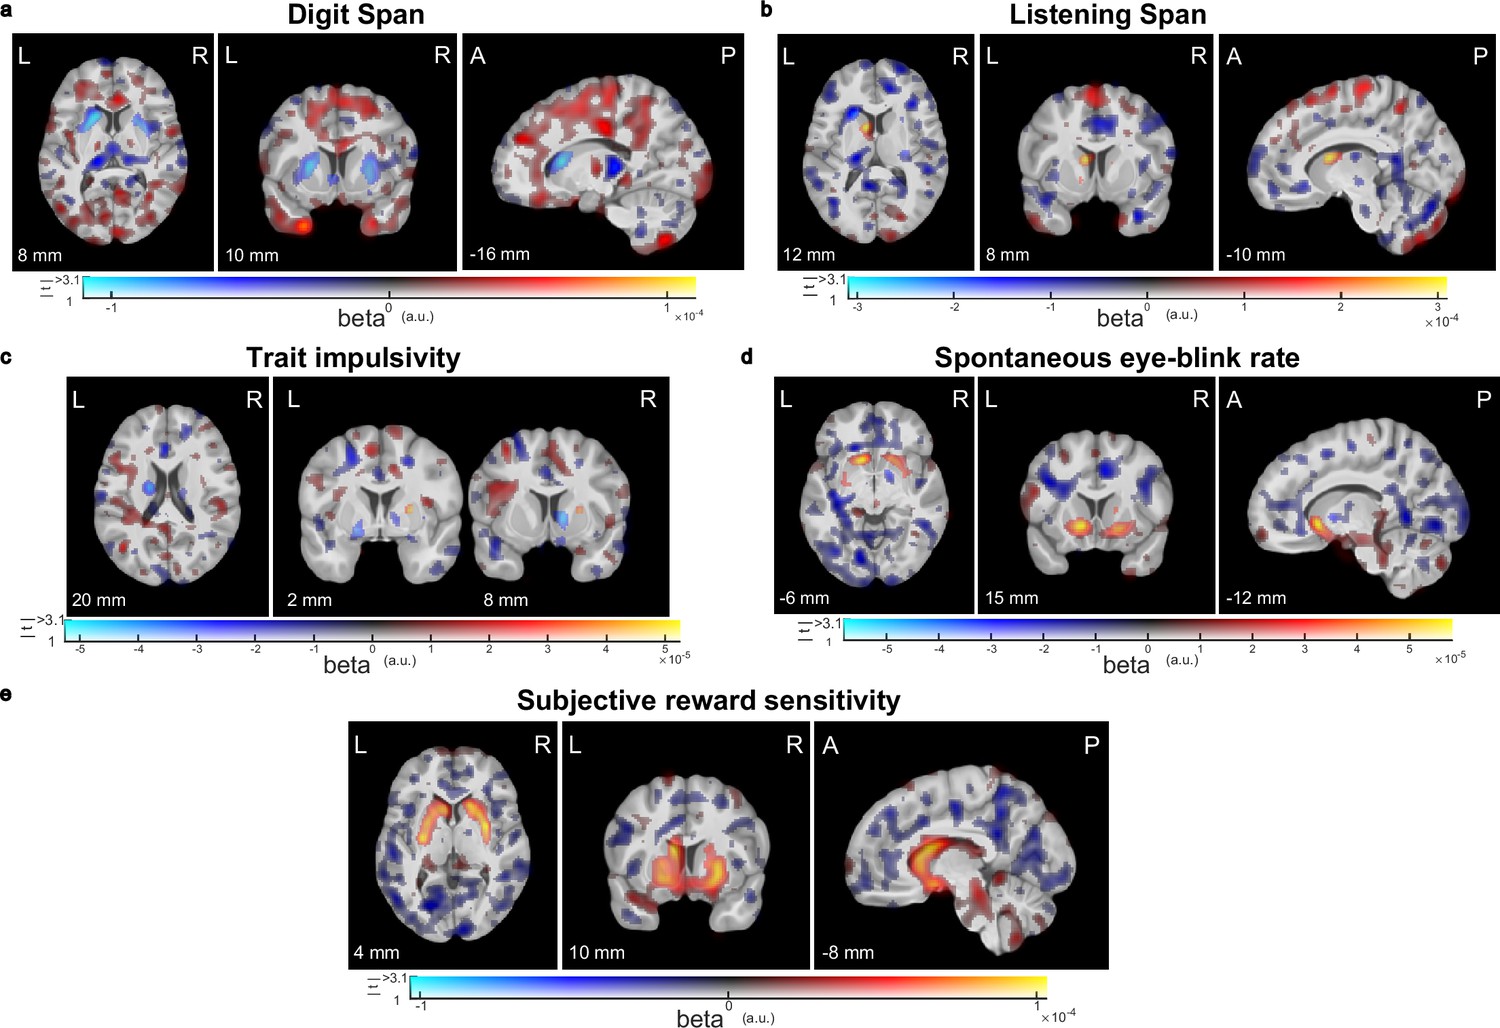
Visualization of sub-threshold correlations between striatal dopamine synthesis capacity and working memory capacity, trait impulsivity, spontaneous eye-blink rate, or subjective reward sensitivity.
Results from voxel-wise regression analysis of the trait measures onto the PET index of dopamine synthesis capacity for (a) working memory capacity measured with the Digit Span task (N = 94), (b) working memory capacity measured with the Listening Span task (N = 94), (c) trait impulsivity measured with the BIS-11 questionnaire (N = 66), (d) spontaneous eye-blink rate (N = 92), or (e) subjective reward sensitivity measured with the Behavioural Activation Scale (N = 94). In these dual-coded images, colour indicates the size of the contrast estimate and the opacity represents the t-values. Voxels with t-values above the threshold of p<0.001, uncorrected, are fully opaque. There are no significant clusters in these images (peak-level family-wise error correction at p<0.05 after small-volume correction for the combination of the caudate nucleus, putamen, and nucleus accumbens). Any significant clusters would have been encircled in black for red blobs or white for blue blobs. The results are overlaid on the group-average T1-weighted anatomical MRI scan in MNI152 coordinate space. This visualization approach was introduced by Allen et al., 2012 and implemented by Zandbelt, 2017.
Figure 3
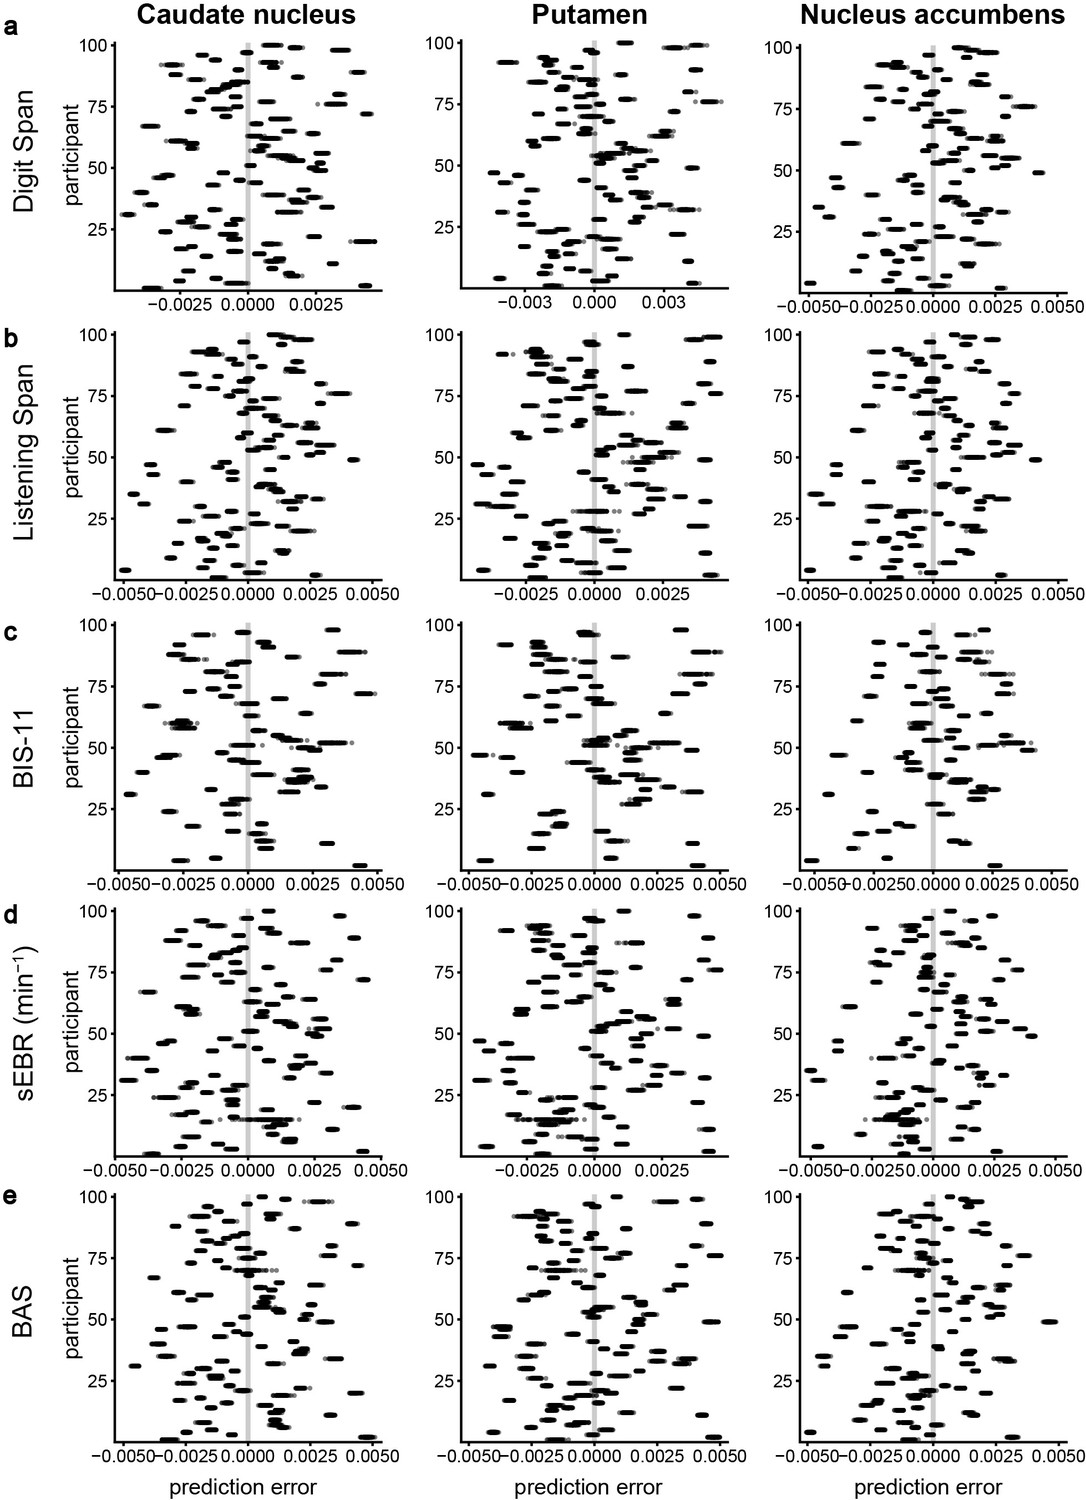
Cross-validation results of the predictive performance of working memory capacity, trait impulsivity, spontaneous eye-blink rate, or subjective reward sensitivity for striatal dopamine synthesis capacity.
Every plot shows for each participant the error of the prediction of dopamine synthesis capacity in the caudate nucleus (left column), putamen (middle column), or nucleus accumbens regions of interest (ROIs) (right column) from (a) working memory capacity measured with the Digit Span task (N = 94), (b) working memory capacity measured with the Listening Span task (N = 94), (c) trait impulsivity measured with the BIS-11 questionnaire (N = 66), (d) spontaneous eye-blink rate (N = 92), or (e) subjective reward sensitivity measured with the Behavioural Activation Scale (N = 94). Each black dot represents the prediction error of one of 100 repeats of the k-fold cross-validation (k = 10). For each panel, the grey vertical line at zero represents perfect predictive accuracy.
Tables
Table 1
Statistics of the Pearson correlation analyses between striatal dopamine synthesis capacity and working memory capacity, trait impulsivity, spontaneous eye-blink rate, and subjective reward sensitivity.
| Trait measure | Striatal ROI | ρ | p-value | Adjusted p-value | BF01 (0,1) | BF01 (–1,1) |
|---|---|---|---|---|---|---|
| Digit Span | Caudate nucleus | –0.035 | 0.632 | 1 | 9.93 | 7.33 |
| Putamen | –0.069 | 0.746 | 1 | 12.19 | 6.25 | |
| Nucleus accumbens | –0.071 | 0.751 | 1 | 12.31 | 6.19 | |
| Listening Span | Caudate nucleus | 0.04 | 0.355 | 1 | 5.52 | 7.09 |
| Putamen | 0.002 | 0.491 | 1 | 7.45 | 7.59 | |
| Nucleus accumbens | 0.034 | 0.375 | 1 | 5.78 | 7.22 | |
| BIS-11 | Caudate nucleus | –0.048 | 0.648 | 1 | 8.56 | 6.06 |
| Putamen | –0.011 | 0.536 | 1 | 6.98 | 6.48 | |
| Nucleus accumbens | –0.04 | 0.625 | 1 | 4.97 | 6.19 | |
| sEBR | Caudate nucleus | 0.031 | 0.386 | 0.773 | 6.01 | 7.36 |
| Putamen | 0.017 | 0.434 | 0.773 | 6.7 | 7.57 | |
| nucleus accumbens | 0.123 | 0.122 | 0.365 | 2.24 | 3.92 | |
| BAS | caudate nucleus | 0.16 | 0.062 | 0.127 | 1.3 | 2.42 |
| putamen | 0.174 | 0.046 | 0.127 | 1.02 | 1.93 | |
| nucleus accumbens | 0.179 | 0.042 | 0.127 | 0.94 | 1.8 |
-
ρ: Pearson correlation coefficient; corresponding one-sided p-values (for a positive association) are reported both with and without Holm–Bonferroni correction for multiple comparisons for three striatal regions of interest (ROIs); BF01 (0,1): Bayes factor for the evidence in favour of the null hypothesis of no positive correlation (H0) versus the alternative hypothesis of a positive correlation (H1); BF01 (–1,1): Bayes factor for the non-directional hypotheses quantifying the evidence in favour of the null hypothesis of no correlation (H0) versus the alternative hypothesis that there is a correlation (H1); BIS-11: Barratt Impulsiveness Scale, assessing trait impulsivity; sEBR: spontaneous eye-blink rate; BAS: Behavioural Activation Scale, assessing subjective reward sensitivity.
Table 2
Summary statistics of the cross-validated predictive accuracy of working memory capacity, trait impulsivity, spontaneous eye-blink rate, or subjective reward sensitivity for striatal dopamine synthesis capacity.
| Trait measure | Striatal ROI | Metric: R2 | Metric: RMSE | ||||
|---|---|---|---|---|---|---|---|
| Mean | Std_err | Perm_p | Mean | Std_err | Perm_p | ||
| Digit Span | Caudate nucleus | –0.19812 | 0.010189 | 0.617 | 0.002054 | 1.21E-05 | 0.6242 |
| Putamen | –0.19854 | 0.010929 | 0.6048 | 0.002222 | 1.43E-05 | 0.4672 | |
| Nucleus accumbens | –0.20066 | 0.011087 | 0.6154 | 0.001895 | 1.29E-05 | 0.5174 | |
| Listening Span | Caudate nucleus | –0.2009 | 0.01004 | 0.6272 | 0.002056 | 1.21E-05 | 0.6686 |
| putamen | –0.20468 | 0.01074 | 0.6246 | 0.002227 | 1.39E-05 | 0.5344 | |
| nucleus accumbens | –0.20312 | 0.010809 | 0.6262 | 0.001898 | 1.28E-05 | 0.5624 | |
| BIS-11 | Caudate nucleus | –0.3554 | 0.019555 | 0.6562 | 0.00212 | 1.46E-05 | 0.71 |
| Putamen | –0.42078 | 0.032679 | 0.7408 | 0.002298 | 1.60E-05 | 0.7188 | |
| Nucleus accumbens | –0.3709 | 0.02575 | 0.6382 | 0.001977 | 1.50E-05 | 0.6384 | |
| sEBR | Caudate nucleus | –0.20731 | 0.010552 | 0.6382 | 0.002077 | 1.22E-05 | 0.748 |
| Putamen | –0.18209 | 0.010114 | 0.5242 | 0.0022 | 1.31E-05 | 0.5688 | |
| Nucleus accumbens | –0.16276 | 0.008713 | 0.4236 | 0.001874 | 1.31E-05 | 0.335 | |
| BAS | Caudate nucleus | –0.16081 | 0.01069 | 0.461 | 0.002022 | 1.27E-05 | 0.187 |
| Putamen | –0.16465 | 0.011264 | 0.4672 | 0.002189 | 1.44E-05 | 0.1226 | |
| Nucleus accumbens | –0.16523 | 0.011255 | 0.4682 | 0.001865 | 1.29E-05 | 0.1468 |
-
R2: coefficient of determination; RMSE: root mean square error; std_err: standard error; perm_p: p-value based on 5000 permutations; BIS-11: trait impulsivity questionnaire; sEBR: spontaneous eye-blink rate; BAS: Behavioural Activation Scale to measure subjective reward sensitivity.
Table 3
Pearson correlation coefficients for dopamine synthesis capacity in the three striatal regions of interest.
| Caudate nucleus | Putamen | Nucleus accumbens | |
|---|---|---|---|
| Caudate nucleus | 1 | 0.751 | 0.649 |
| Putamen | 0.751 | 1 | 0.787 |
| Nucleus accumbens | 0.649 | 0.787 | 1 |
Additional files
-
MDAR checklist
- https://cdn.elifesciences.org/articles/83161/elife-83161-mdarchecklist1-v2.docx
-
Supplementary file 1
Participant characteristics (N = 94).
- https://cdn.elifesciences.org/articles/83161/elife-83161-supp1-v2.docx
Download links
A two-part list of links to download the article, or parts of the article, in various formats.
Downloads (link to download the article as PDF)
Open citations (links to open the citations from this article in various online reference manager services)
Cite this article (links to download the citations from this article in formats compatible with various reference manager tools)
Evidence for absence of links between striatal dopamine synthesis capacity and working memory capacity, spontaneous eye-blink rate, and trait impulsivity
eLife 12:e83161.
https://doi.org/10.7554/eLife.83161


