Directed differentiation of human iPSCs to functional ovarian granulosa-like cells via transcription factor overexpression
- Wyss Institute, Harvard University, United States
- Department of Genetics, Harvard Medical School, United States
- Massachusetts General Hospital Center for Cancer Research, Harvard Medical School, United States
- Department of Biomedical Engineering, Duke University, United States
- Department of Computer Science, Duke University, United States
Figures
Figure 1
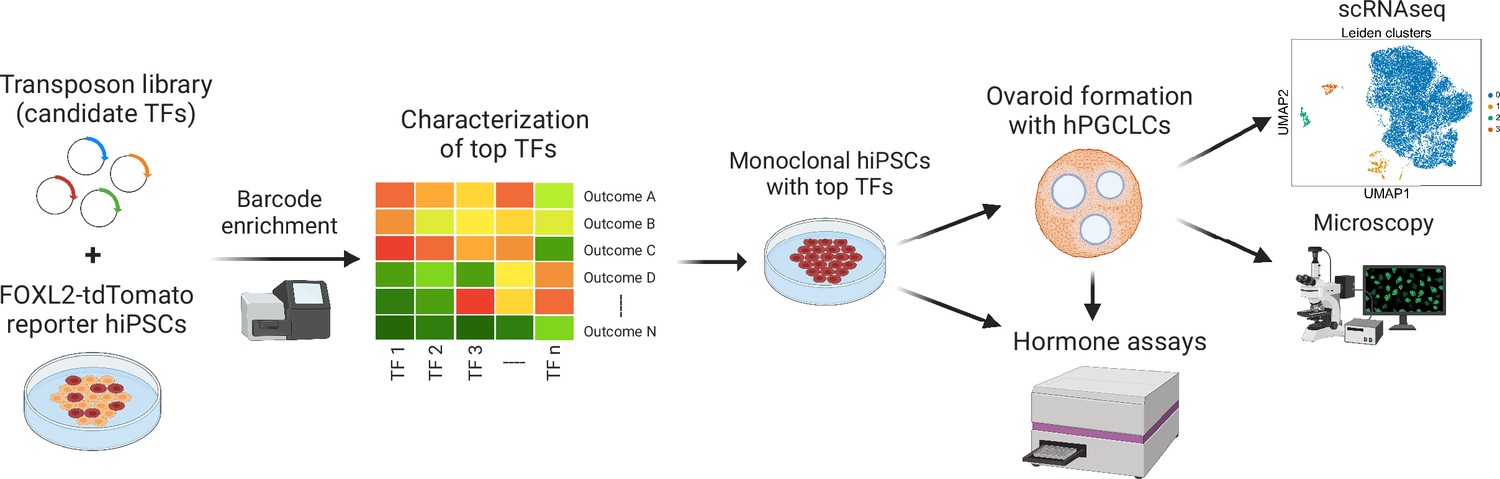
Experimental workflow of the study.
First, barcoded transcription factor (TF) expression vectors were integrated into FOXL2-T2A-tdTomato reporter human induced pluripotent stem cells (hiPSCs). After induction of TF expression, cells positive for tdTomato and granulosa-related surface markers were sorted, and the barcodes were sequenced. The top TFs based on barcode enrichment were selected for further characterization by combinatorial screening and bulk RNA-seq. Next, monoclonal hiPSC lines were generated that inducibly express the top TFs (see Figure 3—source data 2) and generate granulosa-like cells with high efficiency (Figure 3—figure supplement 2). Granulosa-like cells from these lines were further evaluated for estradiol production in response to follicle-stimulating hormone (FSH). Finally, they were aggregated with human primordial germ cell-like cells (hPGCLCs) to form ovaroids. These ovaroids produced estradiol and progesterone, formed follicle-like structures, and supported hPGCLC maturation as measured by immunofluorescence microscopy and scRNA-seq.
Figure 2 with 2 supplements
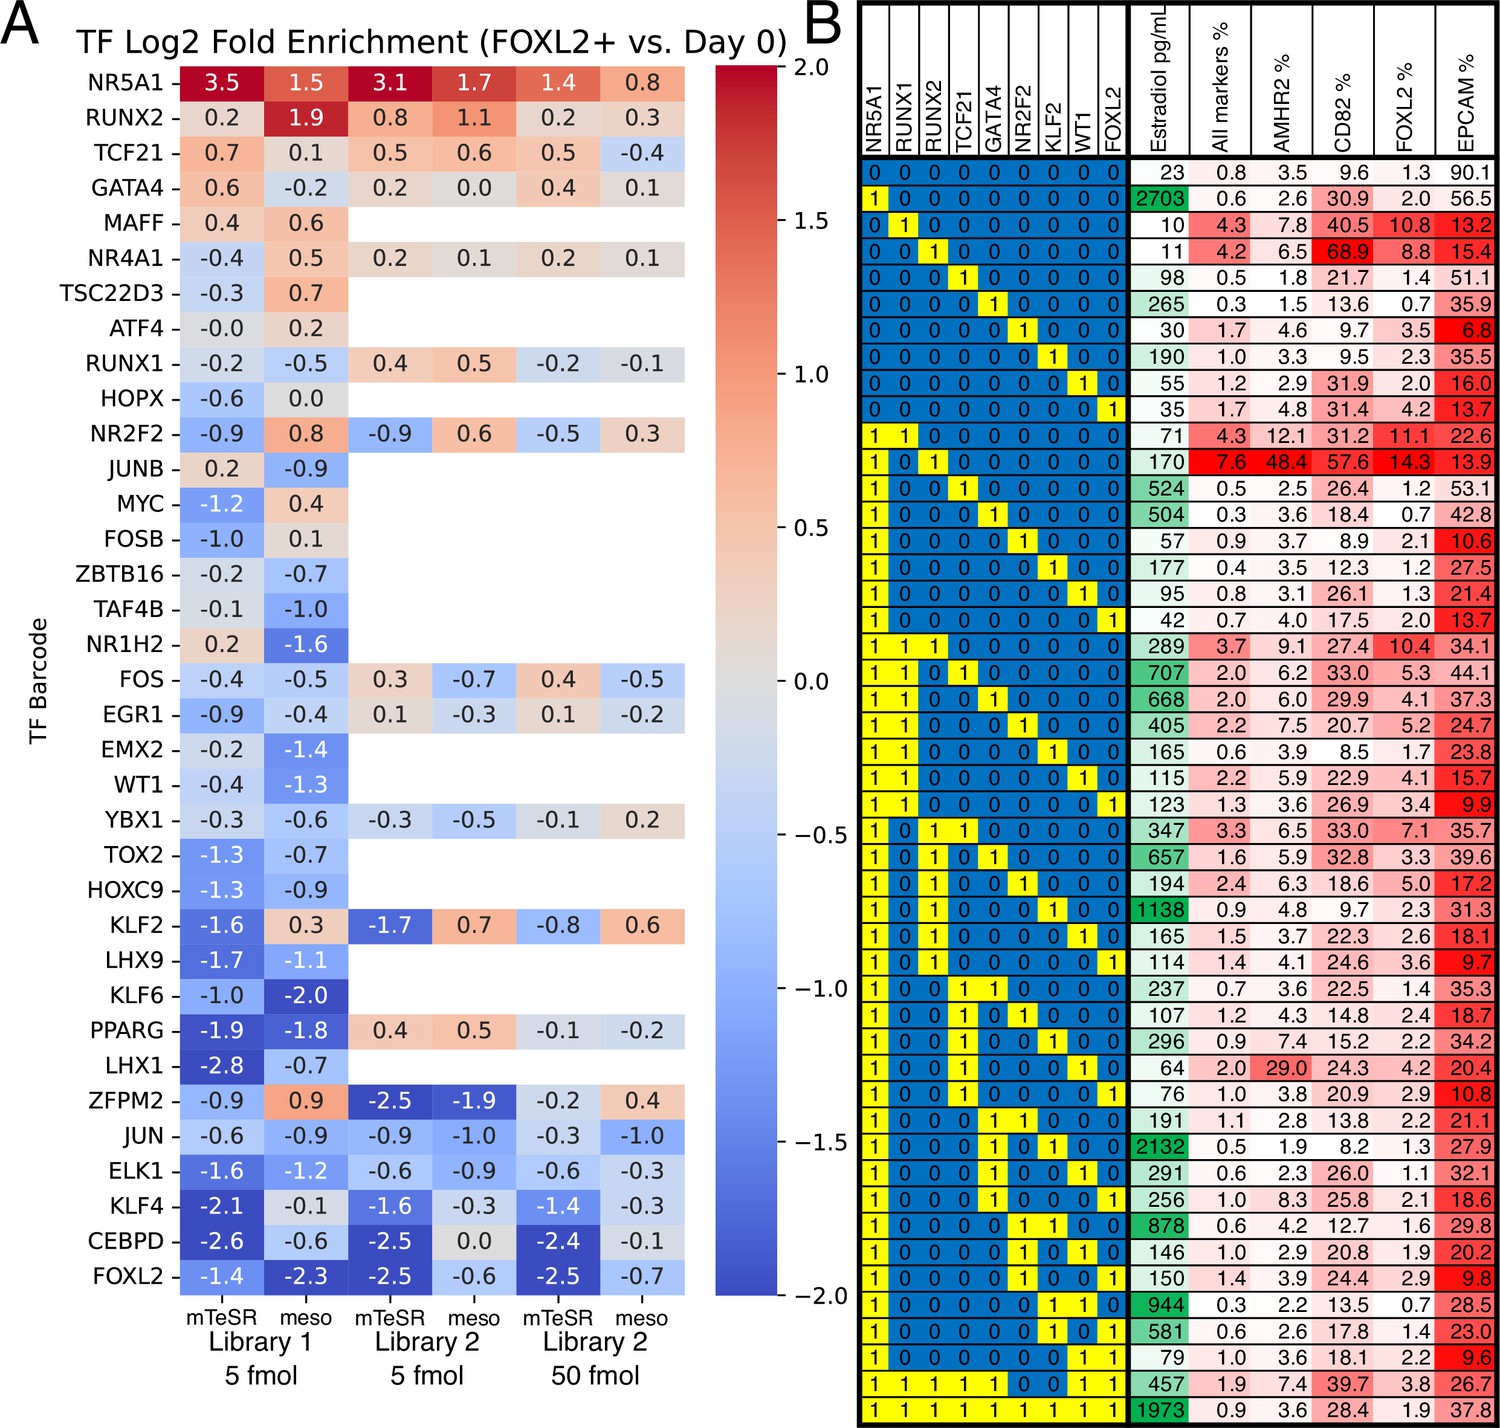
Identification of transcription factors (TFs) whose overexpression generates granulosa-like cells.
(A) Pooled screening of barcoded TF cDNA libraries (see Methods for details) identifies TFs enriched in FOXL2-T2A-tdTomato+ cells. Library #1 is the full library of 35 TFs, and library #2 is a library containing a subset of 18 TFs. Empty values correspond to TFs that were absent in library #2. (B) Combinatorial screening identifies minimal TF combinations for inducing granulosa-like cells. TF combinations were integrated into human induced pluripotent stem cells (hiPSCs); a ‘1’ in the left-hand box signifies the presence of the TF in the combination corresponding to that row. For each combination, the polyclonal hiPSC population was differentiated with TF induction (see Methods). For the last 24 hr of differentiation, cells were additionally treated with FSH and androstenedione. Estradiol production and granulosa markers were measured by ELISA and flow cytometry after a total of 5 days. NR5A1 expression induced high levels of estradiol synthesis, but the combination of NR5A1 with RUNX1 or RUNX2 was required to give the best results for granulosa markers. ‘All markers’ signifies FOXL2+CD82+AMHR2+EPCAM−.
-
Figure 2—source data 1
Barcode counts for the enrichment analysis.
- https://cdn.elifesciences.org/articles/83291/elife-83291-fig2-data1-v2.zip
-
Figure 2—source data 2
List of transcription factors (TFs) included in libraries 1 and 2.
- https://cdn.elifesciences.org/articles/83291/elife-83291-fig2-data2-v2.docx
Figure 2—figure supplement 1

Construction of the FOXL2-T2A-tdTomato reporter human induced pluripotent stem cell (hiPSC) line.
(A) Schematic for Cas9/HDR knock-in with a donor plasmid followed by selection marker excision. Primer-binding sites for genotyping are also shown (not to scale). (B) Genotyping to verify homozygous editing. Initial screening was performed with primers 176/177. Candidate clones (denoted A, B, C, D) were further verified by additional genotyping. Note that primers 127/128 bind outside of the region used as homology arms for the donor plasmid.
-
Figure 2—figure supplement 1—source data 1
Raw gel scans for FOXL2 reporter genotyping.
- https://cdn.elifesciences.org/articles/83291/elife-83291-fig2-figsupp1-data1-v2.zip
Figure 2—figure supplement 2
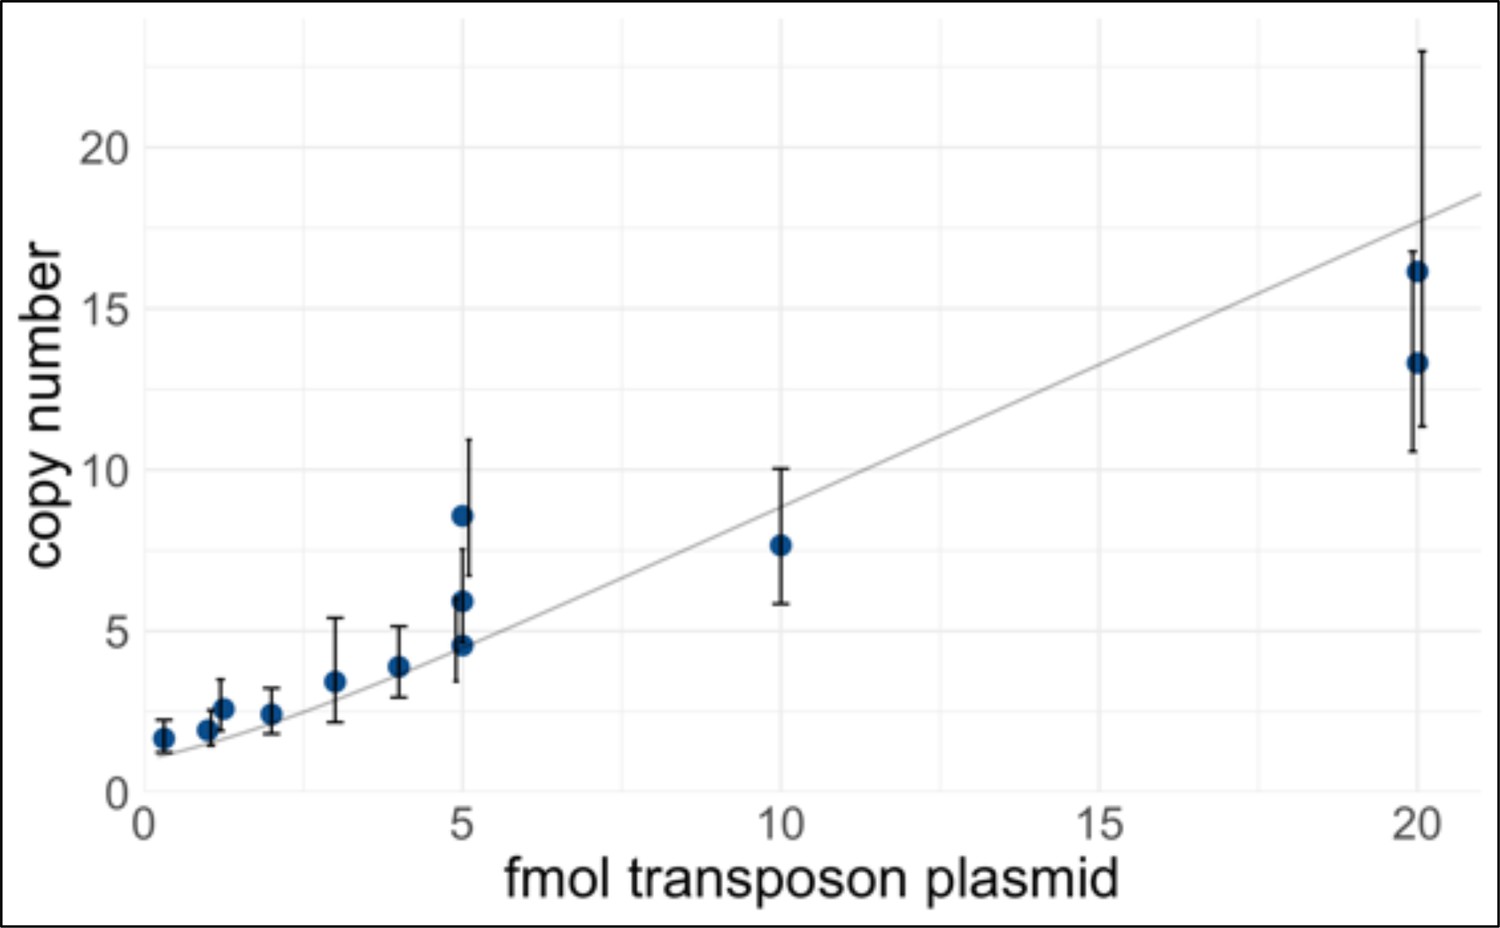
Control of transcription factor (TF) expression plasmid copy number delivered to human induced pluripotent stem cells (hiPSCs).
A PiggyBac transposon library of barcoded doxycycline-inducible TF cDNAs was electroporated into iPSCs at varying concentrations. The amount of transposase plasmid was held constant (500 ng). After selection, gDNA was extracted and the transposon copy number was measured by quantitative polymerase chain reaction (qPCR) using primer pairs CK107/108 (amplifies RPP30 genomic control) and qMPS015 (amplifies TET3G, present in all TF expression plasmids). To calculate the copy number, a standard curve was generated using a control plasmid with a known 1:1 ratio of RPP30 and TET3G. Each point represents a biological replicate, and error bars represent 95% confidence intervals of the technical replicates. The curve in light gray is a weighted-least-squares fit of a zero-truncated Poisson mean, which represents the theoretical relationship. For pooled screening, a higher copy number improves the sensitivity to detect multiway interactions, at the cost of less specificity because the reporter-positive cells will also contain ‘free rider’ TFs that are not important. In this study, we mostly performed screening at 5 fmol (medium-copy), with two experiments at 50 fmol (high-copy).
-
Figure 2—figure supplement 2—source data 1
qPCR data for copy number analysis.
- https://cdn.elifesciences.org/articles/83291/elife-83291-fig2-figsupp2-data1-v2.zip
Figure 3 with 2 supplements

Transcriptomic analysis of transcription factor (TF)-induced granulosa-like cells.
(A) Gene expression of selected markers in granulosa-like cells. Log2(TPM) values for gondal/granulosa, adrenal, and pluripotent marker genes were compared between 7 wpf male and female fetal gonad somatic cells, primary and primordial granulosa cells, TF-induced FOXL2+ cells, KGN cells, COV434 cells, and human induced pluripotent stem cells (hiPSCs). (B) Transcriptome overlap measure (TROM) comparison of TF-induced FOXL2+ cells, COV434 cells, and hiPSCs with published in vivo data from different time points in ovarian development. (C) Regulatory effects of granulosa-related TFs. RNA-seq was performed after 2 days of TF overexpression in hiPSCs (TFs shown in magenta). A differential gene expression (DEG) analysis was performed for all samples relative to the hiPSC control (n = 2 biological replicates each). Black arrows represent significant (false discovery rate <0.05) upregulation, with the width proportional to the log2-fold change. Interactions are shown between TFs (magenta) and granulosa marker genes (yellow), as well as the stromal/theca marker NR2F2 (red) and the pre-granulosa marker LGR5 (green). (D–I) Volcano plots showing DEGs in the TF overexpression experiments. Colors are as in panel C; other DEGs not listed in panel C are shown in blue. Not all DEGs could be labeled due to space limits, but they are listed in the Source Data for this figure.
-
Figure 3—source data 1
Gene expression data from bulk RNA-seq.
- https://cdn.elifesciences.org/articles/83291/elife-83291-fig3-data1-v2.zip
-
Figure 3—source data 2
List of monoclonal human induced pluripotent stem cell (hiPSC) lines used for granulosa-like cell production.
- https://cdn.elifesciences.org/articles/83291/elife-83291-fig3-data2-v2.docx
Figure 3—figure supplement 1
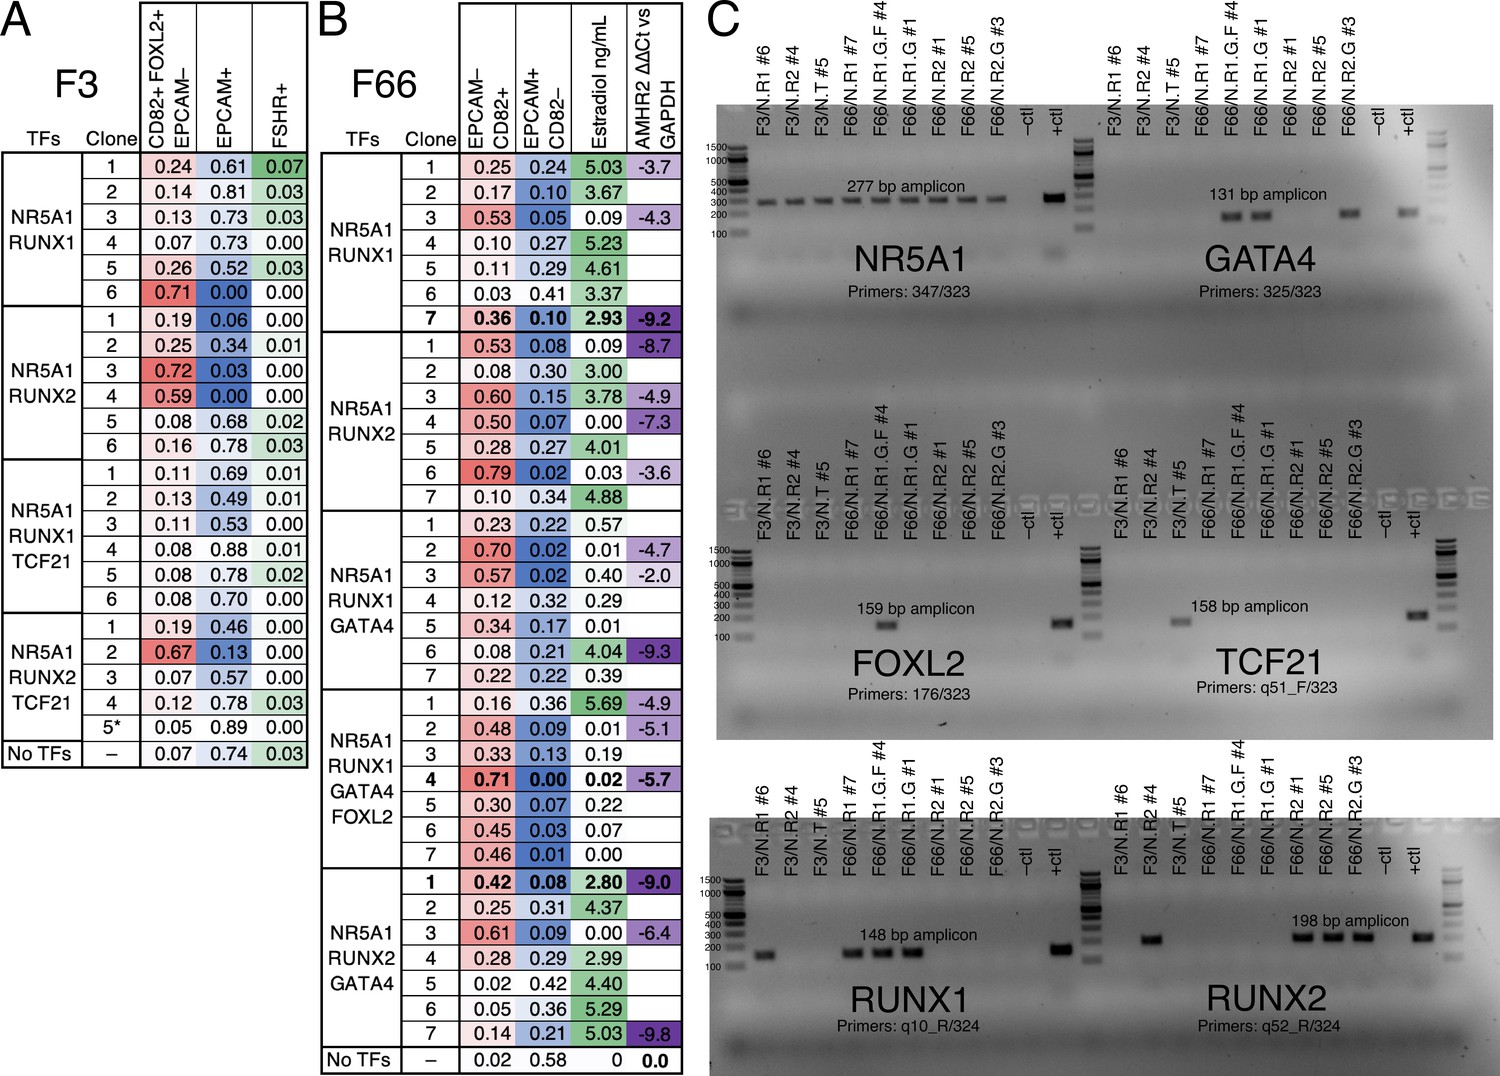
Evaluation of monoclonal human induced pluripotent stem cell (hiPSC) lines for yield and quality of granulosa-like cells.
(A) Lines generated by integrating the indicated transcription factor (TF) expression vectors into the F3/FOXL2-T2A-tdTomato hiPSC reporter line were evaluated by flow cytometry for FOXL2, CD82, EPCAM, and follicle-stimulating hormone receptor (FSHR). Note that line F3/N.T #5 lacks the RUNX2 expression vector (see panel C). (B) Lines generated by integrating the indicated TF expression vectors into the F66 wild-type hiPSC line were evaluated by flow cytometry for CD82 and EPCAM, as well as for estradiol production and qPCR to measure AMHR2 expression (the no-TF control was used as a reference for calculating ∆∆Ct). (C) Genotyping to detect integrated TF expression vectors in selected lines. The negative control was wild-type F66 gDNA, and the positive control was gDNA plus TF Library #1. Primer sequences are listed in Supplementary file 1.
-
Figure 3—figure supplement 1—source data 1
Flow cytometry data and raw gel scans.
- https://cdn.elifesciences.org/articles/83291/elife-83291-fig3-figsupp1-data1-v2.zip
Figure 3—figure supplement 2

Monoclonal human induced pluripotent stem cell (hiPSC) lines with integrated transcription factors (TFs) allow the efficient production of granulosa-like cells in response to doxycycline.
(A) Method of inducing granulosa-like cells from hiPSCs. Vertical black bars represent media changes. (B) Dose dependence for the production of FOXL2+CD82+EPCAM− granulosa-like cells, shown in two monoclonal lines. Granulosa-like cells are efficiently induced from both clones (but not from control cells lacking TF expression vectors) in a doxycycline-dependent manner. (C) Representative gating strategy to analyze flow cytometry data.
-
Figure 3—figure supplement 2—source data 1
Flow cytometry data.
- https://cdn.elifesciences.org/articles/83291/elife-83291-fig3-figsupp2-data1-v2.zip
Figure 4
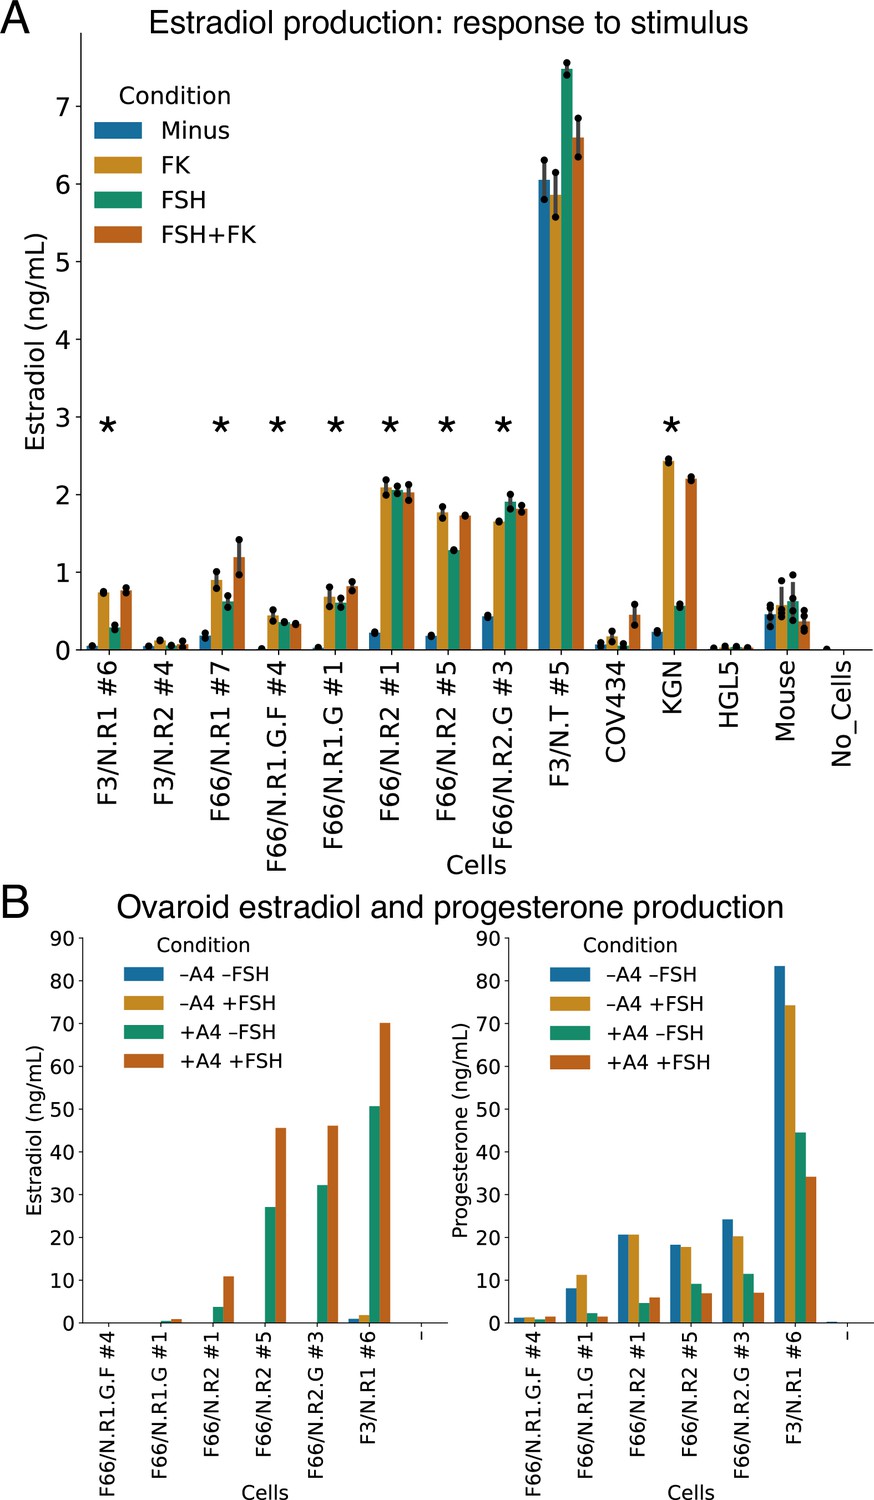
Hormonal signaling by granulosa-like cells.
(A) Granulosa-like cells produce estradiol in the presence of androstenedione and either FSH or forskolin (FK). Results are shown from nine monoclonal populations (see Figure 3—source data 2) of granulosa-like cells (n = 2 biological replicates for each of 9 clones, error bars are 95% CI), as well as the COV434 and KGN human ovarian cancer cell lines, HGL5 immortalized primary human granulosa cells, and primary adult mouse granulosa cells. Asterisks mark lines where FSH production significantly (two-tailed t-test, p < 0.05) increased upon stimulation. Exact p values are given in the Source Data. (B) Ovaroids produce both estradiol and progesterone. Estradiol production requires androstenedione and is stimulated by FSH. Results are shown for ovaroids formed with six different monoclonal samples of granulosa-like cells (n = 1 sample per ovaroid per condition), at 3 days post-aggregation.
-
Figure 4—source data 1
Hormone assay data.
- https://cdn.elifesciences.org/articles/83291/elife-83291-fig4-data1-v2.zip
Figure 5 with 1 supplement
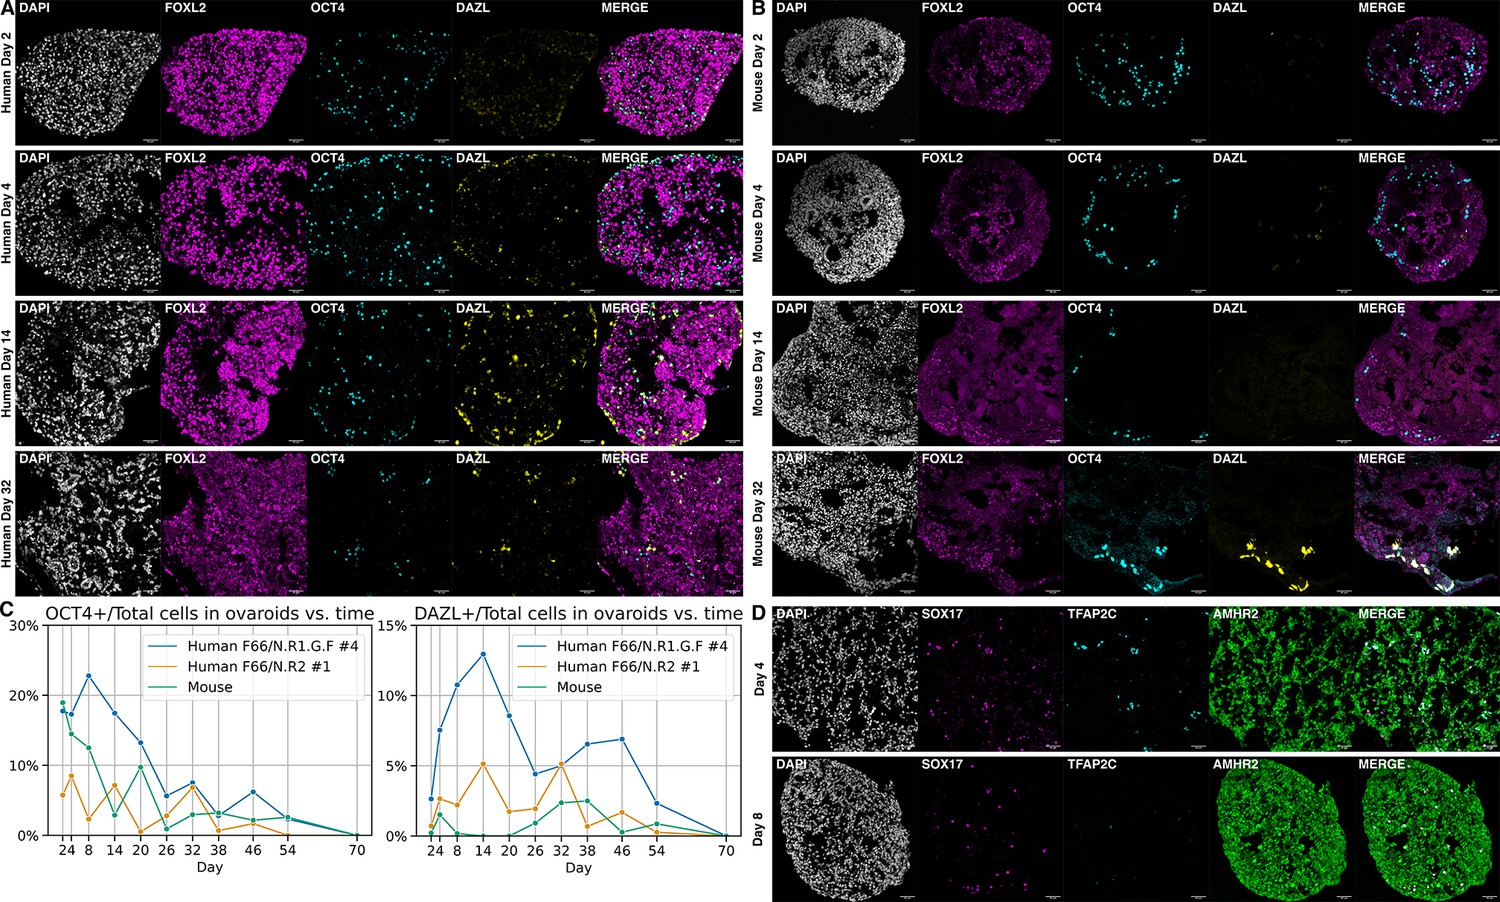
Ovaroid development and germ cell maturation.
Scale bars in immunofluorescence images are 40 µm. (A) Human ovaroid (F66/N.R1.G.F #4 granulosa-like cells + hPGCLCs) sections at days 2, 4, 14, and 32 of culture, stained for FOXL2 (granulosa), OCT4 (germ cell/pluripotent), and DAZL (mature germ cell). (B) Mouse ovaroid (fetal mouse ovarian somatic cells + hPGCLCs) sections stained as in panel A. (C) Fraction of OCT4+ and DAZL+ cells relative to the total (DAPI+) over time in human ovaroids and mouse xeno-ovaroids. Counts were performed at 11 time points on images from 2 replicates of human ovaroids (F66/N.R1.G.F #4 and F66/N.R2 #1 granulosa-like cells + hPGCLCs) and 1 replicate of mouse xeno-ovaroids. (D) Human ovaroid (F66/N.R2 #1 granulosa-like cells + hPGCLCs) sections at days 4 and 8 of culture, stained for SOX17 (germ cell), TFAP2C (early germ cell), and AMHR2 (granulosa).
-
Figure 5—source data 1
Ovaroid images (hPGCLC + F66/N.R1.G.F #4).
- https://cdn.elifesciences.org/articles/83291/elife-83291-fig5-data1-v2.zip
-
Figure 5—source data 2
Ovaroid images (hPGCLC + F66/N.R2 #1).
- https://cdn.elifesciences.org/articles/83291/elife-83291-fig5-data2-v2.zip
-
Figure 5—source data 3
Ovaroid images (hPGCLC + mouse fetal ovarian cells).
- https://cdn.elifesciences.org/articles/83291/elife-83291-fig5-data3-v2.zip
-
Figure 5—source data 4
Cell counts from ovaroid images.
- https://cdn.elifesciences.org/articles/83291/elife-83291-fig5-data4-v2.zip
Figure 5—figure supplement 1
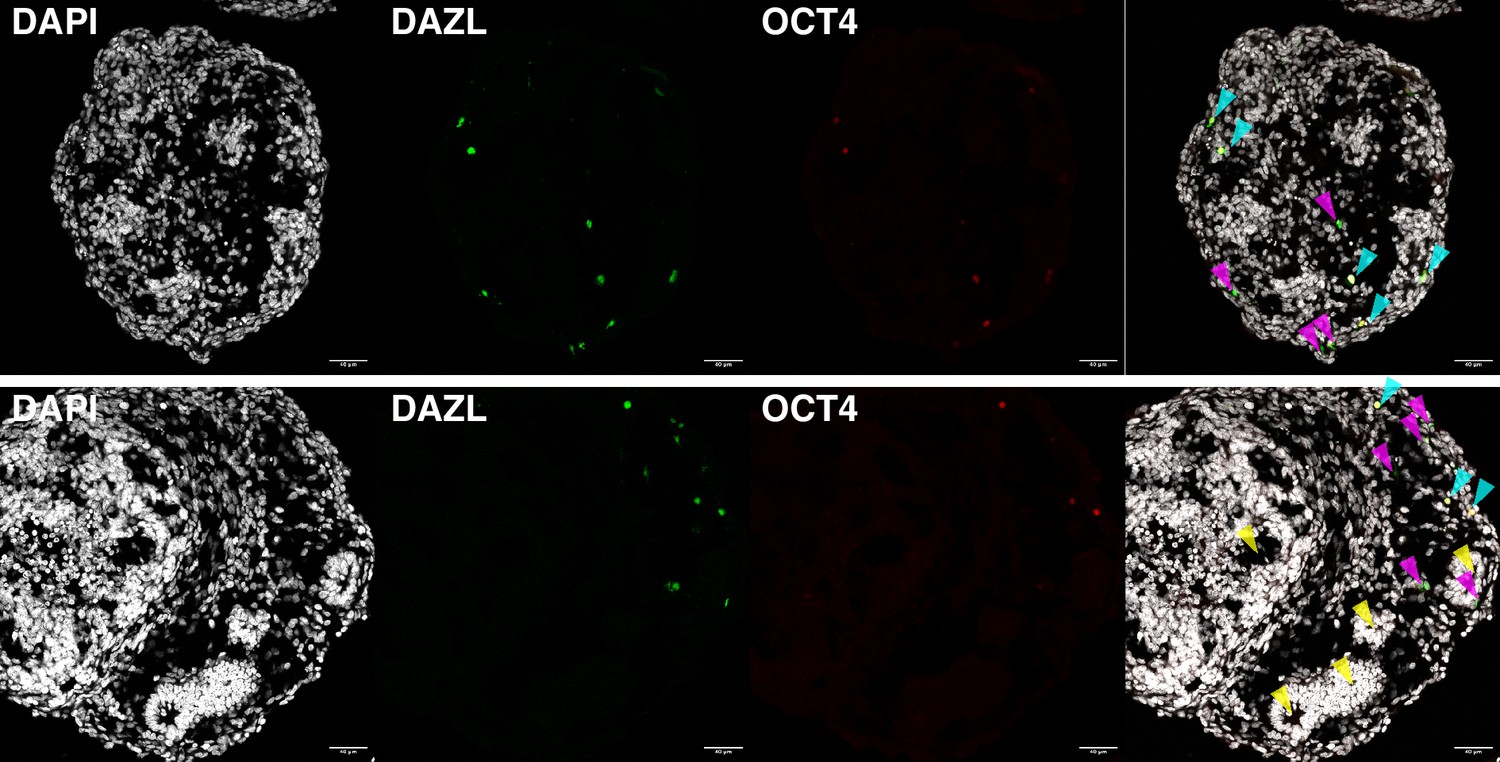
DAZL and OCT4 expression observed by immunofluorescence in day 16 ovaroids.
Some DAZL+OCT4− cells (magenta arrows) are visible, as well as DAZL+OCT4+ cells (cyan arrows). Ovaroids are also beginning to form follicle-like morphology (yellow arrows). Scale bar is 40 µm.
Figure 6

Ovaroid follicle formation.
(A) Day 35 human ovaroid (F66/N.R1.G #7 + hPGCLC) sections stained for FOXL2, OCT4, and AMHR2. Scale bars are 40 µm. Follicle-like structures are marked with yellow triangles. (B) Whole-ovaroid view of follicle-like structures in human ovaroids (F66/N.R1.G #7). Scale bars are 1 mm. (C) Section of human ovaroid (F66/N.R1.G.F #4 + hPGCLC) at day 70 of culture, stained for FOXL2, NR2F2, and AMHR2, showing multiple small follicles (yellow triangles) consisting single layers of FOXL2+AMHR2+ cells. NR2F2+ cells are interspersed between these. Scale bars are 100 µm. (D) Section of human ovaroid (F66/N.R2 #1 + hPGCLC) at day 70 of culture, stained for FOXL2, NR2F2, and AMHR2, showing an antral follicle consisting of FOXL2+AMHR2+ granulosa-like cells arranged in several layers around a central cavity. NR2F2 staining is visible outside of the follicle (marked ‘Stroma’). Scale bars are 100 µm.
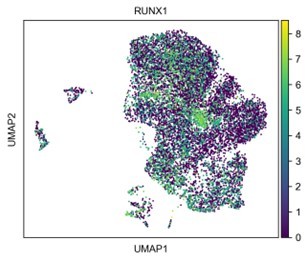
Figure 7
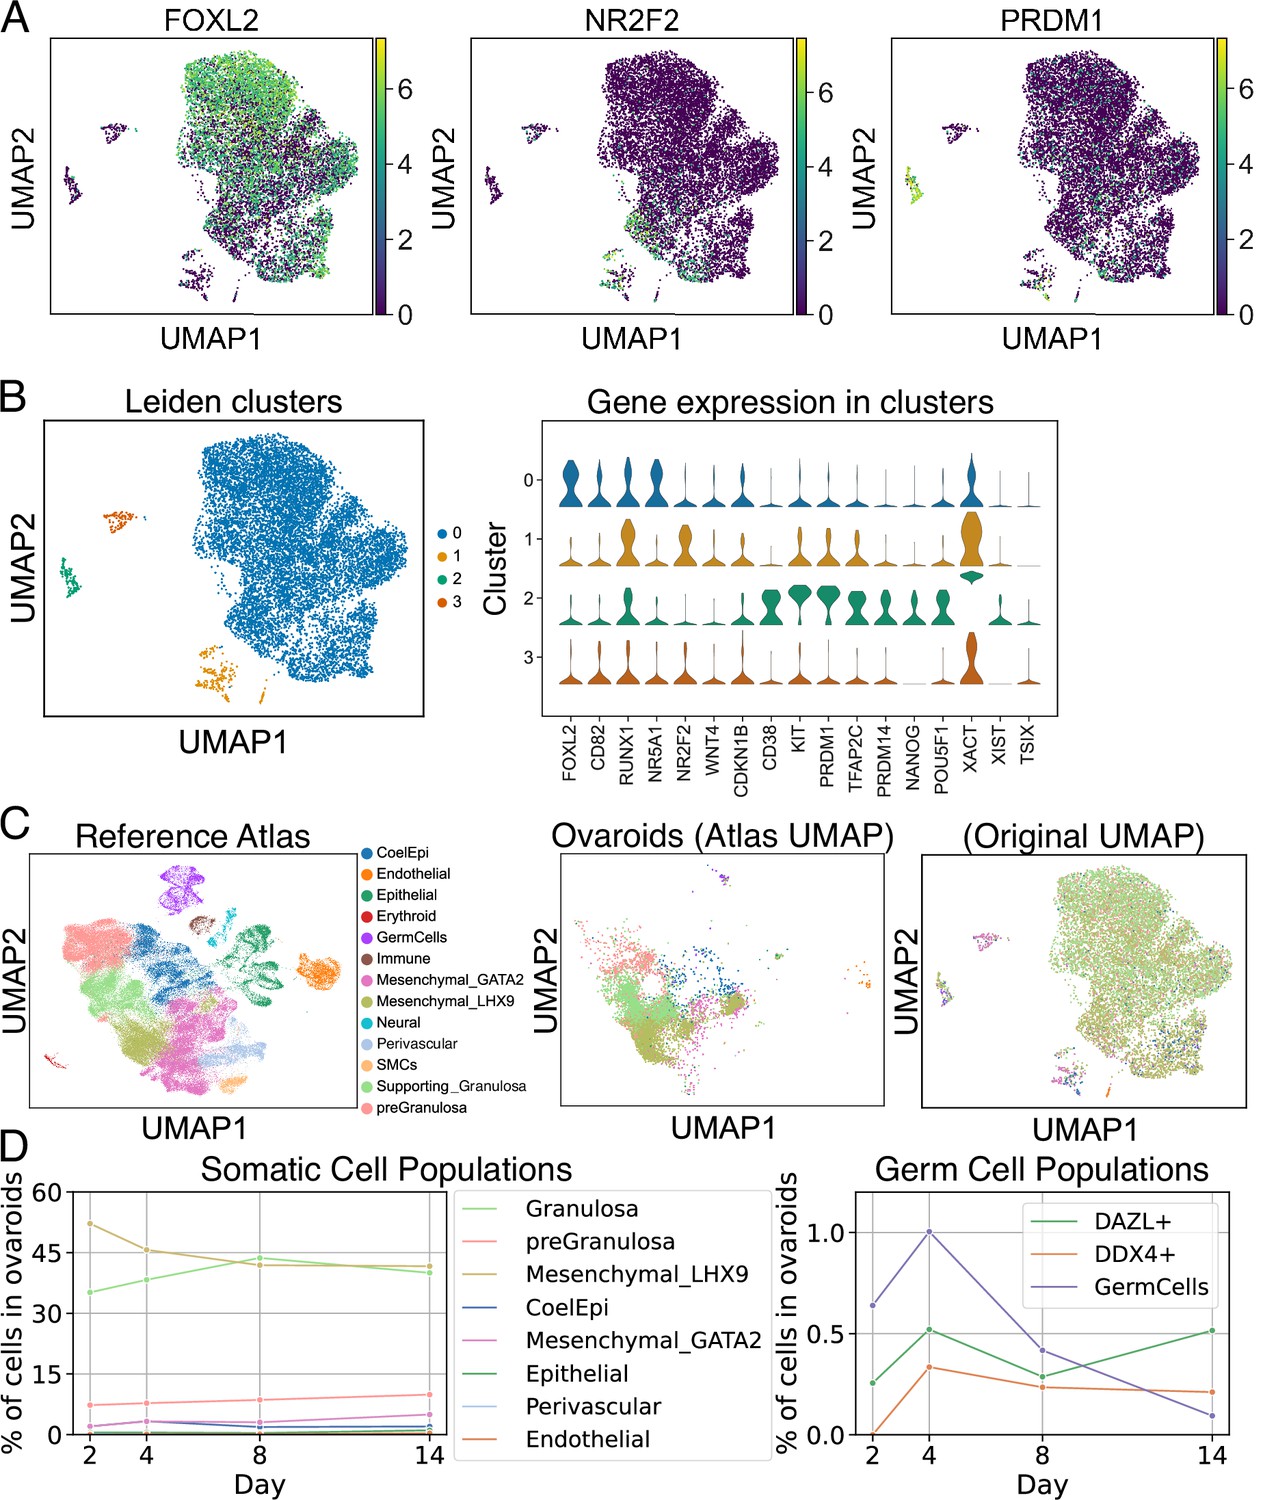
scRNA-seq analysis of ovaroids (F66/N.R1.G.F #4 granulosa-like cells + hPGCLCs). Data from all samples (days 2, 4, 8, and 14) were combined for joint dimensionality reduction and clustering.
(A) Expression (log2 CPM) of selected granulosa (FOXL2), stroma/theca (NR2F2), and germ cell (PRDM1) markers. (B) Leiden clustering shows four main clusters; the expression (log2 CPM) of marker genes is plotted for each. (C) Mapping of cells onto a human fetal ovary reference atlas (Garcia-Alonso et al., 2022) and assignment of cell types. (D) Proportion of somatic cell types, germ cells, DAZL+ cells, and DDX4+ cells in ovaroids from each day.
-
Figure 7—source data 1
Cell populations from scRNA-seq and differential gene expression.
- https://cdn.elifesciences.org/articles/83291/elife-83291-fig7-data1-v2.zip
Author response image 1
Tables
Key resources table
| Reagent type (species) or resource | Designation | Source or reference | Identifiers | Additional information |
|---|---|---|---|---|
| Strain, strain background (Mus musculus, female) | CD-1 | Charles River Labs | RRID:IMSR_CRL:022 | Used for fetal ovary isolation |
| Strain, strain background (Mus musculus, female) | BALB/c | Charles River Labs | RRID:IMSR_APB:4790 | Used for adult ovary isolation |
| Cell line (Homo sapiens, female) | F3 iPSC | ATCC | ATCC-BXS0116 | |
| Cell line (Homo sapiens, female) | F66 iPSC | Other | Previously derived in-house from the NIA Aging Cell Repository fibroblast line AG07141 using Epi5 footprint- free episomal reprogramming | |
| Cell line (Homo sapiens, female) | F2 PGCLC | Kobayashi et al., 2022; PMID:35148847 | PMID:35148847 | Derived from the ATCC- BXS0115 hiPSC line |
| Recombinant DNA reagent | pHDR-FOXL2-T2A- tdTomato-PuroTK | This paper | RRID:Addgene_192892 | For engineering reporter hiPSCs |
| Recombinant DNA reagent | pX330-FOXL2-cterm | This paper | RRID:Addgene_192893 | For engineering reporter hiPSCs |
| Recombinant DNA reagent | Super PiggyBac Transposase Expression Vector | System Bioscience | Cat:PB210PA-1 | |
| Recombinant DNA reagent | pPB-cT3G-cERP2-TCF21 | This paper | RRID:Addgene_192894 | Dox-inducible TF expression |
| Recombinant DNA reagent | pPB-cT3G-cERP2-JUN | This paper | RRID:Addgene_192895 | Dox-inducible TF expression |
| Recombinant DNA reagent | pPB-cT3G-cERP2-GATA4 | This paper | RRID:Addgene_192896 | Dox-inducible TF expression |
| Recombinant DNA reagent | pPB-cT3G-cERP2-CEBPD | This paper | RRID:Addgene_192897 | Dox-inducible TF expression |
| Recombinant DNA reagent | pPB-cT3G-cERP2-EMX2 | This paper | RRID:Addgene_192898 | Dox-inducible TF expression |
| Recombinant DNA reagent | pPB-cT3G-cERP2-MYC | This paper | RRID:Addgene_192899 | Dox-inducible TF expression |
| Recombinant DNA reagent | pPB-cT3G-cERP2-NR2F2 | This paper | RRID:Addgene_192900 | Dox-inducible TF expression |
| Recombinant DNA reagent | pPB-cT3G-cERP2-FOSB | This paper | RRID:Addgene_192901 | Dox-inducible TF expression |
| Recombinant DNA reagent | pPB-cT3G-cERP2-KLF2 | This paper | RRID:Addgene_192902 | Dox-inducible TF expression |
| Recombinant DNA reagent | pPB-cT3G-cERP2-ZBTB16 | This paper | RRID:Addgene_192903 | Dox-inducible TF expression |
| Recombinant DNA reagent | pPB-cT3G-cERP2-YBX1 | This paper | RRID:Addgene_192904 | Dox-inducible TF expression |
| Recombinant DNA reagent | pPB-cT3G-cERP2-LHX1 | This paper | RRID:Addgene_192905 | Dox-inducible TF expression |
| Recombinant DNA reagent | pPB-cT3G-cERP2-WT1 | This paper | RRID:Addgene_192906 | Dox-inducible TF expression |
| Recombinant DNA reagent | pPB-cT3G-cERP2-JUNB | This paper | RRID:Addgene_192907 | Dox-inducible TF expression |
| Recombinant DNA reagent | pPB-cT3G-cERP2-KLF4 | This paper | RRID:Addgene_192908 | Dox-inducible TF expression |
| Recombinant DNA reagent | pPB-cT3G-cERP2-KLF6 | This paper | RRID:Addgene_192909 | Dox-inducible TF expression |
| Recombinant DNA reagent | pPB-cT3G-cERP2-HOXC9 | This paper | RRID:Addgene_192910 | Dox-inducible TF expression |
| Recombinant DNA reagent | pPB-cT3G-cERP2-ATF4 | This paper | RRID:Addgene_192911 | Dox-inducible TF expression |
| Recombinant DNA reagent | pPB-cT3G-cERP2-PPARG | This paper | RRID:Addgene_192912 | Dox-inducible TF expression |
| Recombinant DNA reagent | pPB-cT3G-cERP2-EGR1 | This paper | RRID:Addgene_192913 | Dox-inducible TF expression |
| Recombinant DNA reagent | pPB-cT3G-cERP2-FOXL2 | This paper | RRID:Addgene_192914 | Dox-inducible TF expression |
| Recombinant DNA reagent | pPB-cT3G-cERP2-NR5A1 | This paper | RRID:Addgene_192915 | Dox-inducible TF expression |
| Recombinant DNA reagent | pPB-cT3G-cERP2-TSC22D3 | This paper | RRID:Addgene_192916 | Dox-inducible TF expression |
| Recombinant DNA reagent | pPB-cT3G-cERP2-MAFF | This paper | RRID:Addgene_192917 | Dox-inducible TF expression |
| Recombinant DNA reagent | pPB-cT3G-cERP2-ELK1 | This paper | RRID:Addgene_192918 | Dox-inducible TF expression |
| Recombinant DNA reagent | pPB-cT3G-cERP2-NR1H2 | This paper | RRID:Addgene_192919 | Dox-inducible TF expression |
| Recombinant DNA reagent | pPB-cT3G-cERP2-TOX2 | This paper | RRID:Addgene_192920 | Dox-inducible TF expression |
| Recombinant DNA reagent | pPB-cT3G-cERP2-LHX9 | This paper | RRID:Addgene_192921 | Dox-inducible TF expression |
| Recombinant DNA reagent | pPB-cT3G-cERP2-ZFPM2 | This paper | RRID:Addgene_192922 | Dox-inducible TF expression |
| Recombinant DNA reagent | pPB-cT3G-cERP2-HOPX | This paper | RRID:Addgene_192923 | Dox-inducible TF expression |
| Recombinant DNA reagent | pPB-cT3G-cERP2-FOS | This paper | RRID:Addgene_192924 | Dox-inducible TF expression |
| Recombinant DNA reagent | pPB-cT3G-cERP2-NR4A1 | This paper | RRID:Addgene_192925 | Dox-inducible TF expression |
| Recombinant DNA reagent | pPB-cT3G-cERP2-RUNX2 | This paper | RRID:Addgene_192926 | Dox-inducible TF expression |
| Recombinant DNA reagent | pPB-cT3G-cERP2-TAF4B | This paper | RRID:Addgene_192927 | Dox-inducible TF expression |
| Recombinant DNA reagent | pPB-cT3G-cERP2-RUNX1 | This paper | RRID:Addgene_192928 | Dox-inducible TF expression |
| Antibody | anti-AMHR2 (Rabbit IgG, polyclonal) | Thermo Fisher | Cat:PA5-13902; RRID:AB_2305463 | IF (1:100) |
| Antibody | anti-DAZL (Rabbit IgG, monoclonal) | Abcam | Cat:ab215718; RRID:AB_2893177 | IF (1:500) |
| Antibody | anti-FOXL2 (Goat IgG, polyclonal) | Novus | Cat:NB100-1277; RRID:AB_2106187 | IF (1:250) |
| Antibody | anti-44838 (Mouse IgG, monoclonal) | BD Bioscience | Cat:611202; RRID:AB_398736 | IF (1:200) |
| Antibody | anti-SOX17 (Goat IgG, polyclonal) | Novus | Cat:AF1924; RRID:AB_355060 | IF (1:500) |
| Antibody | anti-TFAP2C (Mouse IgG, monoclonal) | Abcam | Cat:ab110635; RRID:AB_10858471 | IF (1:250) |
| Antibody | anti-NR2F2 (Mouse IgG, monoclonal) | Novus | Cat:H7147; RRID:AB_1964214 | IF (1:250) |
| Antibody | anti-AMHR2-FITC (Rabbit IgG polyclonal) | Biorbyt | Cat:orb37457; RRID:AB_10992015 | Flow cytometry (1:60) |
| Antibody | anti-CD82-PerCP-Cy5.5 (Mouse IgG monoclonal) | BioLegend | Cat:342111; RRID:AB_2750124 | Flow cytometry (1:60) |
| Antibody | anti-EpCAM-APC-Cy7 (Mouse IgG monoclonal) | BioLegend | Cat:324245; RRID:AB_2783193 | Flow cytometry (1:60) |
| Antibody | anti-FSHR-APC (Mouse IgG monoclonal) | R&D Systems | Cat:FAB65591A; RRID:AB_2920602 | Flow cytometry (1:60) |
| Antibody | anti-Mouse IgG-AF647 (Donkey IgG polyclonal) | Fisher | Cat:A31571; RRID:AB_162542 | IF secondary (1:250) |
| Antibody | anti-Goat IgG-AF568 (Donkey IgG polyclonal) | Fisher | Cat:A11057; RRID:AB_2534104 | IF secondary (1:500) |
| Antibody | anti-Rabbit IgG-AF488 (Donkey IgG F(ab’)2 polyclonal) | Jackson | Cat:711-546-152; RRID:AB_2340619 | IF secondary (1:500) |
| Commercial assay or kit | Estradiol ELISA | DRG | Cat:EIA-2693 | |
| Commercial assay or kit | Progesterone ELISA | DRG | Cat:EIA-1561 | |
| Commercial assay or kit | Evercode WT Mega scRNA-seq kit (v1) | Parse Biosciences | Cat:EC-W01050 | |
| Software, algorithm | Python scripts for data analysis | This paper (Brixi et al., 2023) | https://github.com/programmablebio/granulosa, (copy archived at swh:1:rev:3c650290779db376c4d1f3a14960b08b17ae5561) | |
| Software, algorithm | Parse Biosciences barcode alignment pipeline | Parse Biosciences | Version 0.9.6 |
Additional files
-
Supplementary file 1
List of oligonucleotides.
This file contains all the oligonucleotide sequences used for this project.
- https://cdn.elifesciences.org/articles/83291/elife-83291-supp1-v2.xlsx
-
Supplementary file 2
Media optimization for granulosa-like cell induction.
This file contains the analyzed flow cytometry data from a preliminary optimization experiment, in which we performed our granulosa differentiation protocol on a polyclonal population of FOXL2-tdTomato reporter iPSCs with NR5A1 and RUNX1 expression vectors integrated. We tested three different basal media (DMEM–F12 + 10% KSR, aRPMI + B27, and mTeSR) and various additives (CHIR99021, FGF, TGF-beta, BMP4, and estradiol). We monitored expression of FOXL2-T2A-tdTomato, CD82, FSHR, and EpCAM.
- https://cdn.elifesciences.org/articles/83291/elife-83291-supp2-v2.xlsx
-
Supplementary file 3
Gene ontology term enrichment.
A differential gene expression analysis was performed (relative to iPSC control) on transcription factor (TF) overexpression samples (Figure 3) as well as iPSCs differentiated according to our granulosa differentiation protocol, but in the absence of TF expression. These files list significantly (FDR <0.05) enriched gene ontology terms for biological processes among upregulated (log2fc >3, p < 0.05) and downregulated (log2fc <−3, p < 0.05) genes relative to iPSC control for each condition.
- https://cdn.elifesciences.org/articles/83291/elife-83291-supp3-v2.gz
-
Supplementary file 4
Differential gene expression in ovaroid scRNA-seq.
This file contains lists of genes differentially expressed in each of the Leiden clusters, as well as a list of genes differentially expressed in DAZL+ vs. DAZL− germ cells and enriched gene ontology terms.
- https://cdn.elifesciences.org/articles/83291/elife-83291-supp4-v2.zip
-
MDAR checklist
- https://cdn.elifesciences.org/articles/83291/elife-83291-mdarchecklist1-v2.docx
Download links
A two-part list of links to download the article, or parts of the article, in various formats.
Downloads (link to download the article as PDF)
Open citations (links to open the citations from this article in various online reference manager services)
Cite this article (links to download the citations from this article in formats compatible with various reference manager tools)
Directed differentiation of human iPSCs to functional ovarian granulosa-like cells via transcription factor overexpression
eLife 12:e83291.
https://doi.org/10.7554/eLife.83291


