The clinical pharmacology of tafenoquine in the radical cure of Plasmodium vivax malaria: An individual patient data meta-analysis
- Oxford University Clinical Research Unit, Hospital for Tropical Diseases, Viet Nam
- Centre for Tropical Medicine and Global Health, Nuffield Department of Medicine, University of Oxford, United Kingdom
- WorldWide Antimalarial Resistance Network, United Kingdom
- Global Health Division, Menzies School of Health Research, Charles Darwin University, Australia
- Mahidol Oxford Tropical Medicine Research Unit, Faculty of Tropical Medicine, Mahidol University, Thailand
- Centre for Epidemiology and Biostatistics, Melbourne School of Population and Global Health, University of Melbourne, Australia
- Unit of Leishmaniasis and Malaria, Instituto de Medicina Tropical “Alexander von Humboldt”, Universidad Peruana Cayetano Heredia, Peru
- Fundação de Medicina Tropical Dr Heitor Vieira Dourado, Brazil
- Formerly Senior Director, Global Health, GlaxoSmithKline, United Kingdom
- Department of Infectious Diseases, Northwick Park Hospital, United Kingdom
- Shoklo Malaria Research Unit, Mahidol–Oxford Tropical Medicine Research Unit, Faculty of Tropical Medicine, Mahidol University, Thailand
Figures
Figure 1

Kaplan-Meier survival curves for the time to first recurrence in 1073 patients with P. vivax malaria in the efficacy analysis population.
Patients are grouped by tafenoquine mg/kg dosing category (dashed and dotted lines) versus low-dose primaquine (15 mg base for 14 days) or no radical cure (thick lines). The vertical ticks show the censoring times.
Figure 2
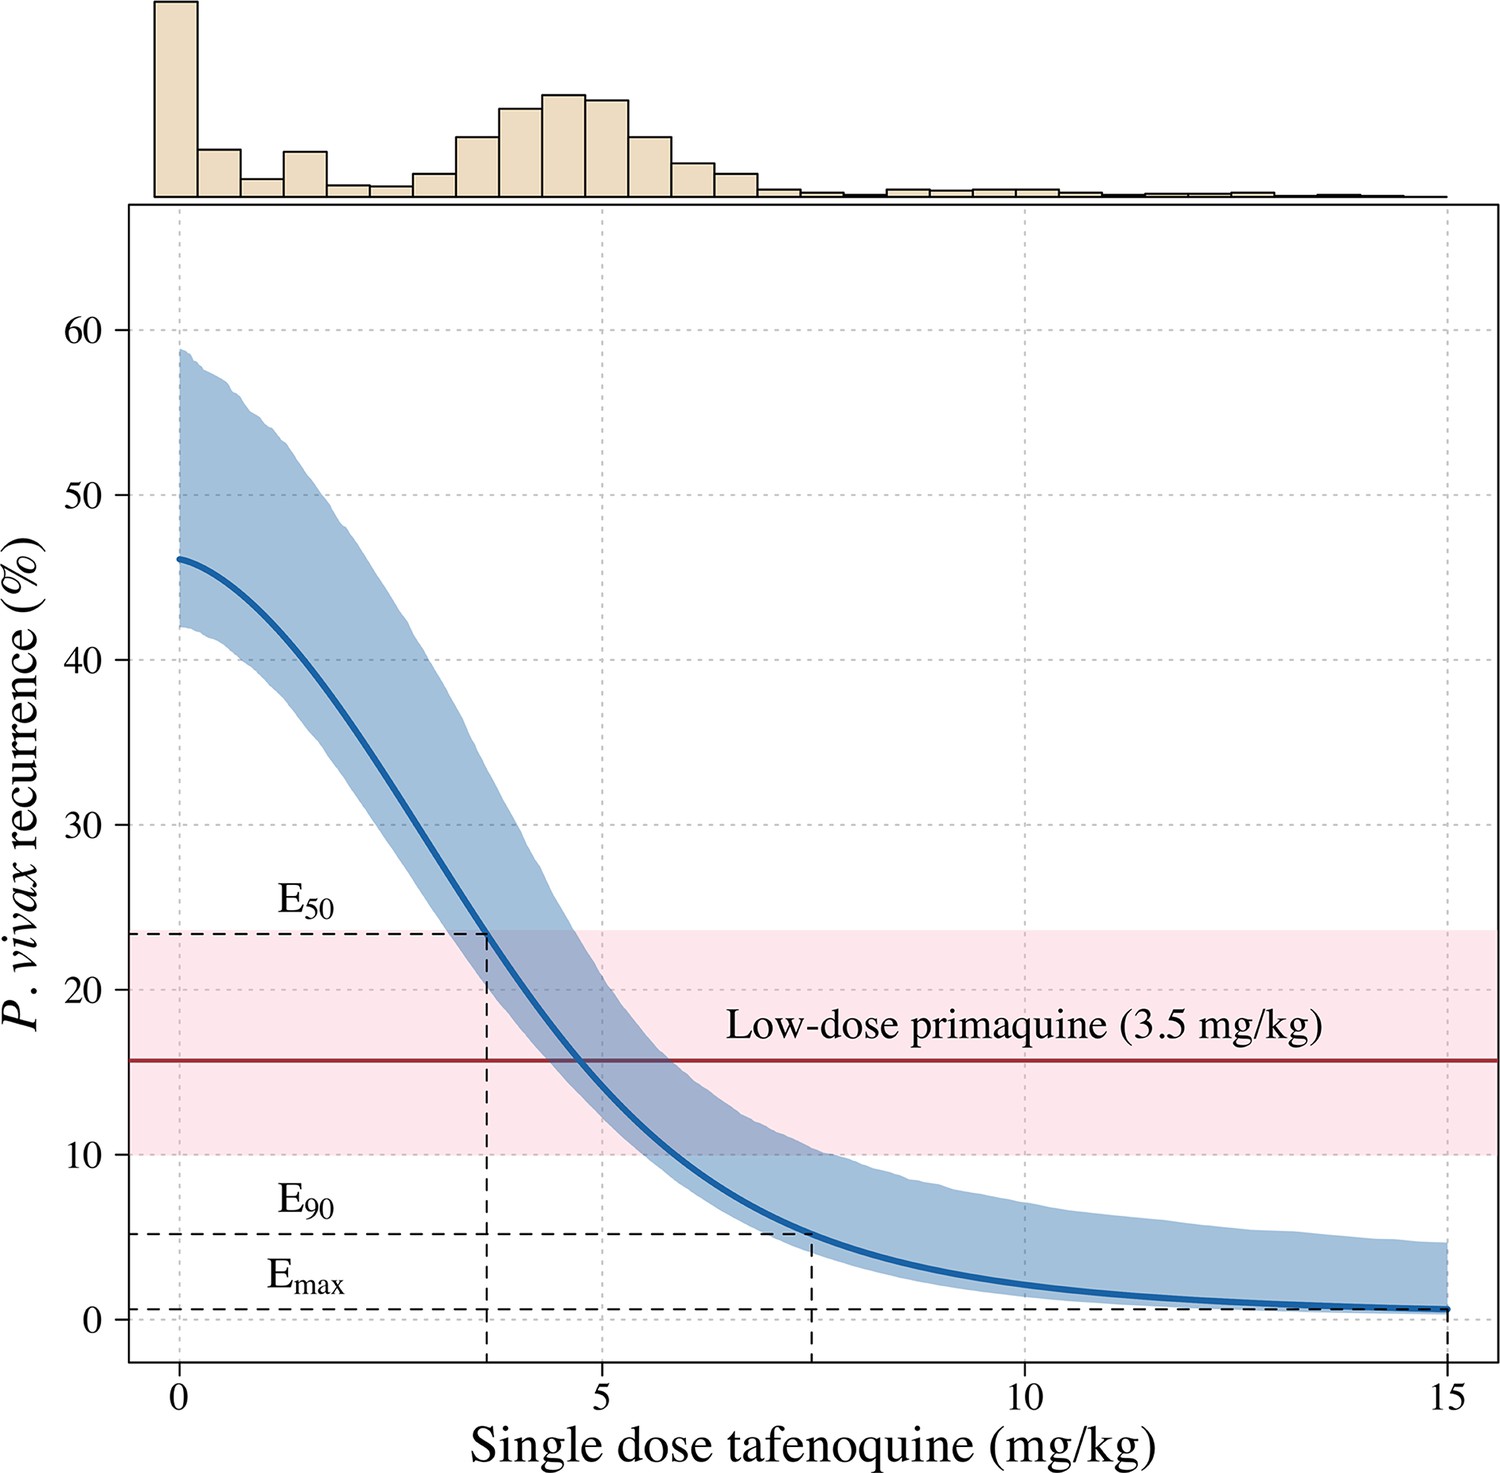
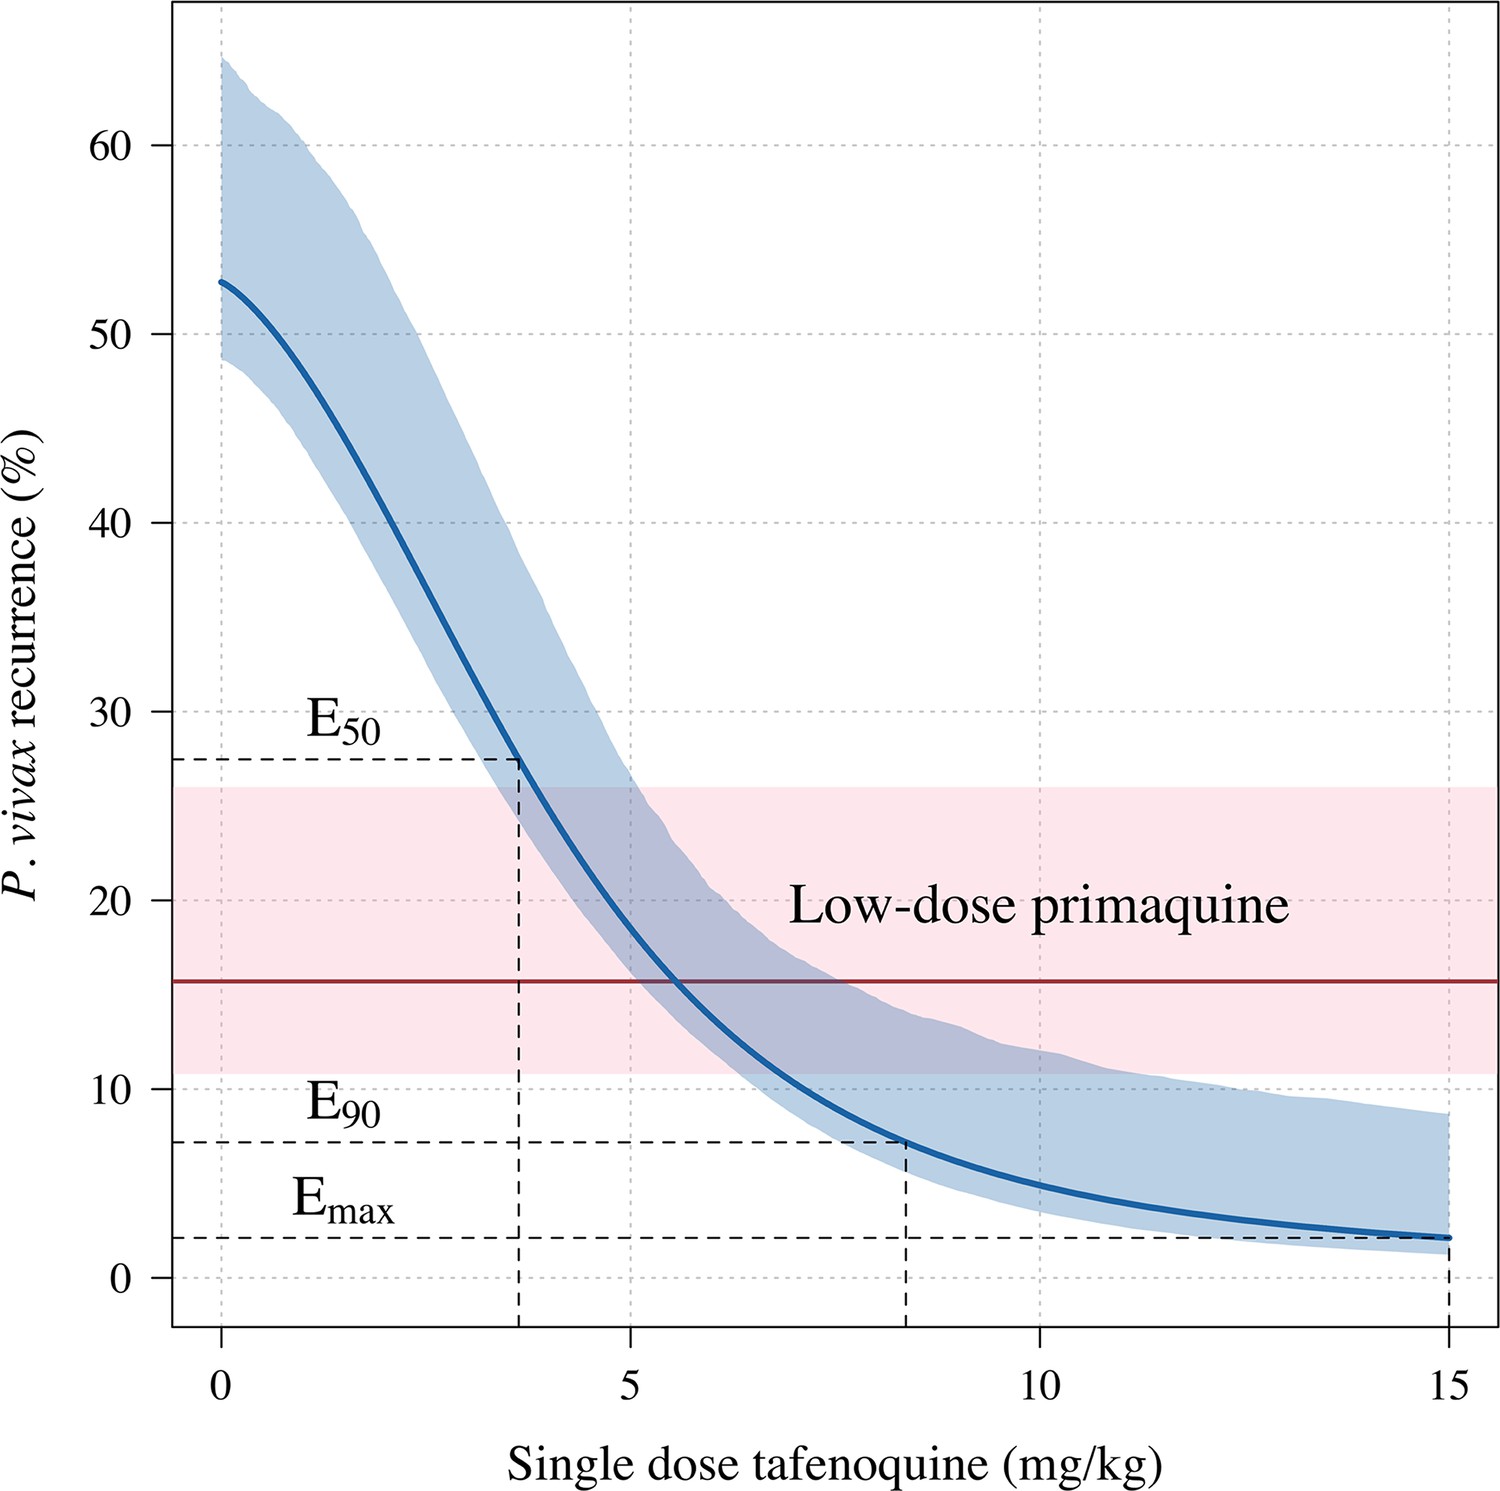
Tafenoquine mg/kg dose and the probability of a recurrence of P.
vivax malaria within 4 months under the Emax model. Thick blue (shaded blue): mean probability of recurrence as a function of the tafenoquine mg/kg dose (95% CI); thick red (shaded pink): mean probability of P. vivax recurrence after 3.5 mg/kg primaquine (95% CI). The distribution of administered tafenoquine mg/kg doses is shown by the histogram above (this includes patients who received no radical cure treatment, but for clarity does not include patients who received primaquine: n=816; range: 0–14.3 mg/kg).
Figure 3
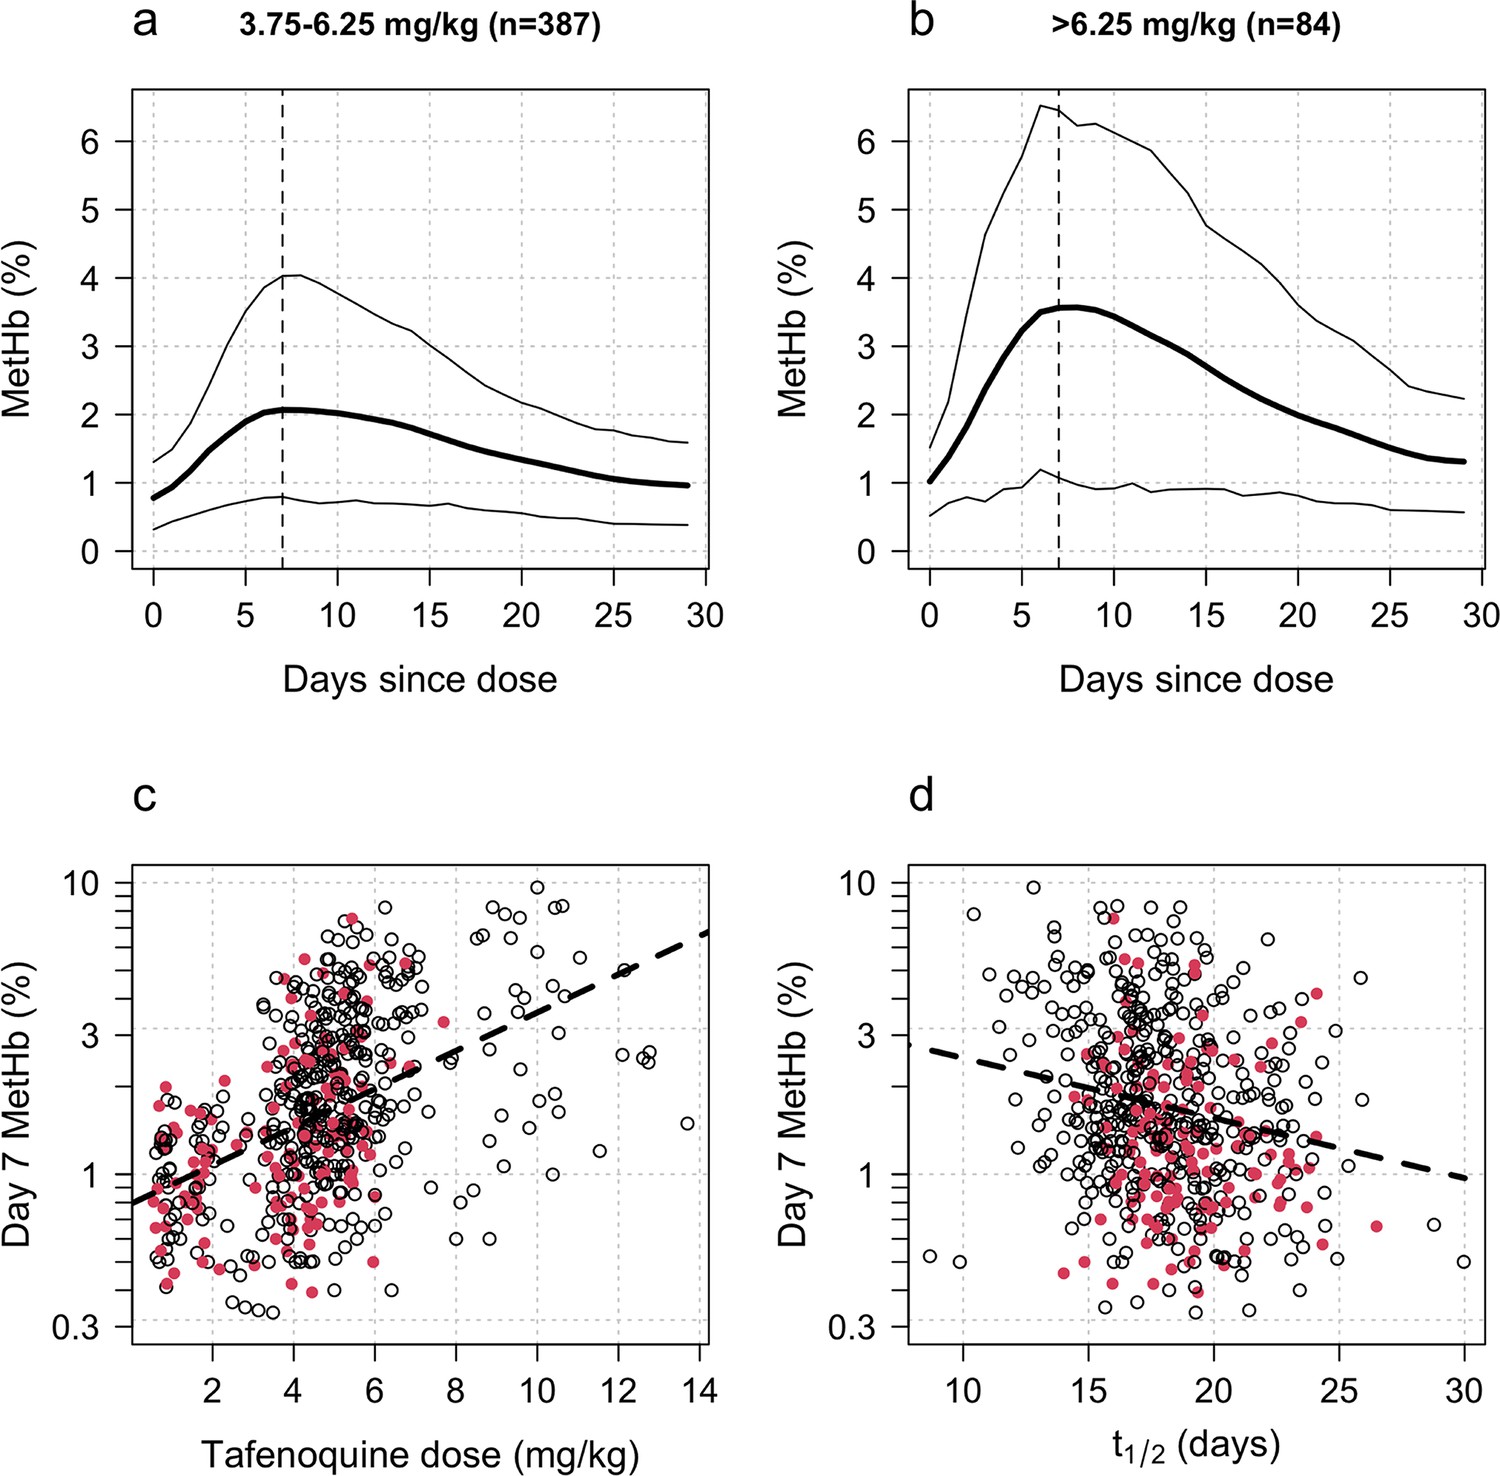
Tafenoquine and methaemoglobin (MetHb) production.
Panels a and b: dose-dependent increases in blood MetHb concentrations expressed as a proportion (%) of the haemoglobin concentration following tafenoquine +chloroquine administration in patients with P. vivax malaria (mean: thick lines; 10th and 90th percentiles: thin lines). The approximate peak concentrations occur one week after receiving tafenoquine (shown by the vertical dashed lines). Panel c: relationship between the administered tafenoquine doses (mg/kg) and the interpolated MetHb concentrations on day 7 (log10 scale). Panel d: relationship between the estimated individual tafenoquine terminal elimination half-lives () and the interpolated MetHb concentrations on day 7 (log10 scale). Panels c and d: patients who had a recurrence within 4 months are shown by the filled red circles.
Figure 4
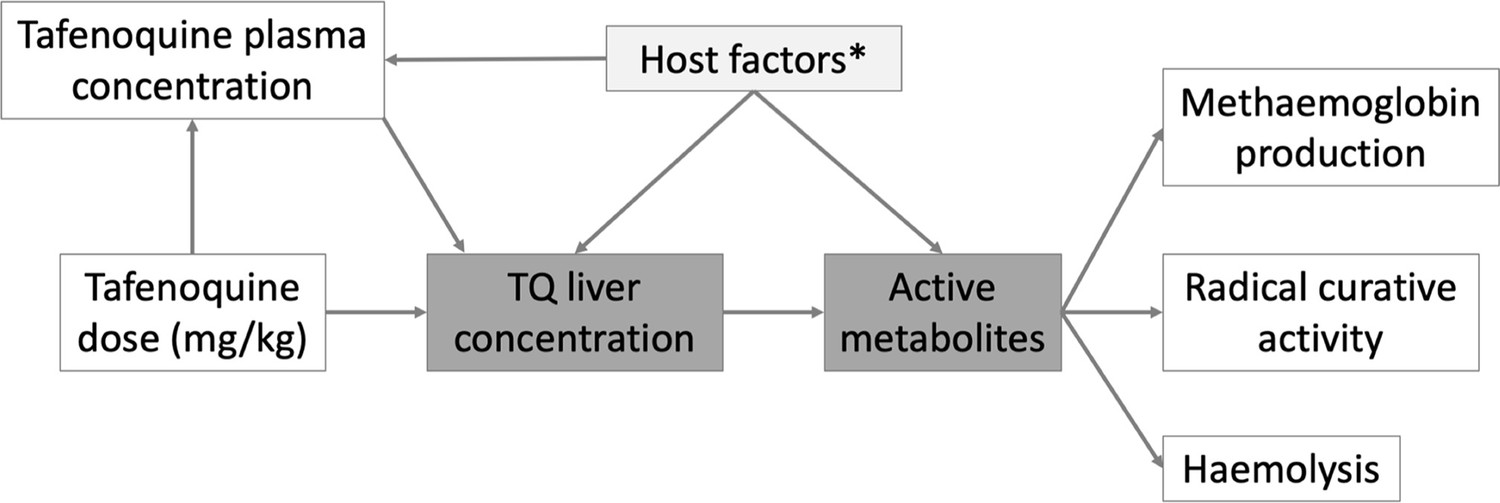
Hypothetical causal model of the clinical pharmacology of tafenoquine for the radical treatment of P.
vivax malaria. The dark grey shaded boxes represent non-observables; lighter shaded grey represents partially observable measures. *Potential host factors include genetic factors such as CYP2D6 polymorphisms; age related enzyme maturation; drug-drug interactions.
Appendix 1—figure 1
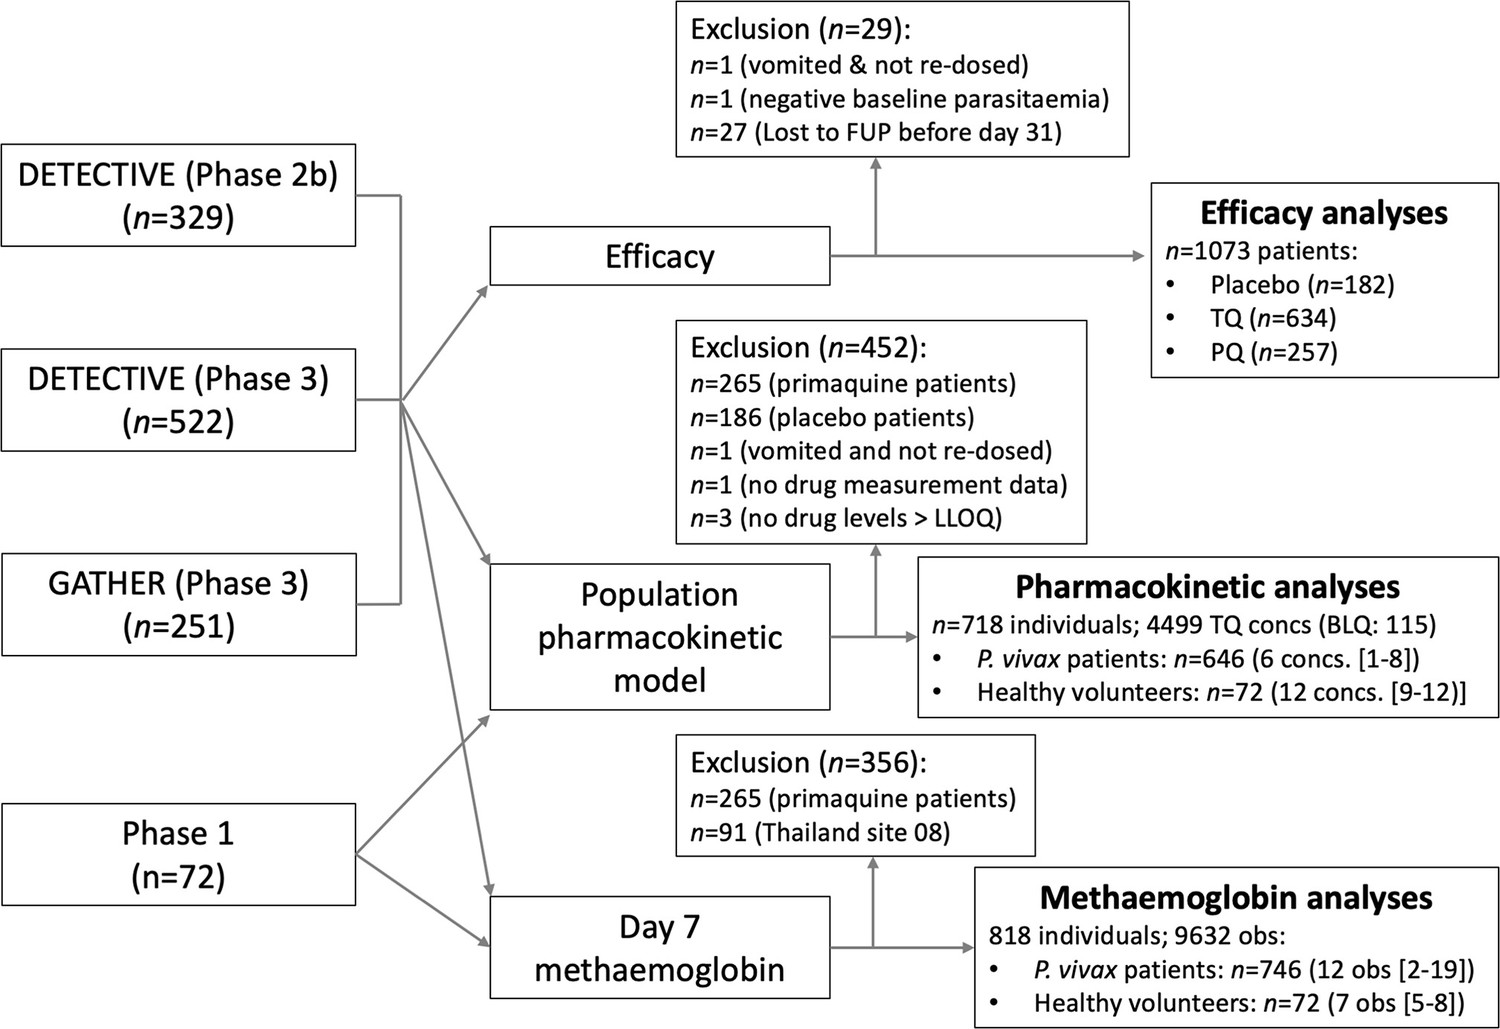
Flow diagram showing the construction of the analysis datasets for the binary endpoint efficacy analyses (note that the patients who dropped out before day 31 are included in the time to event analyses), the pharmacometric analyses, Cmax, and ) and the day 7 methaemoglobin analyses.
Appendix 1—figure 2
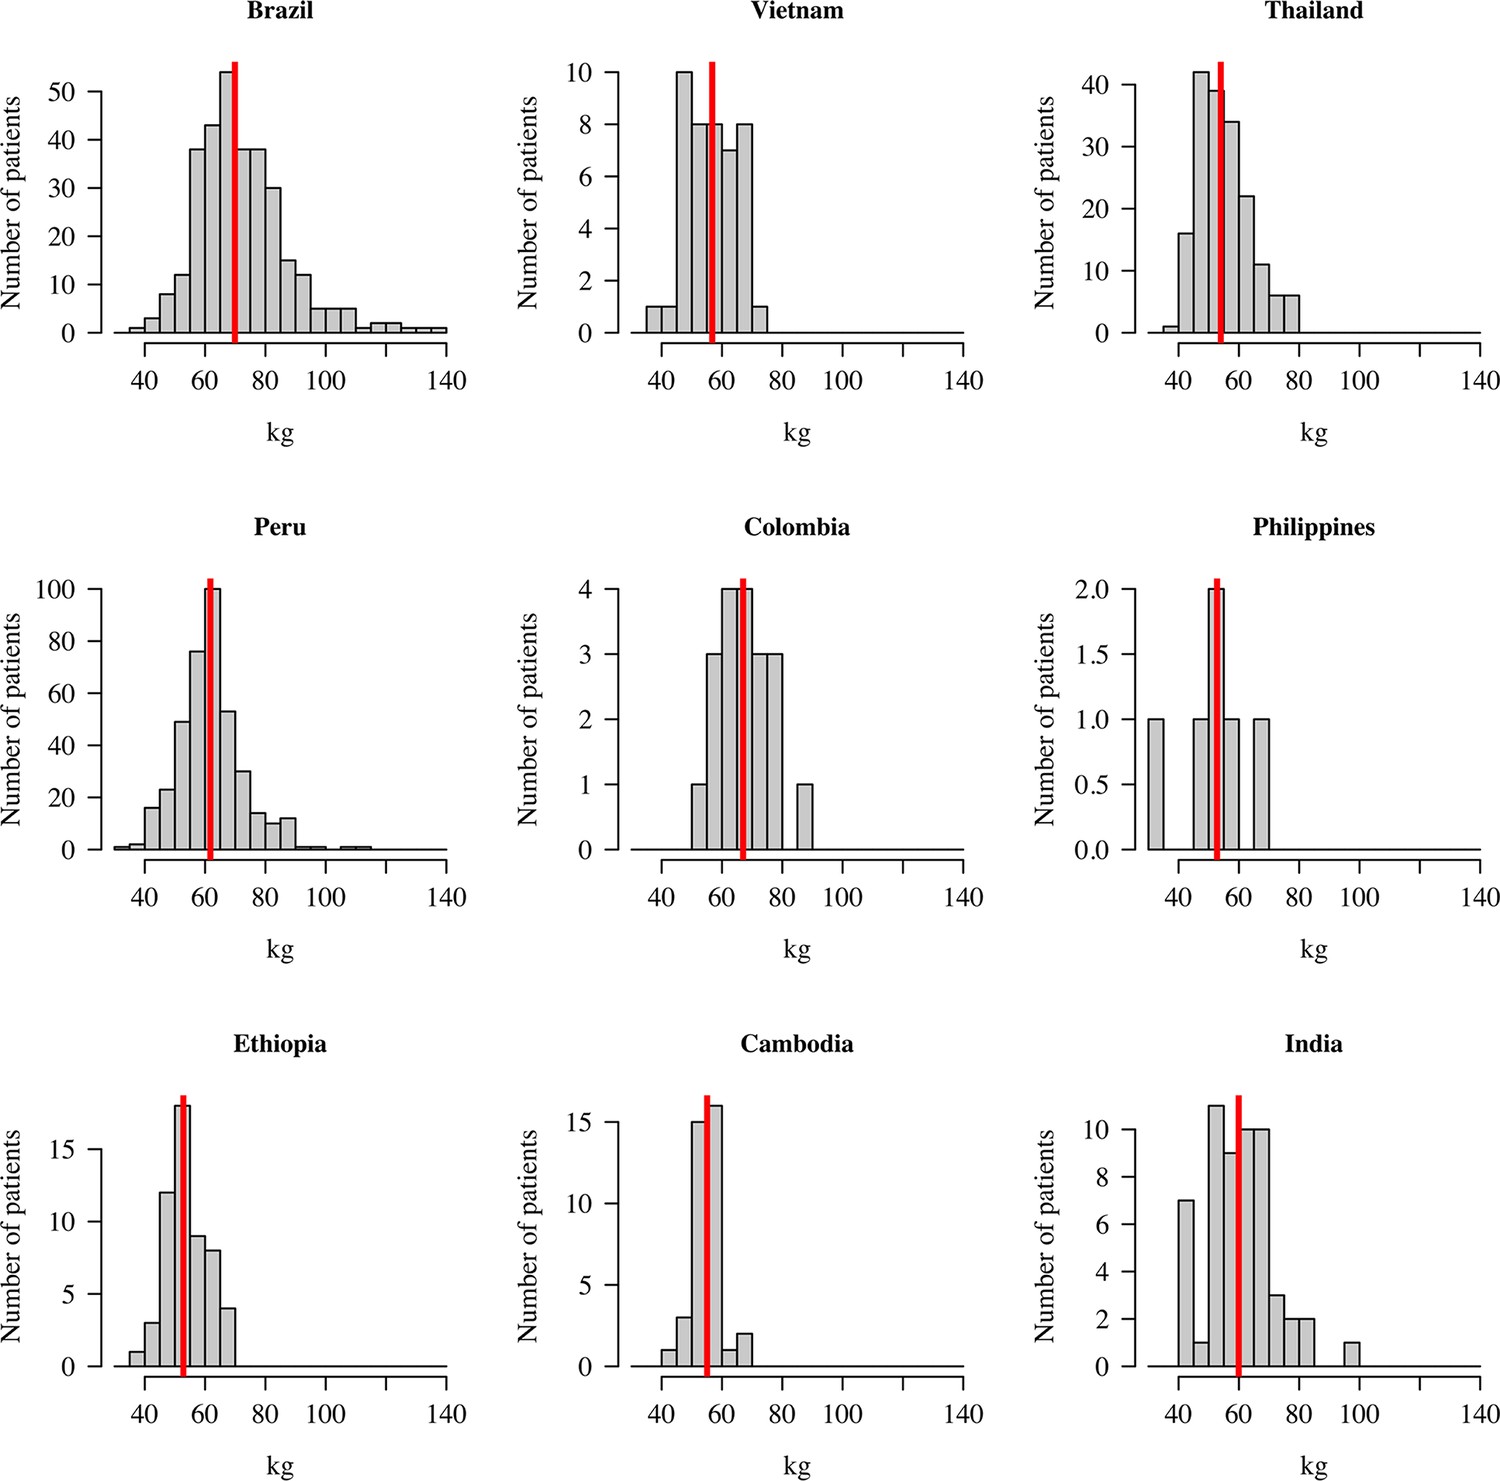
Distribution of patient weights across the nine countries.
The vertical red lines show the median weights.
Appendix 1—figure 3
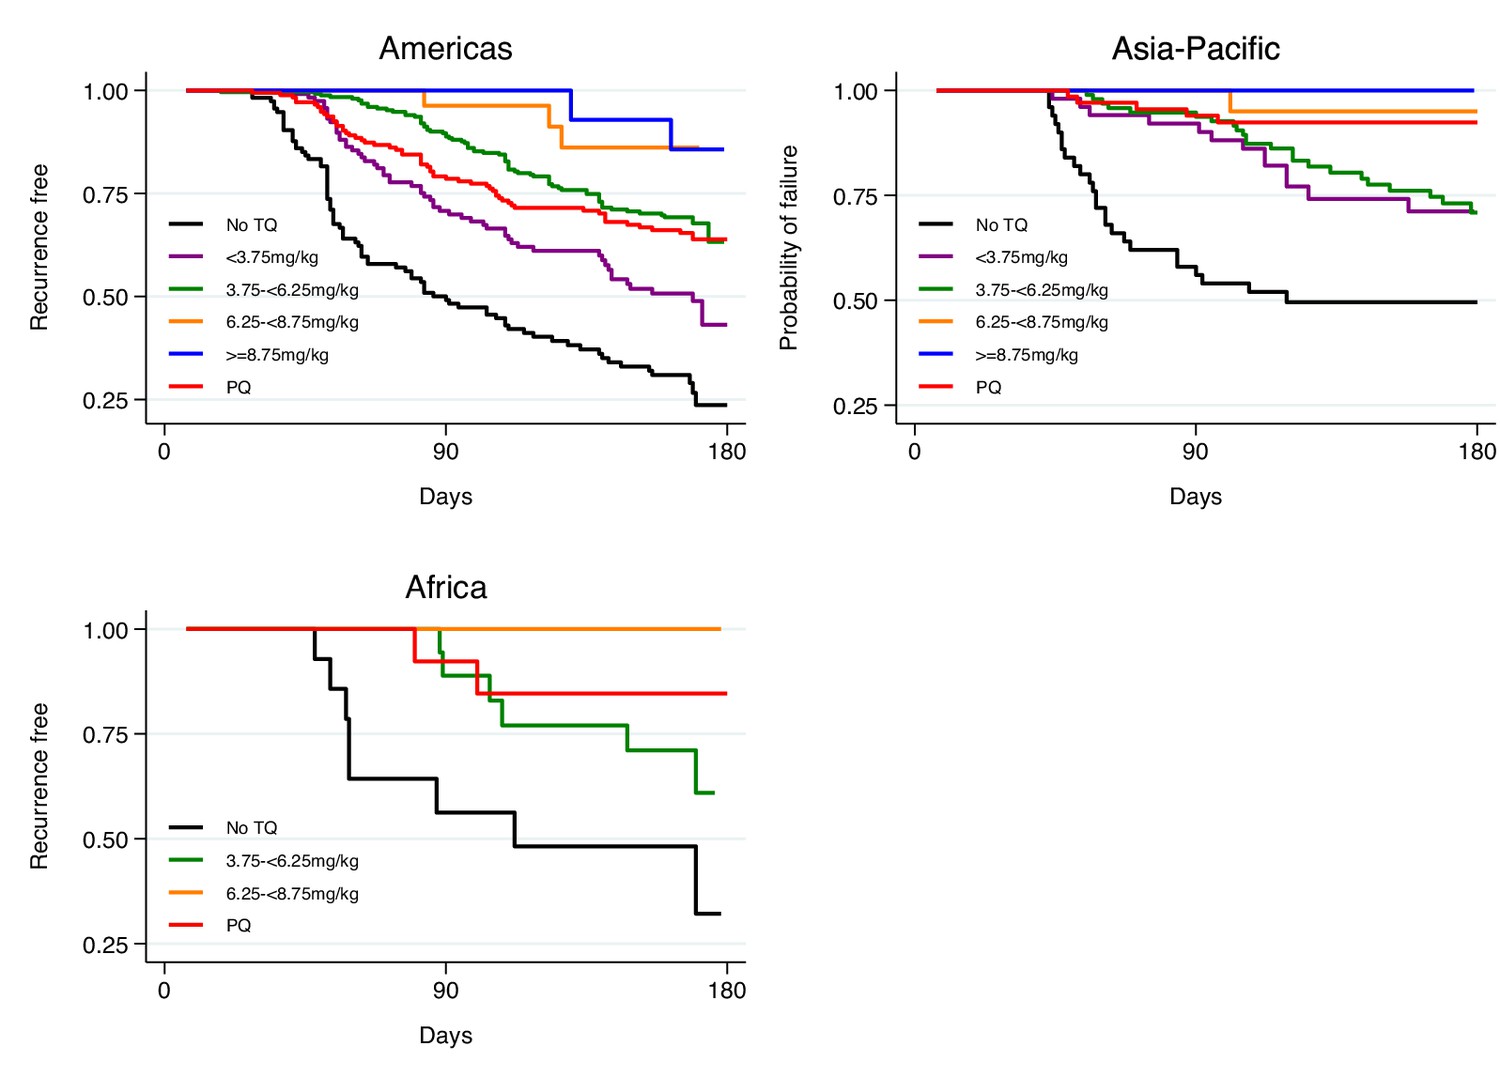
Kaplan-Meier survival curves for the time to first recurrence by region after administration of chloroquine without tafenoquine or with tafenoquine 300mg in P.vivax patients.
Results include 455 patients from the Americas, 171 patients from Asia-Pacific and 42 patients from Africa. TQ: tafenoquine.
Appendix 1—figure 4
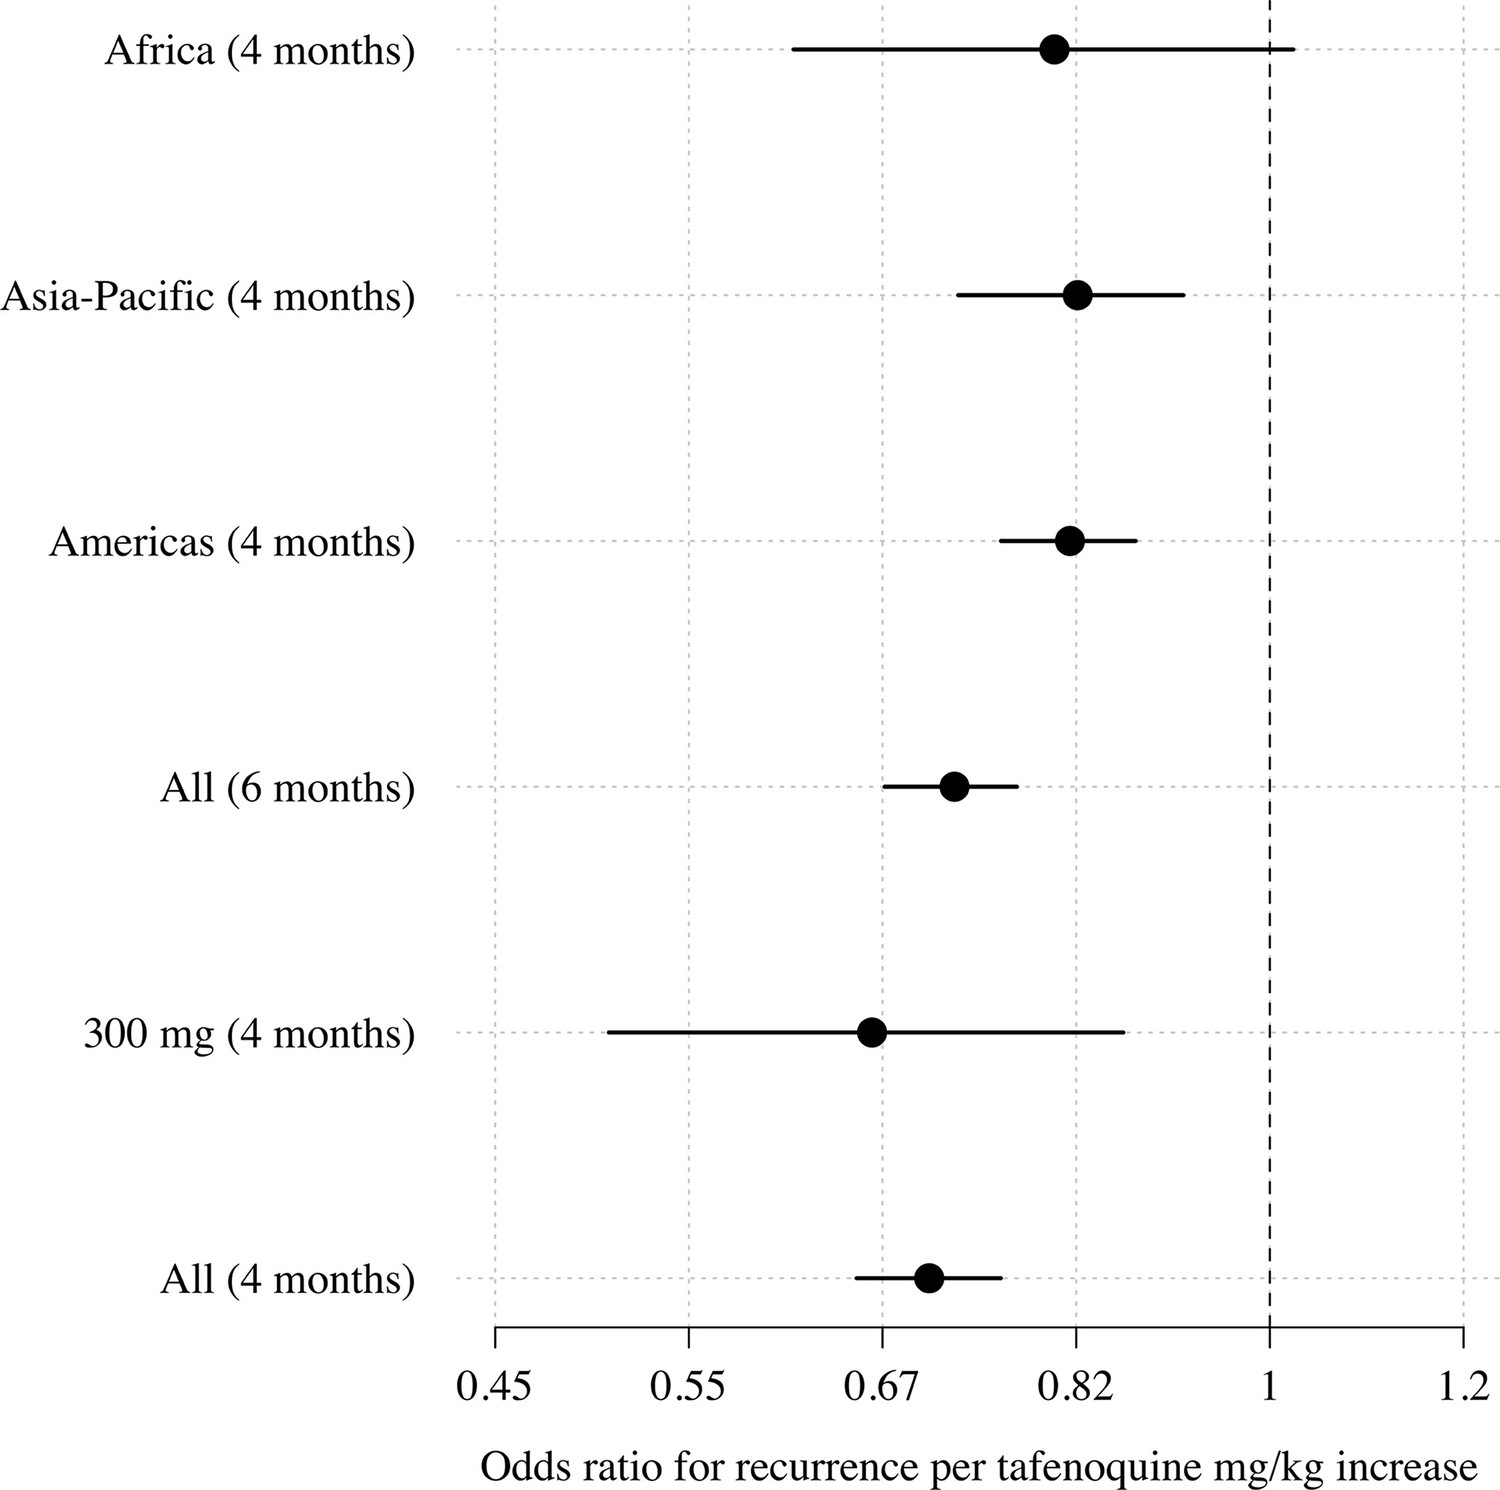
Comparison of estimated odds-ratios (95% CI) for the two endpoints (any recurrence by 4 months and any recurrence by 6 months); the sensitivity analysis in the 300mg group only; subgroups by geographic region.
Appendix 1—figure 5
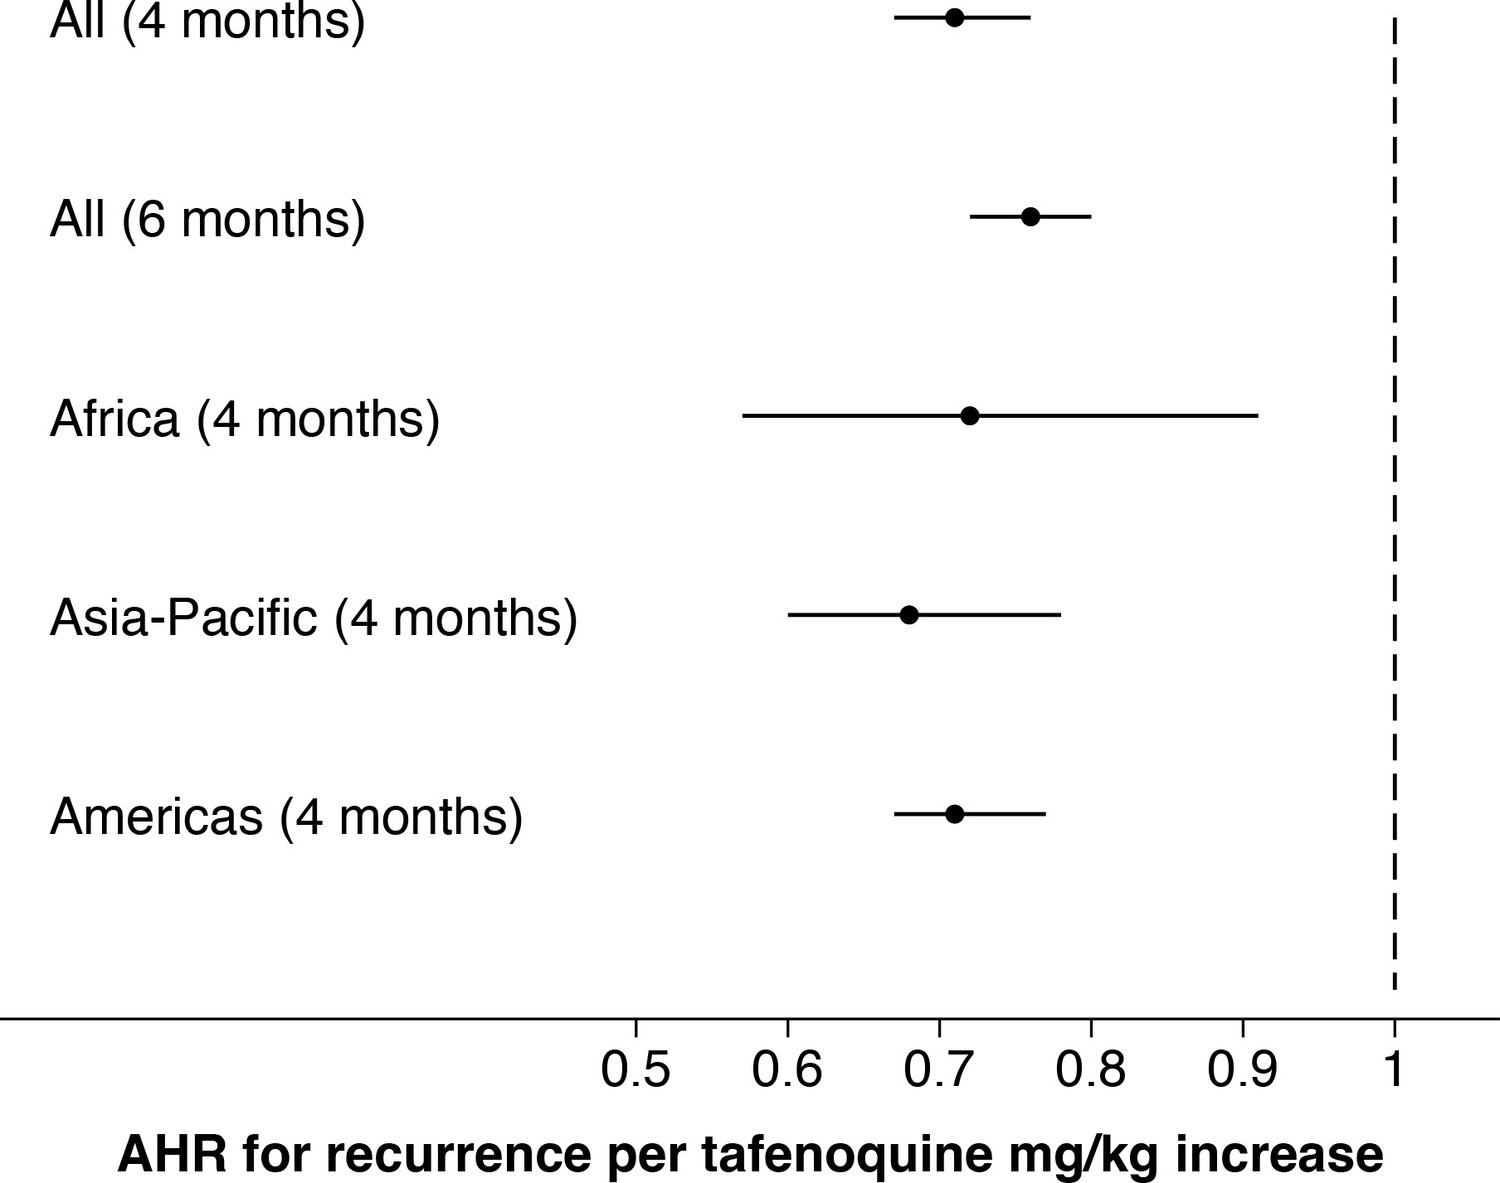
Comparison of estimated adjusted hazards ratio (95% CI) using time to event analysis for the two endpoints (any recurrence by 4 months and any recurrence by 6 months); subgroups by geographic region.
Appendix 1—figure 6
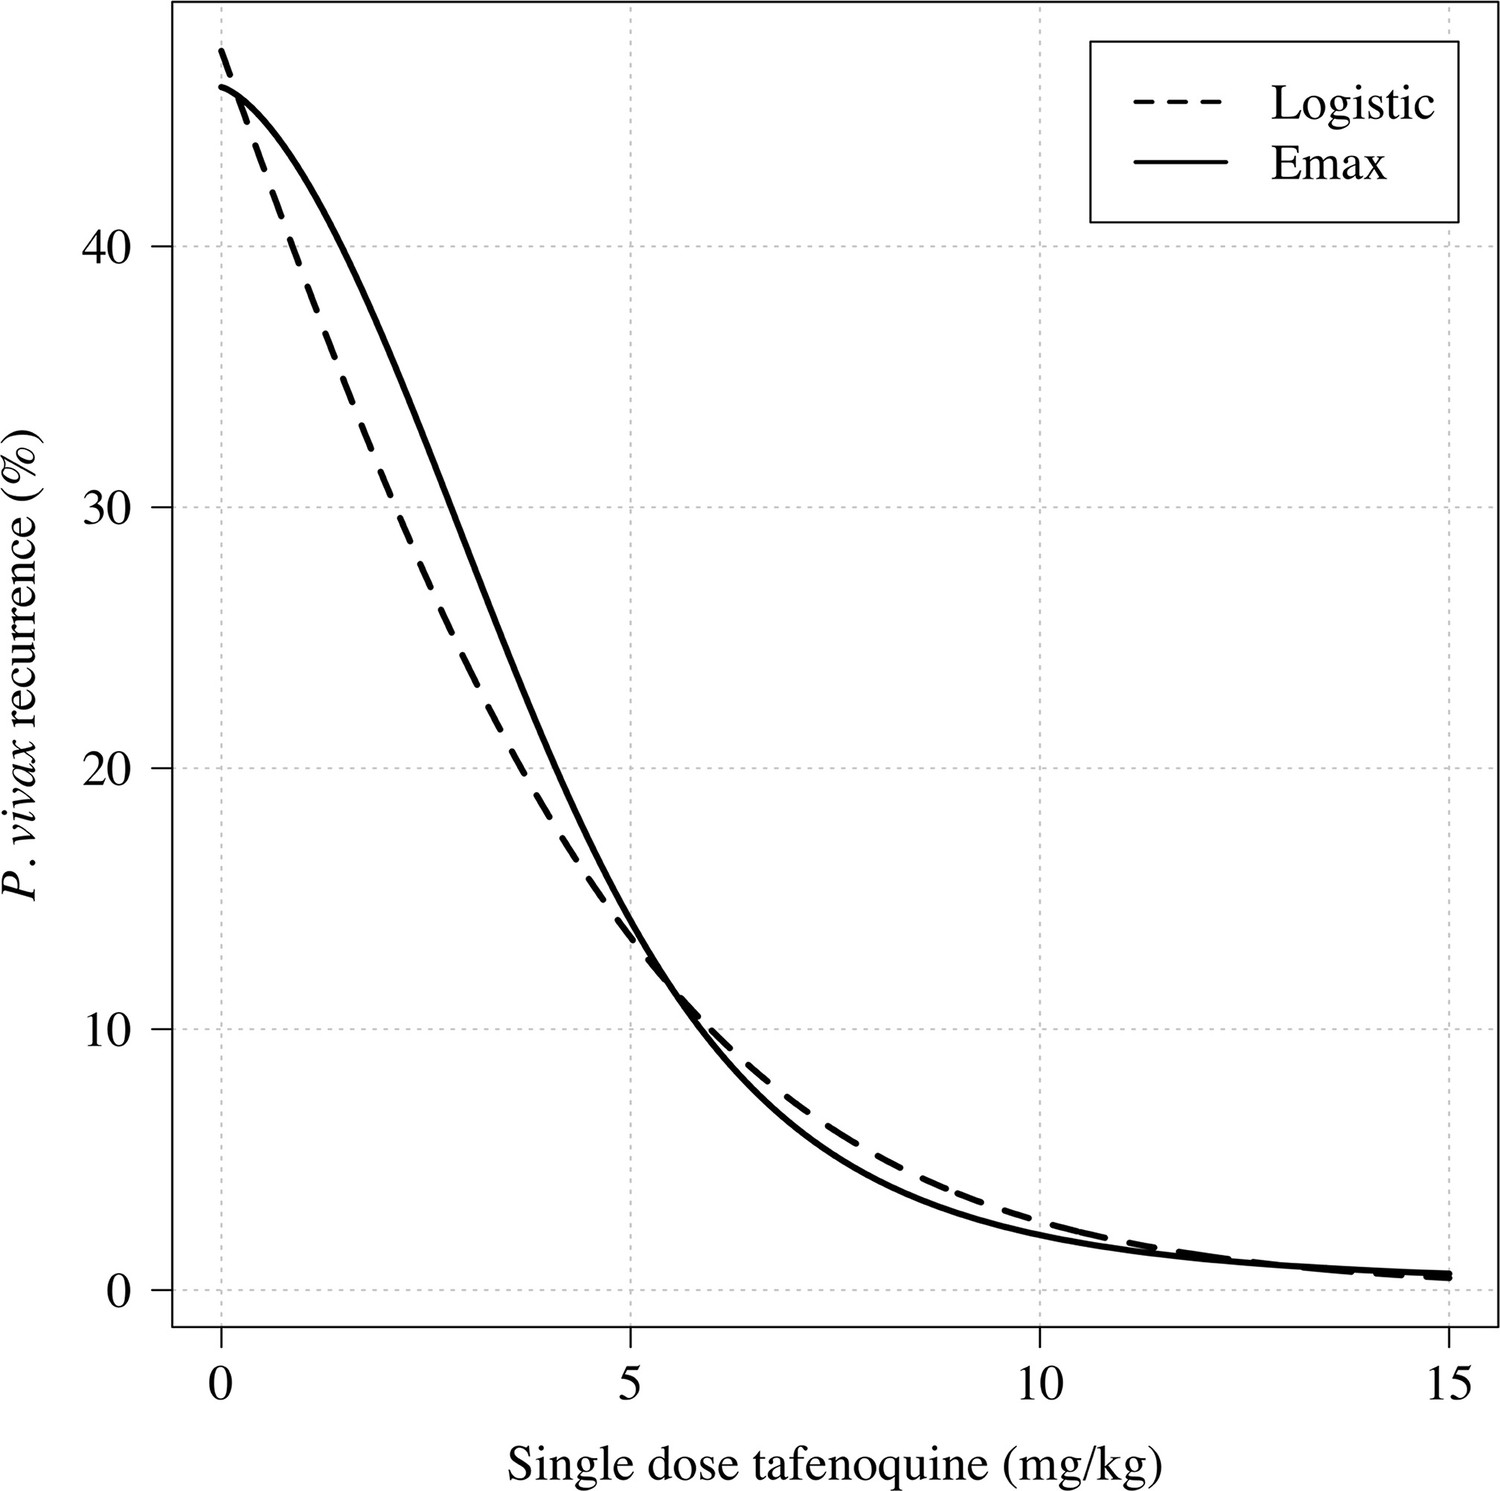
Comparison of logistic regression and Emax model fits for any recurrence within 4 months.
Appendix 1—figure 7
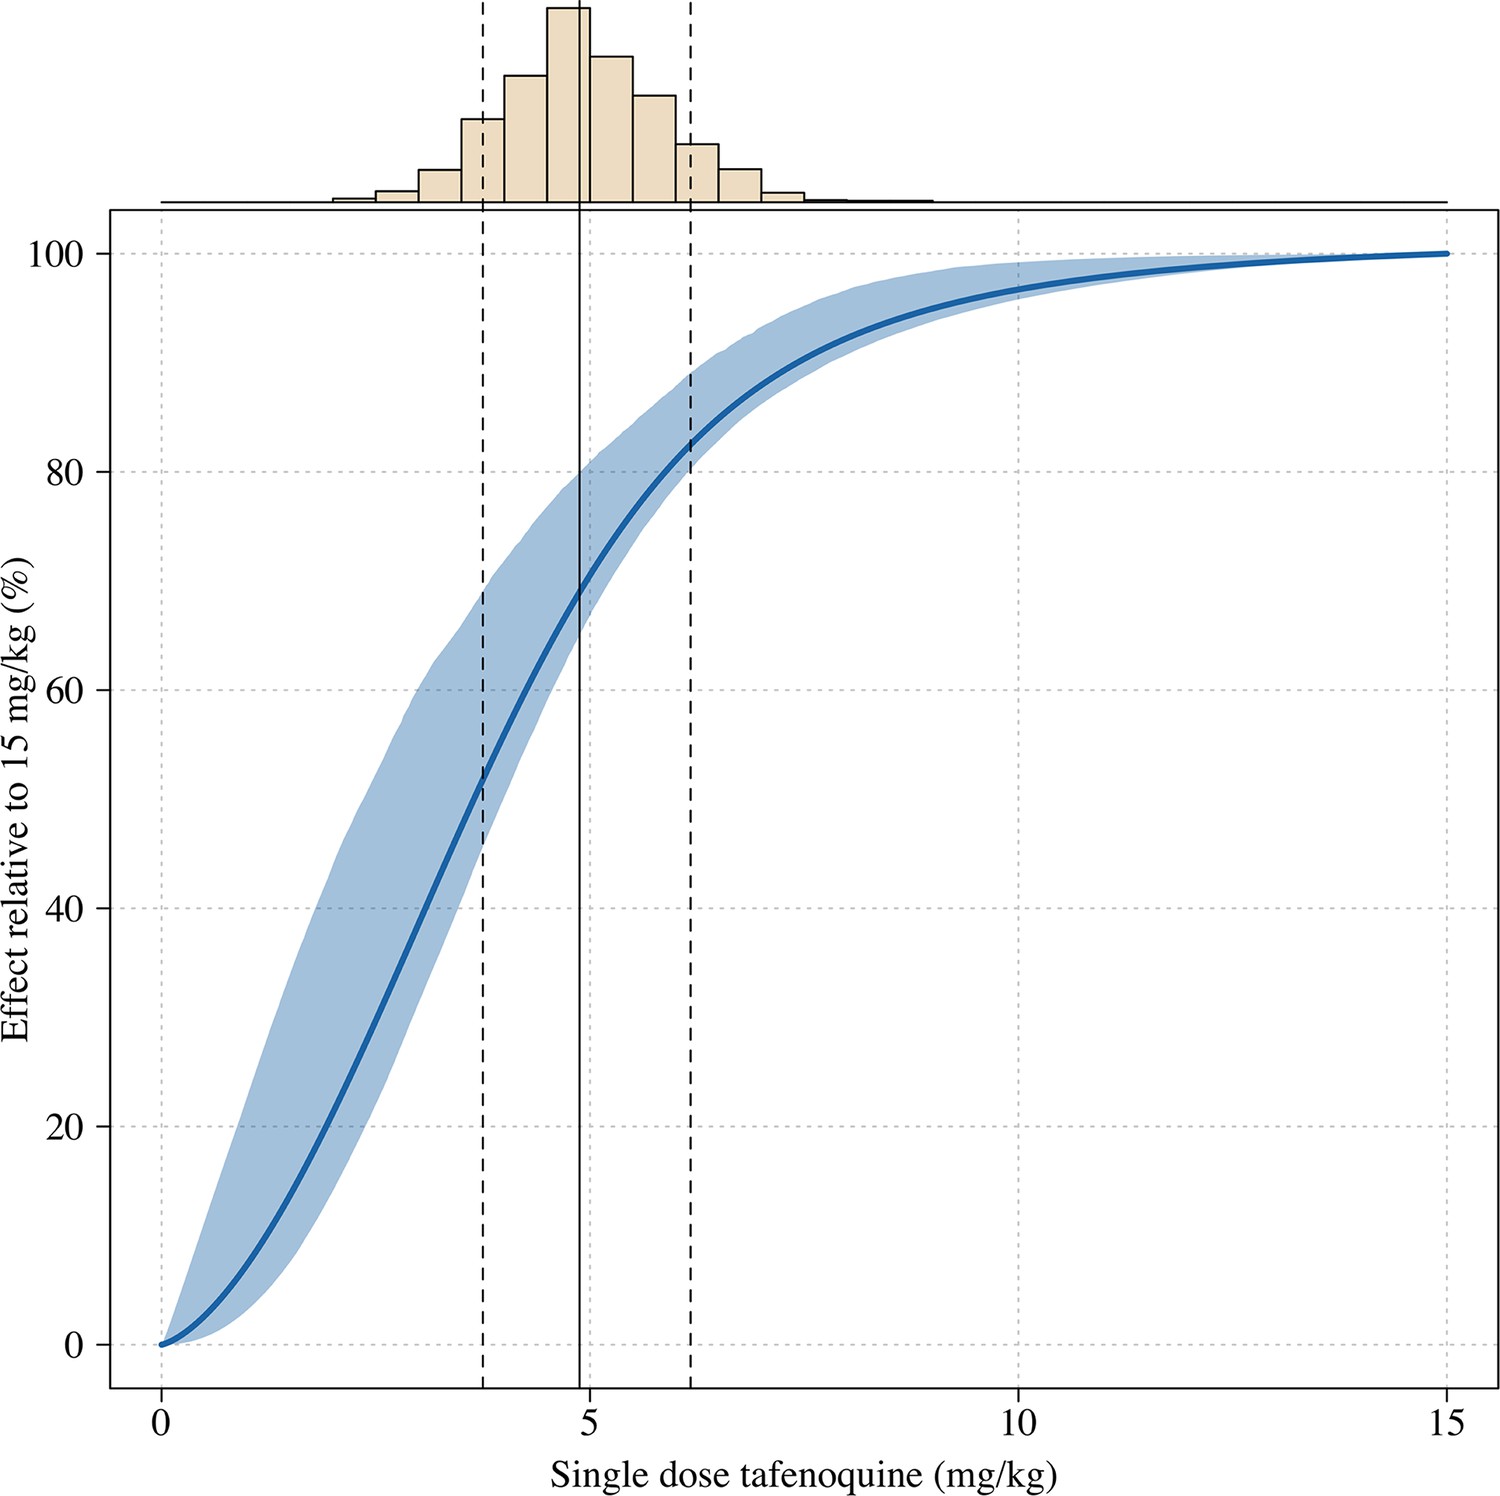
Estimated dose-response curve for tafenoquine mg/kg dose, whereby the maximal effect is defined as the effect for a 15mg/kg dose (the highest tolerated dose).
The histogram above shows the distribution of mg/kg doses expected in patients using the empirical weight distribution from the three efficacy studies. The vertical lines show the 10, 50 and 90th percentiles of the expected mg/kg distribution.
Appendix 1—figure 8
Tafenoquine mg/kg dose and the probability of any recurrence of P.vivax malaria at 6 months under the Emax model.
Thick blue (shaded blue): Emax fit (95% CI) for any recurrence by 6 months; dashed red (shaded pink): estimated probability of any recurrence by 6 months after 3.5mg/kg primaquine (95% CI).
Appendix 1—figure 9
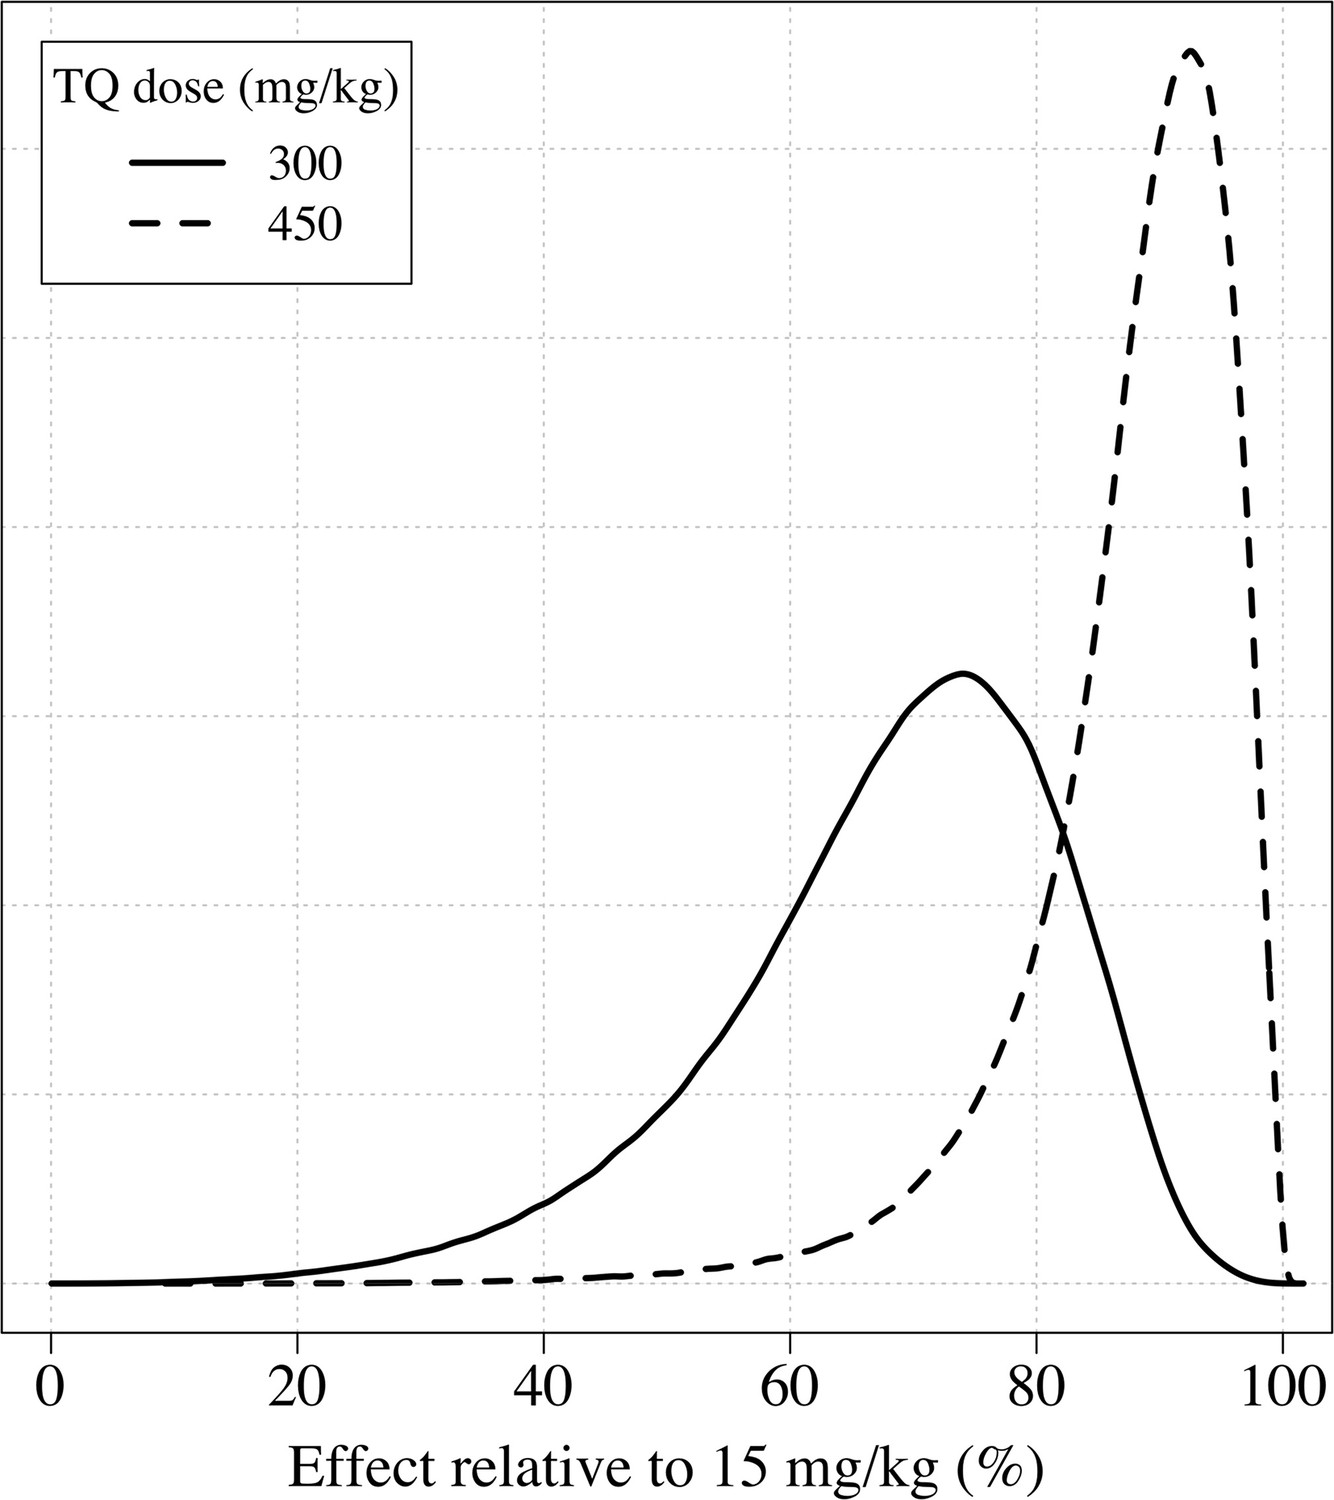
The distributions of the expected weight based efficacy (defined as the % reduction in recurrence at 4 months relative to the maximum dose of 15mg/kg) for a 300 mg single dose (thick line) and a 450mg fixed dose (dashed line).
This is based on the empirical weight distribution from the three efficacy studies.
Appendix 1—figure 10
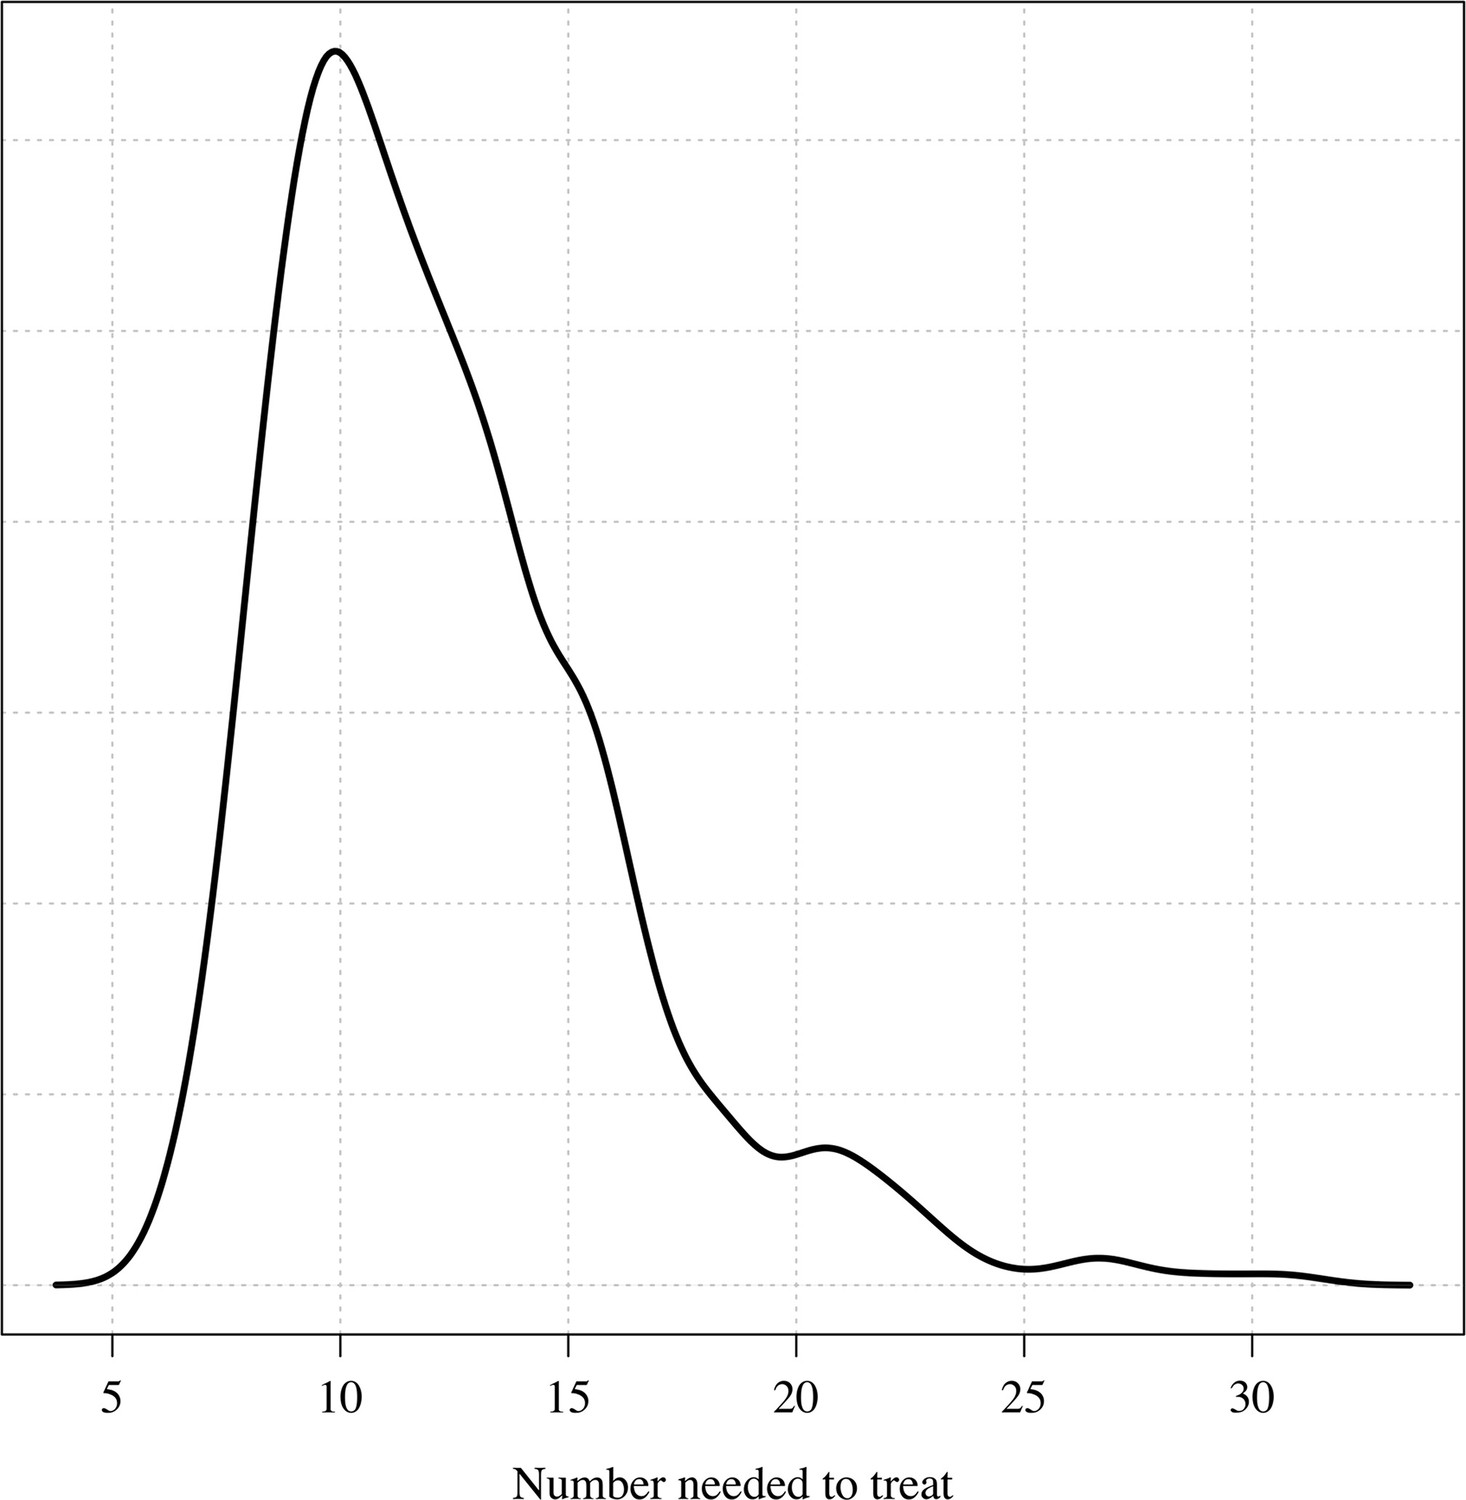
The posterior distribution over the number needed to treat to prevent one recurrence at 4 months under the Bayesian Emax model.
Appendix 1—figure 11
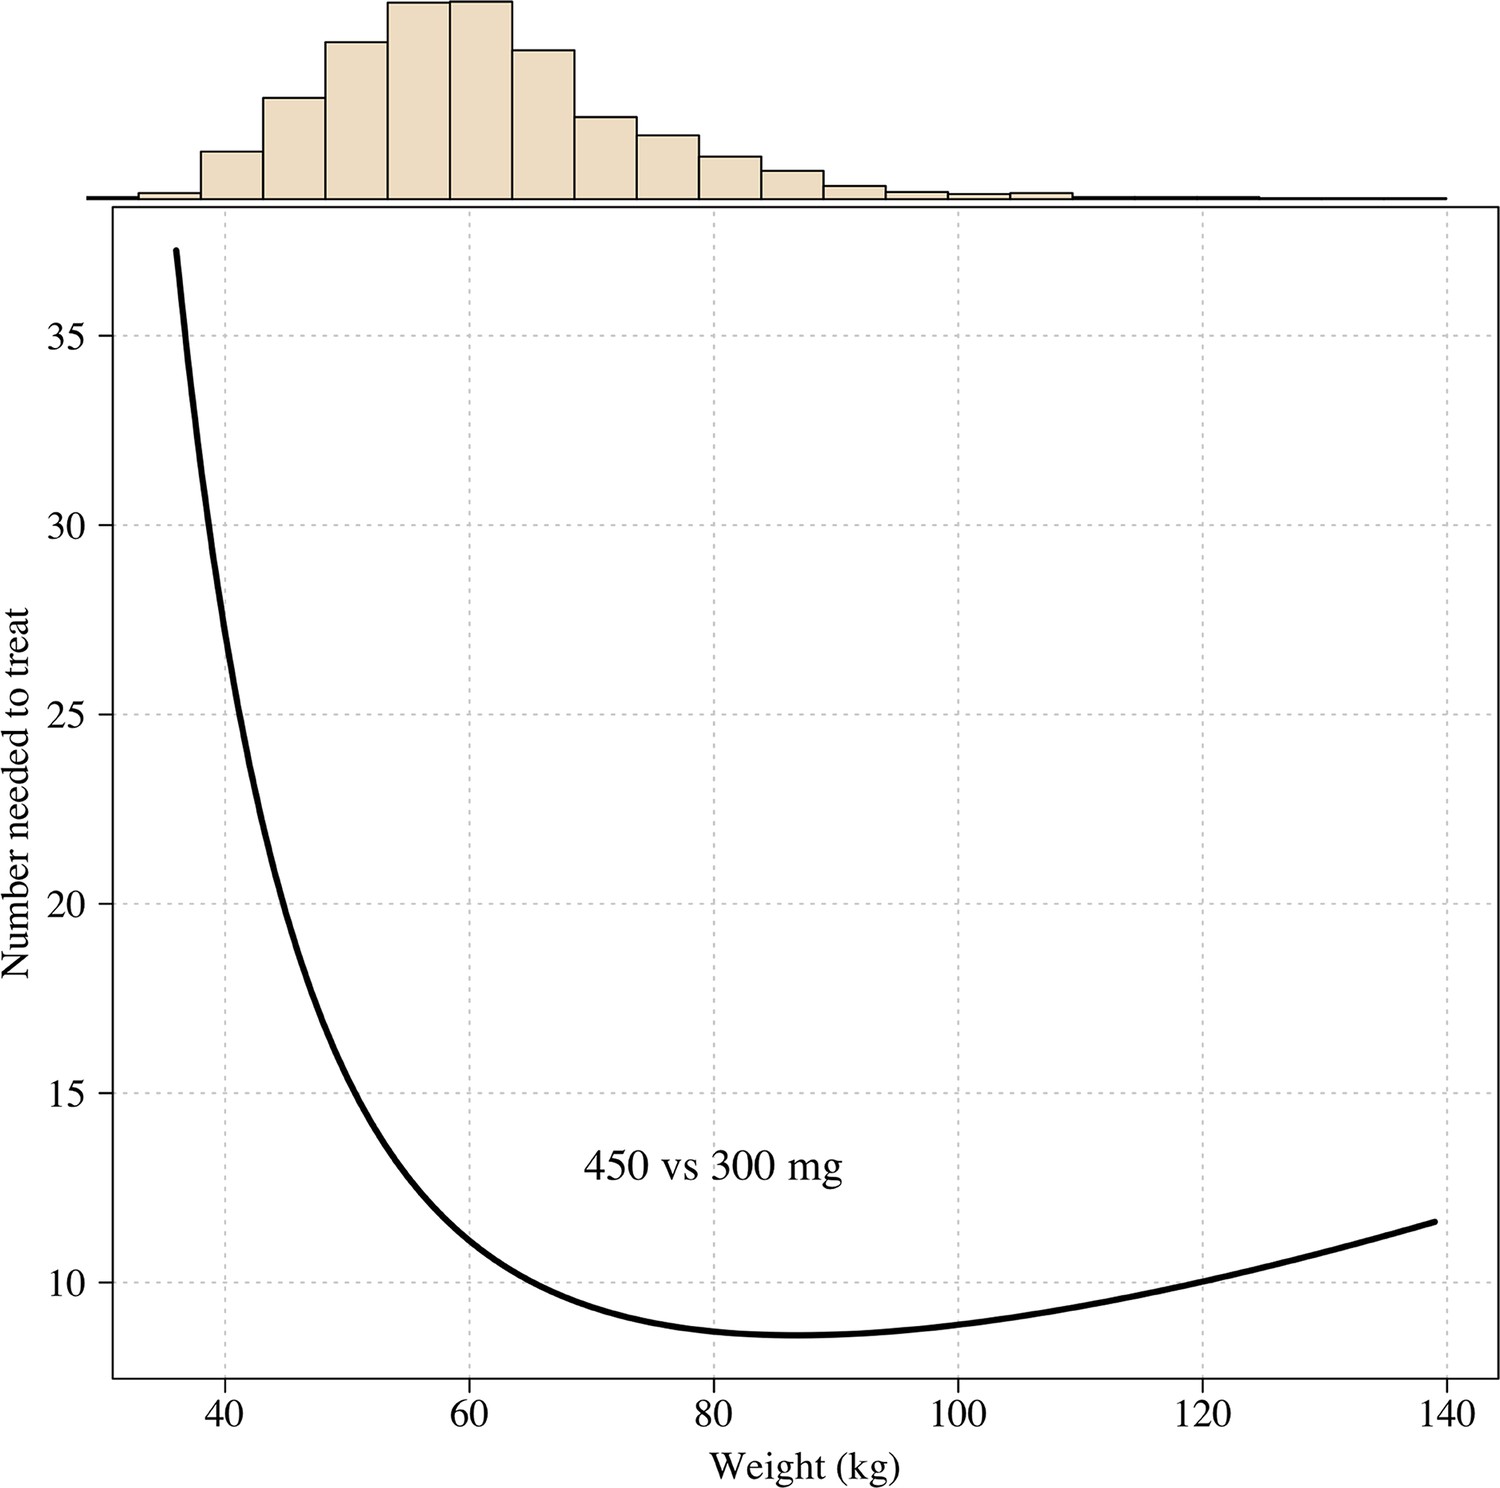
The number needed to treat with 450mg instead of 300mg to prevent one recurrence at 4 months as a function of patient weight under the Emax model.
Appendix 1—figure 12

Relationship between mg/kg dose of tafenoquine and the .
Linear and spline fits are overlaid to show trend. The red dots show the patients who received a 300 mg dose (current recommended treatment), the black circles show the other doses (50, 100 and 600mg).
Appendix 1—figure 13
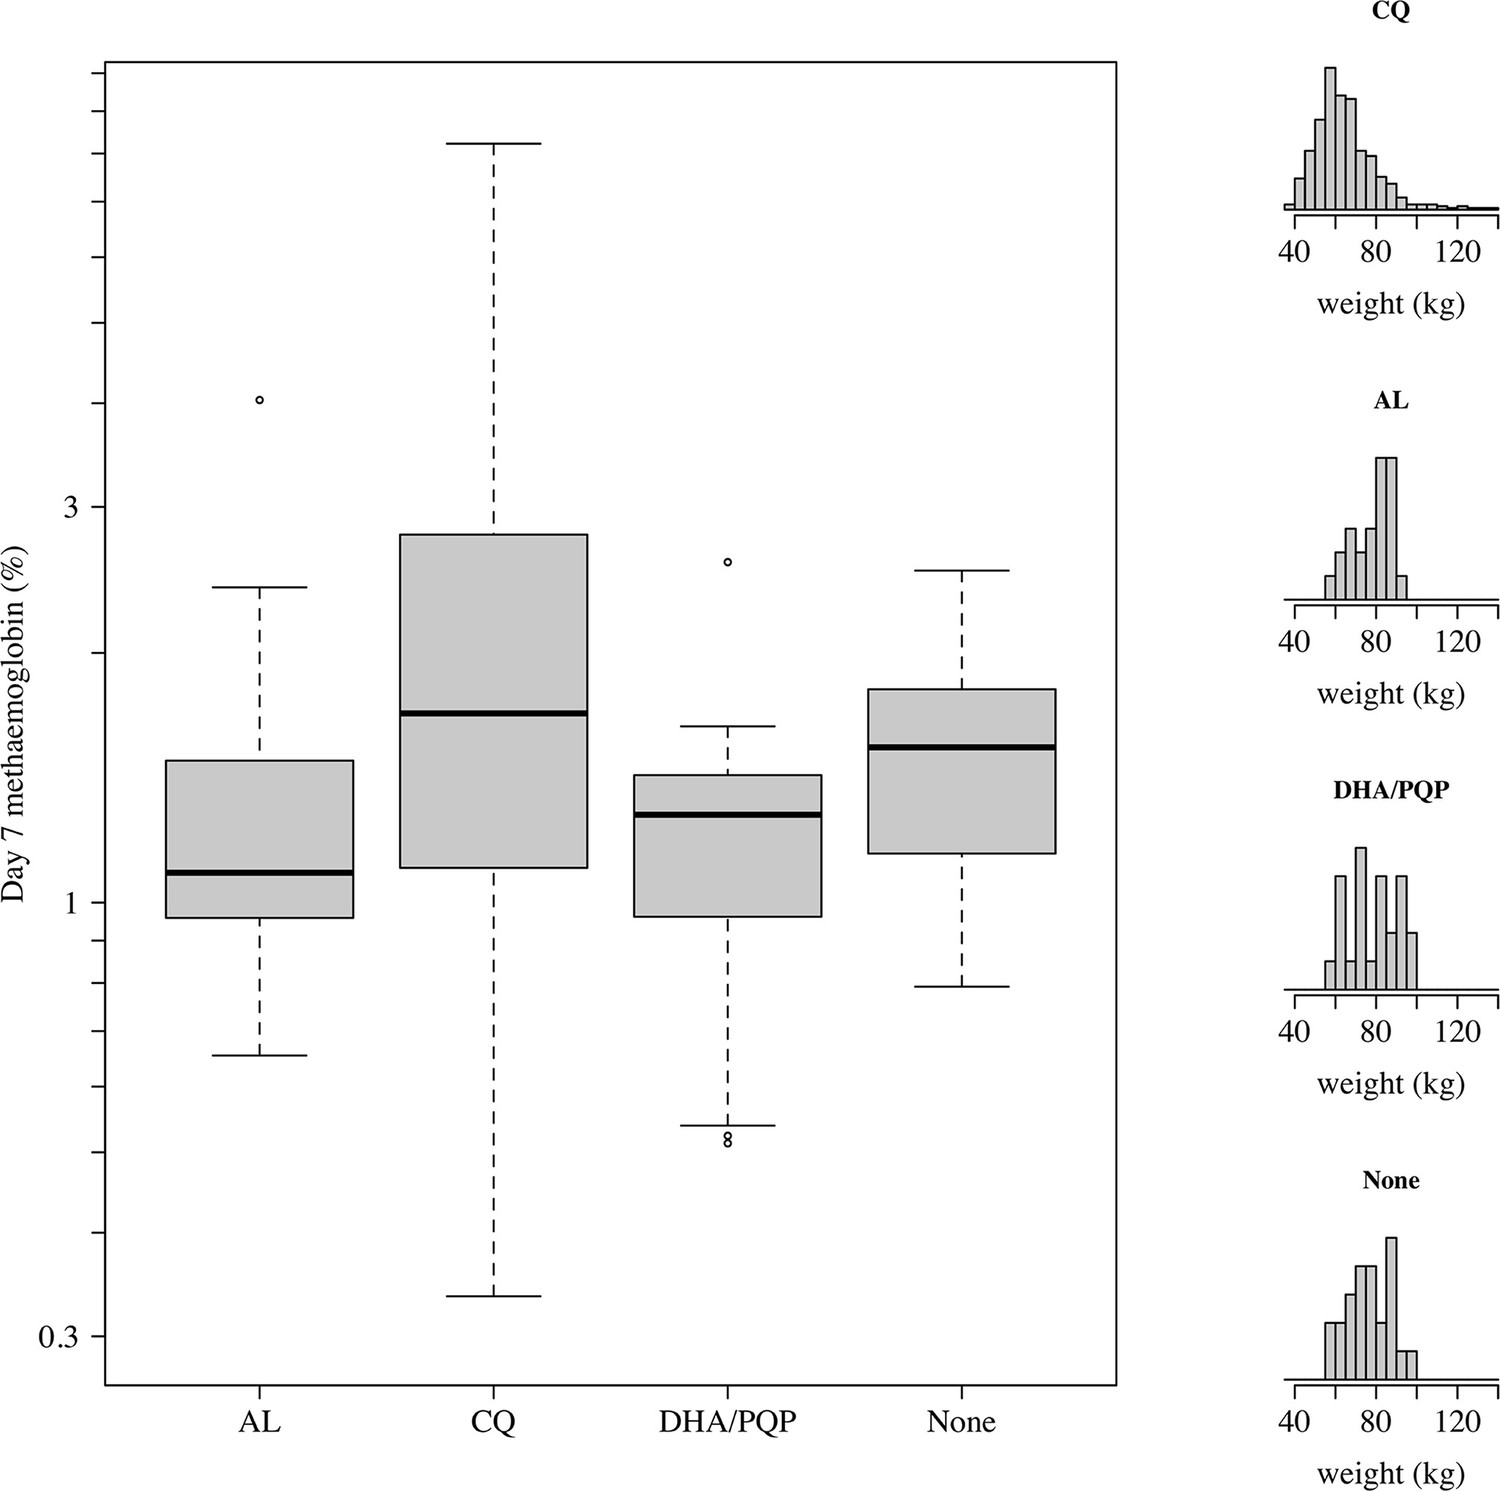
Comparison of day 7 methaemoglobin values after administration of tafenoquine 300 mg in P.vivax patients (all received chloroquine [CQ]) and healthy volunteers who were randomised to either no partner drug, AL, or DHA-PQP.
The distributions of weights are shown in the right panels as the mg/kg dose is the primary driver of day 7 methaemoglobin. The mean weight in patients was slightly lower than in the healthy volunteers (although with a much larger variation).
Appendix 1—figure 14
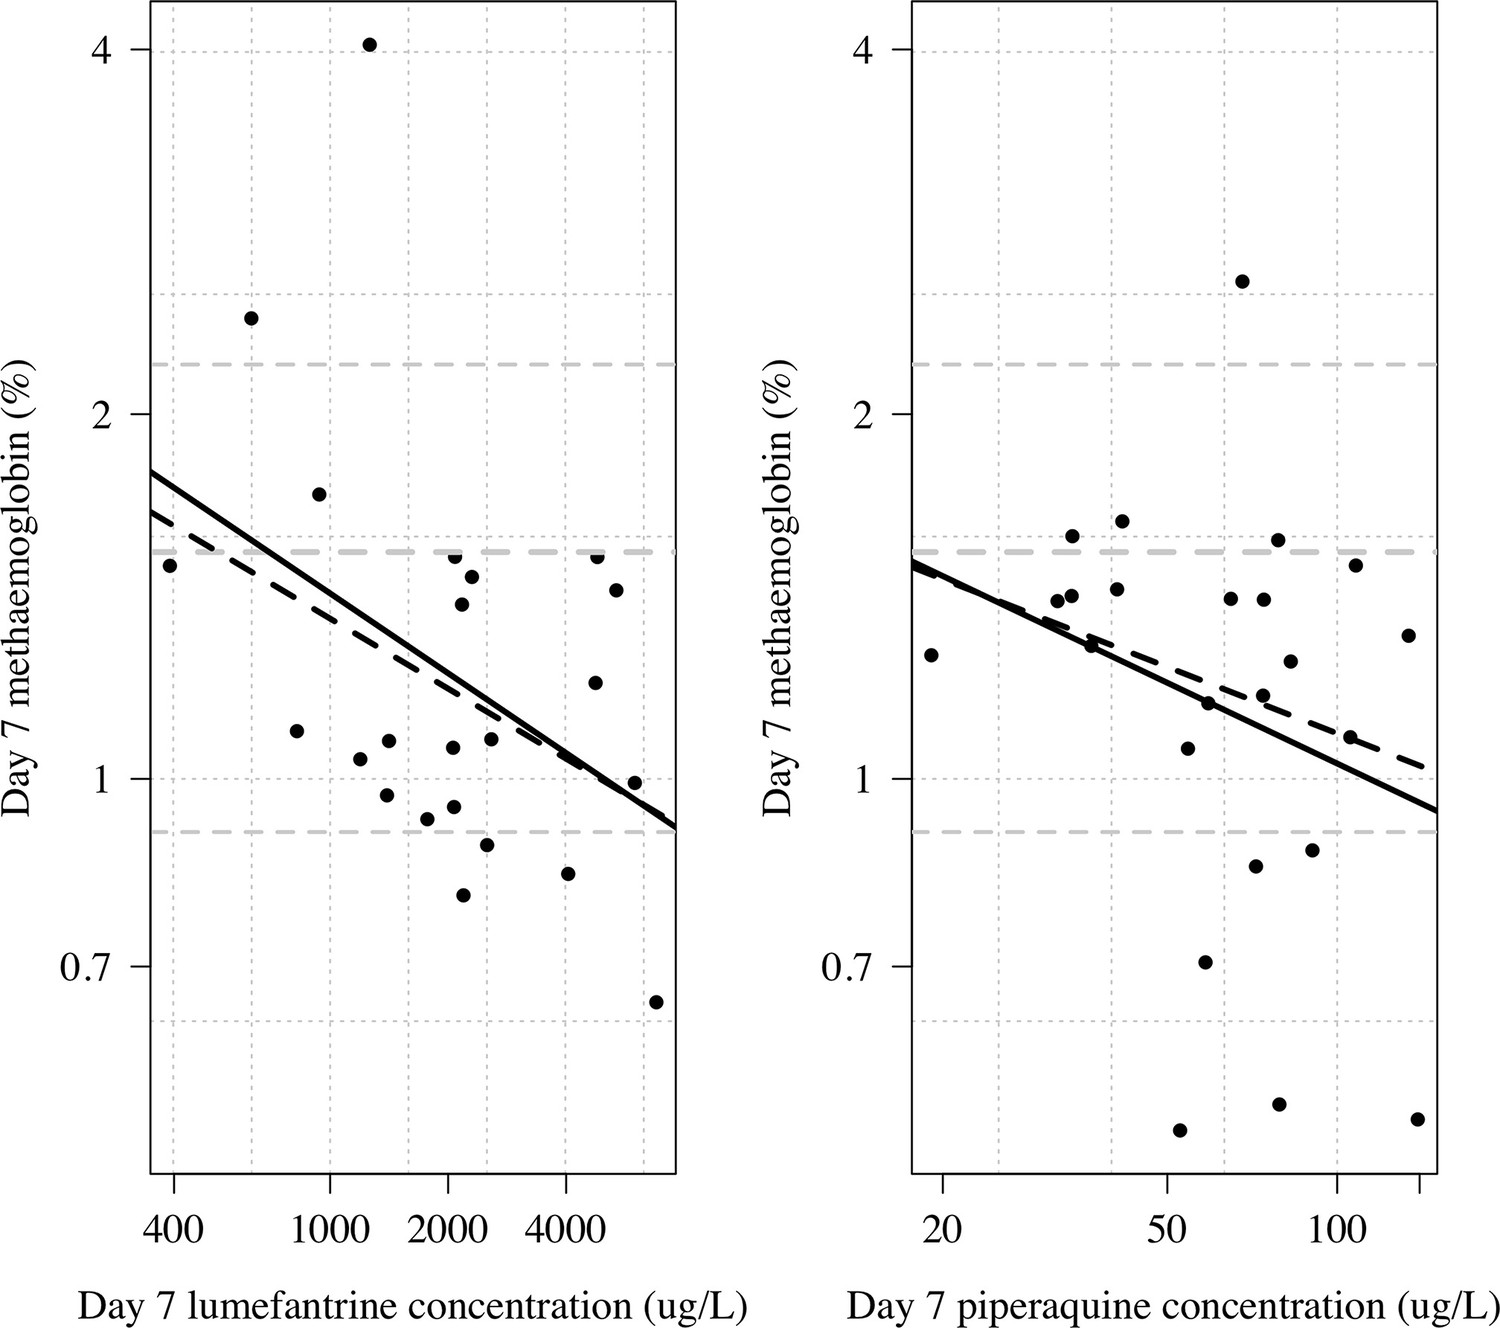
Day 7 methaemoglobin as a function of day 7 lumefantrine (n=23) or day 7 piperaquine concentrations (n=24) in the subjects randomised to tafenoquine +ACT in the phase 1 healthy volunteer trial (Green et al., 2016).
The thick line shows a linear model fit; dashed line shows a robust linear model fit (rlm in MASS package in R). Both x and y axes are shown on the log scale. The grey lines show the median and 10/90th percentiles of the day 7 methaemoglobin levels in the tafenoquine only group (n=24).
Appendix 1—figure 15
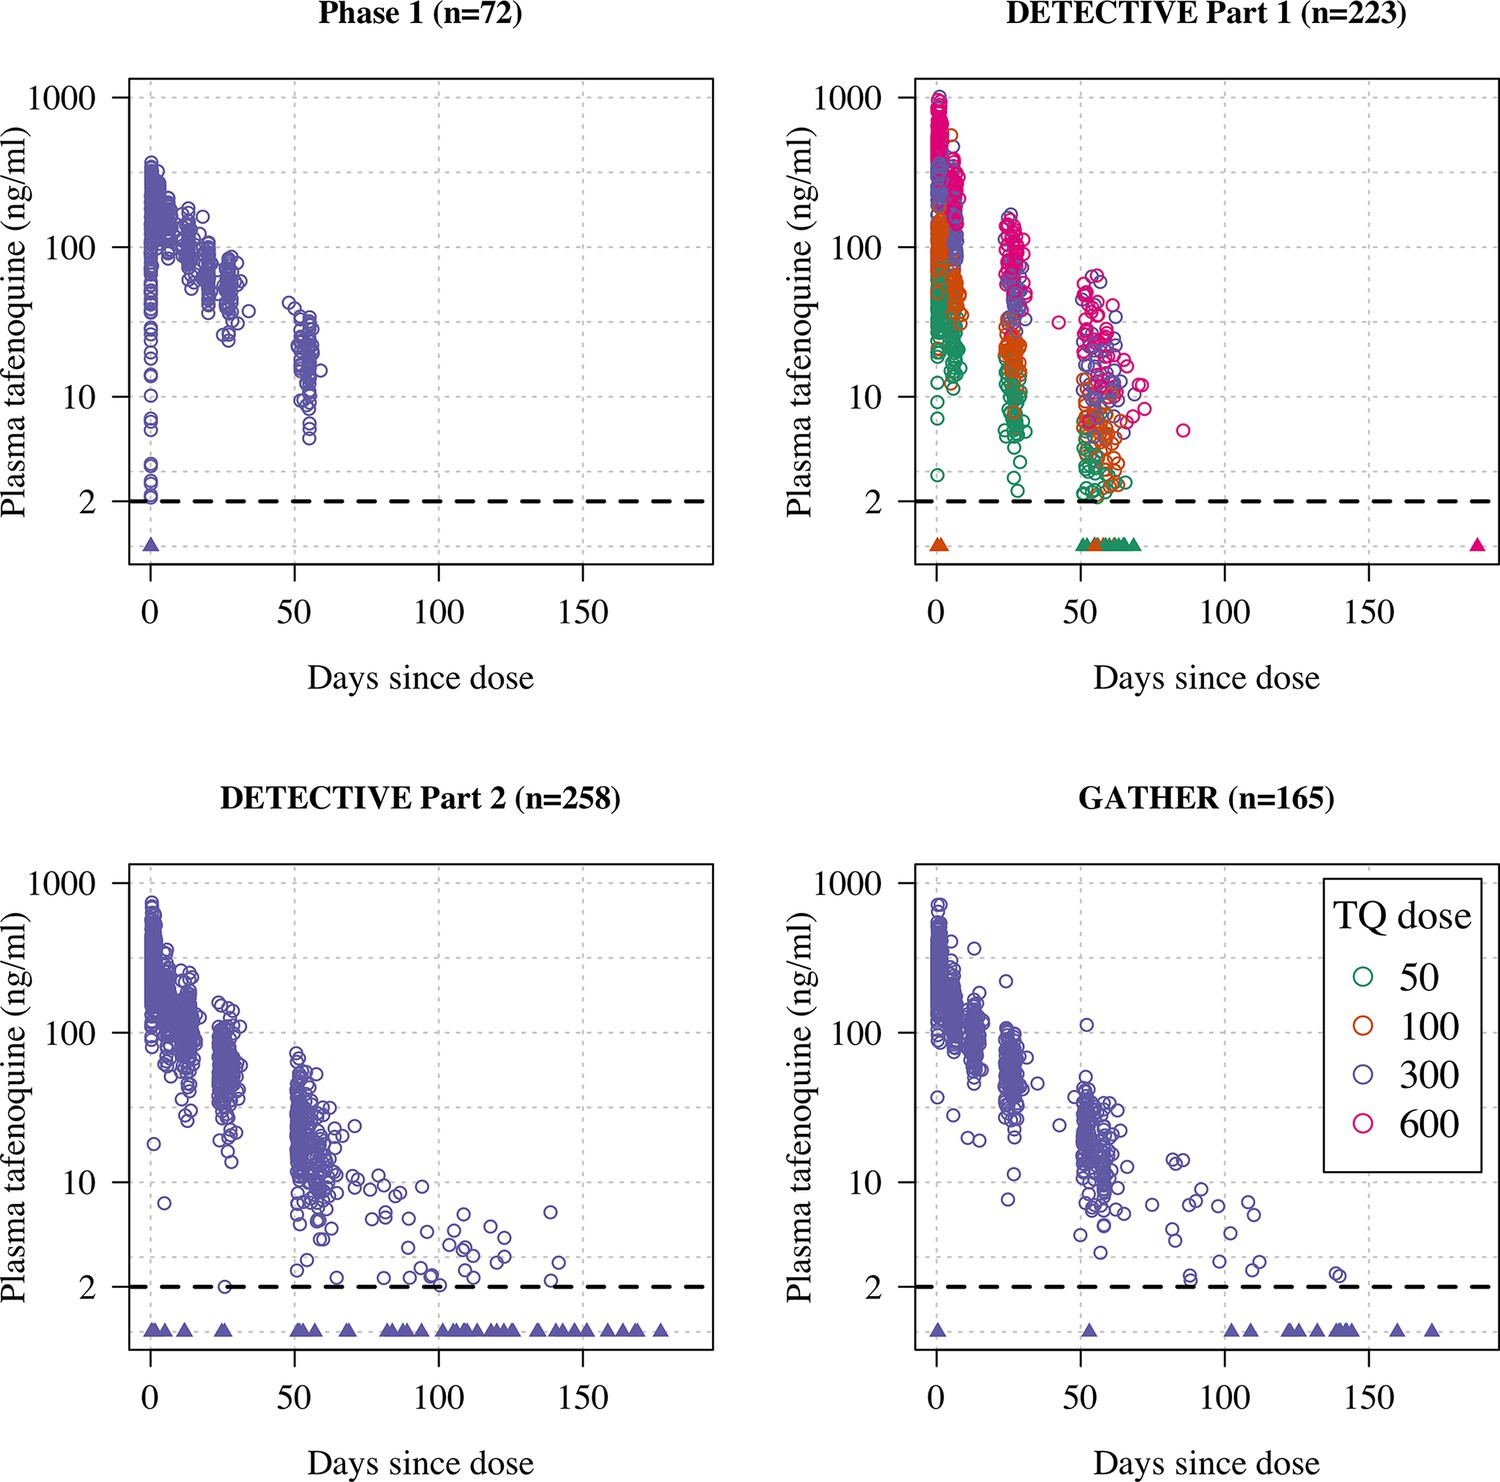
Plasma tafenoquine concentrations over time across the four studies (4499 concentrations in =n718 individuals).
Concentrations below the lower level of quantification (BLQ) are shown by the triangles with a value of 1ng/ml (lower limit of quantification is shown by the dashed line at 2ng/ml). Circles are coloured by dose.
Appendix 1—figure 16
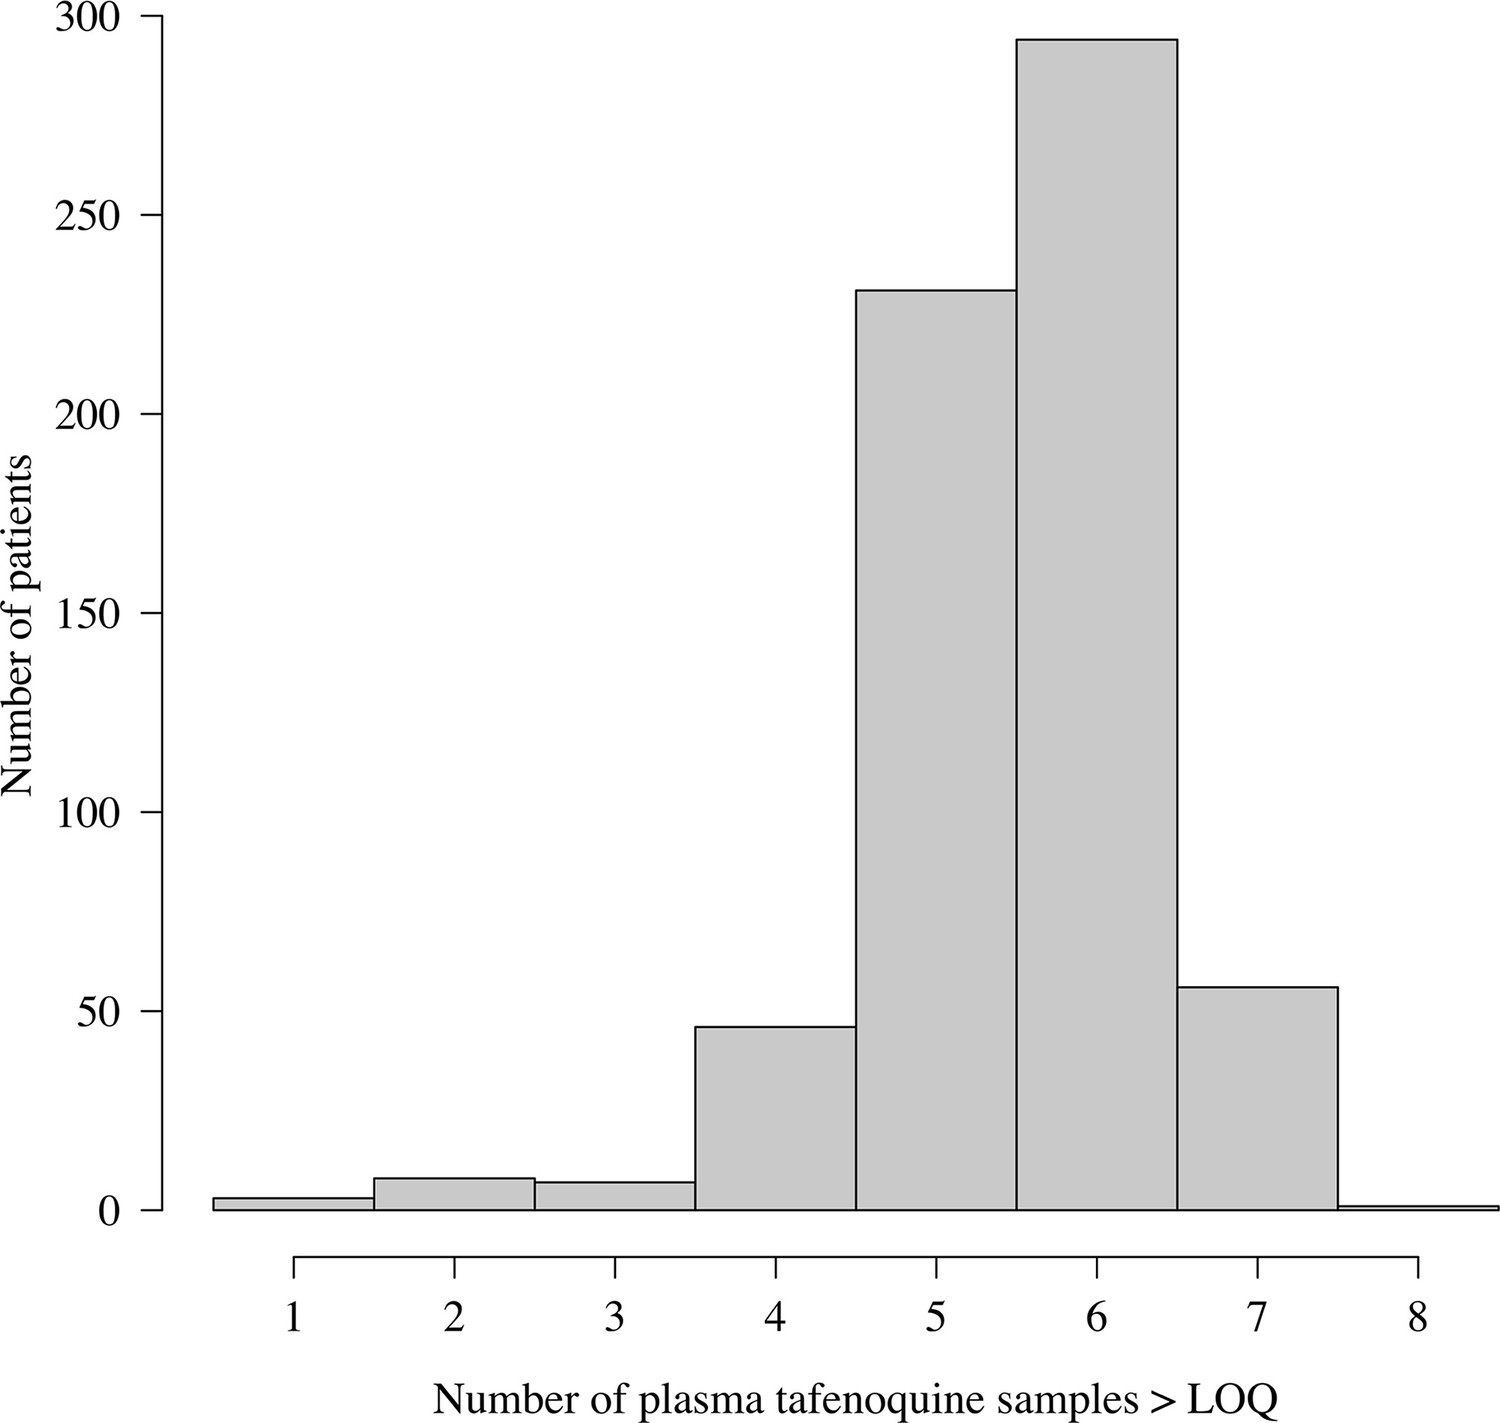
Distribution of the number of plasma tafenoquine concentrations per patient in the three efficacy trials.
The very large majority of patients had 5 or 6 observed concentrations each. For those with few samples (e.g. 1–2), the estimates of the PK summary statistics (, and ) will be shrunk towards the population mean estimates.
Appendix 3—figure 1
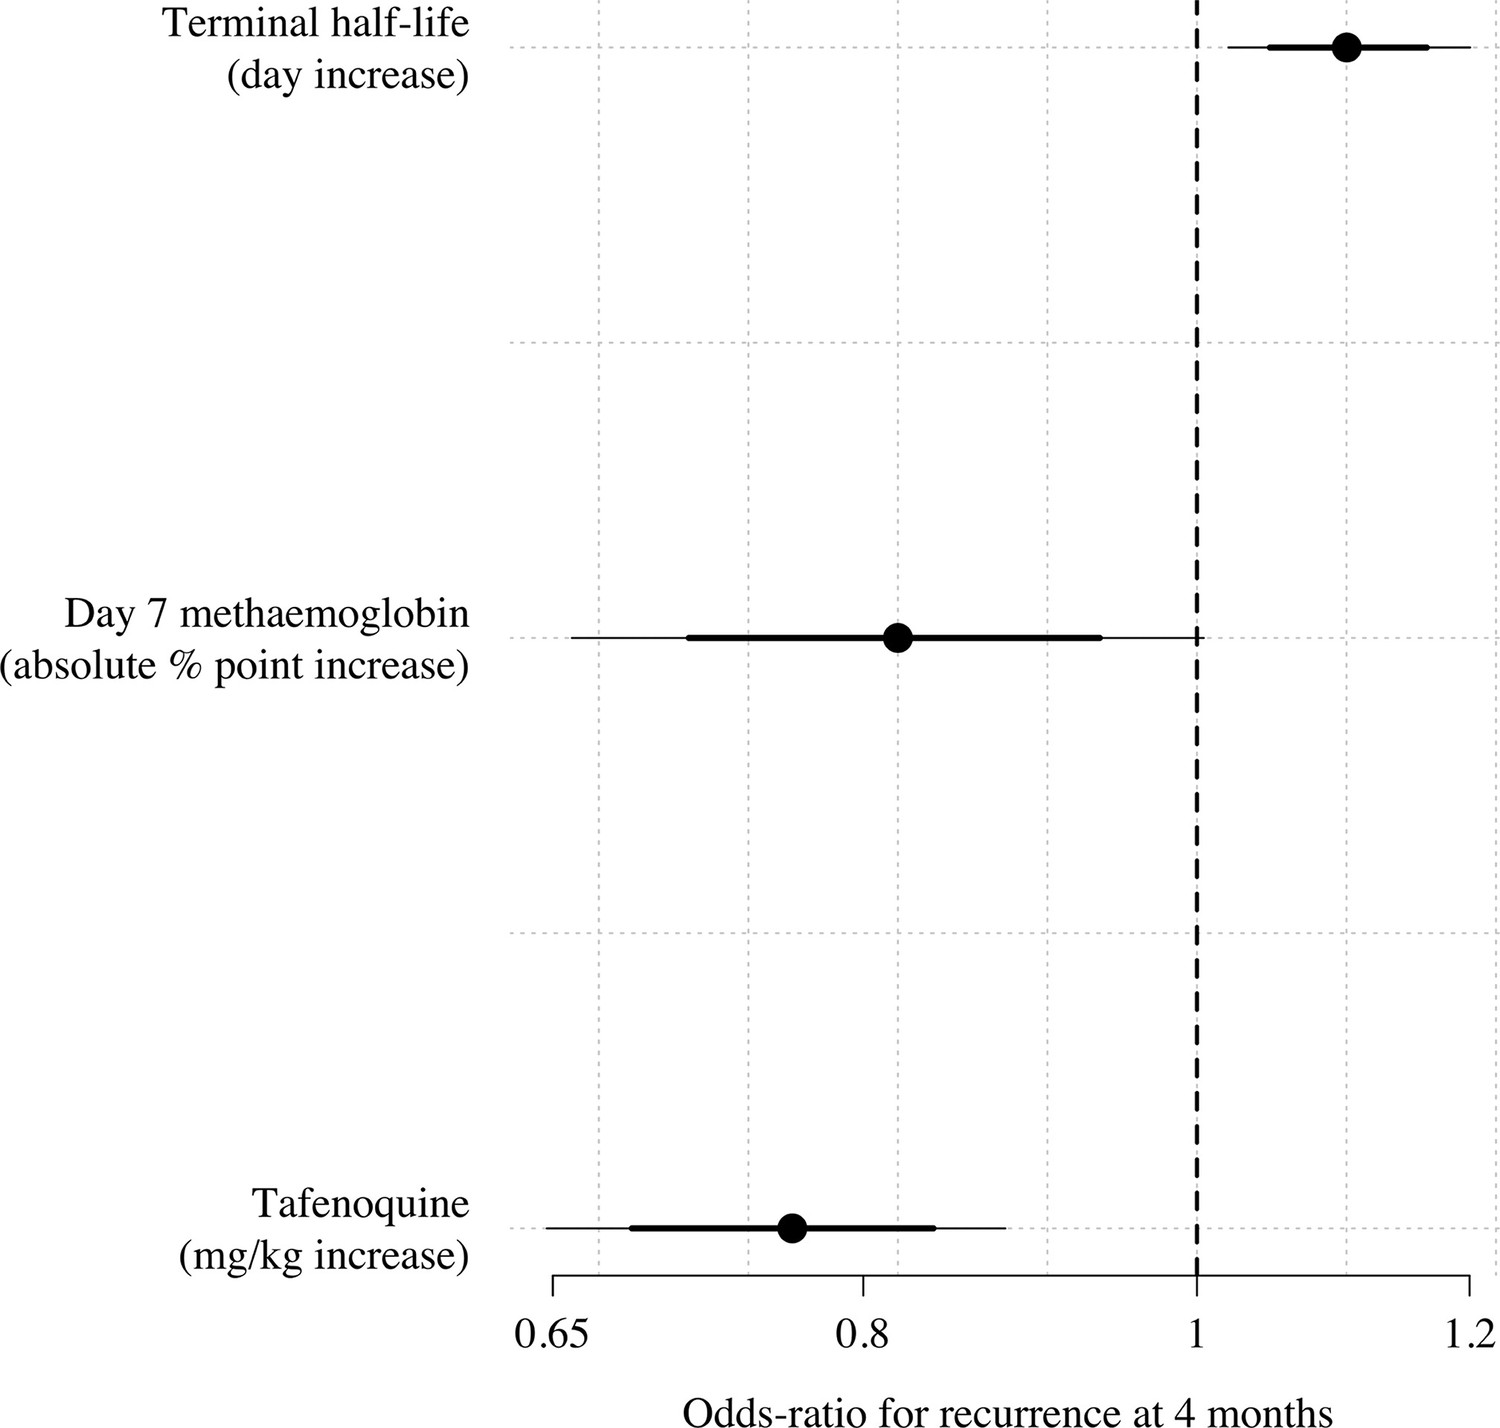
Multivariable model comparison of predictors of recurrence at 4 months in patients who received tafenoquine and who had recorded values (=566).
The circles (thick and thin lines) show the odds-ratios (80% and 95% credible intervals) for recurrence under a Bayesian penalised logistic regression model.
Appendix 6—figure 1
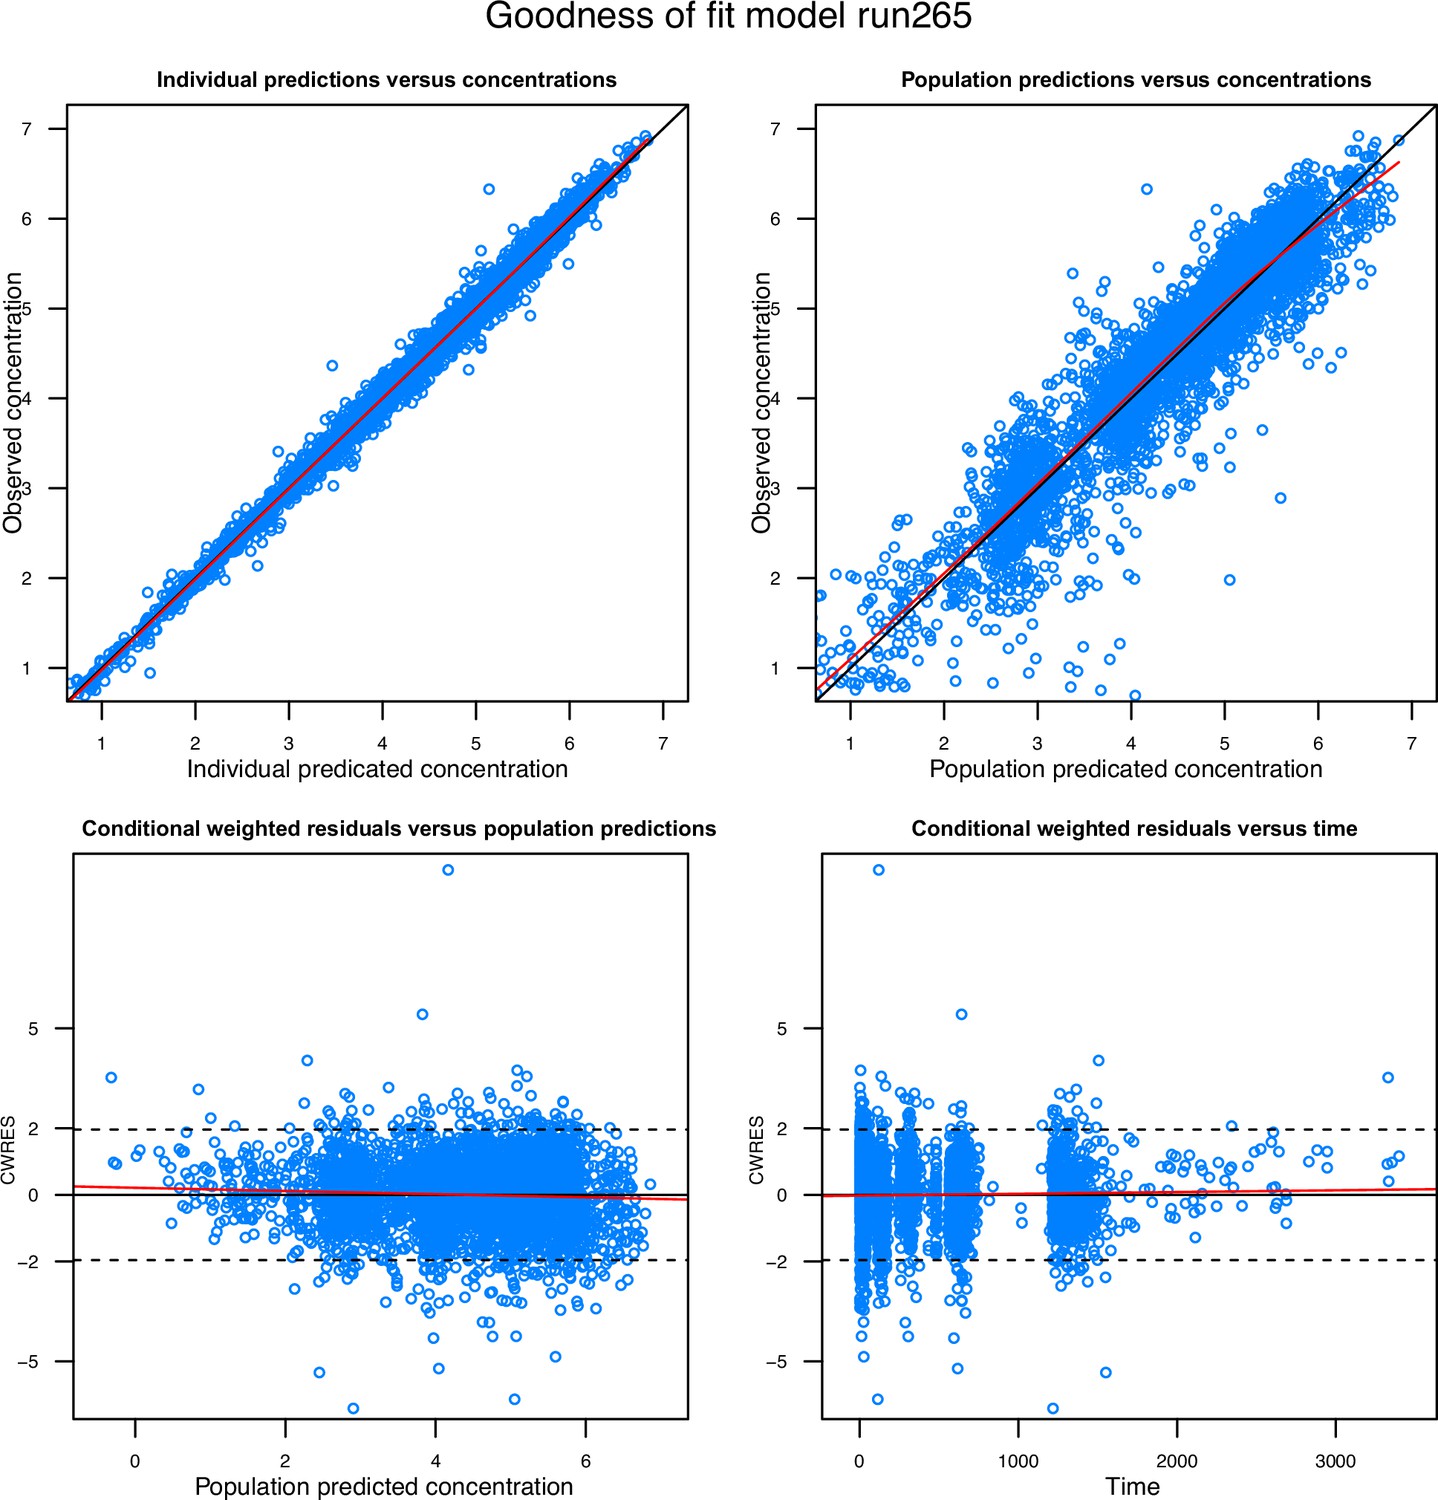
Goodness-of-fit diagnostics of the final population pharmacokinetic model of tafenoquine.
Observations are represented by open blue circles, solid black lines represent the line of identity or zero line, and the local polynomial regression fitting for all observations are represented by the solid red lines.
Appendix 6—figure 2
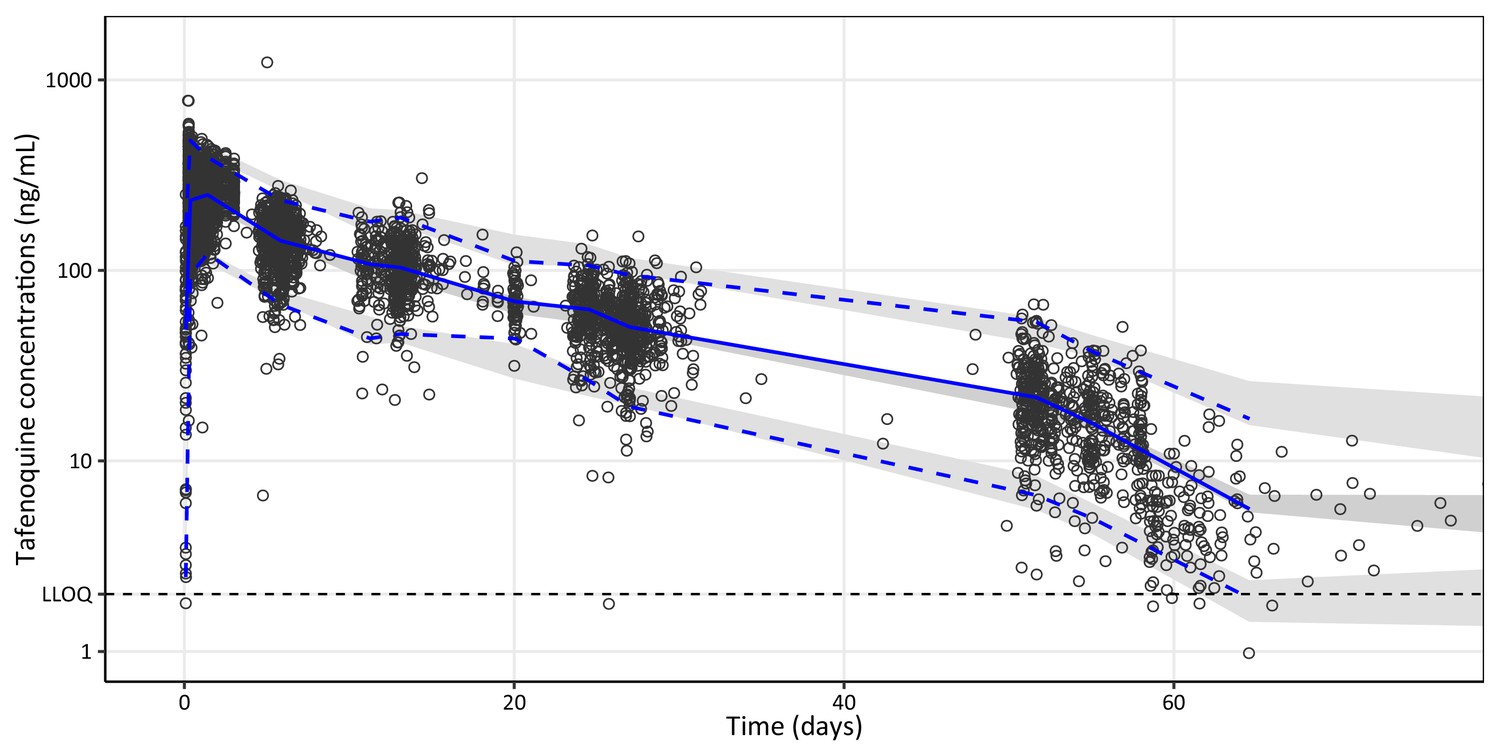
Visual predictive plot of the final population pharmacokinetic model of tafenoquine.
Open black circles represent observed plasma concentrations. Solid and dashed blue lines represent the median, 5th, and 95th percentiles of the observations. The shaded grey areas represent the predictive 95% confidence intervals around the simulated 5th, 50th, and 95th percentiles (n = 2,000 simulations). The broken horizontal line represents the lower limit of quantification (LLOQ) of 2 ng/mL.
Appendix 6—figure 3
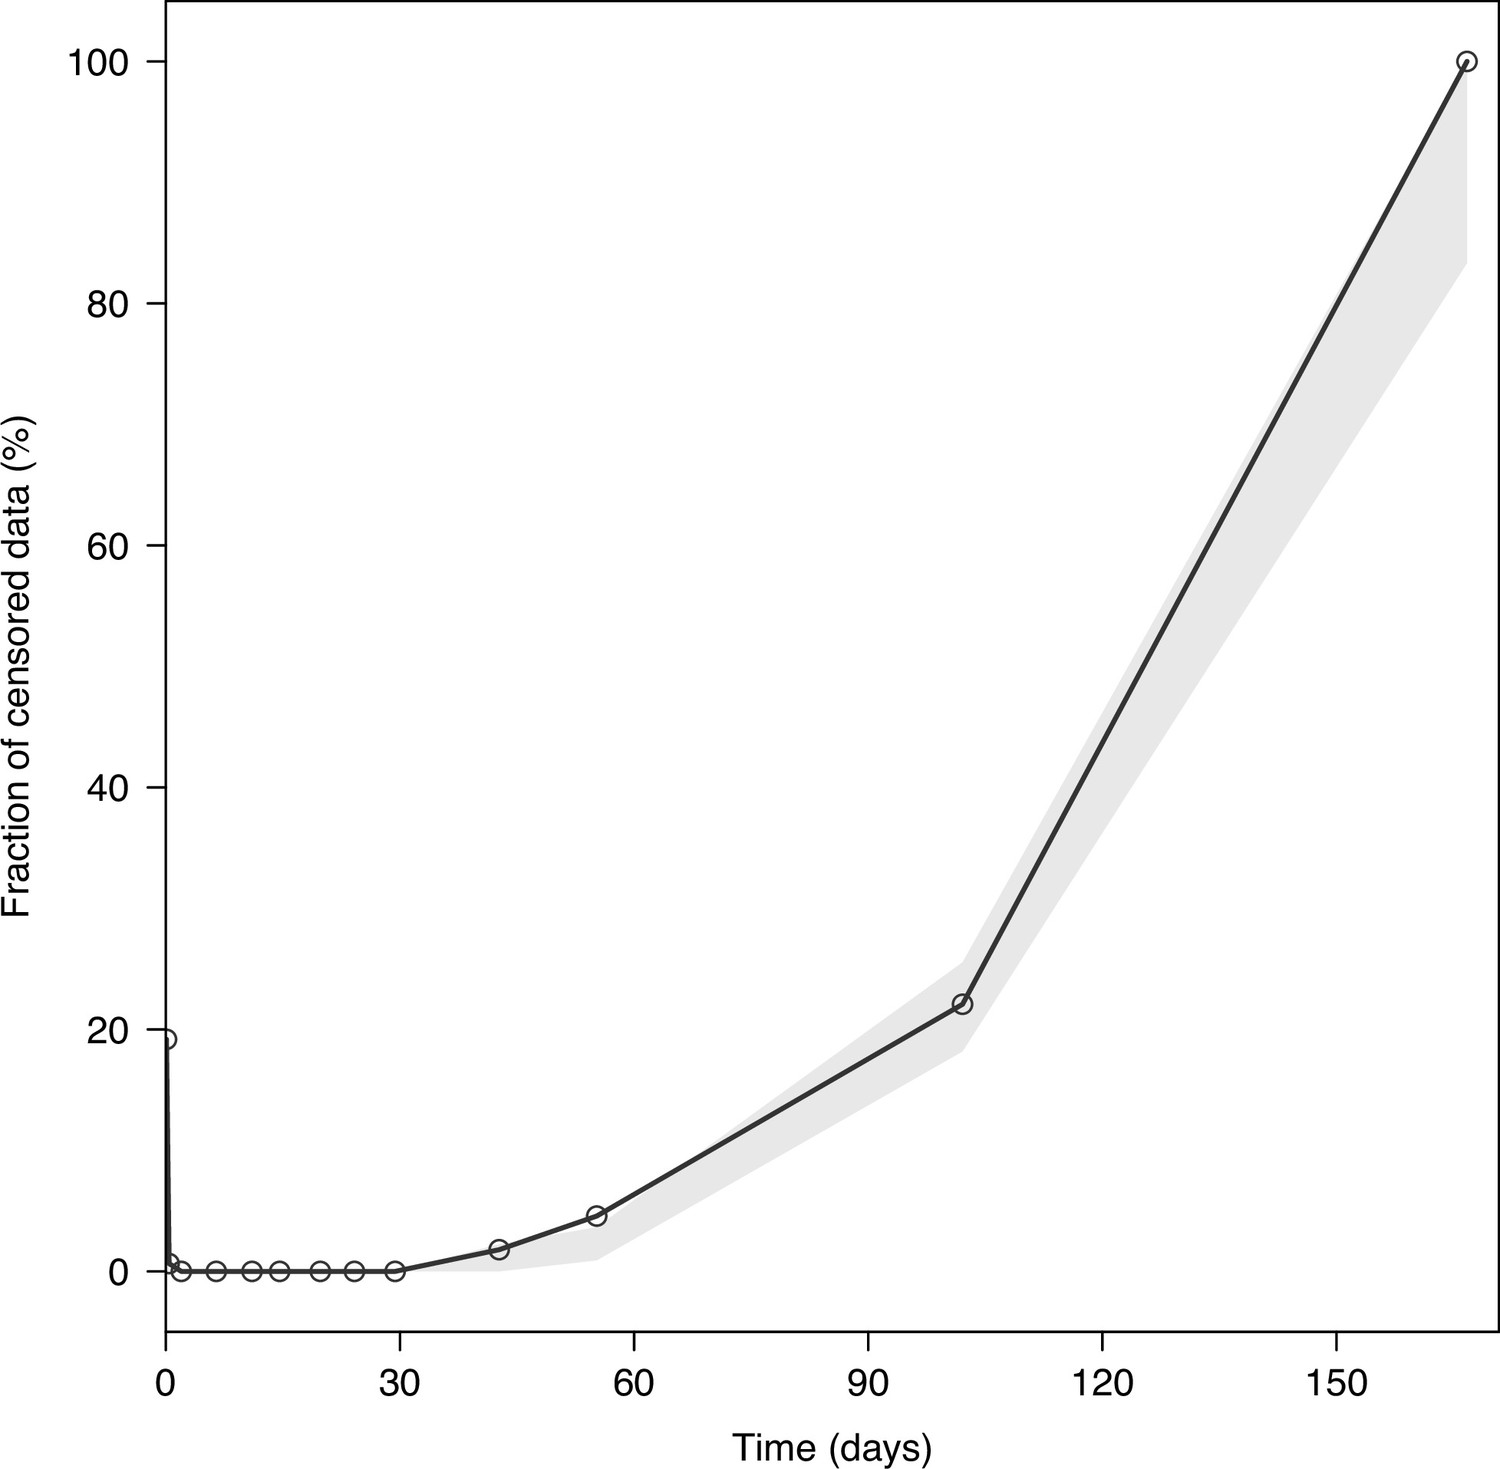
Visual predictive plot of the fraction of censored tafenoquine concentrations.
The solid black line represents the observed fraction of censored data (i.e. data below the lower limit of quantification). The shaded grey area represents the predictive 95% confidence intervals of the simulated fraction of censored data (n = 2,000 simulations).
Tables
Table 1
Demographic, clinical and dosing information on tafenoquine and primaquine dosing groups for all patients included in the efficacy analyses.
(n = 1073, flow diagram shown in Appendix 1—figure 1). Unless otherwise stated, for binary variables we show the total number (%); for continuous variables we show the mean (standard deviation). * Median (interquartile range).
| No TQ | PQ | TQ <3.75 mg/kg | TQ [3.75,6.25) mg/kg | TQ [6.25,8.75) mg/kg | TQ≥8.75 mg/kg | |
|---|---|---|---|---|---|---|
| n=182 | n=257 | n=169 | n=368 | n=54 | n=43 | |
| Recurrence at 4 months | 101 (55.5) | 57 (22.2) | 57 (33.7) | 79 (21.5) | 4 (7.4) | 0 (0) |
| Age (years) | 35 (14.1) | 36 (14.4) | 37 (13.4) | 36 (14.2) | 36 (17.2) | 33 (14.4) |
| Female | 50 (27) | 77 (30) | 43 (25) | 95 (26) | 24 (44) | 9 (21) |
| Weight (kg) | 62 (12.0) | 63 (12.1) | 72 (20.1) | 63 (8.7) | 51 (13.3) | 57 (7.3) |
| Baseline parasitaemia (/μL)* | 5470 (2173–11856) | 4697 (1712–10430) | 4320 (1447–9456) | 4174 (1431–10101) | 5507 (1961–12111) | 6143 (1692–13313) |
| Haemoglobin day 0 (g/dL) | 12.9 (1.5) | 13.0 (1.6) | 12.9 (1.8) | 13.2 (1.6) | 12.3 (1.8) | 12.6 (1.8) |
| Country | ||||||
| Brazil | 55 (30) | 80 (31) | 61 (36) | 105 (29) | 6 (11) | 3 (7) |
| Cambodia | 10 (5) | 8 (3) | 0 (0) | 16 (4) | 2 (4) | 0 (0) |
| Colombia | 0 (0) | 5 (2) | 0 (0) | 11 (3) | 0 (0) | 0 (0) |
| Ethiopia | 14 (8) | 13 (5) | 0 (0) | 18 (5) | 7 (13) | 0 (0) |
| India | 9 (5) | 5 (2) | 21 (12) | 8 (2) | 4 (7) | 7 (16) |
| Peru | 62 (34) | 91 (35) | 56 (33) | 136 (37) | 21 (39) | 18 (42) |
| Philippines | 1 (1) | 2 (1) | 0 (0) | 3 (1) | 0 (0) | 0 (0) |
| Thailand | 31 (17) | 38 (15) | 31 (18) | 46 (12) | 10 (19) | 15 (35) |
| Vietnam | 0 (0) | 15 (6) | 0 (0) | 25 (7) | 4 (7) | 0 (0) |
Appendix 4—table 1
Haematology safety outcomes by treatment arm.
n (%); mean (sd).
| Outcome | No TQ | <3.75mg/kg | 3.75-<6.25mg/kg | 6.25-<8.75mg/kg | > 8.75mg/kg |
|---|---|---|---|---|---|
| n=186 | n=171 | n=378 | n=56 | n=44 | |
| Hb fall >25% to<7 g/dL | 0 (0%) | 0 (0%) | 0 (0%) | 0 (0%) | 0 (0%) |
| Absolute Hb fall >5 g/dL | 0 (0%) | 0 (0%) | 1 (0.3%) | 0 (0%) | 0 (0%) |
| Hb fall to <5 g/dL | 0 (0%) | 0 (0%) | 0 (0%) | 0 (0%) | 0 (0%) |
| Hb change to day 2/3 | –0.4 (0.9) | –0.6 (0.9) | –0.7 (0.9) | –0.8 (0.8) | –0.6 (1.1) |
| Hb change to day 7±1 | –0.3 (0.9) | –0.3 (0.9) | –0.4 (1.1) | –0.4 (1.0) | –0.3 (1.3) |
Appendix 6—table 1
Final population pharmacokinetic parameter estimates of Tafenoquine.
| Pharmacokineticparameters | Population estimates *(%RSE †) | SIR median †(95% CI †) |
|---|---|---|
| Fixed effects | ||
| F (%) | 1 fixed | |
| MTT (h) | 3.14 (12.8) | 3.05 (2.30–3.87) |
| CL/F (L/h) | 3.14 (8.43) | 3.14 (2.71–3.70) |
| Vc/F (L) | 1330 (12.9) | 1360 (1040–1710) |
| Q/F (L/h) | 5.82 (18.3) | 5.72 (3.99–8.05) |
| Vp/F (L) | 311 (14.4) | 318 (248–424) |
| Covariate relationships | ||
| Age – CL/F | –0.00434 (23.4) | –0.00435 (-0.00206–-0.00589) |
| Vomit – F | 0.447 (16.3) | 0.434 (0.315–0.608) |
| Patient – MTT | 0.937 (24.7) | 0.929 (0.605–1.51) |
| Patient – Vc/F | –0.276 (29.4) | –0.282 (-0.0784–-0.395) |
| Patient – Vp/F | 1.40 (21.6) | 1.30 (0.670–1.88) |
| Random effects | ||
| IIV F | 0.0850 (19.2) | 0.0870 (0.0559–0.120) |
| IIV MTT | 0.0831 (21.0) | 0.0887 (0.0585–0.124) |
| IIV CL/F | 0.0338 (18.8) | 0.0349 (0.0193–0.0451) |
| IIV Q/F | 0.151 (20.5) | 0.156 (0.1000–0.226) |
| IIV Vp/F | 0.0256 (25.3) | 0.0265 (0.0153–0.0400) |
| RUV | 0.0225 (18.8) | 0.0240 (0.0170–0.0333) |
-
Abbreviations: SIR, sampling importance resampling; RSE, relative standard deviation; F, relative bioavailability; MTT, mean absorption transit time over 6 transit compartments; CL/F, oral elimination clearance; Vc/F, apparent central volume of distribution; Q/F, inter-compartment clearance; Vp/F, apparent peripheral volume of distribution; IIV, inter-individual variability presented as variance estimates; RUV, additive residual error presented as variance estimates.
-
Covariate relationships: Age – CL/F, impact of age on the oral elimination clearance implemented as a linear function, centered on 35 years of age (1 + Θ × (Age-35)). Vomit – F, impact of vomiting and redosing on relative oral bioavailability (Vomiting: 1 + Θ). Patient – MTT, impact of malaria on the mean absorption transit time (Malaria patients: 1 + Θ). Patient – Vc/F, impact of malaria on the central volume of distribution (Malaria patients: 1 + Θ). Patient – Vp/F, impact of malaria on the peripheral volume of distribution (Malaria patients: 1 + Θ).
-
*
Computed population mean parameter estimates from NONMEM were calculated for a typical healthy individual with a body weight of 70 kg and 35 years of age.
-
†
Computed from sampling importance resampling (SIR; 1,000 samples, 200 resamples) and presented as median estimate (2.5th to 97.5th percentiles).
Additional files
Download links
A two-part list of links to download the article, or parts of the article, in various formats.
Downloads (link to download the article as PDF)
Open citations (links to open the citations from this article in various online reference manager services)
Cite this article (links to download the citations from this article in formats compatible with various reference manager tools)
The clinical pharmacology of tafenoquine in the radical cure of Plasmodium vivax malaria: An individual patient data meta-analysis
eLife 11:e83433.
https://doi.org/10.7554/eLife.83433


