Bias in nutrition-health associations is not eliminated by excluding extreme reporters in empirical or simulation studies
- School of Human Evolution and Social Change, Arizona State University, United States
- Department of Epidemiology and Biostatistics, Indiana University School of Public Health-Bloomington, United States
- Lee Kong Chian School of Medicine, Nanyang Technological University, Singapore
- Department of Biostatistics, University of Arkansas for Medical Sciences, United States
- Arkansas Children’s Research Institute, United States
Figures
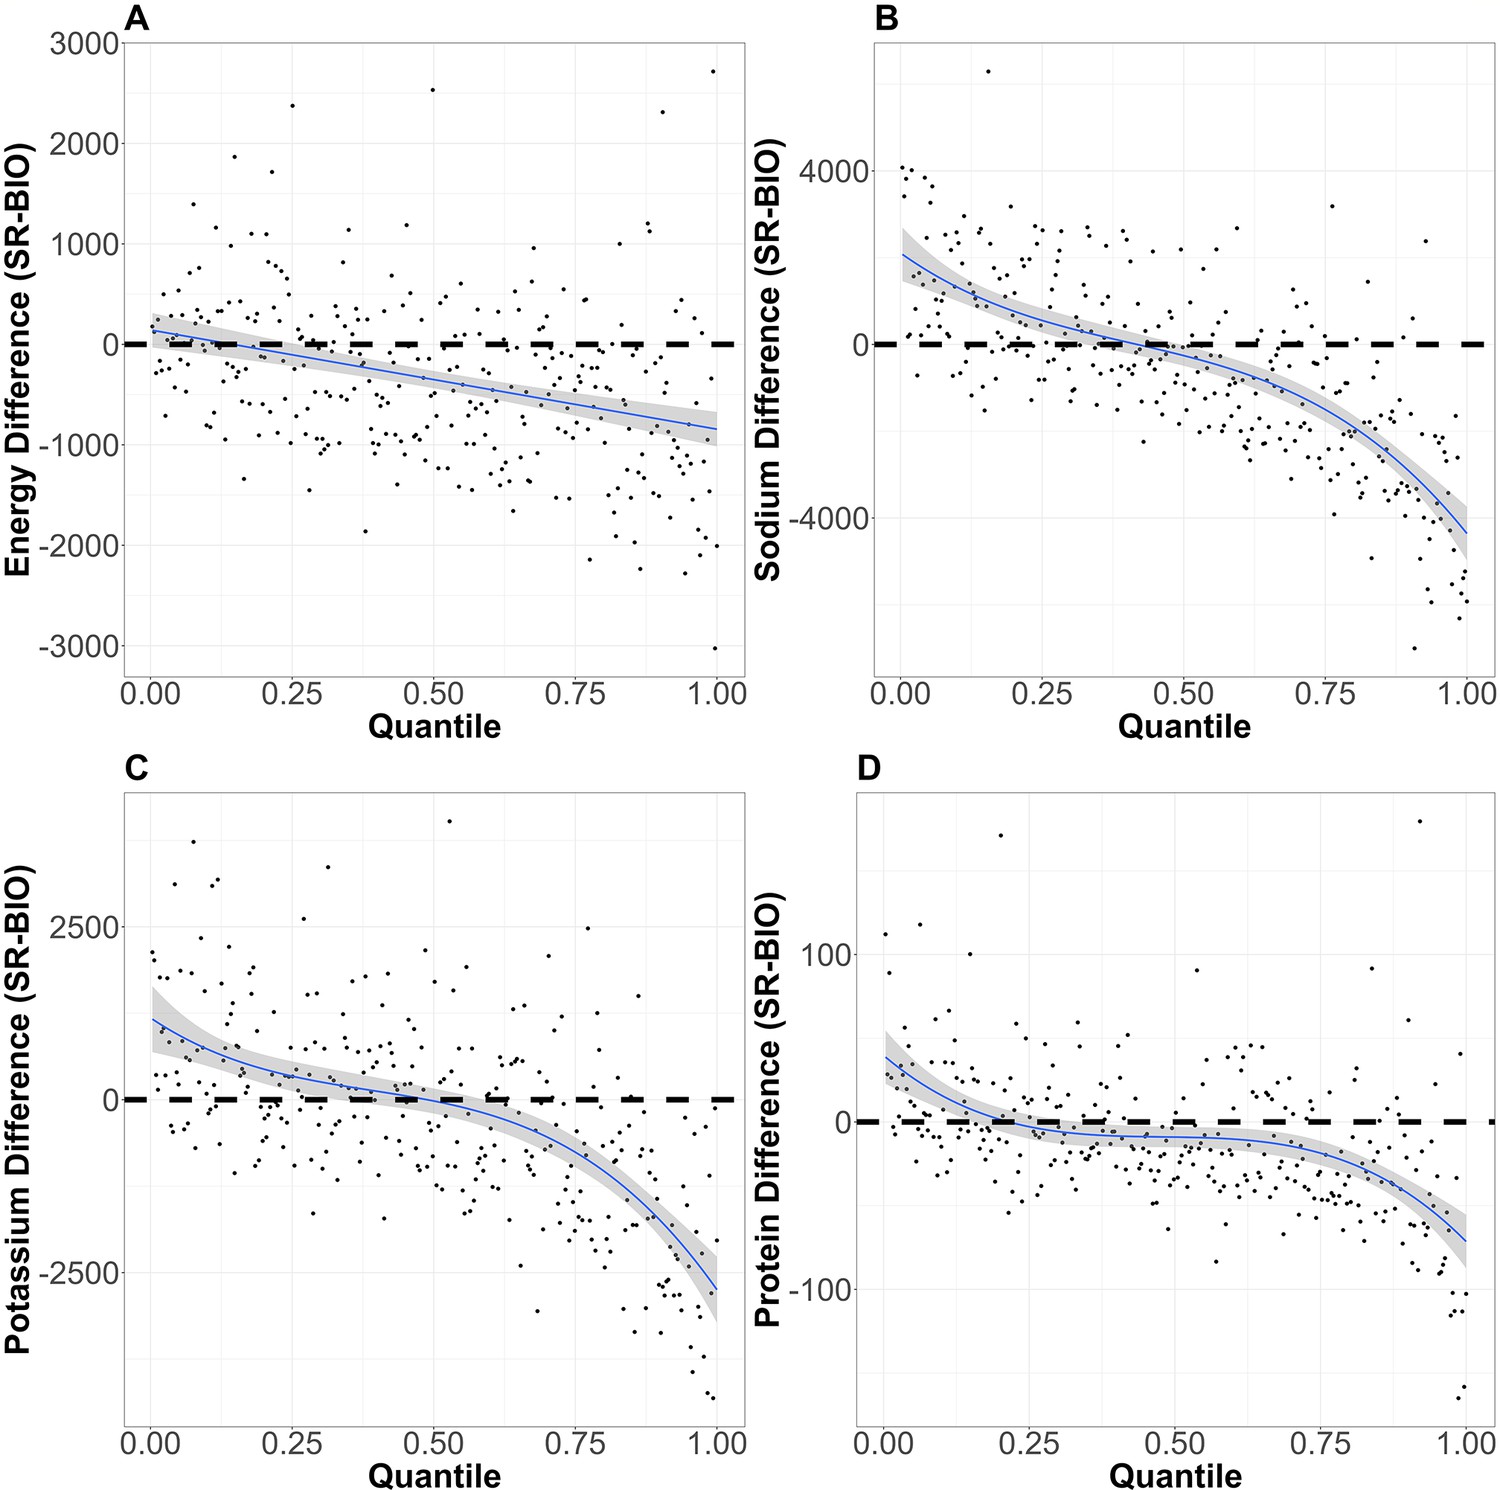
Figure 1
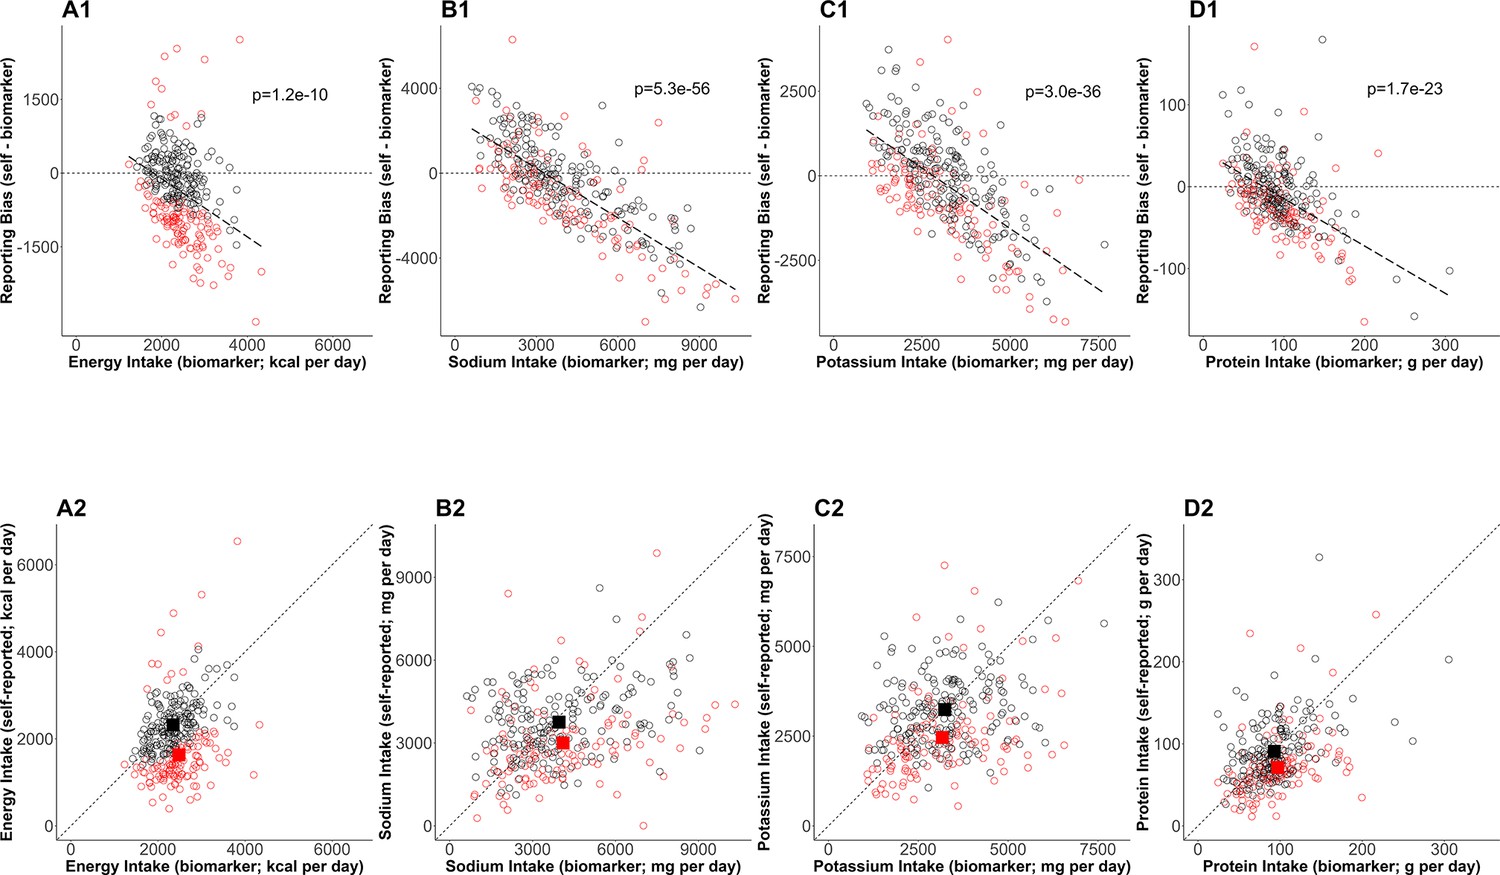
Bias in self-reported nutrition intakes.
(Upper panels) The error in mean of self-reported nutrition intake (A: energy intake, B: sodium intake, C: potassium intake, D: protein intake) and relevant nutrition intake measured by biomarkers are plotted. The regression lines are plotted with dashed lines and the corresponding p-values are stated. The dotted horizontal lines at zero indicate there is no error in nutrition intake. The red circles and black circles are the rejected cases and the accepted cases, respectively. (Bottom panels) Self-reported nutrition intake and biomarker-based nutrition intake measured are plotted. Closed red and black squares are the mean of nutrition intake in the rejected cases and the accepted cases (NIG), respectively.
Figure 2 with 2 supplements

Bias in associations between self-reported nutrition intakes and health outcomes.
Italic bold font denotes significant associations between nutrition intake measured by biomarkers and the outcome (see column in Supplementary file 2). Open squares correspond to the maximum likelihood estimators and the bars are 95% CIs. Closed squares are plotted at the left end or right end of the panel when the point estimate is beyond the x-axis limits. Using three types of regression coefficients ( : self-reported data, : biomarker data, : Goldberg accepted data), two metrics of bias were defined: Percent bias of the linear regression coefficient, (Left panel; *: Significant bias was observed); percent remaining bias of the linear regression coefficient, (Right panel; #: Significant bias reduction was observed [i.e., bias reduction 95% CI is within –100–100]; *: Significant remaining bias was observed).
-
Figure 2—source data 1
Bias in associations between self-reported nutrition intakes and health outcomes.
- https://cdn.elifesciences.org/articles/83616/elife-83616-fig2-data1-v1.docx
Figure 2—figure supplement 1
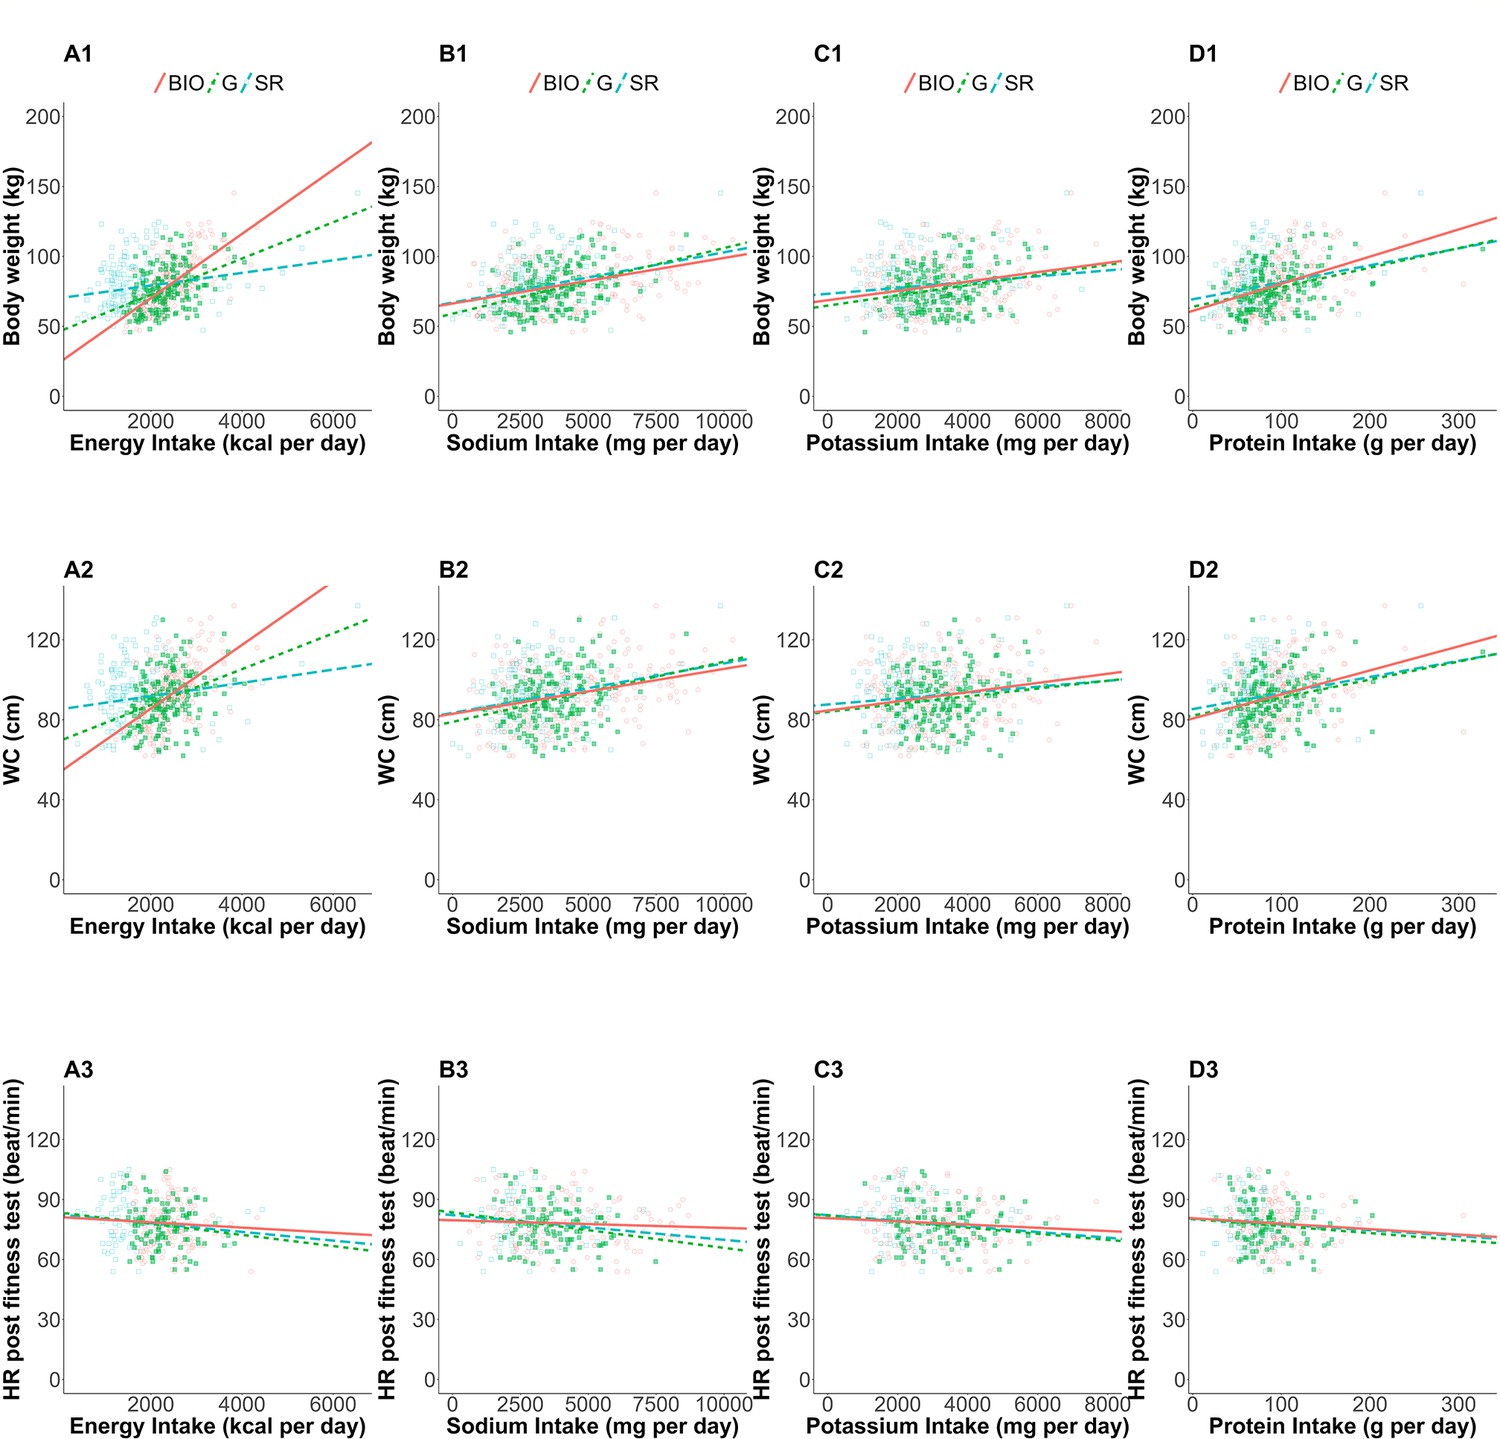
Linear regressions of health outcomes on nutrition intakes.
The estimated linear regression: associations between (A) EI, (B) SI, (C) PoI, (D) PrI and (Schoeller et al., 1990) body weight (kg), (Dhurandhar et al., 2015) waist circumference (cm), and (Astrup, 2005) heart rate after the fitness test (beat/min). Open blue squares, filled green squares, and open red circles correspond to self-reported nutrition intake of the whole cases, self-reported nutrition intake of the accepted cases, and nutrition intake measured by biomarkers, respectively. Dashed blue, dotted green, and solid red lines are estimated regression lines using the data with the corresponding color, respectively.
Figure 2—figure supplement 2
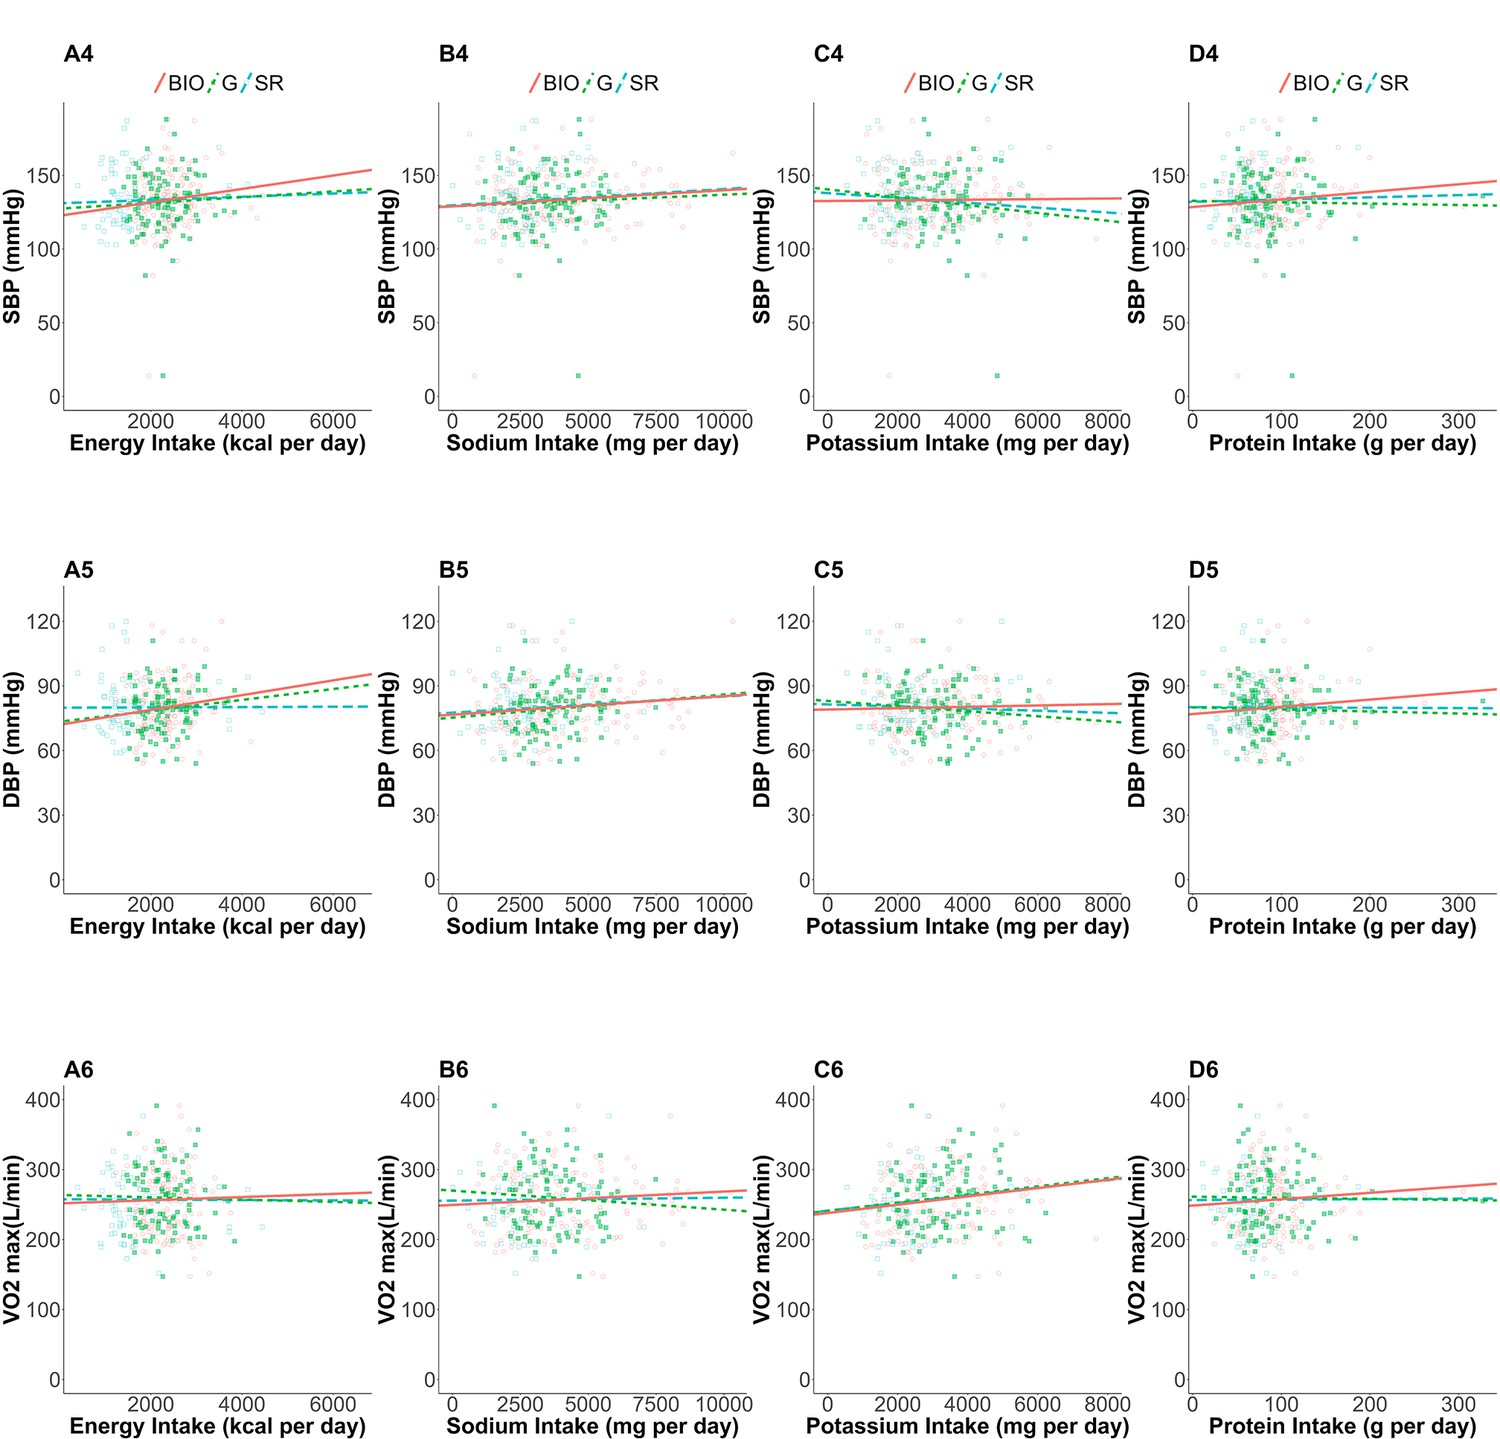
Linear regressions of health outcomes on nutrition intakes.
The estimated linear regression: associations between (A) EI, (B) SI, (C) PoI, (D) PrI and (Ferrannini, 1988) resting systolic blood pressure (mmHg), (Leonard, 2012) resting diastolic blood pressure (mmHg), and (Schoeller et al., 1986) maximal oxygen uptake (L/min). Open blue squares, filled green squares, and open red circles correspond to self-reported nutrition intake of the whole cases, self-reported nutrition intake of the accepted cases, and nutrition intake measured by biomarkers, respectively. Dashed blue, dotted green, and solid red lines are estimated regression lines using the data with the corresponding color, respectively.
Figure 3 with 2 supplements
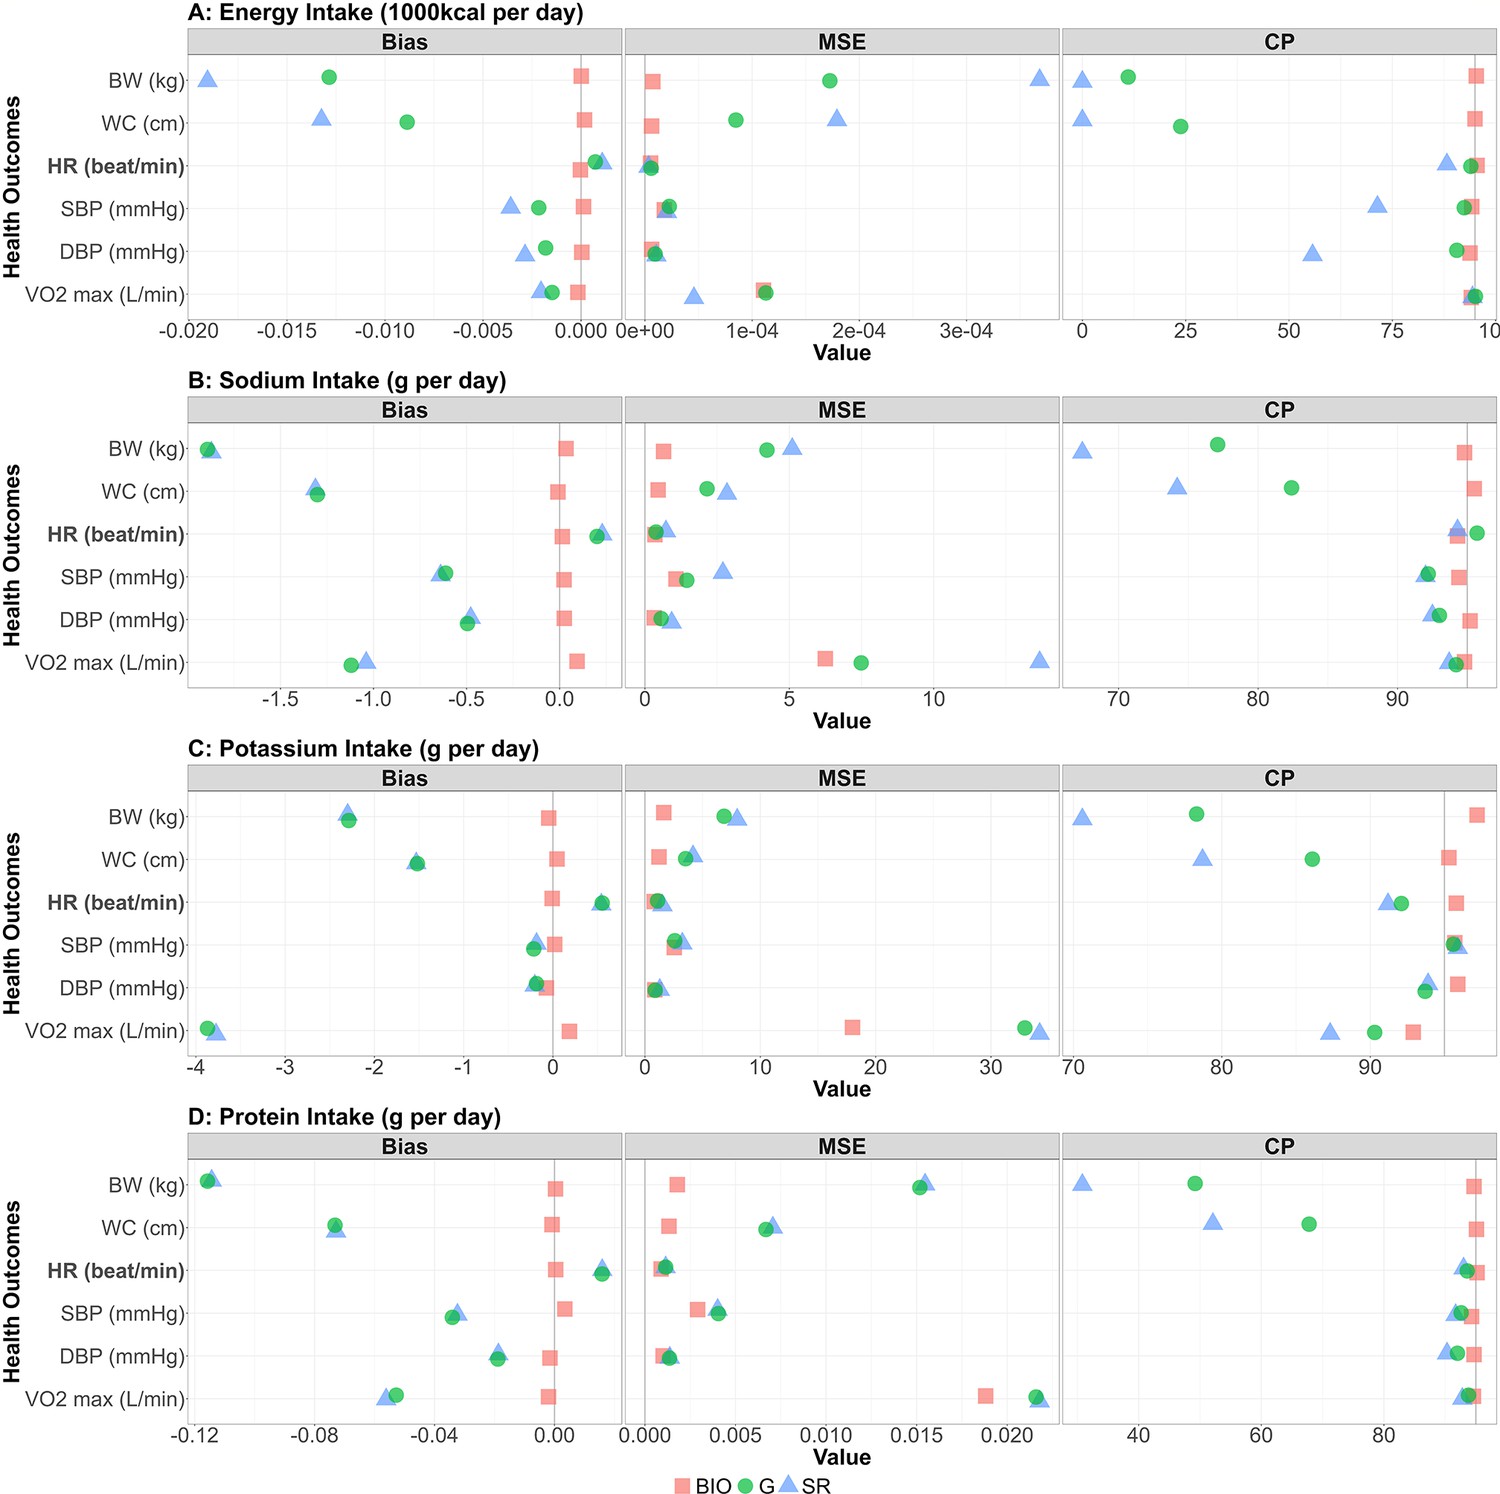
Bias, MSE, and coverage probability in the simulation study.
The bias, mean squared error (MSE), and the coverage probability (CP) in regression coefficients between four nutrition intakes (A: energy intake, B: sodium intake, C: potassium intake, D: protein intake) and six health outcomes (body weight, waist circumference, HR [heart rate] post fitness test, resting SBP [systolic blood pressure], resting DBP [diastolic blood pressure], and VO2 max) for 1000 replicates. Bold font denotes negative associations between nutrition intake measured by biomarkers and the outcome. Red square, blue triangle, and green circle represent biomarker-based nutrition intake, self-reported nutrition intake, and Goldberg accepted nutrition intake, respectively. (Left panel) The bias between estimated and true regression coefficients are plotted. The grey vertical line at zero indicates there is no bias between the true regression coefficient and the mean of the 1000 replicates. For each combination, if the green dot is closer to 0 than the blue triangle, then that indicates Goldberg cutoff rule reduced the bias. (Middle panel) The MSE between estimated and true regression coefficients are plotted. The grey vertical line at zero indicates there is no bias between the true regression coefficient and the mean of the 1000 replicates. For each combination, if the green dot is closer to 0 than the blue triangle, then that indicates Goldberg cutoff rule reduced the MSE. (Right panel) The coverage probability for simulation studies. The grey vertical line indicates coverage probability consistent with 95% confidence intervals. For each combination, if the green dot is closer to 95 than the blue triangle then that indicates the Goldberg cutoff rule improved the coverage probability.
-
Figure 3—source data 1
Bias, MSE, and coverage probability in the simulation study.
- https://cdn.elifesciences.org/articles/83616/elife-83616-fig3-data1-v1.docx
Figure 3—figure supplement 1
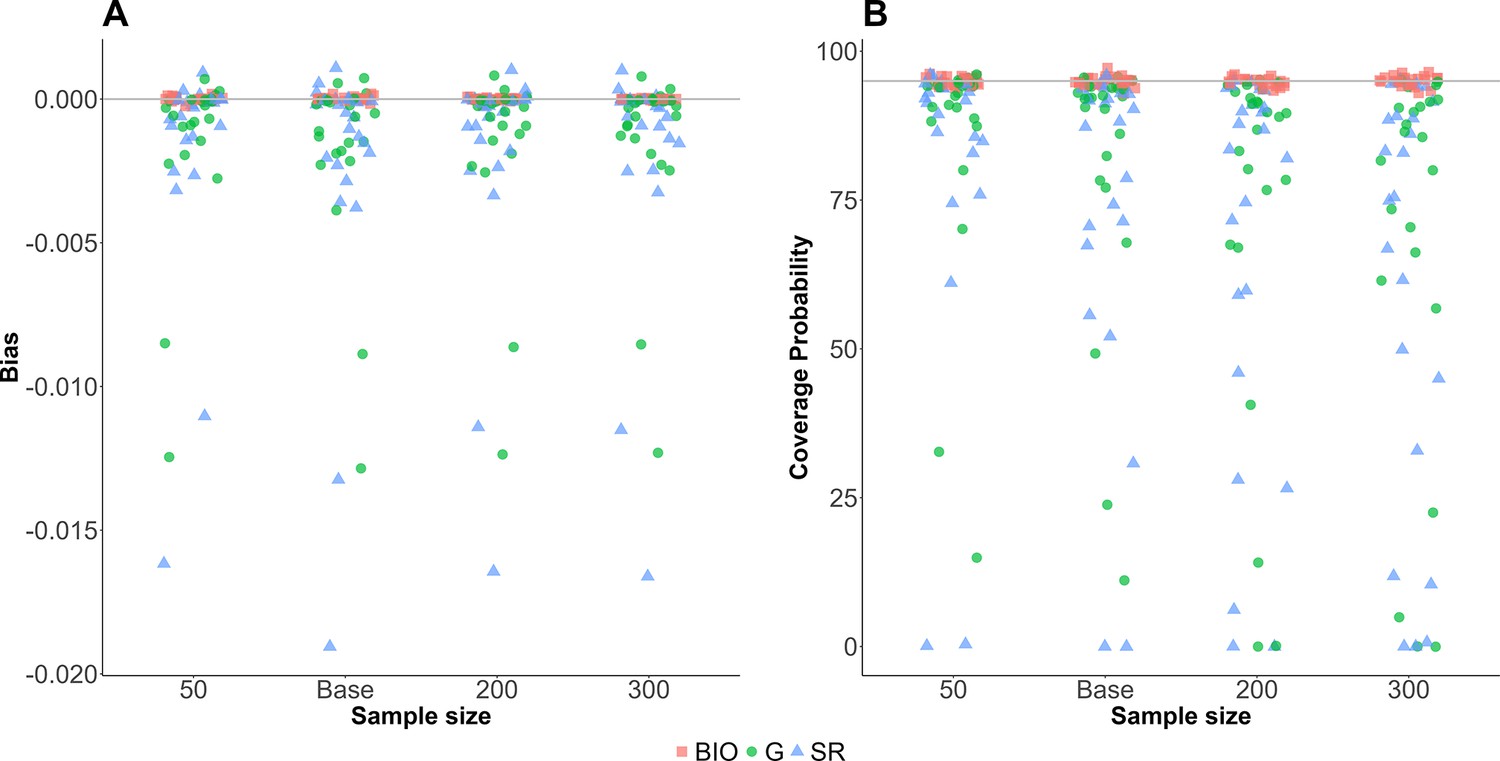
Sensitivities of the sample size relative to the base value.
Sensitivity analysis of the sample size. The sample size was varied between 0.5 and 3 times of the baseline values (=50, 100, 200, and 300). Red square, blue triangle, and green circle represent bias (A) and coverage probability (B) for biomarker-based nutrition intake, self-reported nutrition intake, and Goldberg accepted nutrition intake, respectively.
Figure 3—figure supplement 2
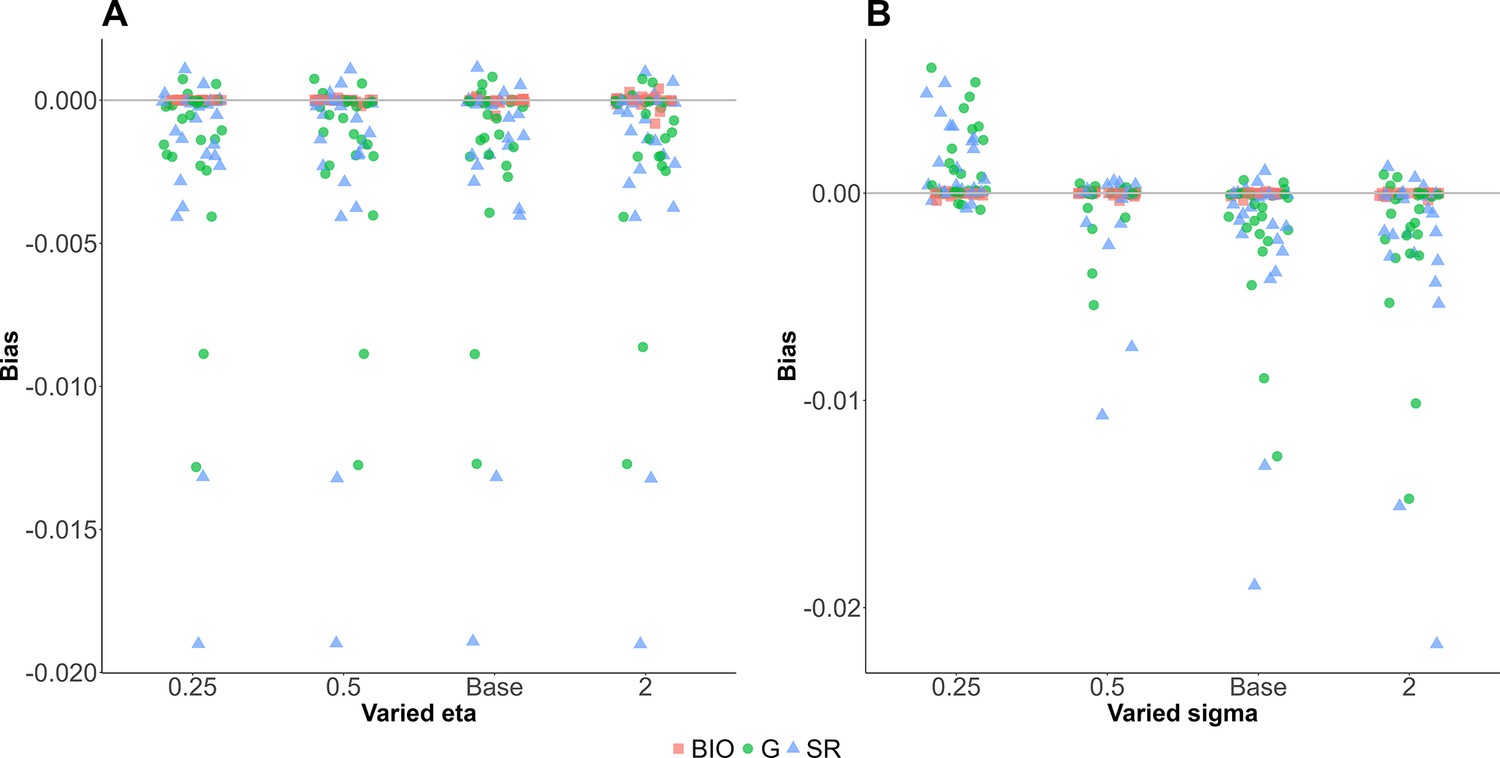
Sensitivities of parameters relative to the base values.
Sensitivity analysis of the selected parameters. The parameters were varied between 0.25 and 2 times of the baseline values. Red square, blue triangle, and green circle represent bias for biomarker-based nutrition intake, self-reported nutrition intake, and Goldberg accepted nutrition intake, respectively.
Figure 4 with 2 supplements
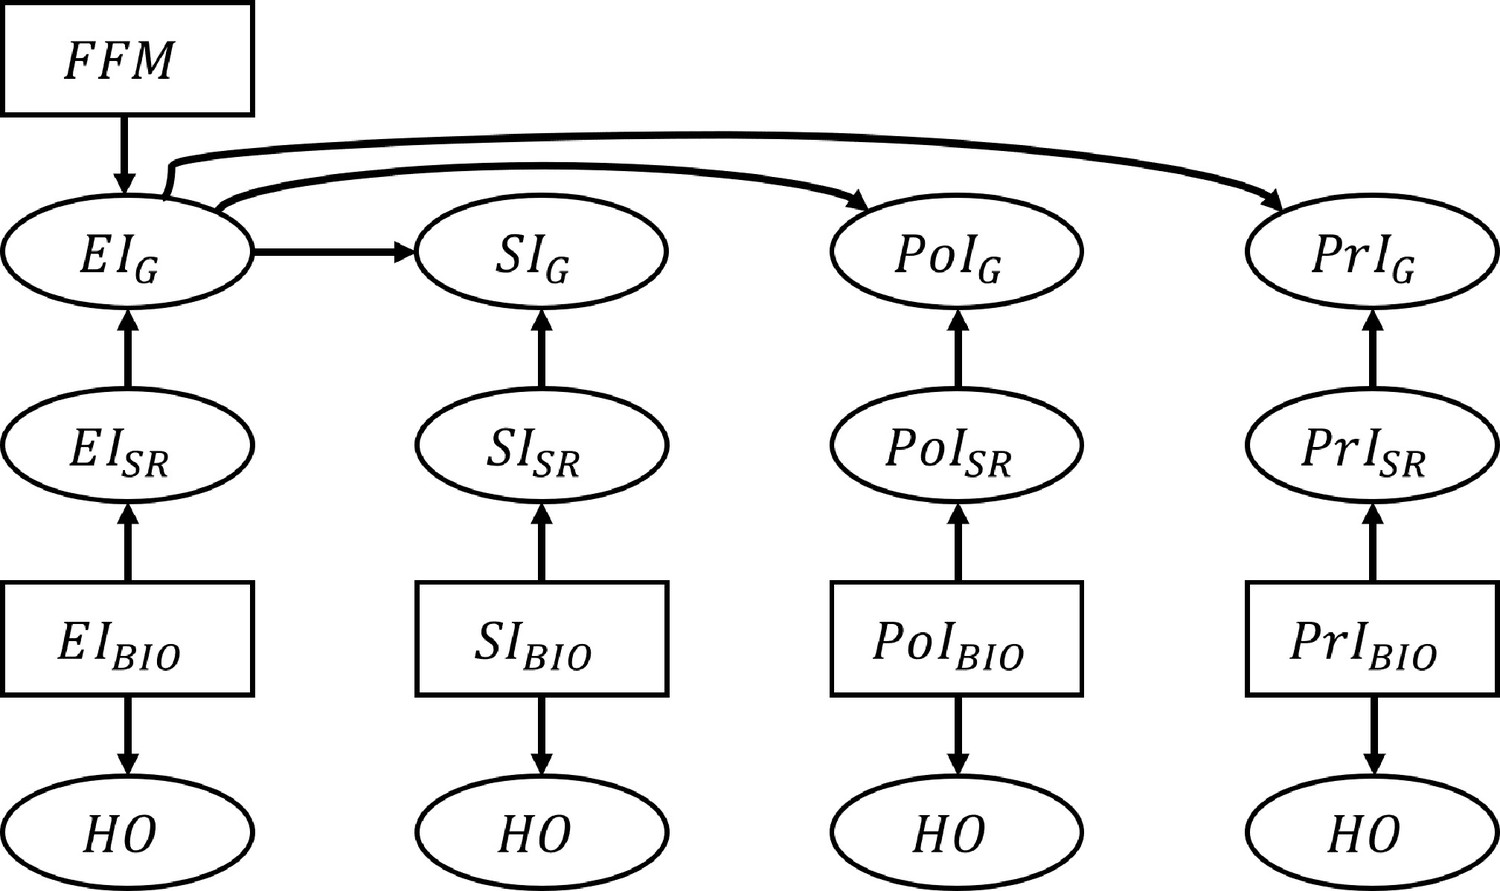
Schematic illustration of the data generation process for the nutrition intake and health outcomes.
The associations between nutrition intake (EI: Energy Intake, SI: Sodium Intake, PtI: Potassium Intake, PrI: Protein Intake) and health outcomes (HO: body weight, waist circumference, heart rate after fitness test, resting systolic blood pressure, resting diastolic blood pressure, and VO2 max). The subscripts ‘SR’, ‘BIO’, and ‘G’ denote self-reported NI, biomarker-based NI, and self-reported NI after applying the Goldberg cutoffs, respectively. Fat free mass is denoted by FFM and used to calculate the Goldberg cutoff threshold. An arrow from one node, A, to another, B, means ‘B is generated by A’. Rectangles represent the variables that are resampled from the empirical distribution, and ellipses are for the variables generated from the models.
Figure 4—figure supplement 1
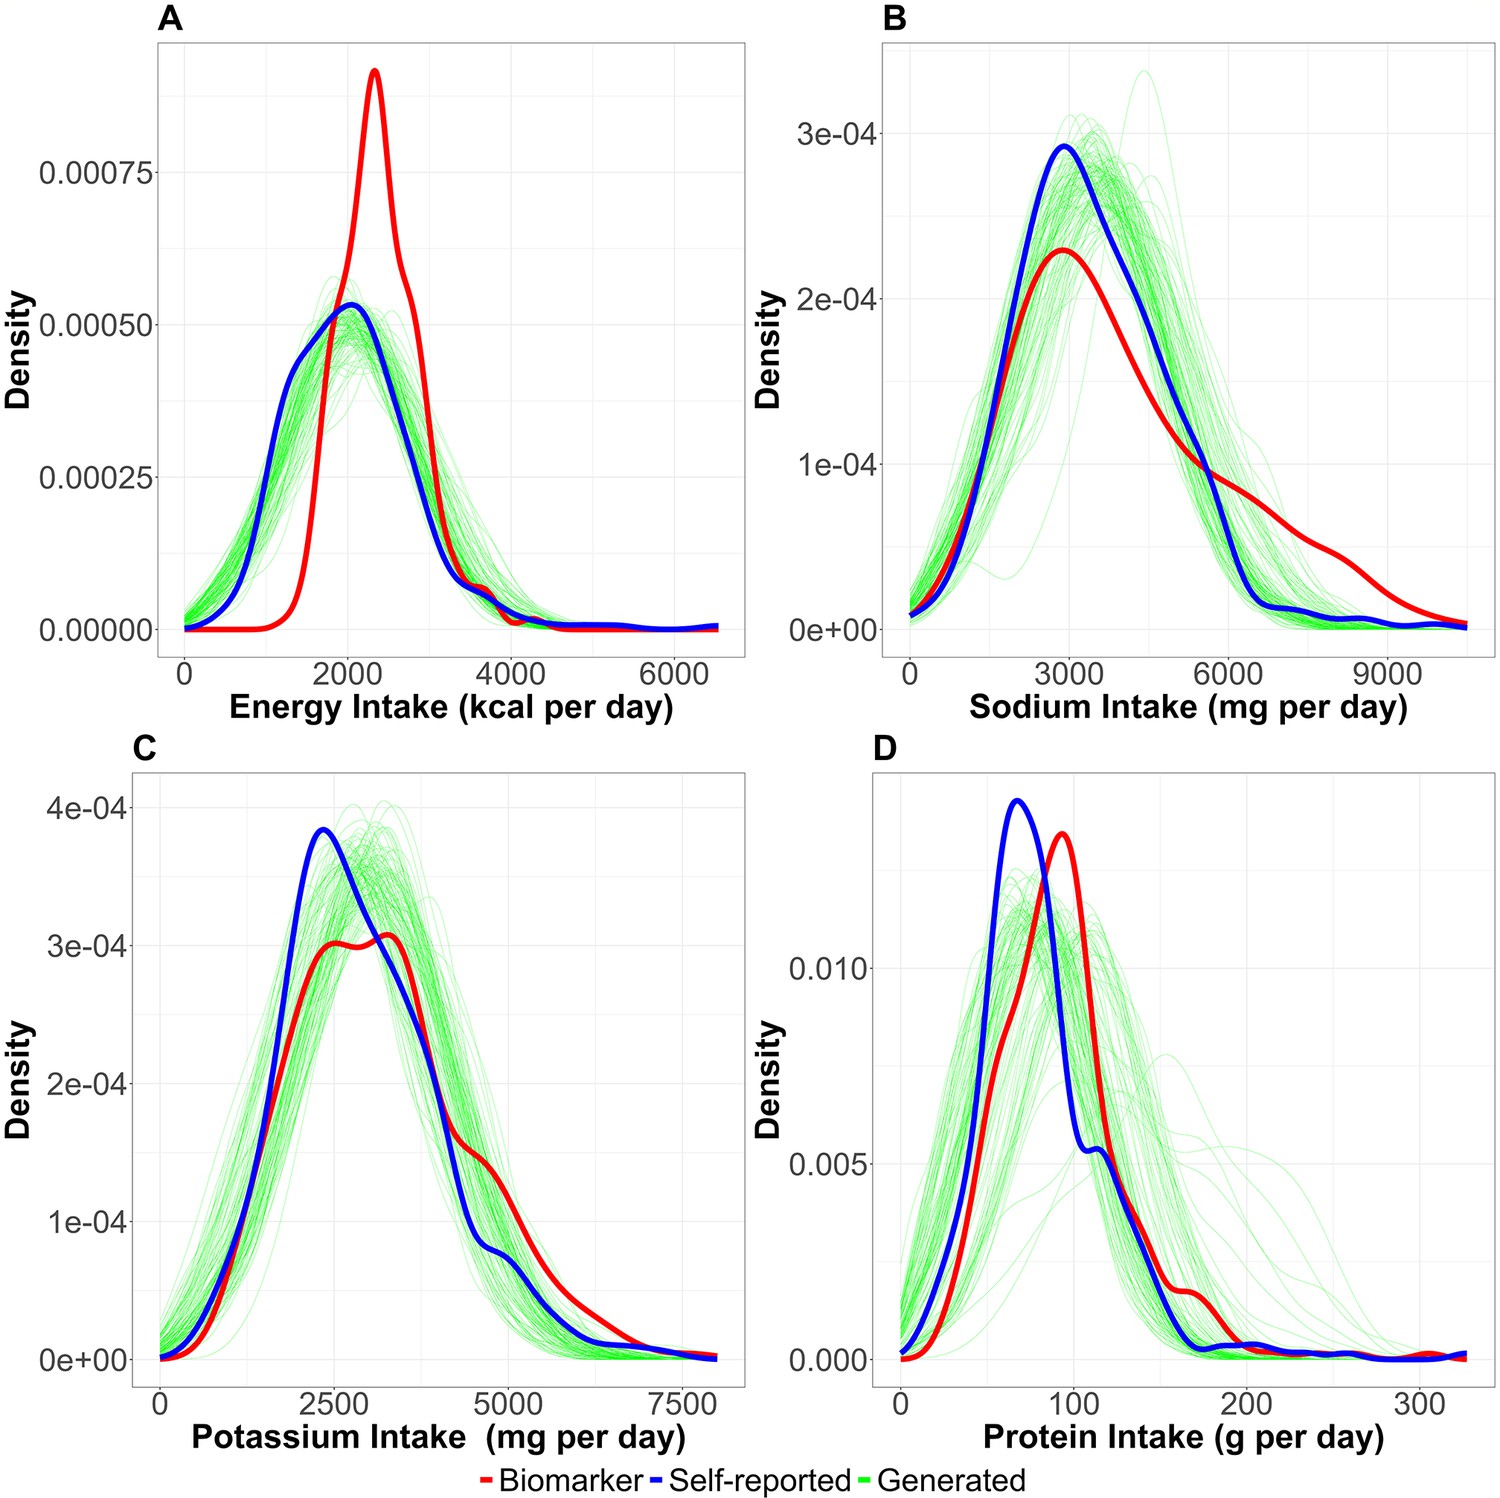
Distribution of nutrition intake.
The distributions of nutrition intake (A: energy intake, B: sodium intake, C: potassium intake, and D: protein intake) are shown. Red, blue, and green lines correspond to biomarker-based nutrition intake, self-reported nutrition intake, and generated (self-reported) nutrition intake, respectively. Each simulation generating nutrition intake was with n=100 and the simulation was repeated 1000 times in this figure.
Figure 4—figure supplement 2
Distribution of the reporting error.
The distributions of reporting error on quantiles of different nutrition intakes (A: energy intake, B: sodium intake, C: potassium intake, and D: protein intake) are shown. The horizontal dotted lines correspond with no reporting error. The blue lines and the shaded areas are the fitted polynomials (degrees of polynomials are 1, 3, 3, and 5 for energy intake, sodium intake, potassium intake, and protein intake, respectively) and the 95% CI of the polynomials.
Tables
Table 1
Variables, data generation models, and metrics of performance of the Goldberg cutoffs.
| Variables and parameters | Description |
|---|---|
| Self-reported nutrition intake, where NI can be energy intake (EI), sodium intake (SI), potassium intake (PoI), or protein intake (PrI) | |
| Biomarker nutrition intake | |
| Self-reported nutrition intake accepted by the Goldberg cutoffs | |
| Health outcomes, where HO can be body weight (BW), waist circumference (WC), heart rate after fitness test (HR), resting systolic blood pressure (SBP), resting diastolic blood pressure (DBP), and VO2 max (VO2) | |
| Estimated coefficients in the regression model using NI and HO as a dependent and an independent variables. | |
| True coefficients, the point estimate from the IDATA (used in simulation) | |
| Data generation models | Description |
| is the error of health outcomes | |
| is the reporting error | |
| is the mean error function, determined by a polynomial function of percentiles of NIBIO | |
| Metrics of performance of the Goldberg cutoffs (data analysis) | Description |
| Percent bias (%) in the estimation of NI-HO association when using . | |
| Percent remaining bias (%) in the estimation of NI-HO association when using instead of . | |
| Metrics of performance of the Goldberg cutoffs (simulation) | Description |
| Bias in the estimation of NI-HO association. is the point estimate from the ith simulation | |
| Mean Squared Error in the estimation of NI-HO association. | |
| Coverage probability in the estimation of NI-HO association. and are lower and upper 95% confidence intervals. |
Table 2
Baseline characteristics of the analyzed data*.
| Variable | IDATA | P-value |
|---|---|---|
| Total Number | 303 | |
| Age (years) | 63.0±5.9 | |
| Male | 124 (40.9%) | |
| Race | ||
| Non-Hispanic White | 283 (93.4%) | |
| African American | 19 (6.3%) | |
| Asian | 1 (0.3%) | |
| Weight (kg) | 79.4±17.1 | |
| Height (cm) | 168.8±9.0 | |
| Waist circumference (cm) | 92.0±14.2 | |
| BMI (kg/m2) | 27.7±4.7 | |
| Fat-free mass (kg) | 48.9±10.9 | |
| Daily EI estimated from ASA24 (EISR; kcal/day) | 2048.0±783.4 | |
| Daily EI estimated from DLW (EIBIO; kcal/day) | 2400.3±492.8 | |
| Reporting bias in EI (EISR - EIBIO) | –352.3±811.0 | <0.001 |
| Daily SI estimated from ASA24 (SISR; mg/day) | 3457.9±1440.8 | |
| Daily SI estimated from urine (SIBIO; mg/day) | 4015.0±1995.7 | |
| Reporting bias in SI (SISR - SIBIO) | –557.0±2075.2 | <0.001 |
| Daily PoI estimated from ASA24 (PoISR; mg/day) | 2931.4±1136.9 | |
| Daily PoI estimated from urine (PoIBIO; mg/day) | 3210.9±1253.9 | |
| Reporting bias in PoI (PoISR - PoIBIO) | –279.5±1404.8 | <0.001 |
| Daily PrI estimated from ASA24 (PrISR; mg/day) | 83.0±38.8 | |
| Daily PrI estimated from urine (PrIBIO; mg/day) | 94.5±38.3 | |
| Reporting bias in PrI (PrISR - PrIBIO) | –11.5±41.6 | <0.001 |
-
*
Values are mean ± SD or n (%).
Table 3
Summary of nutrition intakes of the accepted and the rejected cases by the Goldberg cutoffs*.
| Accepted | Rejected | P-value† | ||
|---|---|---|---|---|
| Number | 183 | 120 | ||
| Bias | Energy intake (kcal/d) | –26±33 | –850±89 | <0.001 |
| Sodium intake (mg/d) | –201±142 | –1100±200 | <0.001 | |
| Potassium intake (mg/d) | 3±98 | –710±129 | <0.001 | |
| Protein intake (g/d) | –2±3 | –26±4 | <0.001 | |
| Self-reported | Energy intake (kcal/d) | 2320±37 | 1633±86 | <0.001 |
| Sodium intake (mg/d) | 3757±93 | 3002±145 | <0.001 | |
| Potassium intake (mg/d) | 3240±71 | 2461±112 | <0.001 | |
| Protein intake (g/d) | 91±3 | 71±4 | <0.001 | |
| Biomarker | Energy intake (kcal/d) | 2346±34 | 2482±49 | 0.023 |
| Sodium intake (mg/d) | 3958±141 | 4102±195 | <0.001 | |
| Potassium intake (mg/d) | 3237±88 | 3171±124 | 0.666 | |
| Protein intake (g/d) | 93±3 | 100±4 | 0.367 | |
-
*
Values are mean ± SD or n.
-
†
Mean difference between the accepted cases and the rejected cases was tested.
Additional files
-
Supplementary file 1
List of abbreviation.
- https://cdn.elifesciences.org/articles/83616/elife-83616-supp1-v1.docx
-
Supplementary file 2
Estimated regression coefficients of the 3 analyses (per Mcal/day for EE and g/day for the others) with 95% CI computed by the jackknife method.
- https://cdn.elifesciences.org/articles/83616/elife-83616-supp2-v1.docx
-
Supplementary file 3
Statistical tests on the heteroskedasticity of the reporting error.
- https://cdn.elifesciences.org/articles/83616/elife-83616-supp3-v1.docx
-
Supplementary file 4
MSE of fitted polynomial functions for the reporting error.
- https://cdn.elifesciences.org/articles/83616/elife-83616-supp4-v1.docx
-
MDAR checklist
- https://cdn.elifesciences.org/articles/83616/elife-83616-mdarchecklist1-v1.docx
-
Reporting standard 1
STROBE checklist.
- https://cdn.elifesciences.org/articles/83616/elife-83616-repstand1-v1.docx
Download links
A two-part list of links to download the article, or parts of the article, in various formats.
Downloads (link to download the article as PDF)
Open citations (links to open the citations from this article in various online reference manager services)
Cite this article (links to download the citations from this article in formats compatible with various reference manager tools)
Bias in nutrition-health associations is not eliminated by excluding extreme reporters in empirical or simulation studies
eLife 12:e83616.
https://doi.org/10.7554/eLife.83616


