Quantitative proteomic analysis of skeletal muscles from wild-type and transgenic mice carrying recessive Ryr1 mutations linked to congenital myopathies
- Departments of Biomedicine and Neurology, Basel University Hospital, Switzerland
- Department of Cell Physiology and Metabolism, University of Geneva, Switzerland
- Proteomics Core Facility, Biozentrum, Basel University, Switzerland
- Department of Life Science and Biotechnology, University of Ferrara, Italy
Figures
Figure 1
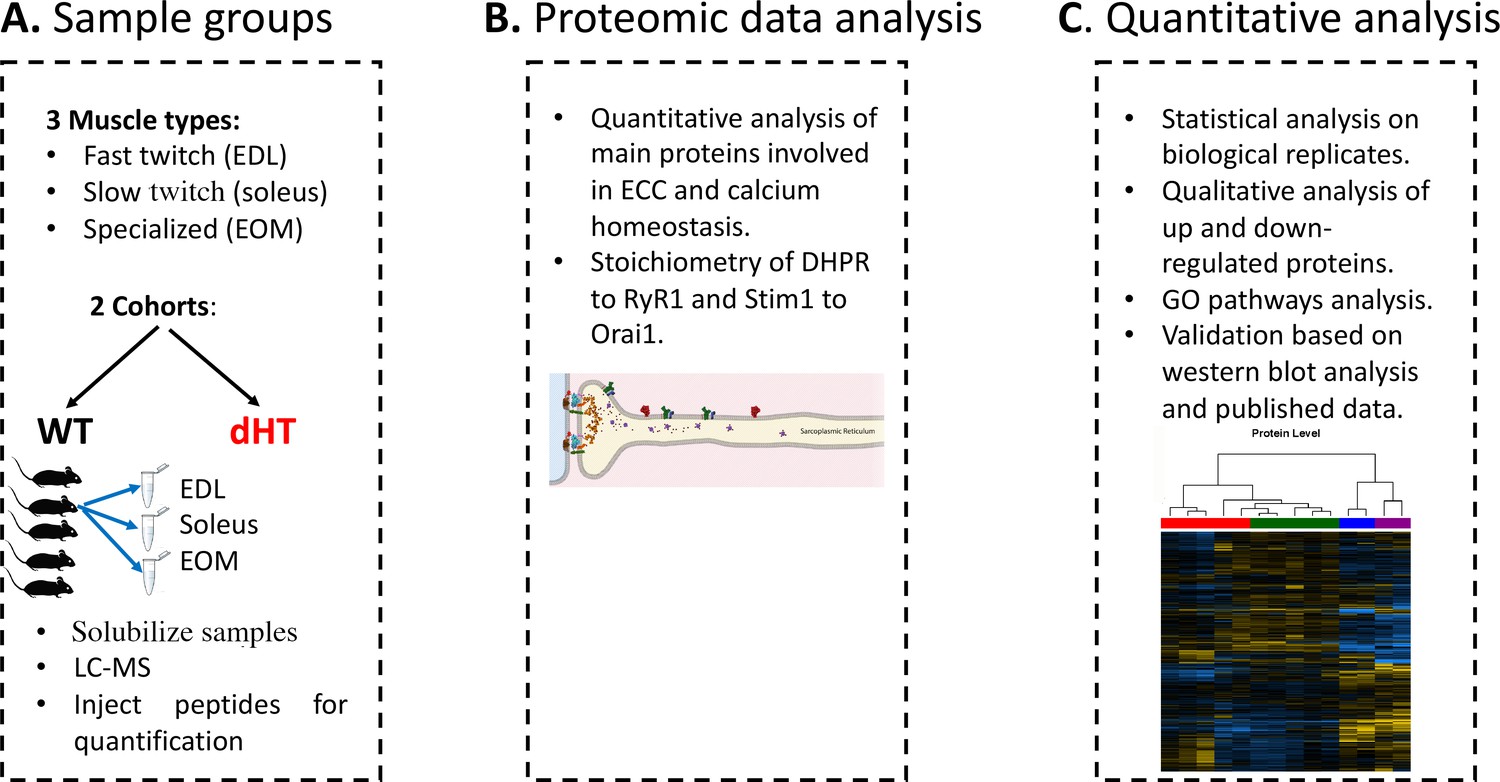
Schematic overview of the workflow.
(A) Skeletal muscles from 12 weeks old WT (5 mice) and dHT littermates (5 mice) were isolated and flash frozen. Three different types of muscles were isolated per mouse, namely EDL, soleus and EOMs. On the day of the experiment, muscles were solubilized and processed for LC-MS. (B) For absolute protein quantification, synthetic peptides of RyR1, Cav1.1, Stim1 and Orai1 were used. (C) Protein content in different muscle types and in the different mouse genotypes were analyzed and compared.
Figure 2
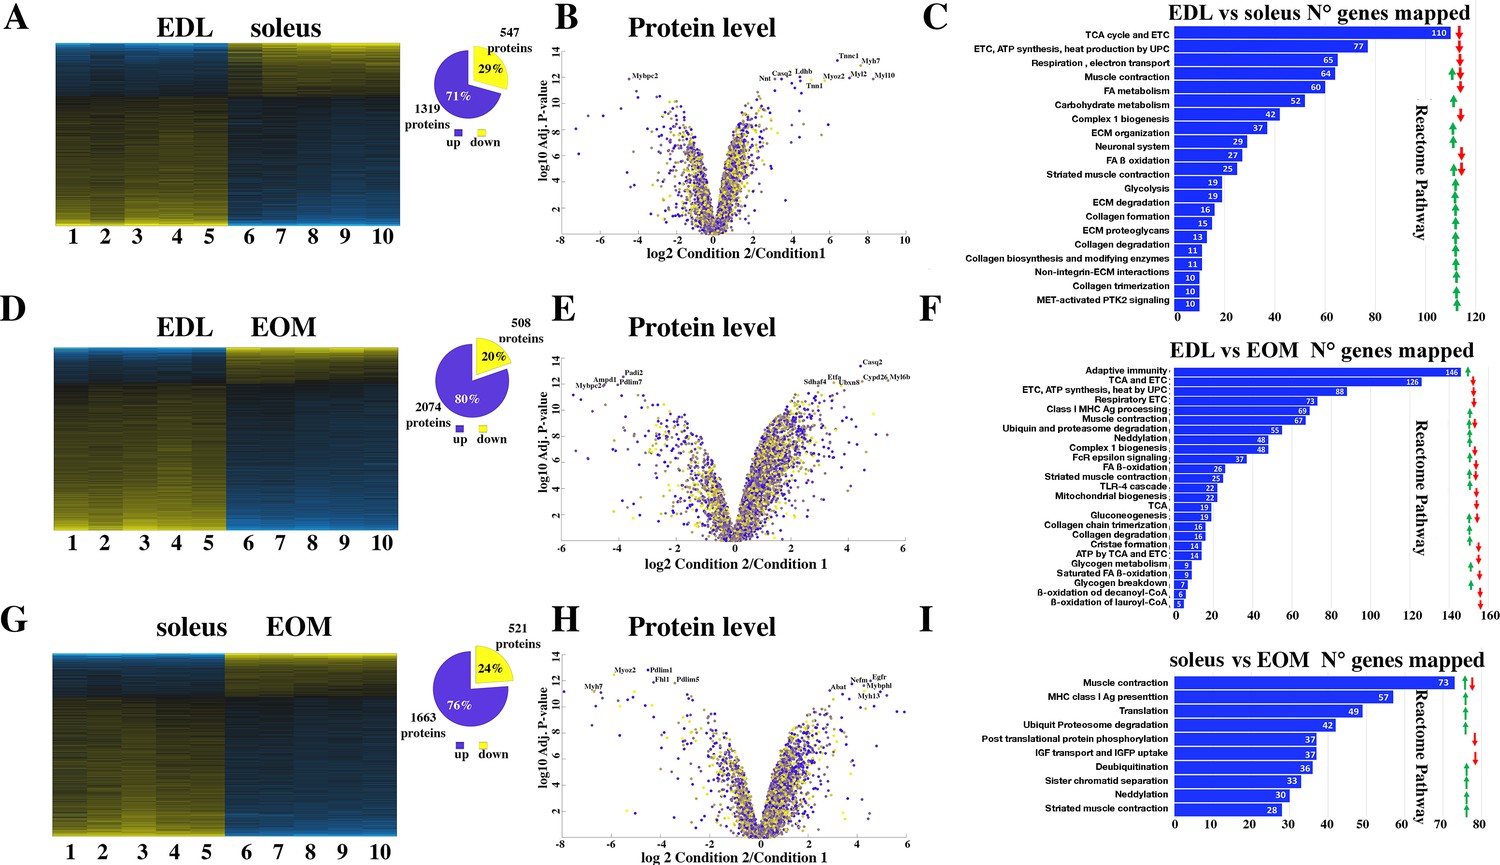
Proteomic analysis of EDL, soleus and EOM muscles from WT mice confirms the significant difference in content if proteins involved in the TCA cycle and electron transport chain, fatty acid metabolism and muscle contraction.
(A) Hierarchically clustered heatmaps of the relative abundance of proteins in EDL (columns 1–5) and soleus muscles (columns 6–10) from five mice. Blue blocks represent proteins which are increased in content, yellow blocks proteins which are decreased in content in EDL versus soleus muscles. Right pie chart shows overall number of increased (blue) and decreased (yellow) proteins. Areas are relative to their numbers. (B) Volcano plot of a total of 1866 quantified proteins which showed significant increased (blue) and decreased (yellow) content. The horizontal coordinate is the difference multiple (logarithmic transformation at the base of 2), and the vertical coordinate is the significant difference p value (logarithmic transformation at the base of 10). The proteins showing major change in content are abbreviated. Soleus: condition 2; EDL: condition 1(C) Reactome pathway analysis showing major pathways which differ between EDL and soleus muscles. (D) Hierarchically clustered heatmaps of the relative abundance of proteins in EDL (columns 1–5) and EOM muscles (columns 6–10) from five mice. Blue blocks represent proteins which are increased in content, yellow blocks proteins which are decreased in content in EDL versus EOM muscles. Right pie chart shows overall number of increased (blue) and decreased (yellow) proteins. Areas are relative to their numbers. (E) Volcano plot of a total of 1866 quantified proteins which showed significant increased (blue) and decreased (yellow) content. The horizontal coordinate is the difference multiple (logarithmic transformation at the base of 2), and the vertical coordinate is the significant difference p value (logarithmic transformation at the base of 10). The proteins showing major change in content are abbreviated. EOM: condition 2; EDL: condition 1 (F) Reactome pathway analysis showing major pathways which differ between EDL and EOM muscles. (G) Hierarchically clustered heatmaps of the relative abundance of proteins in soleus muscles (columns 1–5) and EOM (columns 6–10) from five mice. Blue blocks represent proteins which are increased in content, yellow blocks proteins which are decreased in content in soleus muscles versus EOM. Right pie chart shows overall number of increased (blue) and decreased (yellow) proteins. Areas are relative to their numbers. (H) Volcano plot of a total of 1866 quantified proteins which showed significant increased (blue) and decreased (yellow) content. The horizontal coordinate is the difference multiple (logarithmic transformation at the base of 2), and the vertical coordinate is the significant difference p value (logarithmic transformation at the base of 10). The proteins showing major change in content are abbreviated. EOM: condition 2; soleus: condition 1 (I) Reactome pathway analysis showing major pathways which differ between soleus and EOM muscles. A q-value of equal or less than 0.05 was used to filter significant changes prior to the pathway analyses. An additional filter was applied to the Heatmaps and Piecharts and only proteins showing a significant change ≥0.2 fold are included.
Figure 3 with 1 supplement

Proteomic analysis comparison of muscles from dHT and WT mice.
(A, C and E) Hierarchically clustered heatmaps of the relative abundance of proteins in EDL (A), soleus muscles (C) and EOMs (E) from three to five mice. Blue blocks represent proteins which are increased in content, yellow blocks proteins which are decreased in content in WT (columns 1–5 in A and E; 1–3 in C) versus dHT (5–10 in A and E; 4–8 in C). Right pie chart shows overall number of increased (purple) and decreased (yellow) proteins. Areas are relative to their numbers. (B, D and F) Volcano plots of total quantified proteins showing significant increased (blue) and decreased (yellow) content in dHT (condition 2) versus WT (condition 1) EDL (B), soleus (D) and EOMs (F). The horizontal coordinate is the difference multiple (logarithmic transformation at the base of 2), and the vertical coordinate is the significant difference p value (logarithmic transformation at the base of 10). The proteins showing major change in content are abbreviated. A q-value of equal or less than 0.05 was used to filter significant changes prior to the pathway analyses. An additional filter was applied to the Heatmaps and Piecharts and only proteins showing a significant change ≥0.2-fold are included.
Figure 3—figure supplement 1
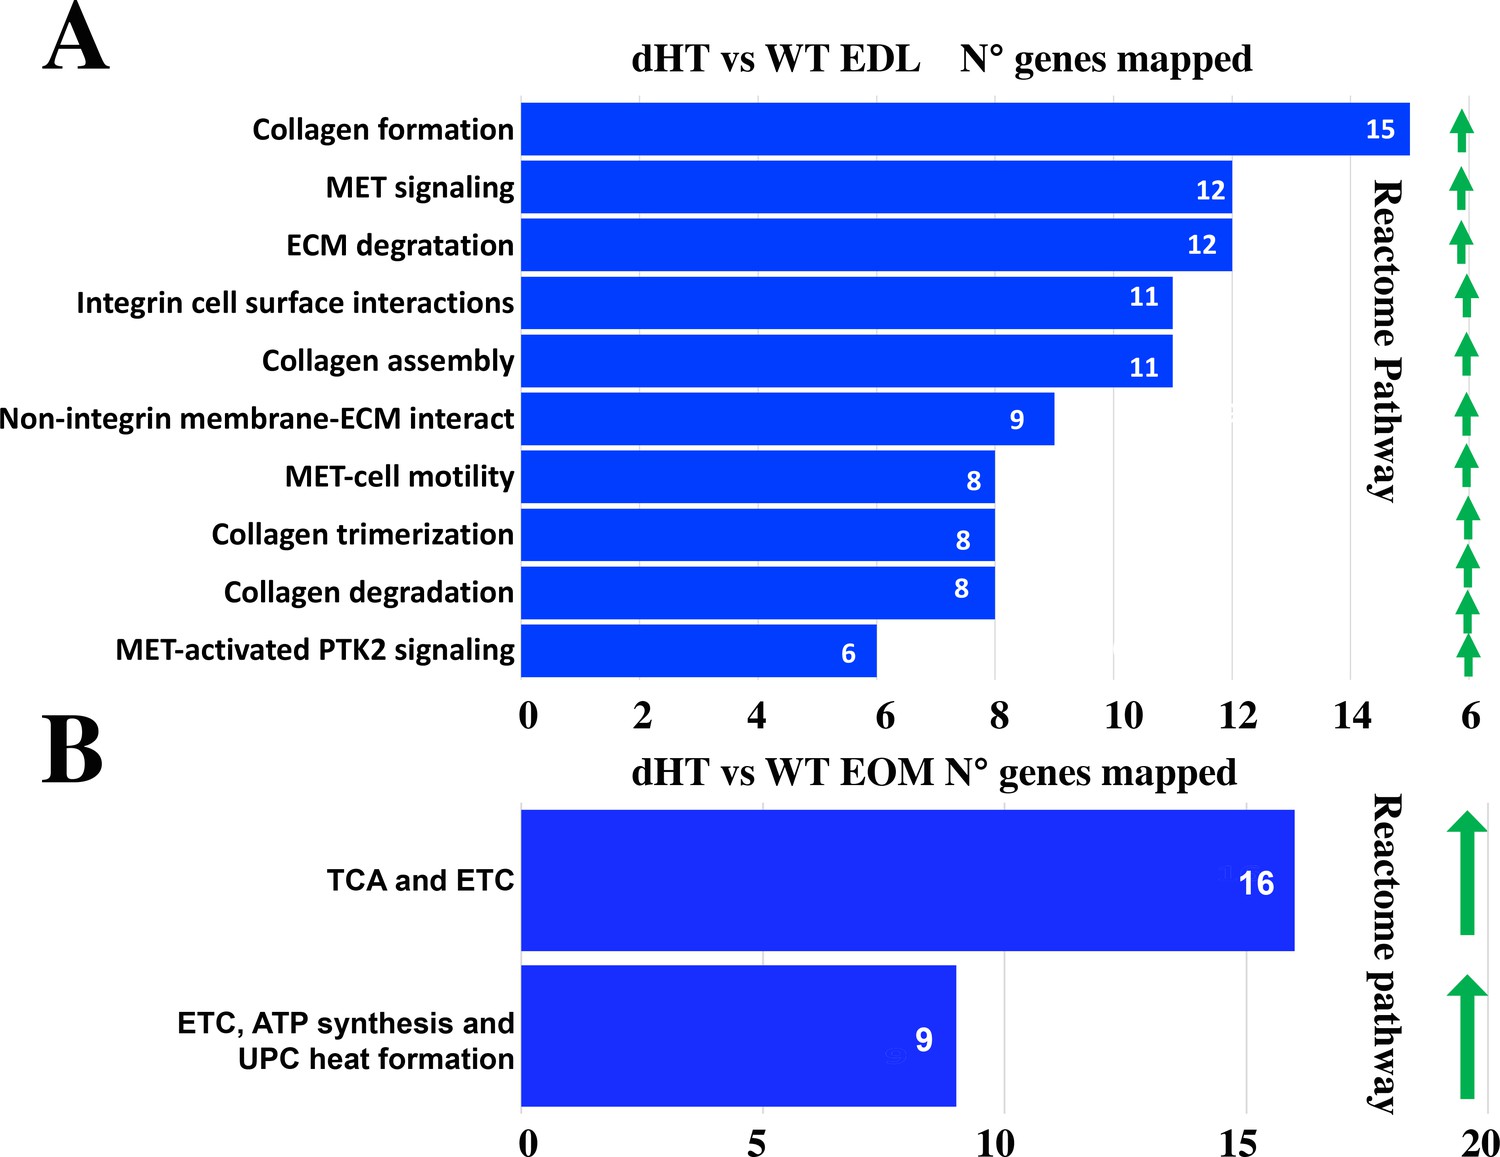
Reactome pathway analysis showing major pathways which differ between EDL muscles (A) and EOM muscles (B) in dHT versus WT mice.
A q-value of equal or less than 0.05 and showing a significant change ≥0.2 fold was used to filter significant changes prior to the pathway analyses.
Figure 4 with 1 supplement
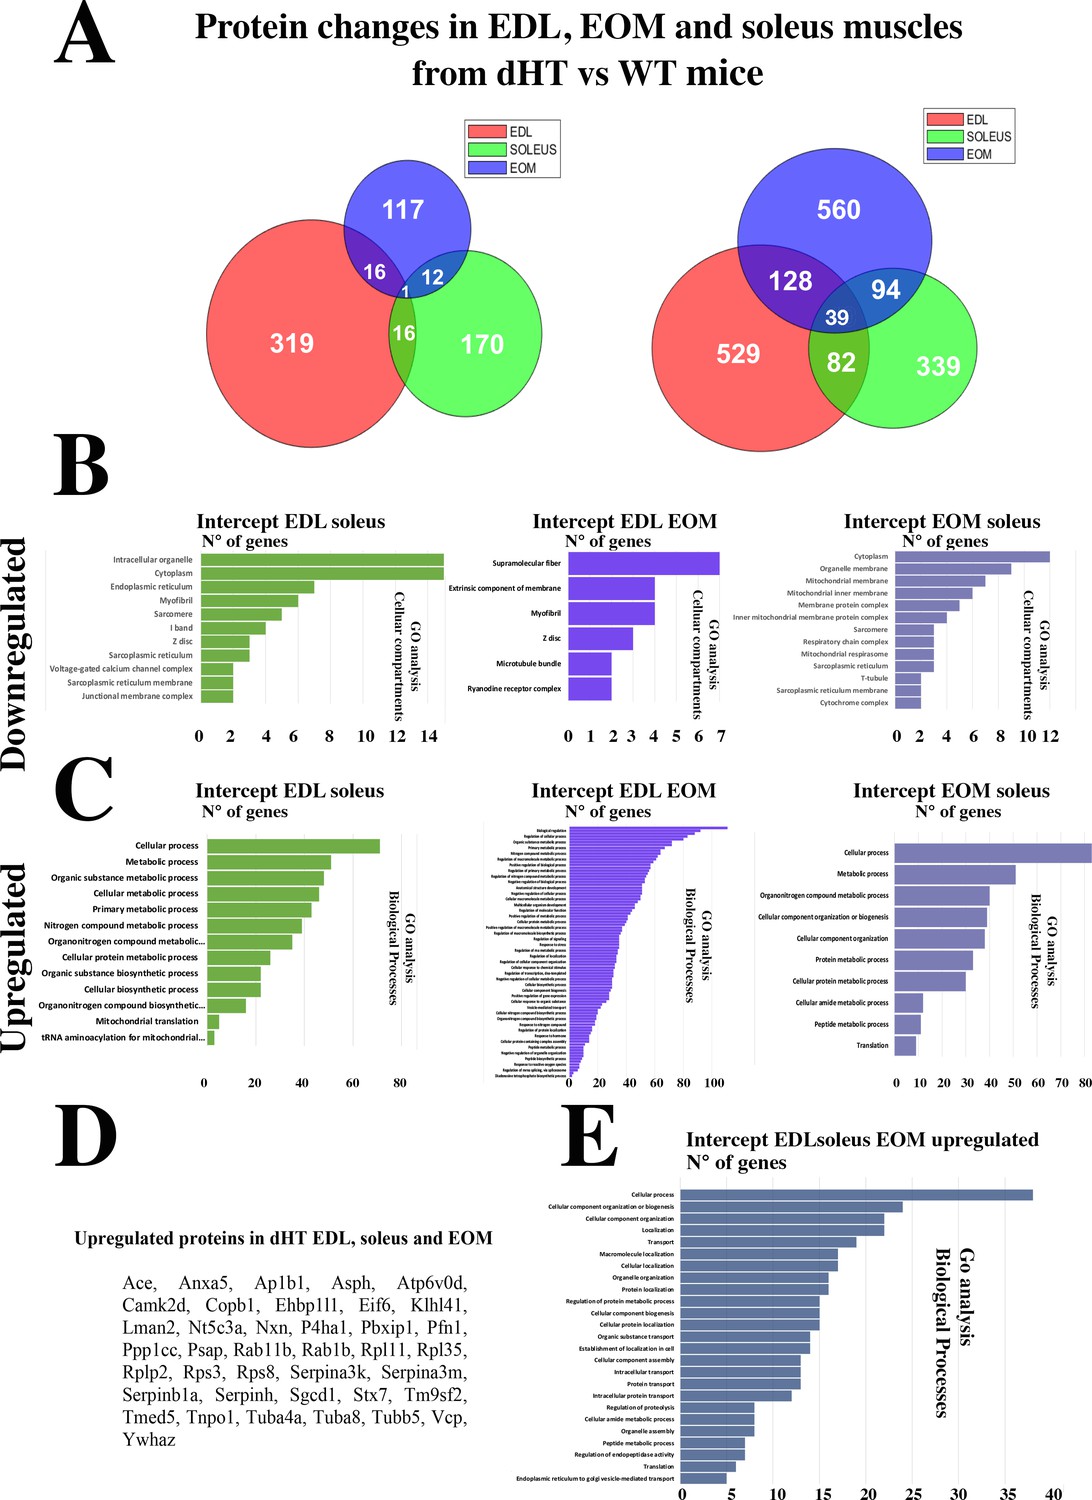
Changes in protein content in EDL, soleus and EOM between dHT vs WT mice.
(A) Venn diagram showing significantly decreased proteins (left) and increased proteins (right) in the three muscle types. (B) GO biological process analysis of common proteins that are downregulated and (C) upregulated in muscle from dHT mice. Left panels, common proteins showing significant changes in content in both EDL and soleus muscles. Central panels, common proteins showing significant changes in content in EDL and EOMs; right panels, common proteins showing significant changes in content in EOM and soleus muscles. (D) List of the 39 proteins whose content is increased in EDL, soleus and EOMs in dHT mice. (E) GO analysis annotated to Biological processes of the 39 proteins that are increased in muscles from dHT mice.
Figure 4—figure supplement 1

Gene Ontology annotated to Biological process genes showing significant differences in content between muscles from dHT and WT mice.
(A, B) and (C) Downregulated genes and (D, E) and (F) upregulated genes in EDL (A and C), soleus (B and E) and EOM (C and F) muscles. The N° of genes annotated to each category is indicated on the Y-axis. Only proteins showing a q-value equal to or less than 0.05 and showing a significant change ≥0.2 fold were included in the pathway analyses.
Figure 5
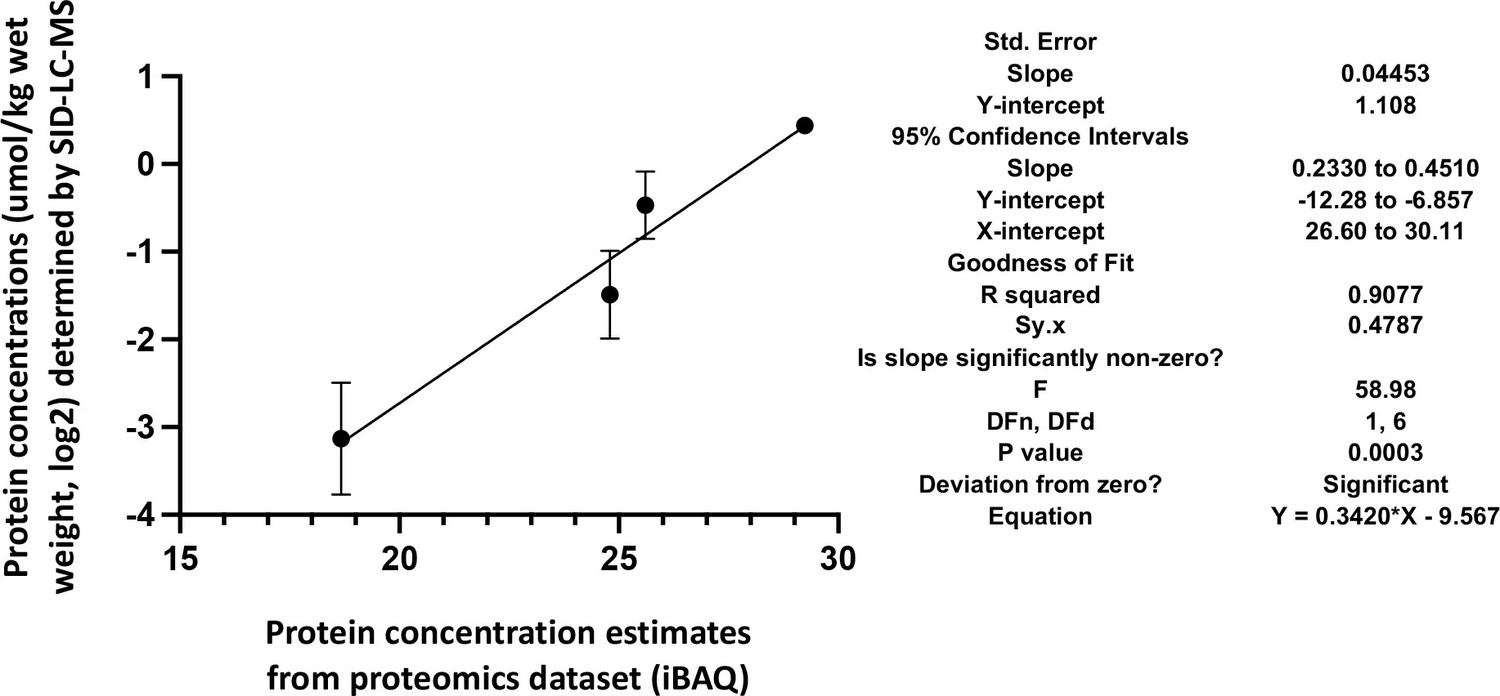
Correlation of the actual cellular abundances of four selected proteins (in µmol/kg wet weight) determined by PRM/SID (n=2) and the iBAQ values (n=5) determined by label-free/TMT quantification (both in logarithmic scale, base 2) from the global proteomics discovery dataset for EDL samples.
Error bars are indicated for the y-axis, but for the x-axis, due to their low scale (range from 0.058 to 0.086), they are not shown by the software PRISM, GraphPad Software, (v9). The simple linear regression results obtained by PRISM GraphPad Software, (v9) are shown on the right.
Figure 6
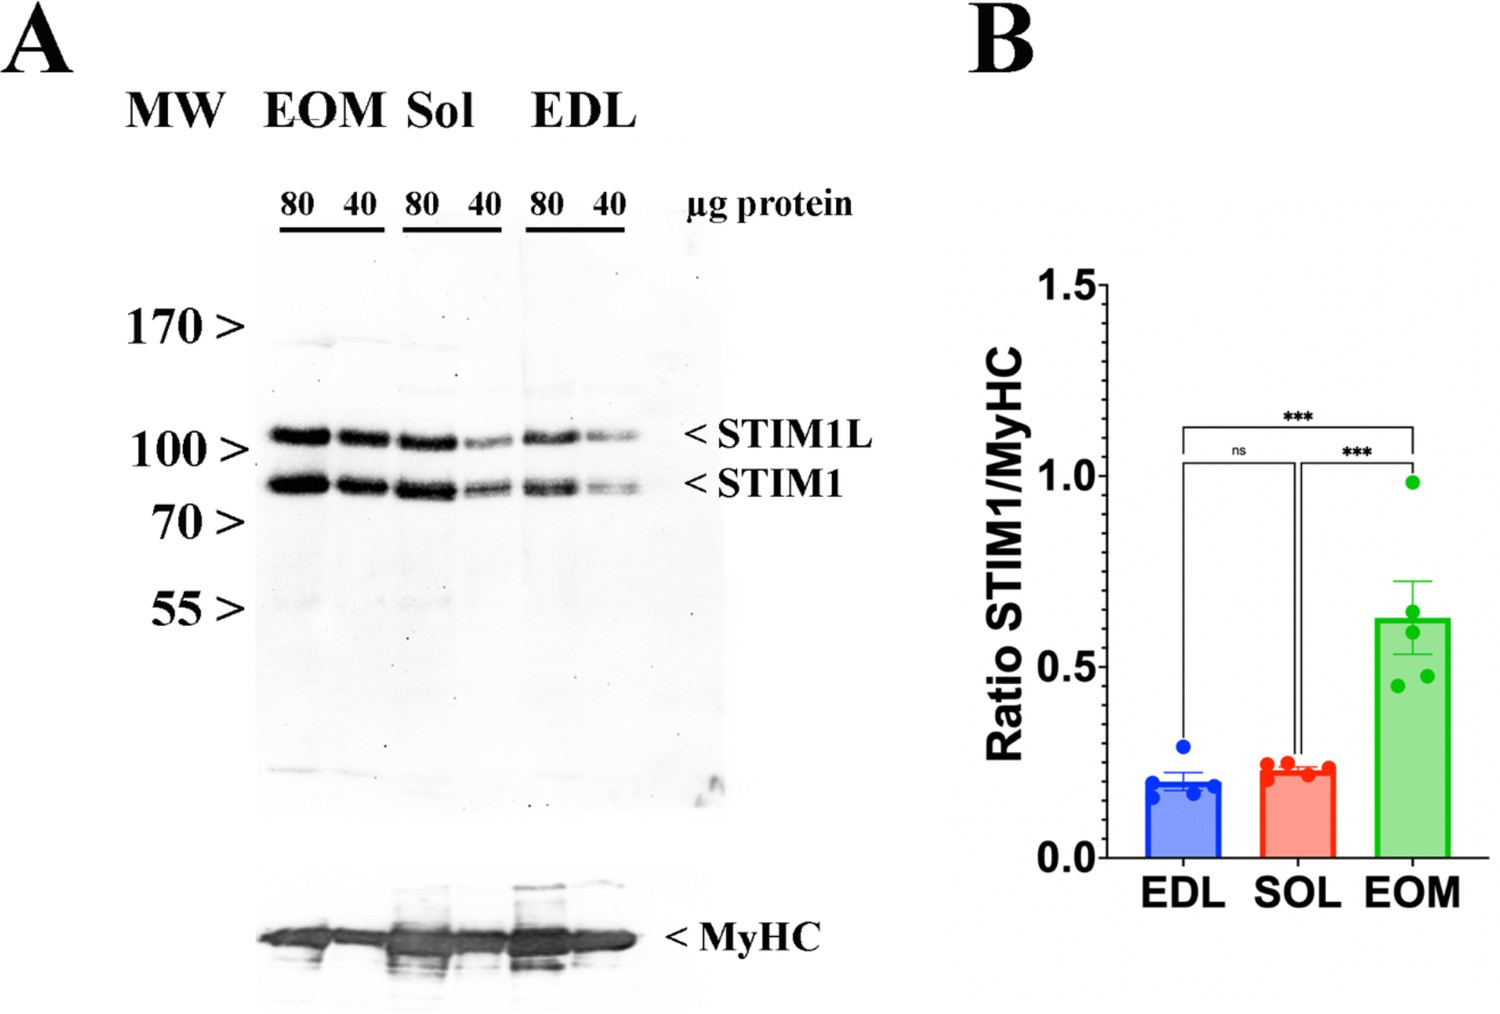
EOMs are enriched in Stim 1.
(A) Representative western blots showing Stim1 and Stim1L immunopositive bands. Forty and eighty micrograms of total homogenates from EOM, soleus, and EDL muscles isolated from WT mice were loaded onto a 7.5% SDS PAGE. Proteins were blotted onto nitrocellulose, probed with an antibody recognizing Stim1 and Stim1L, followed by incubation with an anti-rabbit IgG HRP-linked antibody. Bands were visualized by chemiluminescence. Blots were subsequently stripped and probed with anti-MyHC (all) for loading normalization (bottom panel). (B) Relative content of Stim1 in the three muscle types examined. Each symbol represents the value of a single mouse. *** p<0.001.
-
Figure 6—source data 1
Bots refer to data shown in Figure 6A.
TOP: Original uncropped western blots showing immunoreactivity of STIM1L and STIM1 in EDL, Soleus and EOM muscles from WT mouse N° 5. BOTTOM: same blot re-probed with anti-MyHC recognizing all isoforms (loading normalization).
- https://cdn.elifesciences.org/articles/83618/elife-83618-fig6-data1-v2.zip
-
Figure 6—source data 2
Bots refer to data used for statistical analysis depicted in Figure 6B.
Original uncropped western blots showing immunoreactivity of STIM1L, STIM1 and MyHC in EDL, Soleus and EOM muscles from WT mouse N° 1, 2, 3 (TOP) and WT mouse N° 4 (BOTTOM).
- https://cdn.elifesciences.org/articles/83618/elife-83618-fig6-data2-v2.zip
Author response image 1
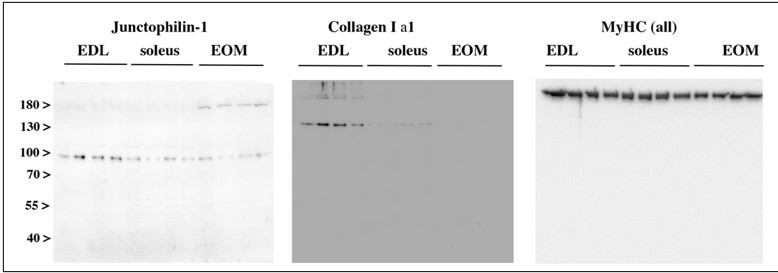
Western blot analysis of muscle homogenates from WT mice probed with anti- junctophilin-1 and anti-Collagen Ia1 antibodies.
Proteins in total muscle homogenates of EDL, soleus and EOM were separated on a 7.5% PAGE-SDS gel, transferred overnight onto nitrocellulose and probed with the following Ab: rabbit anti-Junctophilin-1 (1:2000, a generous gift of Takeshima, Kyoto University, Kyoto, Japan); mouse anti-collagen I alpha1 (1:2000 Novus Biological Catalog N° NBP2-92858); anti-MyHC all isoforms (1:5000; Millipore Catalog N° 41025). Western blots were incubated with the primary antibodies followed by peroxidase conjugated Protein G (Σ-Aldrich, 1:130000) or peroxidase-conjugated anti-mouse IgG (Fab Specific) Ab (Σ-Aldrich; 1:200 000). The immuno-positive bands were visualized by chemiluminescence using the WesternBright ECL HRP Substrate. For junctophilin-1 and Collagen Ia1 blots, 30 µg protein per lane were loaded; for MyHC, 5 µg protein per lane were loaded.
Author response image 2
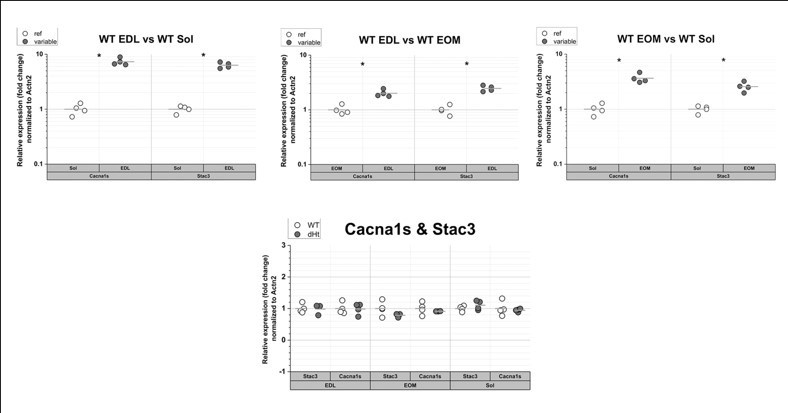
qPCR of Cacna1s and Stac3 in muscles from WT mice.
The expression levels of the transcripts encoding Cacna1s and Stac3 are the highest in EDL muscles and the lowest in soleus muscles (top panels). There are no significant changes in their relative expression levels in dHT vs WT. Each symbol represents the value from of a single mouse. * p=0.028 Mann Whitney test qPCR was performed as described in Elbaz et al., 2019 (Hum Mol Genet 28, 2987-2999).
Author response image 3
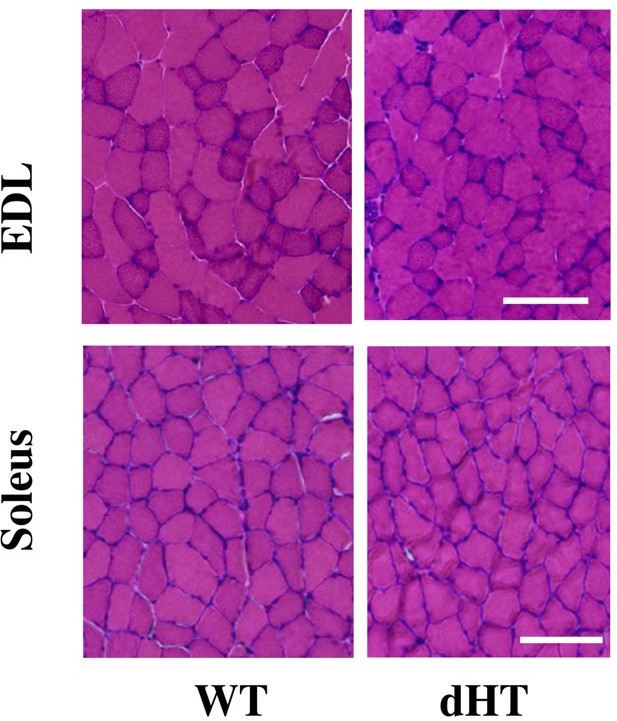
Histological staining of EDL and soleus muscles from EDL and soleus.
Cross sectional area of HandE stained muscle sections from WT and dHT mice. No evidence of inflammation or necrosis is present in muscles from dHT mice. Bar = 100 µm. Muscles were isolated and embedded in OCT and deep-frozen in 2-methylbutane. Transver 10 µm thick muscle sections were made with a Leica Cryostat (CM1950).
Tables
Table 1
Relative change in the content of selected proteins in EDL muscles isolated from WT (baseline) and dHT mice.
| Gene name | Protein* | Relative content | q value | |
|---|---|---|---|---|
| ECC | Ryr1 | Ryanodine receptor 1 (RyR1) | 0.40 | 3.97x10⁻⁵ |
| Jph1 | Junctophillin-1 | 0.64 | 0.025 | |
| Cacna1s | Voltage dependent L type calcium channel subunit a1s (DHPR α1s) | 0.73 | 0.018 | |
| Dhrs7c | Dehydrogenase/reductase SDR family member 7 C (SRP-35) | 1.34 | 0.0045 | |
| Asph | Aspartyl/asparaginyl ß-hydroxylase (junctin/junctate/asp-ß-hydroxylase) | 1.84 | 0.00095 | |
| Contractile proteins | Myh13 | MyHC-EO | 0.35 | 0.0063 |
| Myh1 | Myosin-1 (MyHC-2x) | 0.61 | 0.043 | |
| Myh4 | Myosin-4 (MyHC 2b) | 0.71 | 0.018 | |
| Actn3 | α-actinin 3 | 0.74 | 0.012 | |
| Collagen and ECM proteins | Col2a1 | Collagen (II)α–1 chain | 0.18 | 0.0043 |
| Col1a2 | Collagen (I) α –2 chain | 0.25 | 0.027 | |
| Col11a1 | Collagen (XI) α –1 chain | 0.35 | 0.0047 | |
| Col5a2 | Collagen (V)α –2 chain | 0.37 | 0.00059 | |
| Col5a1 | Collagen (V) aα –1 chain | 0.50 | 0.00156 | |
| Col16a1 | Collagen (XVI) α –1 chain | 0.53 | 0.00154 | |
| Col4a2 | Collagen (IV) α –2 chain | 0.7 | 0.040 | |
| Itgav | Integrin α -V | 0.77 | 0.044 | |
| Itgb1bp2 | Integrin ß–1- binding protein 2 | 1.3 | 0.045 | |
| Heat shock proteins | Hspb3 | Hsp ß–3 | 0.73 | 0.00376 |
| Hspb8 | Hsp ß–8 (a-crystallin C chain) | 0.75 | 0.0160 | |
| Hspa2 | Heat shock related 70 kDa protein (Hsp70-2) | 0.77 | 0.026 | |
| Hspd1 | 60 kDa Hsp, mitochondrial (Chaperonin 60) | 1.30 | 0.011 | |
| Hspa5 | Heat Shock Protein Family A (Hsp70) Member 5 (BiP) | 1.41 | 0.00928 | |
| Hsph1 | Hsp 105 kDa (Hsp105, Hsp110) | 1.47 | 0.0155 | |
| Hspb6 | Hsp ß–6 (HspB6) | 1.5 | 0.0259 | |
| Hspbp1 | Hsp 70-binding protein | 1.8 | 0.022 | |
| Ribosomal proteins | Rpl23 | 60 S Ribosomal protein L23 | 0.433 | 0.023 |
| Mrpl1 | 39 S ribosomal protein L1, mitochondrial | 0.526 | 0.004 | |
| Mrpl46 | 39 S ribosomal protein L46, mitochondrial | 0.592 | 0.011 | |
| Rpl34 | 60 S ribosomal protein L34 | 0.659 | 0.0042 | |
| Rps15a | 40 S ribosomal protein S15a | 0.659 | 0.0056 | |
| Mrpl43 | 39 S ribosomal protein L43, mitochondrial | 0.684 | 0.029 | |
| Mrps5 | 28 S ribosomal protein S5, mitochondrial | 0.74 | 0.0021 | |
| Rpl11 | 60 S ribosomal protein L11 | 1.265 | 0.013 | |
| Rpl6 | 60 S ribosomal protein L6 | 1.273 | 0.012 | |
| Rpl35 | 60 S ribosomal protein L35 | 1.290 | 0.034 | |
| Mrpl19 | 39 S ribosomal protein L19, mitochondrial | 1.346 | 0.028 | |
| Rps25 | 40 S ribosomal protein S25 | 1.35 | 0.0076 | |
| Rpl27a | 60 S ribosomal protein L27a | 1.365 | 0.02 | |
| Rpl27 | 60 S ribosomal protein L27 | 1.374 | 0.016 | |
| Rpl9 | 60 S ribosomal protein L9 | 1.374 | 0.015 | |
| Rps2 | 40 S ribosomal protein S2 | 1.39 | 0.0065 | |
| Rps8 | 40 S ribosomal protein S8 | 1.39 | 0.013 | |
| Rplp2 | 60 S acidic ribosomal protein P2 | 1.403 | 0.0087 | |
| Rps10 | 40 S ribosomal protein S10 | 1.41 | 0.033 | |
| Rpl38 | 60 S ribosomal protein L38 | 1.431 | 0.025 | |
| Rpl23a | 60 S ribosomal protein L23a | 1.459 | 0.005 | |
| Rps12 | 40 S ribosomal protein S12 | 1.473 | 0.0128 | |
| Rps9 | 40 S ribosomal protein S9 | 1.50 | 0.0278 | |
| Rpl18 | 60 S ribosomal protein L18 | 1.491 | 0.017 | |
| Mrps7 | 28 S ribosomal protein S7, mitochondrial | 1.567 | 0.010 | |
| Rpl10a | 60 S ribosomal protein L10a | 1.591 | 0.017 | |
| Rpl22 | 60 S ribosomal protein L22 | 1.651 | 0.017 | |
| Rps17 | 40 S ribosomal protein S17 | 1.661 | 0.0016 | |
| Rps16 | 40 S ribosomal protein S16 | 1.82 | 0.0020 | |
| FK506 binding proteins | Fkbp1a | Peptidyl-prolyl cis-trans isomerase FKBP1A (FKBP12; calstabin-1) | 0.64 | 0.0025 |
| Fkbp8 | Peptidyl-prolyl cis-trans isomerase FKBP8 (38 kDa FKBP) | 1.30 | 0.024 | |
| Fkbp9 | Peptidyl-prolyl cis-trans isomerase FKBP9 (63 kDa FK506-binding protein) | 1.60 | 0.0057 | |
| Calcium-dependent protein kinases | Camk1 | Calcium/Calmodulin-dependent protein kinase type 1 (CaM kinase I) | 1.32 | 0.022 |
| Camk2a | Calcium/calmodulin-dependent protein kinase type II subunit α | 1.40 | 0.0189 | |
| Camk2b | Calcium/calmodulin-dependent protein kinase type II subunit ß | 1.46 | 0.010 | |
| Camk2d | Calcium/calmodulin-dependent protein kinase type II subunit δ | 2.24 | 0.00025 | |
| Varia | Psmd7 | 26 S proteasome non-ATPase regulatory subunit 7 | 0.58 | 0.0016 |
| Psmg2 | Proteasome assembly chaperone 2 | 1.66 | 0.038 | |
| Fth1 | Ferritin | 1.69 | 0.0033 |
-
*
The nomenclature of Proteins is based on that of the UniProtKB database.
Table 2
Relative change in the content of selected proteins in soleus muscles isolated from WT (baseline) and dHT mice.
| Gene name | Protein* | Relative content | q value | |
|---|---|---|---|---|
| ECC | Ryr1 | Ryanodine receptor 1 (RyR1) | 0.66 | 0.0080 |
| Jph1 | Junctophillin 1 | 0.73 | 0.026 | |
| Cacna1s | Voltage-dependent L type calcium channel subunit α1s (DHPR α1s) | 0.67 | 0.017 | |
| Trdn | Triadin | 0.69 | 0.0352 | |
| Asph | Aspartyl/asparaginyl ß-hydroxylase (junctin/junctate/aspß-hydroxylase) | 1.31 | 0.045 | |
| ATP2a2 | Sarcoplasmic/endoplasmic reticulum calcium ATPase 2 (SERCA2) | 1.65 | 0.0256 | |
| Contractile proteins | Tnnt3 | Troponin 3 (fast skeletal muscle type) | 0.69 | 0.017 |
| Calcium binding proteins | S100a1 | Protein S100 A1 | 1.69 | 0.033 |
| Camk2d | Calcium/calmodulin-dependent protein kinase type II subunit δ | 1.23 | 0.033 | |
| Camk2g | Calcium/calmodulin-dependent protein kinase type II subunitγ | 1.43 | 0.039 | |
| Ion Pumps | Atp1b1 | Na+/K+ATPase ß1 | 0.77 | 0.047 |
| Atp1a1 | Na+/K+ATPase α 1 | 1.41 | 0.017 | |
| Collagen and ECM proteins | Col11a1 | Collagen (XI) α –1 chain | 1.63 | 0.031 |
| Itgb5 | Integrin a V/ß–5 | 11.95 | 0.044 | |
| Ribosomal proteins | Rpl36a | 60 S ribosomal protein L36a | 0.263 | 0.0021 |
| Mrpl10 | 39 S ribosomal protein L10, mitochondrial | 0.577 | 0.040 | |
| Rpl8 | 60 S ribosomal protein L8 | 0.661 | 0.022 | |
| Rpl26 | 60 S ribosomal protein L26 | 0.695 | 0.022 | |
| Mrpl42 | 39 S ribosomal protein L42, mitochondrial | 0.788 | 0.026 | |
| Rpl30 | 60 S ribosomal protein L30 | 1.259 | 0.020 | |
| Rpl19 | 60 S ribosomal protein L19 | 1.260 | 0.050 | |
| Mrpl41 | 39 S ribosomal protein L41, mitochondrial | 1.289 | 0.033 | |
| Rpl11 | 60 S ribosomal protein L11 | 1.325 | 0.026 | |
| Rpl10 | 60 S ribosomal protein L10 | 1.432 | 0.013 | |
| Rpl22 | 60 S ribosomal protein L22 | 1.436 | 0.017 | |
| Rplp2 | 60 S acidic ribosomal protein P2 | 1.473 | 0.022 | |
| Rpl35 | 60 S ribosomal protein L35 | 1.533 | 0.040 | |
| Rpl23a | 60 S ribosomal protein L23a | 1.612 | 0.014 | |
| Rpl23 | 60 S ribosomal protein L23 | 1.638 | 0.022 | |
| Varia | Psmg1 | Proteasome Assembly Chaperone 1 | 0.488 | 0.024 |
| Dnajb6 | DnaJ homolog subfamily B member 6 (Hsp J-2) | 1.45 | 0.033 | |
| Psma2 | Proteasome 20 S Subunit α 2 | 1.51 | 0.011 |
-
*
The nomenclature of Proteins is based on that of the UniProtKB database.
Table 3
Relative change in the content of selected proteins in EOM isolated from WT and dHT mice.
| Gene name | Protein* | Relative content | q value | |
|---|---|---|---|---|
| ECC | Ryr1 | Ryanodine receptor 1 (RyR1) | 0.42 | 1.73x10⁻⁶ |
| Asph | Aspartyl/asparaginyl ß-hydroxylase (junctin/junctate/aspß-hydroxylase) | 1.35 | 0.00028 | |
| Casq2 | Calsequestrin-2 | 1.45 | 0.00031 | |
| Casq1 | Calsequestrin-1 | 1.55 | 0.0063 | |
| ATP2a2 | Sarcoplasmic/endoplasmic reticulum calcium ATPase 2 (SERCA2) | 1.55 | 0.00052 | |
| Contractile proteins | Myh13 | MyHC-EO | 0.27 | 1.01x10⁻⁵ |
| Actn2 | α -actinin 2 | 1.36 | 0.0047 | |
| Myh7b | Myosin-7B (MyH7B, cardiac musle ß isoform, MyHC14) | 1.44 | 0.0038 | |
| Actn1 | α -actinin 1 | 1.45 | 0.015 | |
| Tnnt2 | Troponin T, cardiac isoform | 1.45 | 0.0037 | |
| Myot | Myotilin | 1.61 | 0.0018 | |
| Tnnt1 | Troponin T slow, skeletal muscle (TnTs) | 1.85 | 0.022 | |
| Myoz3 | Myozenin 3 | 2.03 | 1.29x10⁻⁵ | |
| Myh6 | Myosin 6 (MyHC cardiac muscle α-isoform) | 2.22 | 1.01x10⁻⁵ | |
| Tnnc1 | Troponin C, slow skeletal and cardiac (TN-C) | 2.61 | 8.1x10⁻⁵ | |
| Collagen and ECM proteins | Itga7 | Integrin α 7 | 1.29 | 0.000191 |
| Col6a5 | Collagen (VI) α –5 chain | 1.32 | 0.0033 | |
| Col6a6 | Collagen (VI) α –6 chain | 1.32 | 0.0087 | |
| Col12a1 | Collagen (XII) α –1 chain | 1.34 | 0.012 | |
| Col14a1 | Collagen (XIV) α –1 chain | 1.61 | 0.00072 | |
| Col11a2 | Collagen (XI) α –2 chain | 4.46 | 1.27x10⁻⁵ | |
| Heat shock proteins | Hspa9 | Mitochondrial, stress-70 protein | 0.78 | 0.013 |
| Hsp90b1 | Hsp 90b1 (GRP-94; 90 kDa glucose regulated protein) | 1.26 | 0.0052 | |
| Hspb3 | Hsp ß- 3 | 1.27 | 0.0056 | |
| Dnaja1 | Dnaj homolog subfamily A member 1 (Hsp 40 kDa protein 4) | 1.28 | 0.0067 | |
| Hspb1 | Hsp ß–1 (Hsp25) | 1.29 | 0.00029 | |
| Hspa5 | Heat Shock Protein Family A (Hsp70) Member 5 (BiP) | 1.32 | 0.00033 | |
| Hspa1a | Heat shock 70 kDa protein 1 A | 1.33 | 0.0069 | |
| Hsp90aa1 | Hsp 90 a | 1.40 | 0.00094 | |
| Dnajb1 | Dnaj homolog subfamily B member 1 (Hsp40) | 1.46 | 0.00021 | |
| Dnajb4 | DnaJ homolog subfamily B member 4 (Hsp40) | 1.54 | 0.011 | |
| Hspb6 | Hsp ß- 6 | 1.61 | 4.05x10⁻⁵ | |
| Ribosomal Proteins | Rps2 | 40 S ribosomal protein S2 | 1.260 | 0.004 |
| Rpsa | 40 S ribosomal protein SA | 1.276 | 0.0035 | |
| Rps11 | 40 S ribosomal protein S11 | 1.321 | 0.0016 | |
| Rps20 | 40 S ribosomal protein S20 | 1.324 | 0.0007 | |
| Rpl10 | 60 S ribosomal protein L10 | 1.332 | 0.0035 | |
| Rplp2 | 60 S acidic ribosomal protein P2 | 1.332 | 0.00048 | |
| Rpl11 | 60 S ribosomal protein L11 | 1.335 | 0.0077 | |
| Rps28 | 40 S ribosomal protein S28 | 1.346 | 0.0041 | |
| Rpl3 | 60 S ribosomal protein L13 | 1.385 | 1.42x10⁻⁵ | |
| Rps7 | 40 S ribosomal protein S7 | 1.396 | 0.0125 | |
| Rpl27a | 60 S ribosomal protein L27a | 1.461 | 0.00034 | |
| Rps27a | 40 S ribosomal protein S27a | 1.570 | 0.038 | |
| FK506 binding proteins | Fkbp1a | Peptidyl-prolyl cis-trans isomerase FKBP1A (FKBP12; calstabin-1) | 0.79 | 0.015 |
| Calcium-dependent protein kinases | Camk2b | Calcium/Calmodulin-Dependent Protein Kinase IIß | 1.30 | 0.0018 |
| Camk2d | Calcium/Calmodulin-Dependent Protein Kinase IIδ | 2.32 | 8.35x10⁻⁶ | |
| Calcium binding proteins | S100a16 | S100 A16 | 1.29 | 0.014 |
| S100a1 | S100 A1 | 1.30 | 0.029 |
-
*
The nomenclature of Proteins is based on that of the UniProtKB database.
Table 4
Concentration µmol/Kg (mean ± SD) of proteins involved in ECC in EDL, soleus and EOM muscles from WT (n=5 mice) and dHT (n=5 mice) using the peptide 4 point calibration curve.
| Gene name | EDL | soleus | EOM | |||
|---|---|---|---|---|---|---|
| WT | dHT | WT | dHT | WT | dHT | |
| Ryr1 monomers (terameric channel) | 1.29±0.07 (0.32) | 0.86±0.01 (0.21) | 0.49±0.02 (0.12) | 0.40±0.002 (0.10) | 0.59±0.02 (0.15) | 0.35±0.01 (0.09) |
| Cacna1s | 0.56±0.03 | 0.49±0.01 | 0.18±0.01 | 0.16±0.002 | 0.21±0.01 | 0.19±0.004 |
| Stac3 | 0.62±0.07 | 0.53±0.06 | 0.22±0.02 | 0.20±0.01 | 0.17±0.01 | 0.15±0.01 |
| Jsrp1 | 0.42±0.03 | 0.40±0.01 | 0.32±0.01 | 0.29±0.03 | 0.35±0.01 | 0.35±0.02 |
| Asph | 0.21±0.01 | 0.26±0.01 | 0.30±0.02 | 0.35±0.03 | 0.82±0.03 | 1.00±0.03 |
| Trdn | 0.96±0.18 | 0.79±0.06 | 0.16±0.03 | 0.13±0.01 | 0.23±0.01 | 0.22±0.01 |
| Jph1 | 0.71±0.09 | 0.58±0.04 | 0.29±0.02 | 0.25±0.01 | 0.24±0.01 | 0.23±0.01 |
| Stim1 | 0.46±0.02 | 0.48±0.03 | 0.55±0.03 | 0.56±0.03 | 1.35±0.03 | 1.42±0.09 |
| Orai1 monomers (6-subunt complex) | 0.11±0.01 (0.02) | 0.13±0.02 (0.02) | Not detected | Not detected | 0.16±0.03 (0.03) | 0.17±0.01 (0.03) |
Table 5
Calculated ratio values.
| Gene name | EDL | soleus | EOM | |||
|---|---|---|---|---|---|---|
| WT | dHT | WT | dHT | WT | dHT | |
| Ryr1 complex/Cacna1s | 0.571 | 0.429 | 0.667 | 0.625 | 0.714 | 0.474 |
| Stac3/Cacna1s | 1.11 | 1.08 | 1.22 | 1.25 | 1.67 | 1.84 |
| Jsrp1/Cacna1s | 0.75 | 0.82 | 1.78 | 1.81 | 0.95 | 1.00 |
| Stim1/Orai1 complex | 23.0 | 24.0 | - | - | 45.0 | 47.3 |
Additional files
-
Supplementary file 1
Tables of relative changes in protein content between soleus and EDL, EDL and EOM and soleus and EOM muscles iin WT mice.
(a) Table showing relative change in protein content between soleus and EDL muscles isolated from WT mice. (b) Table showing relative change in protein content between EOM and EDL muscles isolated from WT mice. (c) Table showing relative change in protein content between EOM and soleus muscles isolated from WT mice.
- https://cdn.elifesciences.org/articles/83618/elife-83618-supp1-v2.docx
-
MDAR checklist
- https://cdn.elifesciences.org/articles/83618/elife-83618-mdarchecklist1-v2.pdf
Download links
A two-part list of links to download the article, or parts of the article, in various formats.
Downloads (link to download the article as PDF)
Open citations (links to open the citations from this article in various online reference manager services)
Cite this article (links to download the citations from this article in formats compatible with various reference manager tools)
Quantitative proteomic analysis of skeletal muscles from wild-type and transgenic mice carrying recessive Ryr1 mutations linked to congenital myopathies
eLife 12:e83618.
https://doi.org/10.7554/eLife.83618


