Using multi-modal neuroimaging to characterise social brain specialisation in infants
- Centre for Brain and Cognitive Development, Birkbeck, University of London, United Kingdom
- Department of Development and Social Psychology, University of Padova, Italy
- Department of Information Engineering, University of Padova, Italy
- Department of Psychology, University of Cambridge, United Kingdom
- Department of Medical Physics and Biomedical Engineering, University College London, United Kingdom
Figures
Figure 1
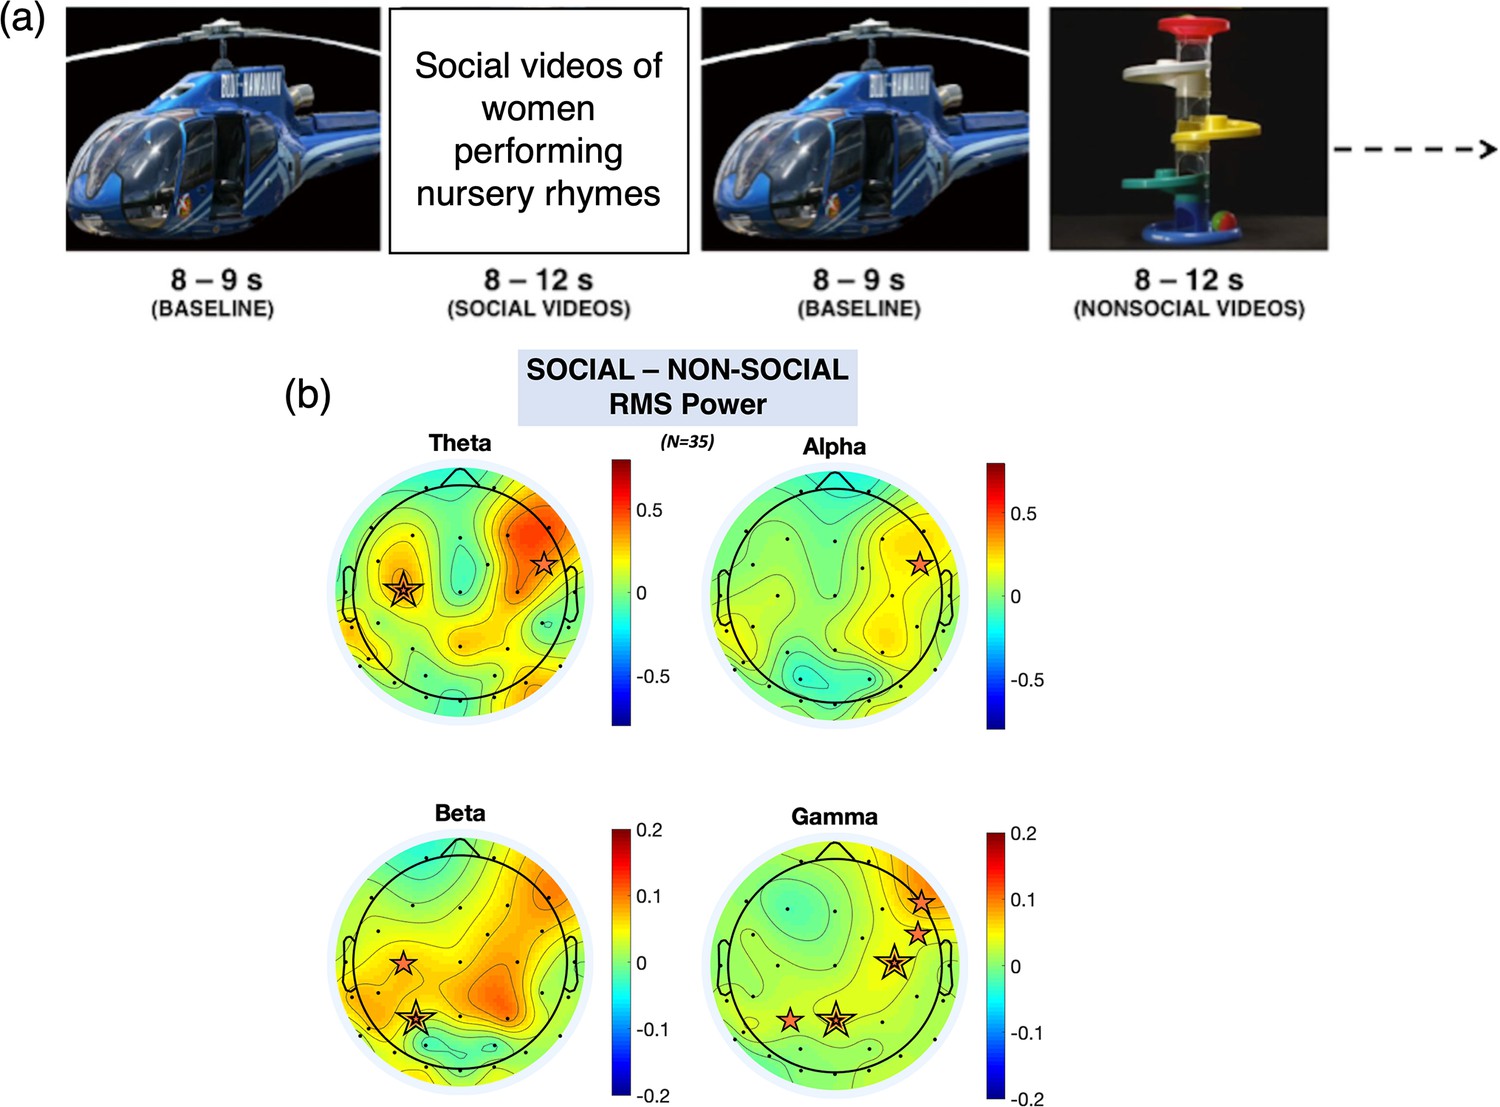
Order of stimulus presentation and EEG scalp topography.
(a) Illustration of the paradigm. (b) Scalp topographies of the grand average root mean square (RMS) power for theta, alpha, beta, and gamma frequency bands (averaged across participants, averaged across the stimulus period) for the social minus non-social condition.
The orange stars indicate statistically significant electroencephalography (EEG) electrodes where an increase in activity was observed (e.g. increase in response to the social condition compared to the non-social condition); a double line indicates significance after false discovery rate (FDR) correction.
Figure 2
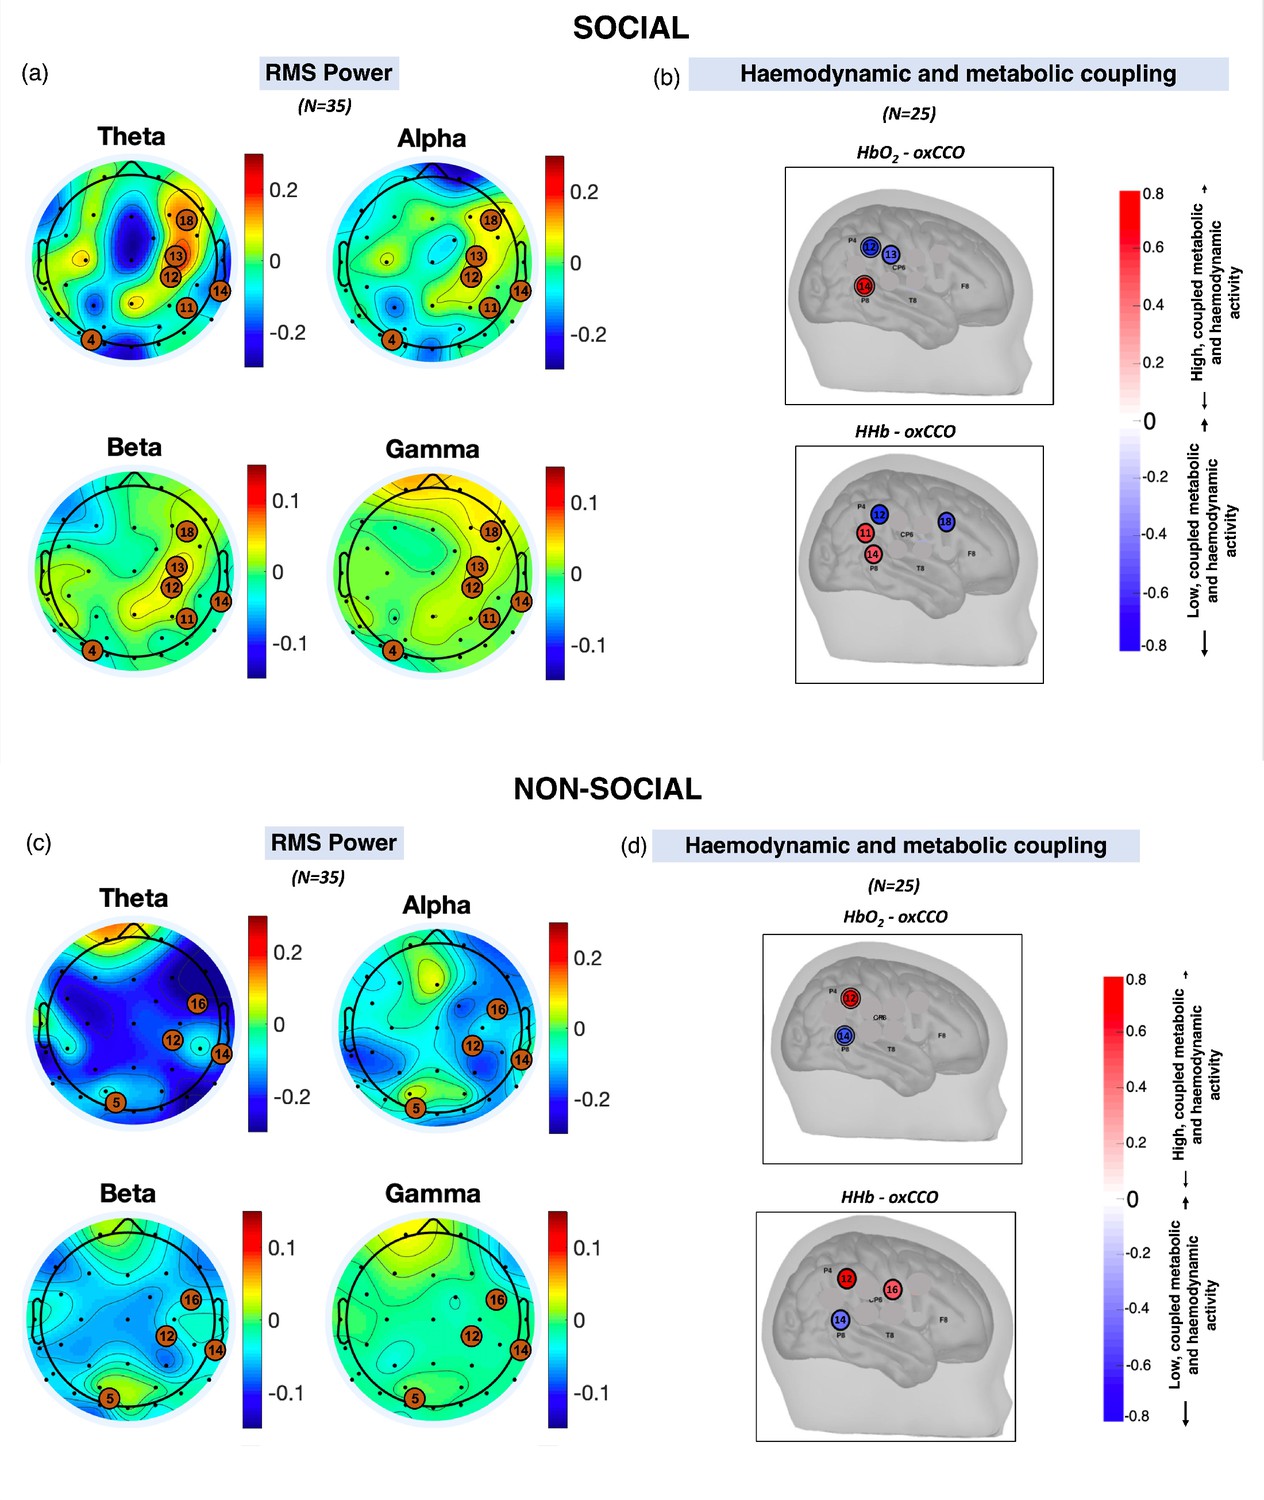
Scalp topographies of the grand average root mean square (RMS) power for theta, alpha, beta, and gamma frequency bands averaged across participants, averaged across the stimulus period for (a) social and (c) non-social conditions.
The black dots show the locations of the electroencephalography (EEG) electrodes while the orange circles represent the broadband near-infrared spectroscopy (bNIRS) channels. Locations of high haemodynamic and metabolic coupling for (b) social and (d) non-social condition. (b and d) are reproduced from Figure 7 in Siddiqui et al., 2021.
Figure 3 with 2 supplements
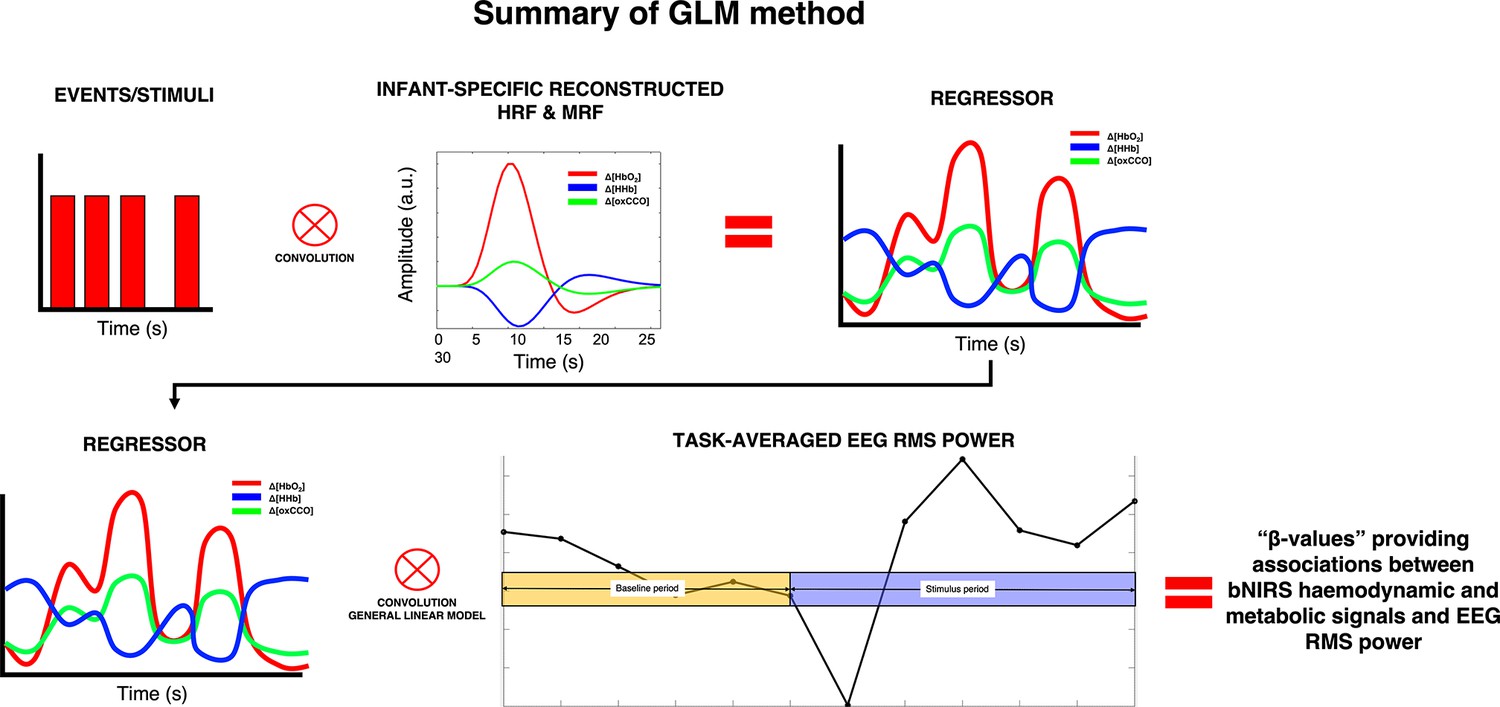
Summary of the procedure for obtaining the associations between broadband near-infrared spectroscopy (bNIRS) signals and electroencephalography (EEG) root mean square (RMS) power at each bNIRS combination, for each frequency band.
Figure 3—figure supplement 1
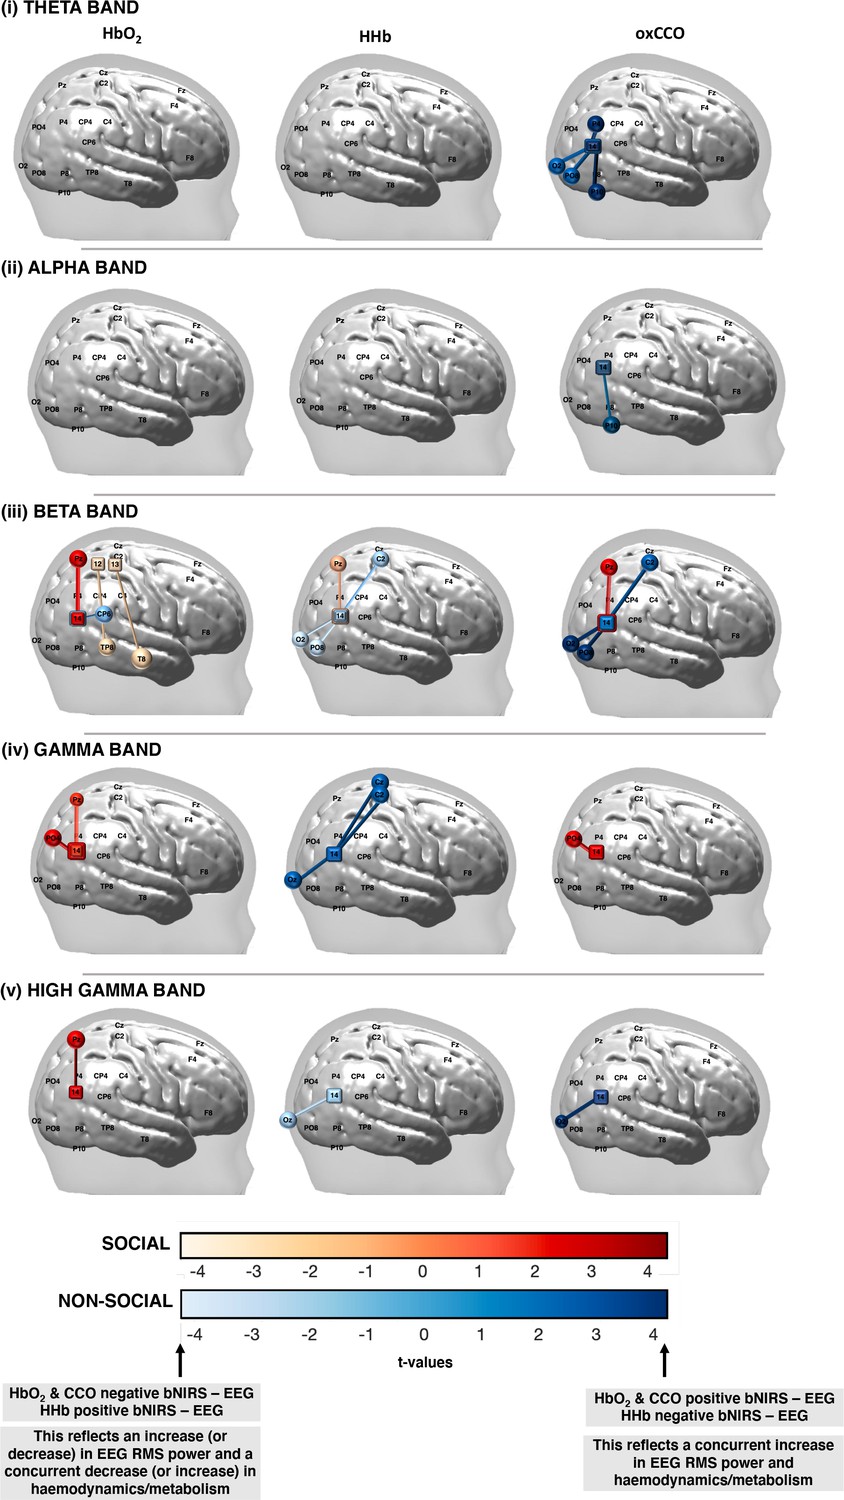
False discovery rate (FDR)-corrected significant connections between broadband near-infrared spectroscopy (bNIRS) channels (squares) and electroencephalography (EEG) electrodes (circles) for the (i) theta, (ii) alpha, (iii) beta, (iv) gamma, and (v) high gamma bands for the social condition (red colour bar) and the non-social condition (blue colour bar) for HbO2, HHb, and oxCCO.
Figure 3—figure supplement 2
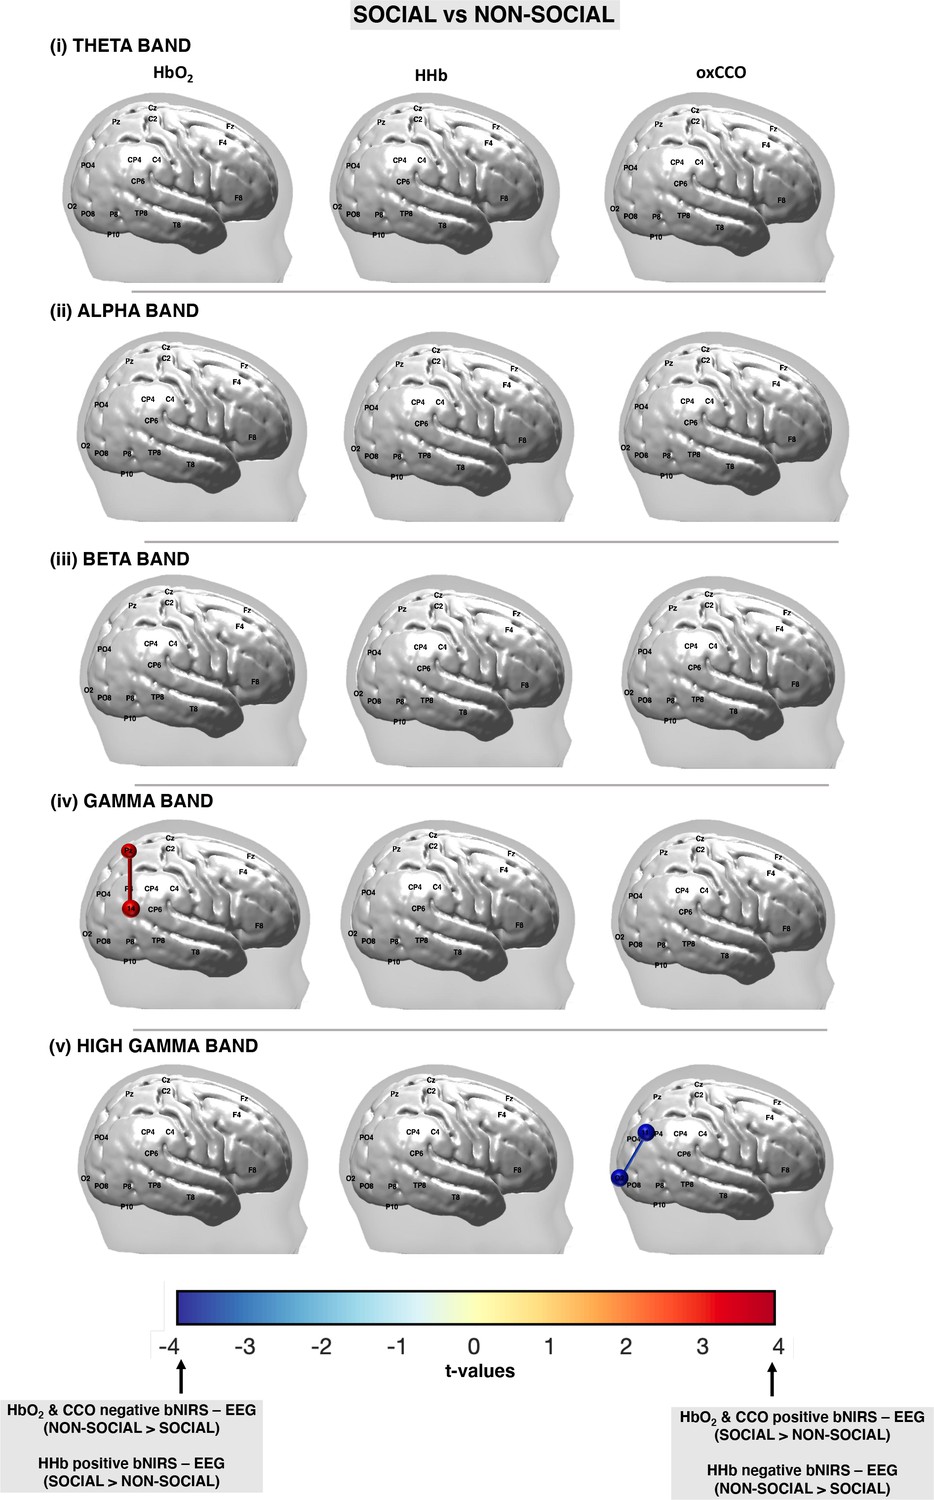
False discovery rate (FDR)-corrected significant connections between broadband near-infrared spectroscopy (bNIRS) channels and electroencephalography (EEG) electrodes for the (i) theta, (ii) alpha, (iii) beta, (iv) gamma, and (v) high gamma bands for the social condition versus the non-social condition for HbO2, HHb, and oxCCO.
The colour bar represents the t-values from the general linear model (GLM) analysis with a positive t-value representing a significant, positive connection between the broadband near-infrared spectroscopy (bNIRS) channel and EEG electrode while a negative t-value represents a negative connection.
Figure 4
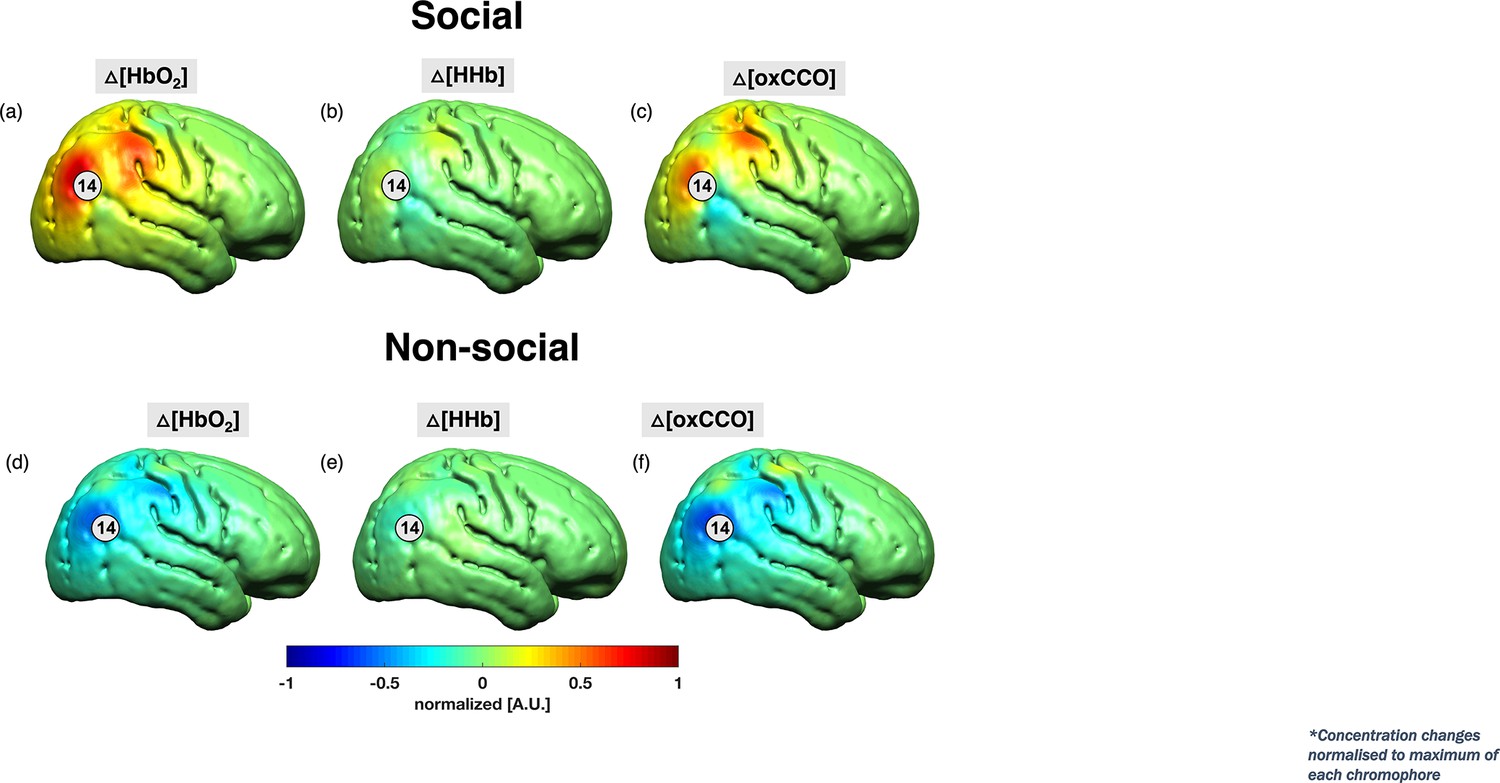
Grand average image reconstruction at 18 s post-stimulus onset for the social condition (a–c) and the non-social condition (d–f) at a single time point of 18 s post-stimulus onset.
The concentration changes for HbO2 and HHb were normalised to the maximum concentration change of HbO2 while ΔoxCCO was normalised to its own maximum change in concentration. Channel 14 has been indicated.
Figure 5
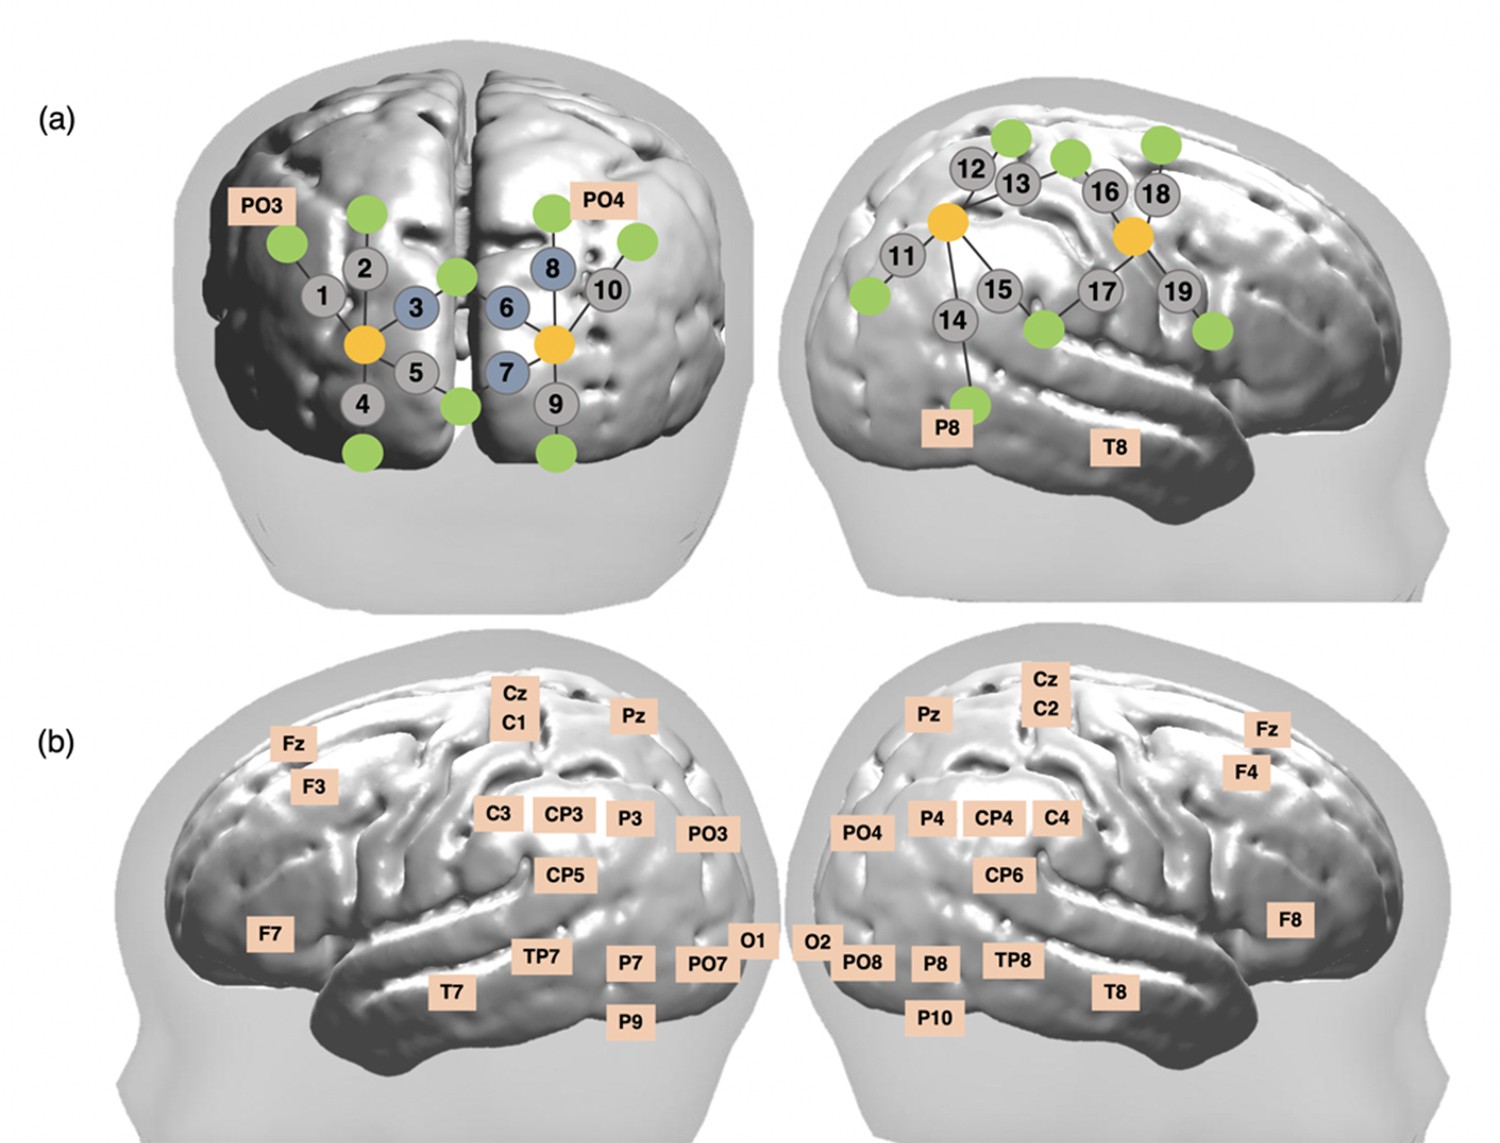
Schematic representation of broadband near-infrared spectroscopy (bNIRS) and electroencephalography (EEG) channel locations.
(a) Locations of bNIRS channels (grey circles) over the occipital cortex and the right hemisphere and locations of the bNIRS sources (orange circles) and detectors (green circles) relative to EEG 10/20 locations. Channels shown in blue (3, 6, 8, and 10) were excluded from the analysis (b) Locations of the 32 EEG electrodes.
Figure 6 with 2 supplements
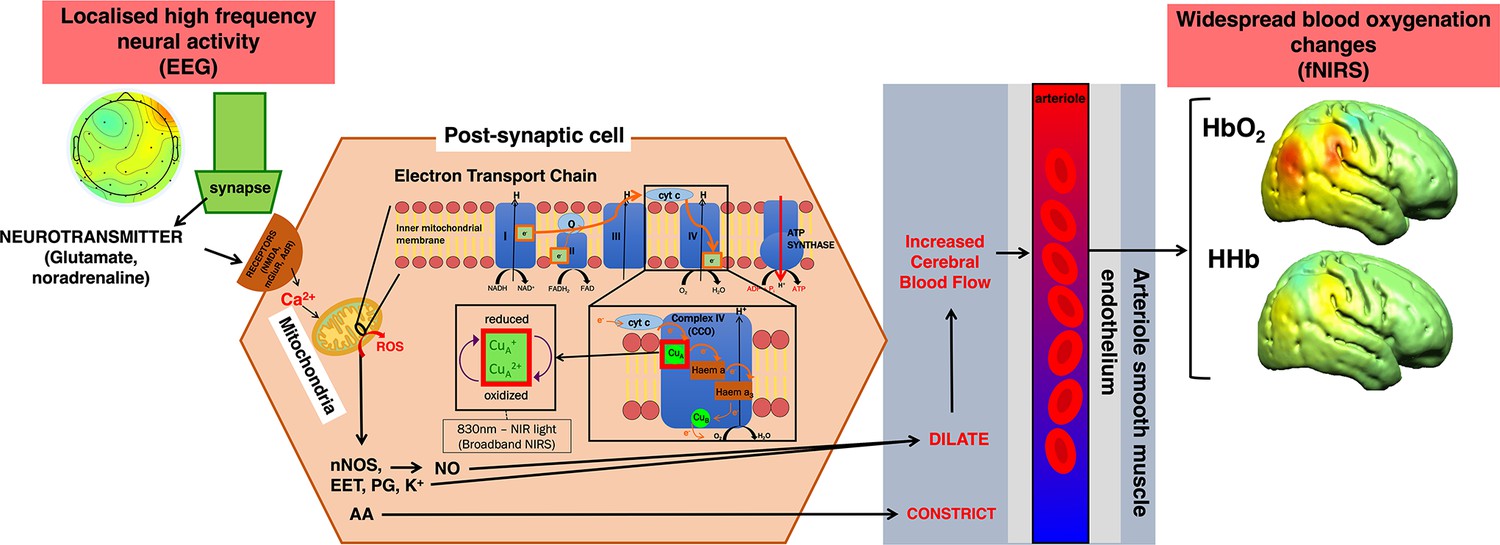
Simplified summary of the signalling pathways that mediate neurovascular coupling.
High-frequency neural activity causes the release of neurotransmitters such as glutamate and noradrenaline which bind to either N-methyl-D-aspartate (NMDA) receptors in interneurons or metabotropic glutamate receptors (mGluR) or adrenaline receptors in astrocytes. In both cases, this causes an influx of calcium (Ca2+) which in turn leads to an increase in adenosine triphosphate (ATP) production through the mitochondrial electron transport chain (ETC). As a by-product, in interneurons, nitric oxide (NO) is produced in the interneurons which dilates arterioles to increase blood flow leading to increased oxygen delivery in surrounding brain regions. Alternatively, in astrocytes derivates of arachidonic acid (AA) include prostaglandins (PG) and epoxyeicosatrienoic acids (EET) which cause vasodilation. This figure has been adapted from Harris et al., 2011.
Figure 6—figure supplement 1
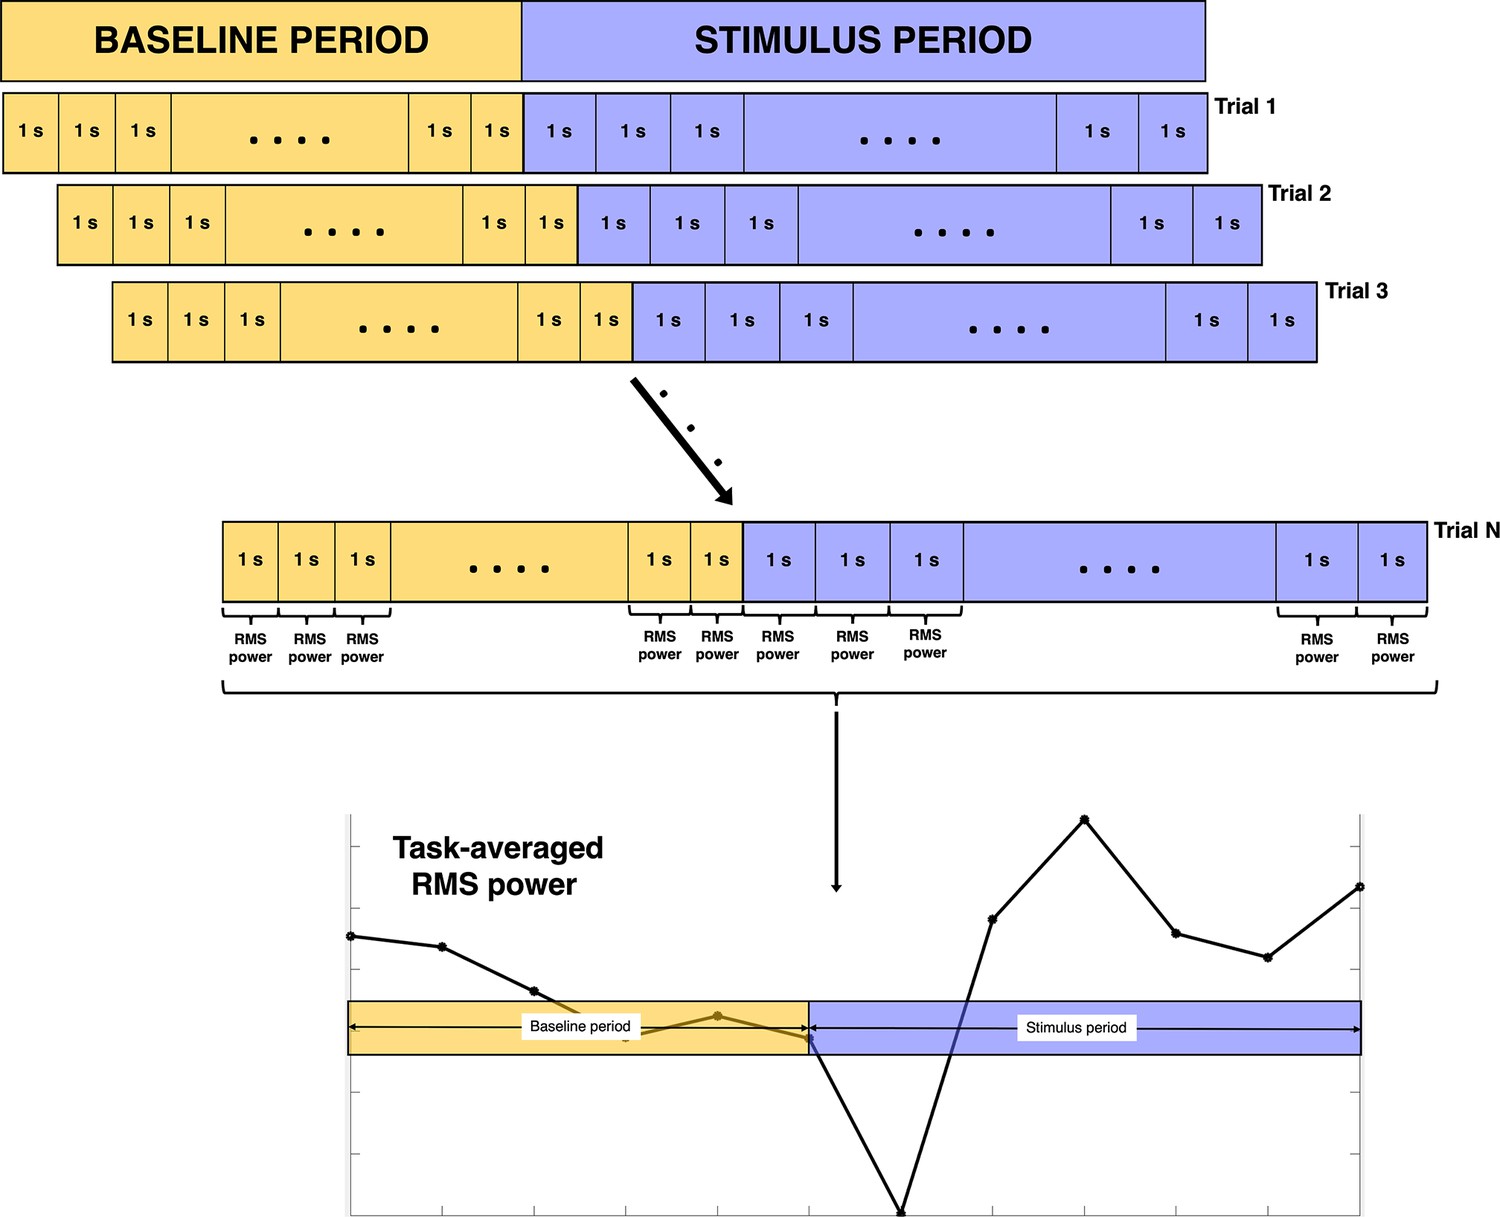
Procedure for deriving the electroencephalography (EEG) root mean square (RMS) power from the pre-processed EEG data.
Each 1 s segment is made up of 200 ms of the previous segment and 800 ms of the current segment. The task-averaged RMS power shown here is average theta power across all infants from a single channel for the purposes of outlining the procedure.
Figure 6—figure supplement 2
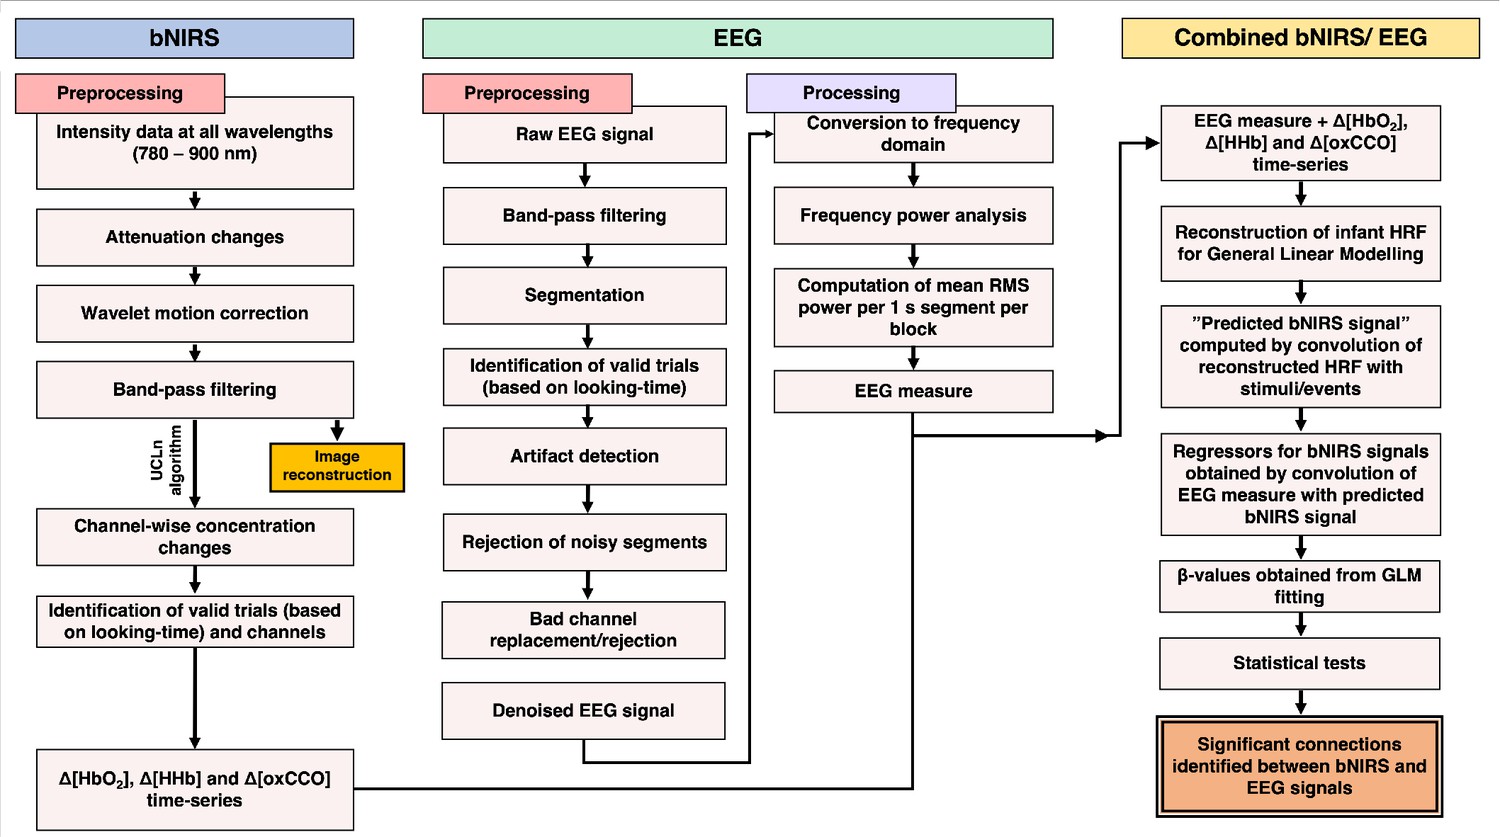
Flowchart for the data analysis pipelines for broadband near-infrared spectroscopy (bNIRS) (left), electroencephalography (EEG) (middle), and combined bNIRS-EEG (right).
Figure 7
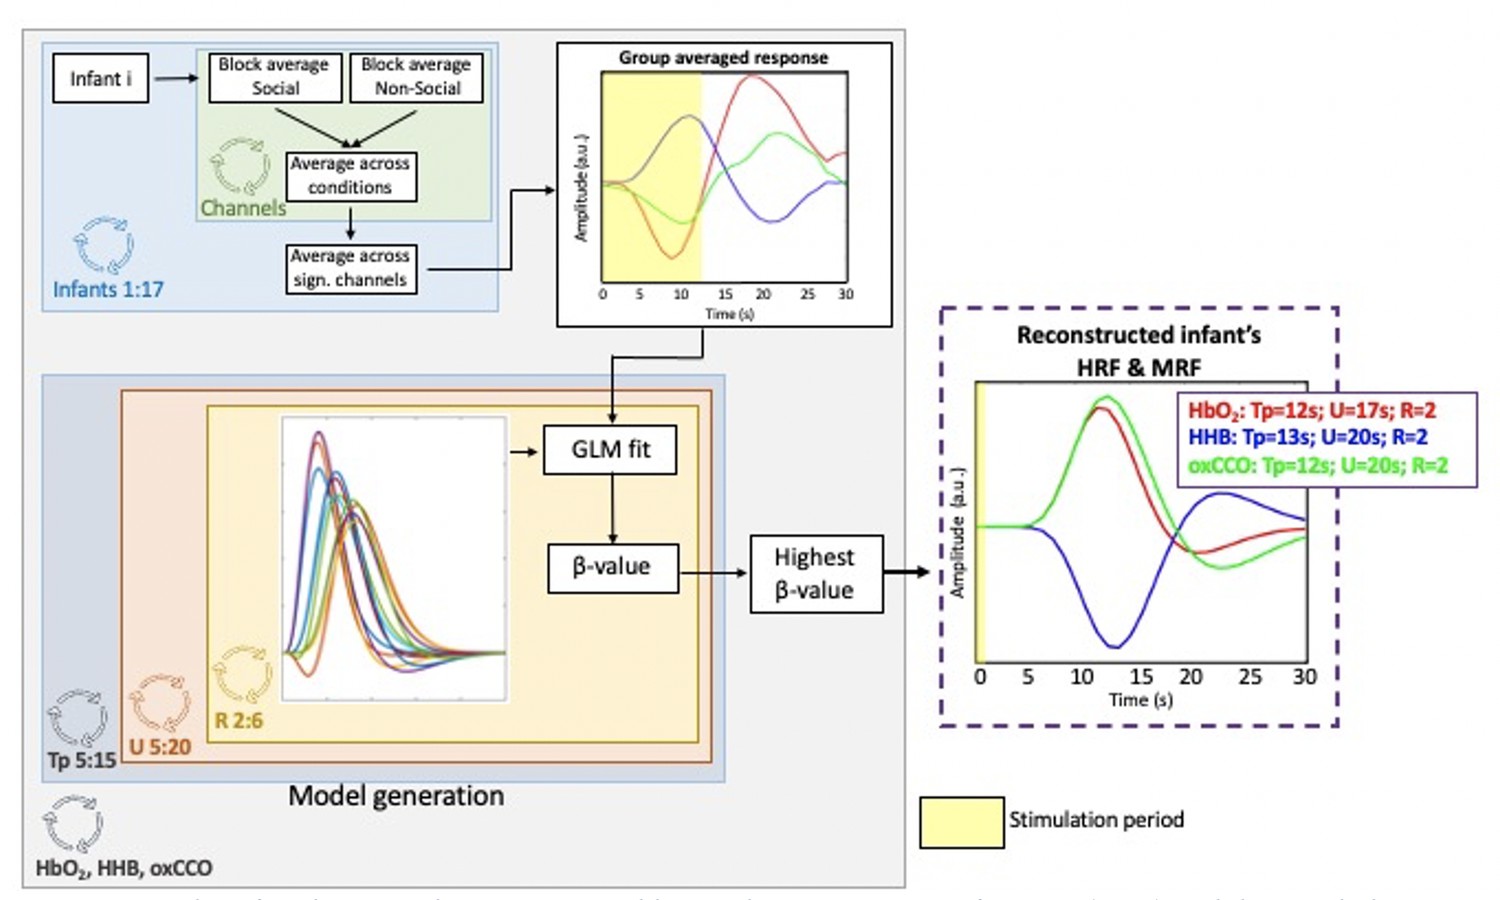
Procedure for obtaining the reconstructed haemodynamic response function (HRF) and the metabolic response function (MRF).
The panel on the right shows the estimated HRF and MRF with the corresponding basis function parameters giving the best fit with the group-averaged HbO2, HHb, oxCCO responses. The yellow shaded areas represent the stimulation periods.
Additional files
Download links
A two-part list of links to download the article, or parts of the article, in various formats.
Downloads (link to download the article as PDF)
Open citations (links to open the citations from this article in various online reference manager services)
Cite this article (links to download the citations from this article in formats compatible with various reference manager tools)
Using multi-modal neuroimaging to characterise social brain specialisation in infants
eLife 12:e84122.
https://doi.org/10.7554/eLife.84122


