Coalescent RNA-localizing and transcriptional activities of SAM68 modulate adhesion and subendothelial basement membrane assembly
- Université Côte d'Azur, CNRS, INSERM, iBV, France
Figures
Figure 1 with 2 supplements
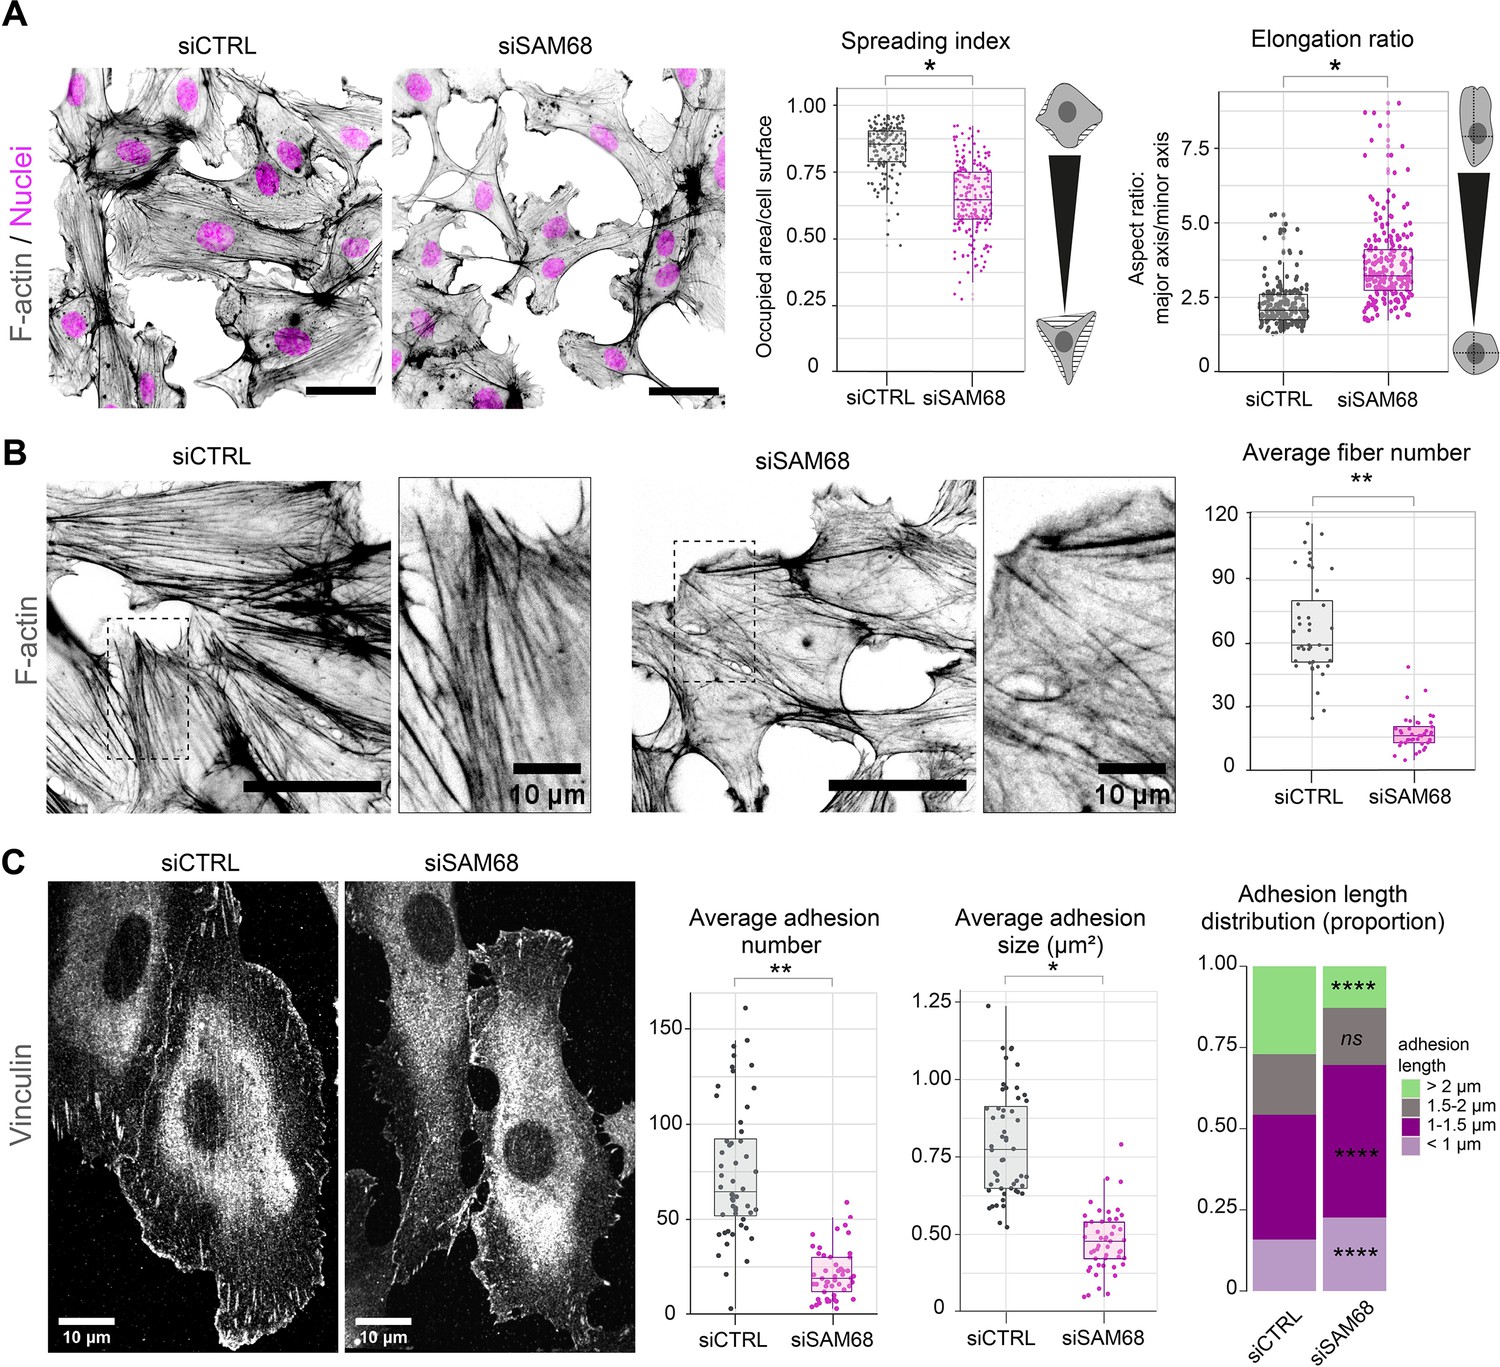
SAM68 regulates endothelial cell spreading, formation and maturation of adhesion sites.
(A) siRNA-transfected cells plated overnight on uncoated glass coverslips were stained for F-actin for cell shape analysis (n=50 cells per condition; N=3). Scale bar=50 μm. Spreading Index is expressed as the ratio of occupied area (hatched area) to the cell surface (solid grey area) and elongation ratio is expressed as the ratio of the major to minor cell axis. (B) Magnification images of endothelial cells from the experimental setting described in (A). Sacle bars=20 μm and 10 μm (zoomed). Average fiber number was quantified using FIJI software (n=16 cells per condition; N=3). (C) Vinculin staining was performed on siRNA-transfected cells plated overnight on glass coverslips. Analysis of adhesion sites was performed using FIJI software by quantifying at least 15 cells per condition (N=3). Statistics: p-values: *<0.05 **<0.01; ****<0.0001. Student’s t-test (paired CTRL-siSAM68) was used for (A, B, C). Pearson’s chi-squared test was used for adhesion length distribution (C).
-
Figure 1—source data 1
Quantification of cell morphology parameters.
- https://cdn.elifesciences.org/articles/85165/elife-85165-fig1-data1-v1.zip
-
Figure 1—source data 2
Quantification of stress fiber numbers and lengths.
- https://cdn.elifesciences.org/articles/85165/elife-85165-fig1-data2-v1.zip
-
Figure 1—source data 3
Quantification of vinculin-positive structure numbers, lengths and sizes.
- https://cdn.elifesciences.org/articles/85165/elife-85165-fig1-data3-v1.zip
Figure 1—figure supplement 1

siRNA based SAM68 depletion in endothelial cells.
Western blot analysis of endogenous SAM68 expression in siRNA-transfected cells with densitometric quantification indicated below (N=3). Statistics: p-values: **** <0.0001.
-
Figure 1—figure supplement 1—source data 1
Western blot uncropped membranes.
- https://cdn.elifesciences.org/articles/85165/elife-85165-fig1-figsupp1-data1-v1.zip
Figure 1—figure supplement 2
SAM68 depletion decreases adhesion site length.
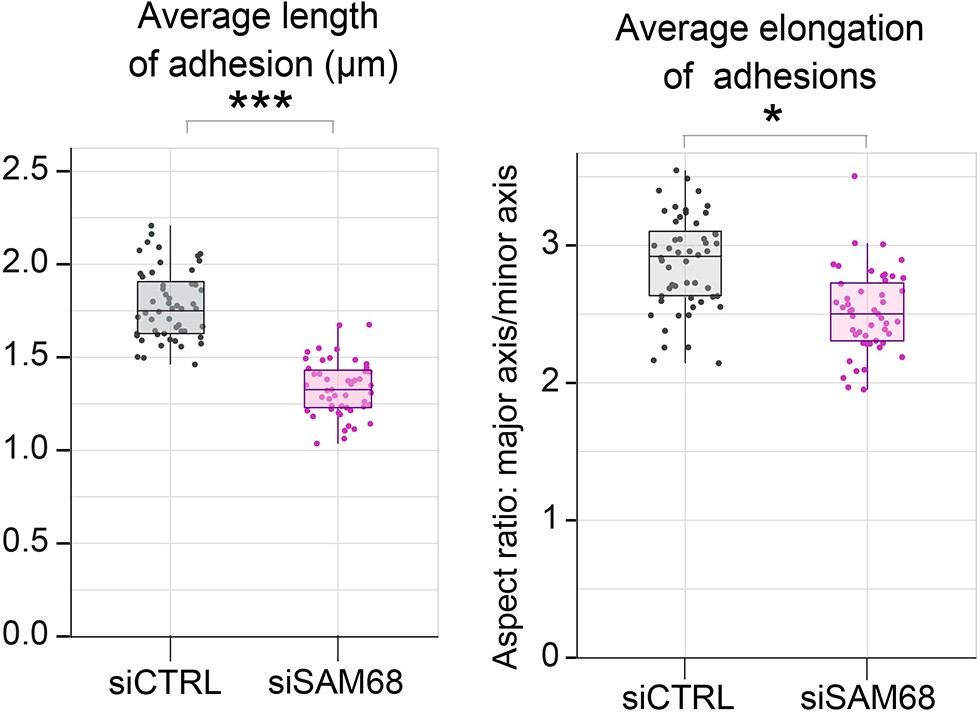
Vinculin staining was performed on siRNA-transfected cells plated overnight on glass coverslips. Quantification of adhesion site length and elongation were performed using FIJI software by quantifying at least 15 cells per condition (N=3). Statistics: p-values: *<0.05 ***<0.001. Student’s t-test (paired CTRL-siSAM68) was used.
Figure 2 with 1 supplement
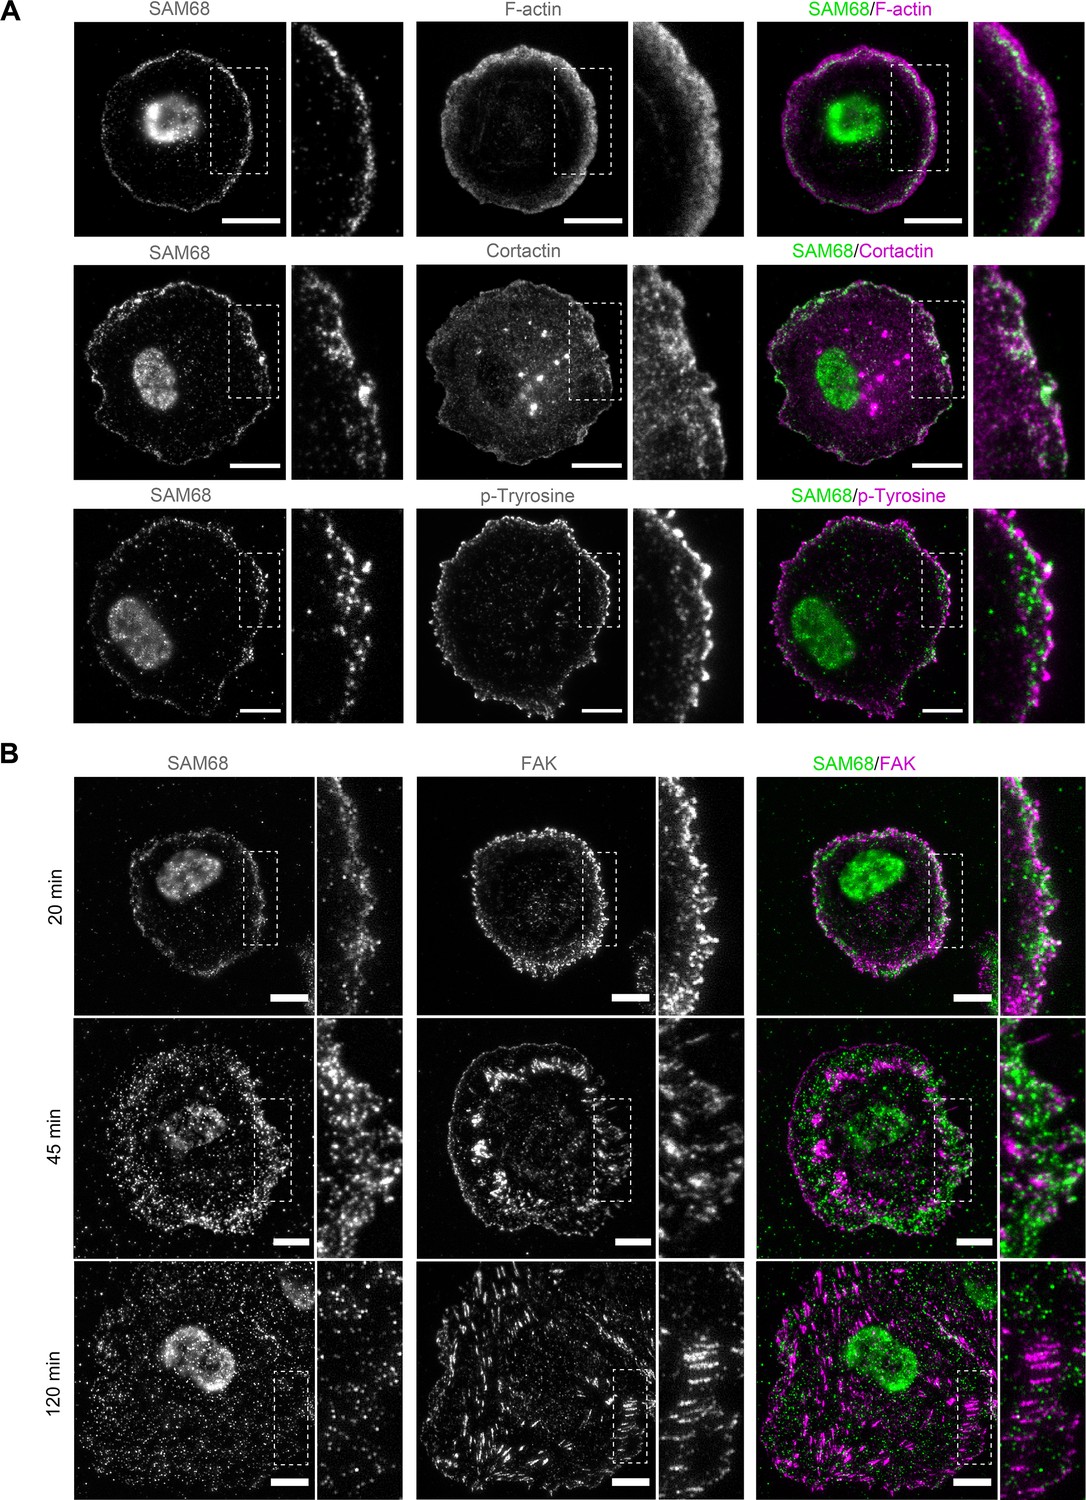
SAM68 localization in spreading cells.
(A) HUVECs plated on FN-coated coverslips for 20 min were stained for SAM68, F-actin, cortactin and phospho-tyrosine. Scale bars=10 μm. Dotted squares depict enlarged areas (10 μm wide) shown in the same panel. (B) Labelling of SAM68 and FAK was performed on HUVECs plated on FN-coated coverslips for the indicated times; dotted squares depict enlarged areas shown in the same panel.
Figure 2—video 1
SAM68 transiently localizes at the actin-polymerizing cell front during spreading.
Live imaging of endothelial cells transduced with a lentiviral vector encoding both an eGFP-SAM68 fusion protein (green) and the live actin marker LifeACT-Ruby (magenta). The SAM68 fusion protein was generated by fusing (N-terminally) the coding sequence of eGFP to the SAM68 coding sequence, spaced by a GGS GGS GGS linker. Stream imaging of 100ms was performed in TIRF mode on a confocal spinning disk microscope with a ×100 objective (NA 1.4), 10–15 min after cell attachment on fibronectin [10 µg/ml]. Scale bar=10 μm.
Figure 3 with 1 supplement
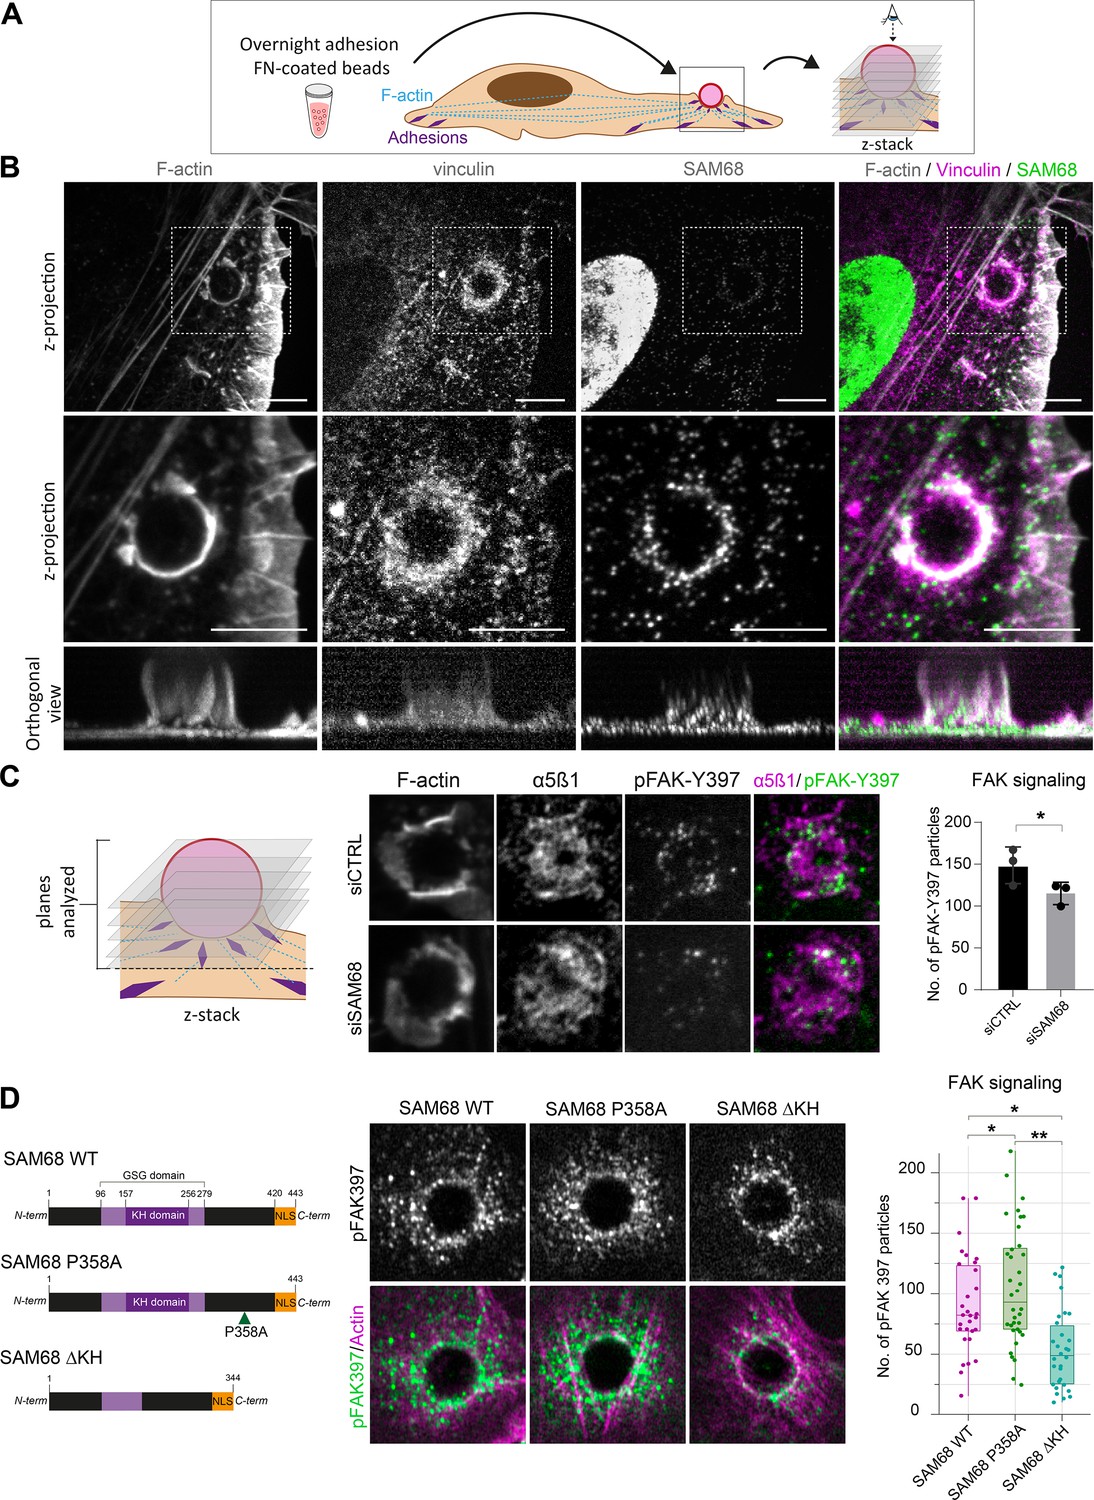
SAM68 regulates integrin signaling and RNA composition at adhesion sites.
(A) Scheme of the experimental procedure used to induce and image artificial adhesion sites in contact with FN-coated beads. (B) Labelling of SAM68 and vinculin was performed 20 min after seeding cells on FN-coated beads. Dotted squares in top panels depict enlarged z-projections shown in the middle panel. Orthogonal views are shown in bottom panels. Scale bars=5 μm. (C) Immunolabeling of α5β1 and activated FAK (pFAK-Y397) were performed 20 min after deposition of FN-coated beads onto siCTRL- or siSAM68-transfected cells and pFAK-Y397 foci were quantified (n=at least 8 beads per condition, N=3). (D) siSAM68-transfected cells were transduced with lentiviral constructions encoding SAM68 WT and mutants shown in the left panel of the figure. Immunolabeling of activated FAK (pFAK-Y397) was performed 20 min after deposition of FN-coated beads onto cells and pFAK-Y397 foci were quantified (n=at least 5 beads per condition, N=4). Statistics: p-values: *<0.05 **<0.01. Student’s t-test (paired CTRL-siSAM68) was used for (C, D).
-
Figure 3—source data 1
Quantification of pFAK397 foci from Figure 3C.
- https://cdn.elifesciences.org/articles/85165/elife-85165-fig3-data1-v1.zip
-
Figure 3—source data 2
Quantification of pFAK397 foci from Figure 3D.
- https://cdn.elifesciences.org/articles/85165/elife-85165-fig3-data2-v1.zip
Figure 3—figure supplement 1

SAM68-targeted siRNA efficiently diminishes SAM68 recruitment to FN-coated beads.
Immunolabeling was performed 20 min after deposition of FN-coated beads onto siCTRL- or siSAM68-transfected cells.
Figure 4
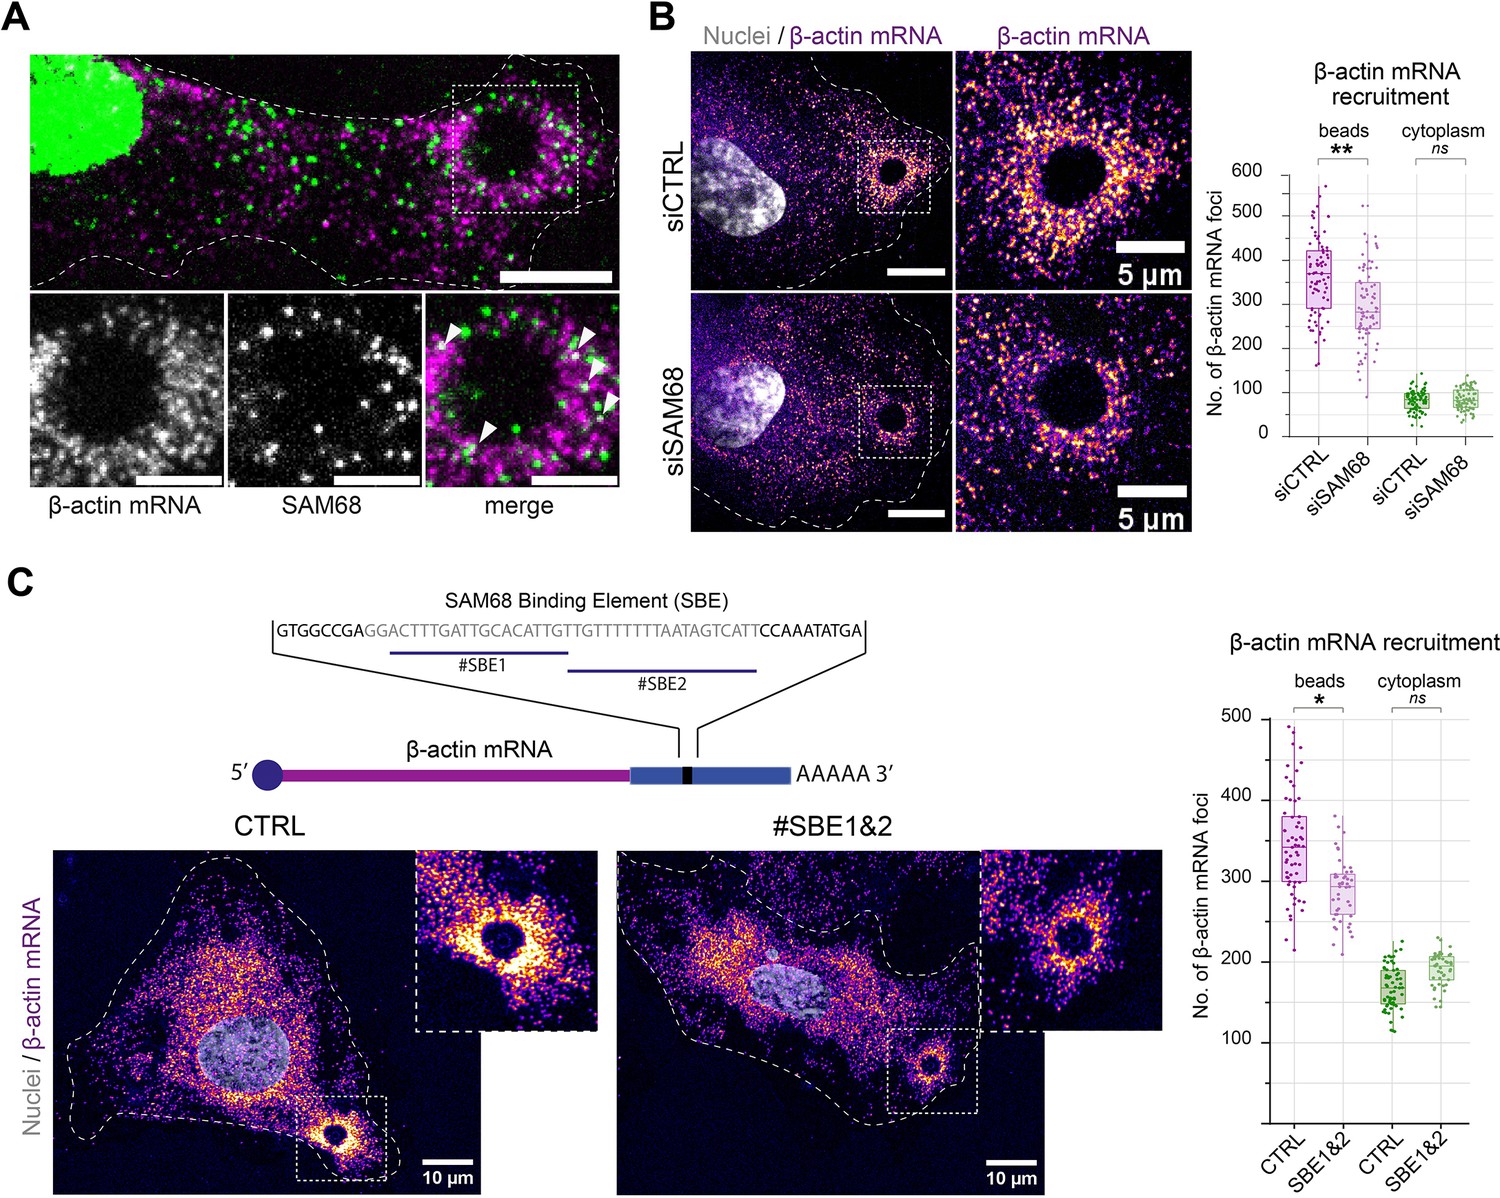
SAM68 is involved local delivery of β-actin mRNA at adhesion sites.
(A) smRNA FISH and SAM68 stainings were performed 20 min after deposition of FN-coated beads. Scale bars top image=10 μm, enlarged area 5 μm. Arrowheads point to overlapping signals between β-actin mRNA and SAM68 protein. (B) smRNA FISH of β-actin performed on cells 20 min after addition of FN-coated beads to cultures of siCTRL- or siSAM68-transfected cells (n=at least 12 beads per condition, N=3). Scale bars = left 10 μm, enlarged area 5 μm. (C) smiRNA FISH staining of β-actin performed on cells 20 min after deposition of FN-coated beads onto endothelial cells transfected with CTRL or blocking oligonucleotides (#SBE1 and #SBE2, as indicated) (n=at least 12 beads per condition, N=3). Statistics: p-values: *<0.05 **<0.01. Student’s t-test (paired CTRL-siSAM68) was used.
-
Figure 4—source data 1
Quantification of pFAK397 foci from Figure 4B.
- https://cdn.elifesciences.org/articles/85165/elife-85165-fig4-data1-v1.zip
-
Figure 4—source data 2
Quantification of pFAK397 foci from Figure 4C.
- https://cdn.elifesciences.org/articles/85165/elife-85165-fig4-data2-v1.zip
Figure 5 with 2 supplements
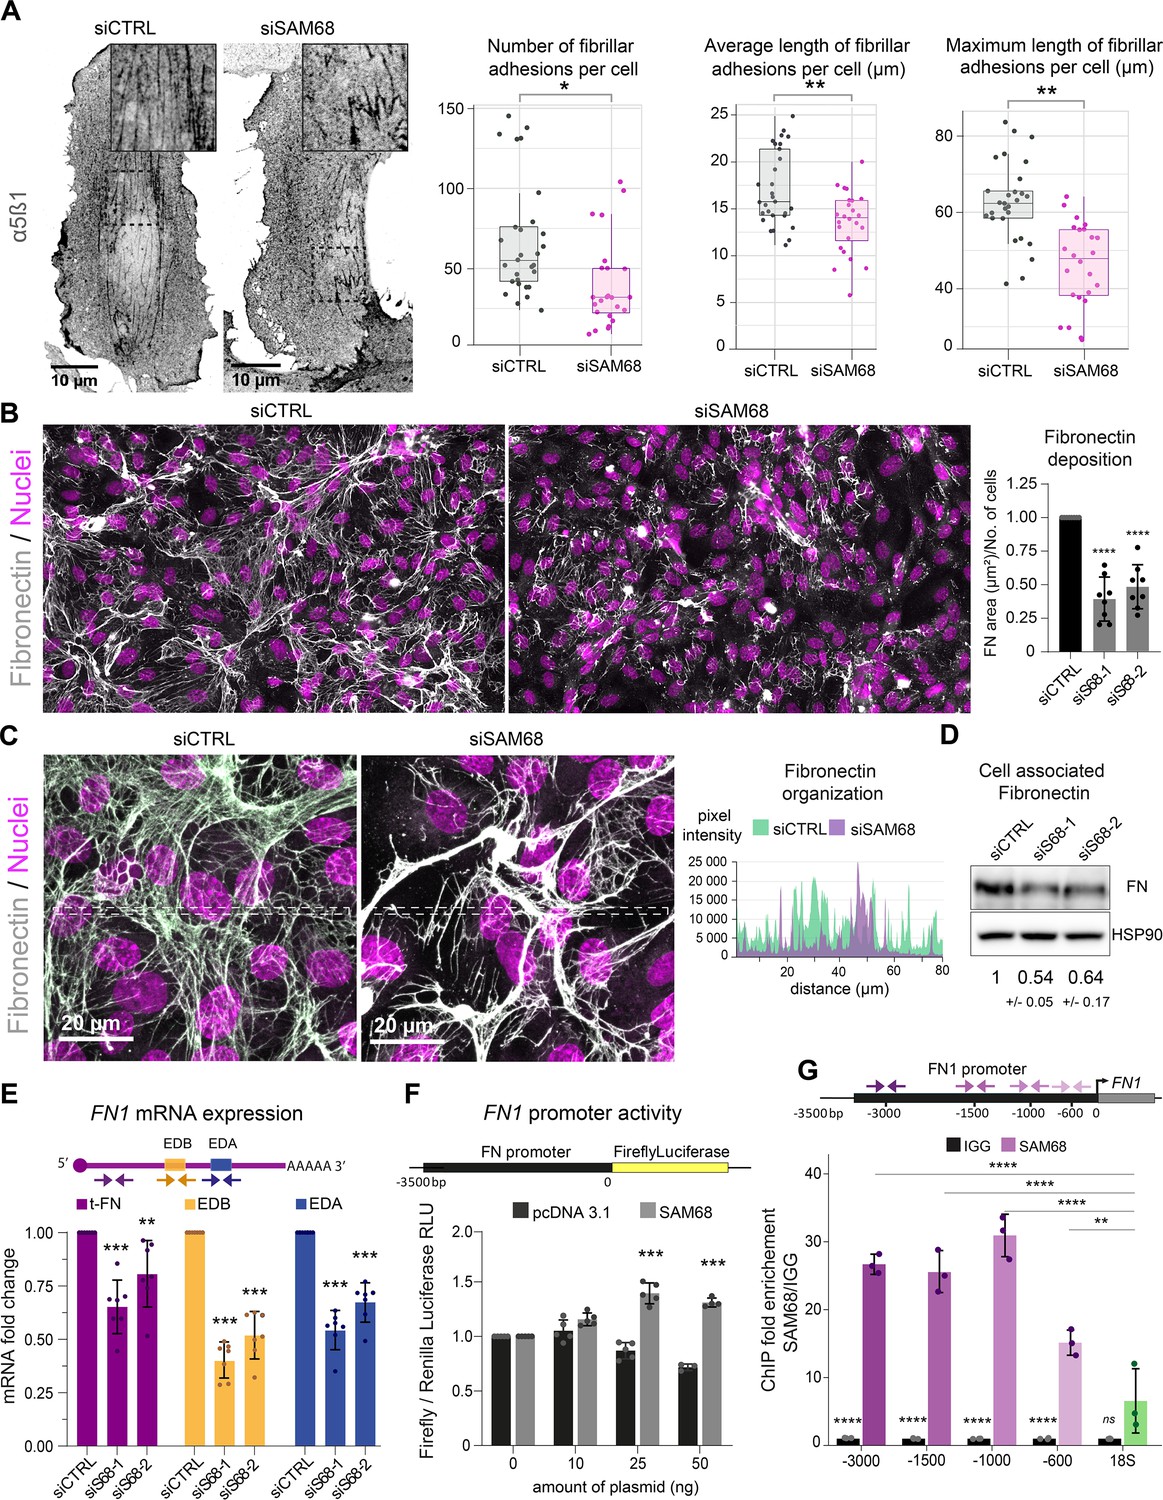
SAM68 is involved in FN assembly and expression.
(A) Immunofluorescence staining of α5β1 integrin was performed to identify and quantify fibrillar adhesion in siRNA transfected cells plated overnight on glass coverslips (n=at least 15; N=3). (B) Immunofluorescence staining of FN was performed on siRNA transfected cells plated on glass coverslips and quantification on whole-coverslip scans is expressed as the ratio of FN-stained area to the number of cells (N=8). Representative 40x field views. (C) Representative high magnification images of FN staining are shown with areas between the dotted lines selected for fluorescence intensity profiles. (D) Western blot analysis of cell-associated FN in siRNA transfected cells with densitometric quantification indicated below (N=3). (E) qPCR analysis of total FN (tFN) and Extra Domain-containing isoform expression in siRNA transfected cells using the indicated qPCR primer pairs (N=7). (F) Measurements of Luciferase activity driven by the FN1 promoter when SAM68 is overexpressed (N=5). (G) DNA fragments located in the FN1 promoter were quantified by qPCR in anti-SAM68 or IgG immunoprecipitated complexes (N=3). Statistics: p-values: *<0.05 **<0.01 ***<0.001 ****<0.0001. Student’s t-test (paired CTRL-siSAM68) was used for (A, B, D, E, F). Statistical analysis of fold enrichment in (G) was performed with R using pairwise t-test with p-values adjusted using ‘Bonferroni correction’.
-
Figure 5—source data 1
Quantification of endothelial fibrillar adhesions.
- https://cdn.elifesciences.org/articles/85165/elife-85165-fig5-data1-v1.zip
-
Figure 5—source data 2
Western blot uncropped membranes.
- https://cdn.elifesciences.org/articles/85165/elife-85165-fig5-data2-v1.zip
-
Figure 5—source data 3
Quantification of FN1 mRNA levels.
- https://cdn.elifesciences.org/articles/85165/elife-85165-fig5-data3-v1.zip
-
Figure 5—source data 4
Quantification of FN1 promotor reporter activity.
- https://cdn.elifesciences.org/articles/85165/elife-85165-fig5-data4-v1.zip
-
Figure 5—source data 5
Quantification of SAM68 protein recruitment onto the FN1 promotor.
- https://cdn.elifesciences.org/articles/85165/elife-85165-fig5-data5-v1.zip
Figure 5—figure supplement 1

SAM68 depletion decreases insoluble ECM-associated FN and soluble FN secreted in cell culture medium.
Forty-eight h after seeding, conditioned medium was collected from siCTRL- or siSAM68-transfected cells and cells were gently removed from the ECM with a non-enzymatic cell dissociation buffer (Sigma, #C5914). Both ECM and conditioned medium fractions were subjected to western-blot analysis for FN detection. N=2.
-
Figure 5—figure supplement 1—source data 1
Western blot uncropped membranes.
- https://cdn.elifesciences.org/articles/85165/elife-85165-fig5-figsupp1-data1-v1.zip
Figure 5—figure supplement 2

SAM68 contributes to the alternative splicing of FN transcripts.
The same data as presented in Figure 5E are expressed as EDA- or EDB-containing FN mRNA levels, relative to tFN levels (N=7). Statistics: p-values: *<0.05 **<0.01 ***<0.001 ****<0.0001. Student’s t-test (paired CTRL-siSAM68) was used.
Figure 6
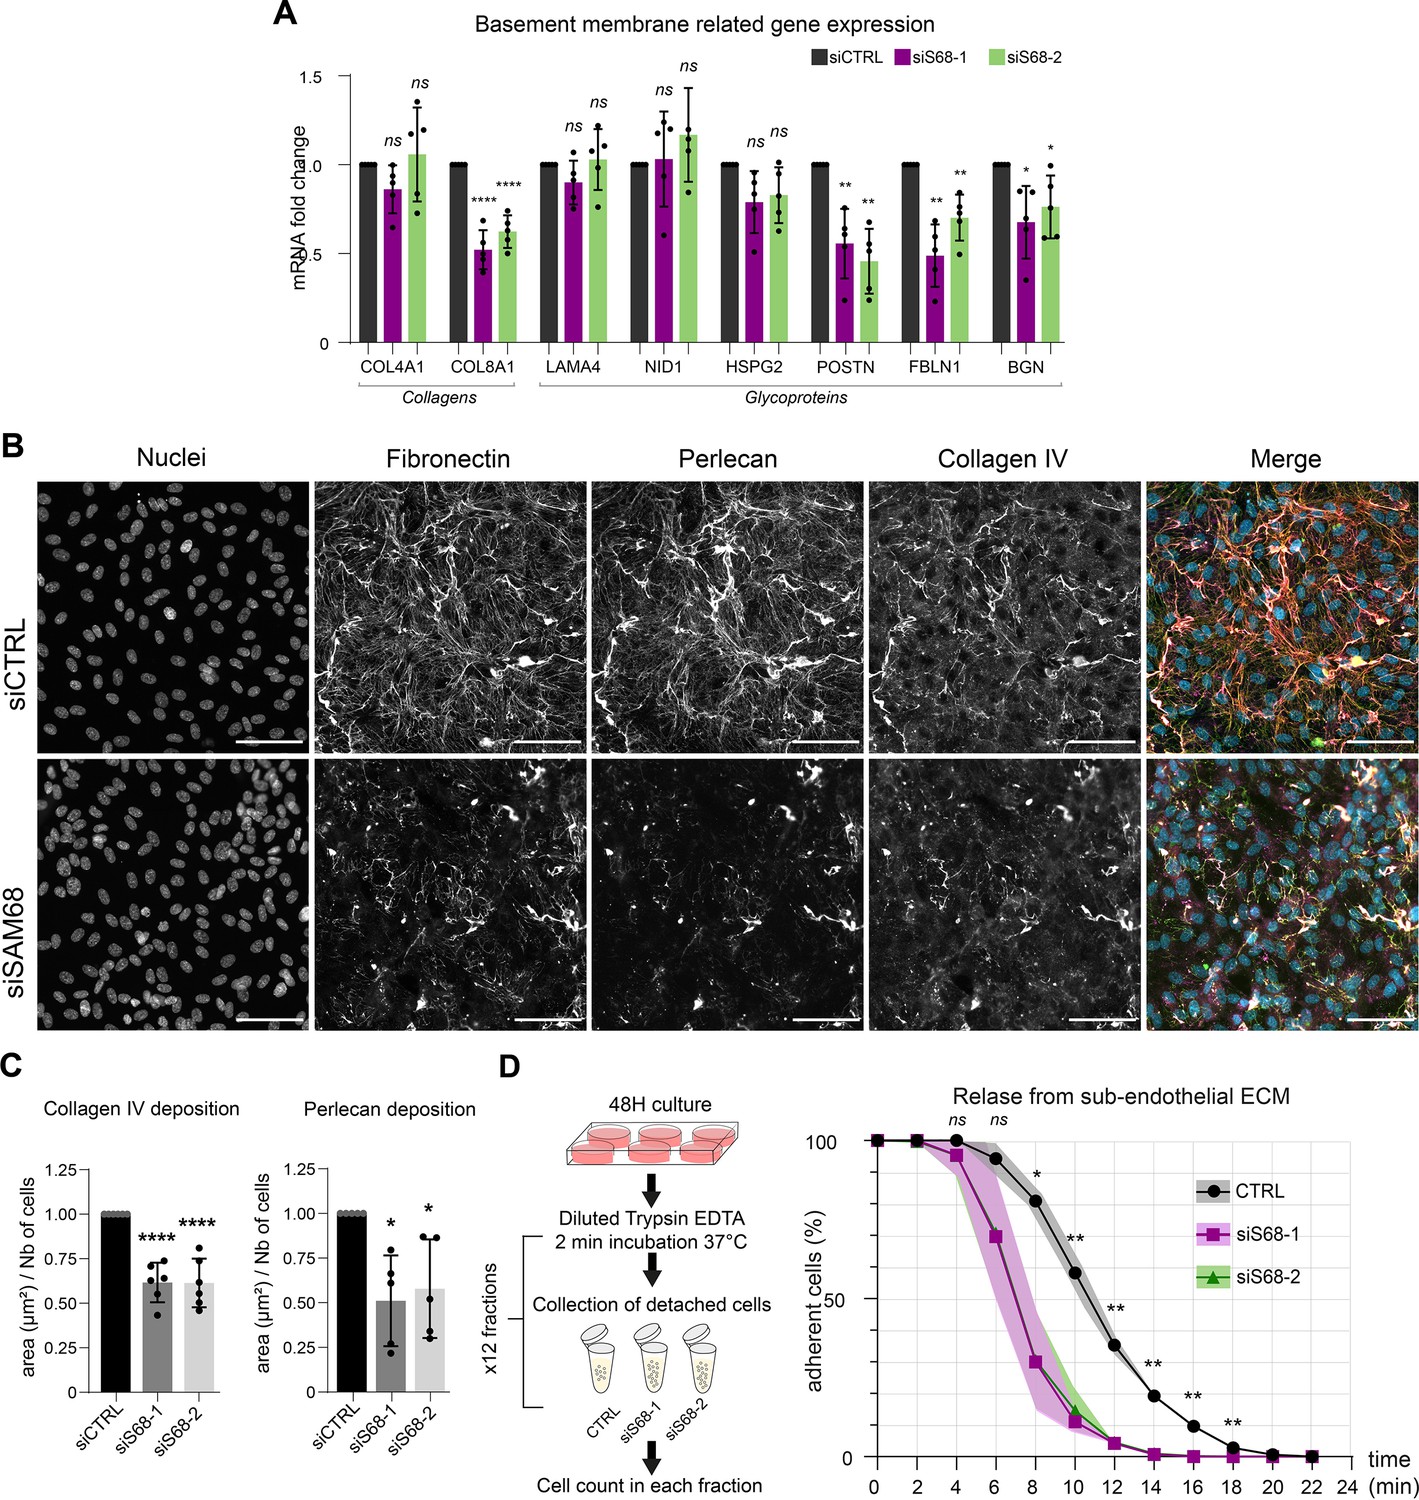
SAM68 regulates ECM protein deposition and mRNA biogenesis of matrisome genes.
(A) qPCR analysis of selected mRNA expression in siRNA transfected cells (N=5). (B) Representative images of collagen IV and perlecan staining of siRNA transfected cells 48 hr after plating on uncoated glass coverslips. Scale bars=50 μm. (C) Quantification of collagen IV and perlecan staining (N=5). (D) (left) Schematic of detachment assay used to determine release of siRNA-transfected cells from their self-assembled ECM support. (right) Quantification of adherent, trypsin-resistant cells (N=3). Statistics: p-values: *<0.05 **<0.01 ***<0.001 ****<0.0001. Student’s t-test (paired CTRL-siSAM68) was used for (A, C, D).
-
Figure 6—source data 1
qPCR quantification of basement membrane components.
- https://cdn.elifesciences.org/articles/85165/elife-85165-fig6-data1-v1.zip
-
Figure 6—source data 2
Quantification of ECM protein staining area.
- https://cdn.elifesciences.org/articles/85165/elife-85165-fig6-data2-v1.zip
-
Figure 6—source data 3
Quantification of attached cells.
- https://cdn.elifesciences.org/articles/85165/elife-85165-fig6-data3-v1.zip
Figure 7 with 2 supplements
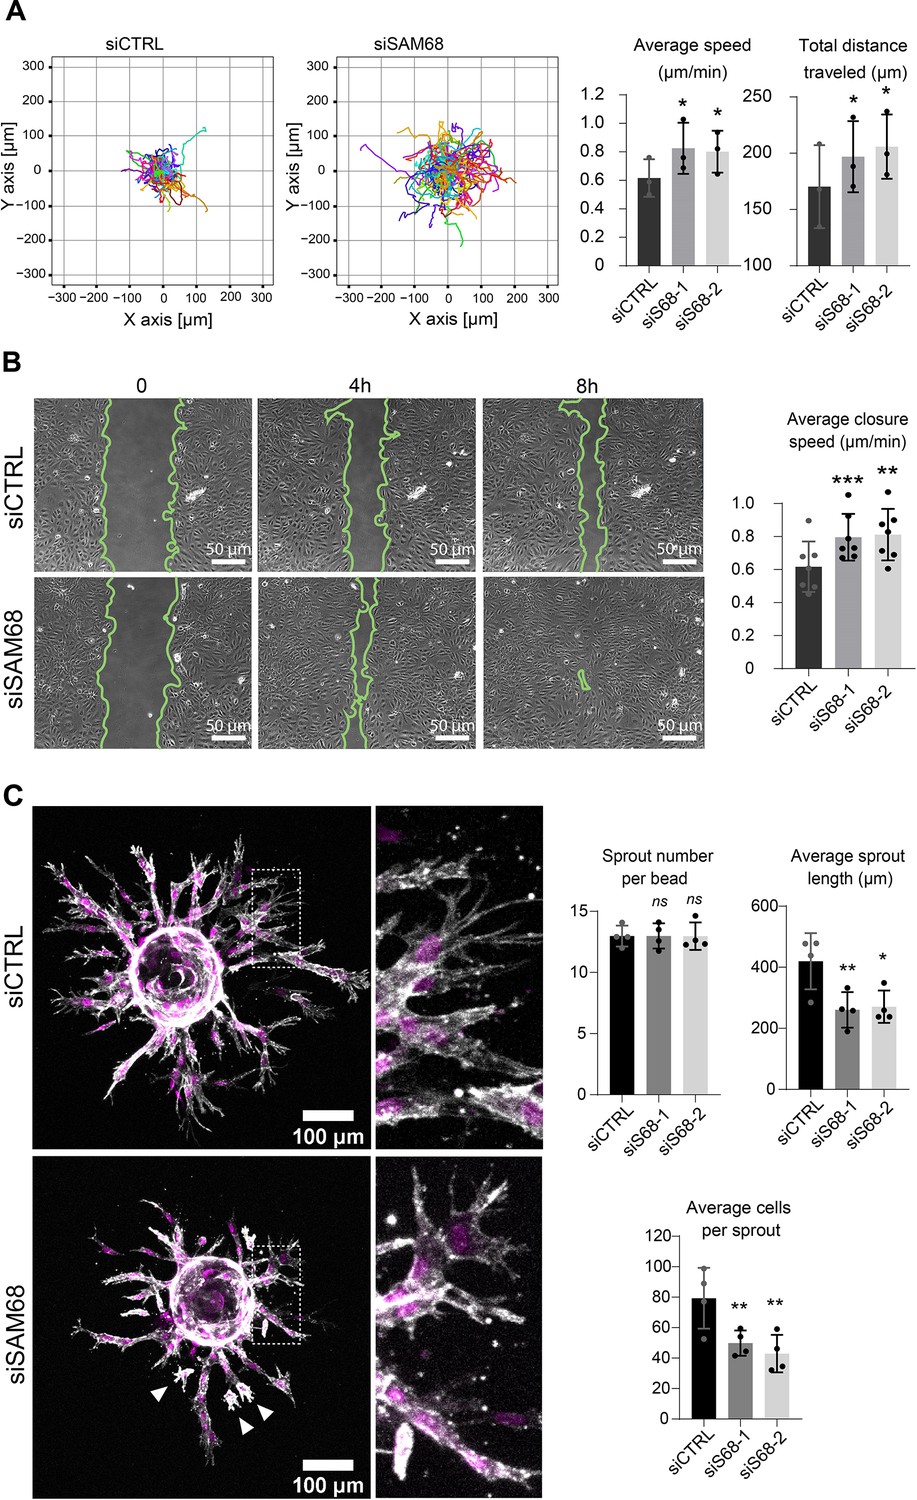
SAM68 depletion regulates endothelial cell migration and angiogenic sprouting behavior.
(A) Migration of individual siRNA-transfected cells was analyzed by time lapse microscopy. Individual tracks of one representative experiment are plotted and cell velocity as well total distance travelled are quantified (N=3). (B) Representative images from a wound assay experiment on siRNA transfected cells are shown together with quantification of average closure speed (N=7). (C) (left) siRNA-transfected cells on Cytodex3 beads embedded in a fibrin gel for 48 hr prior to staining for F-actin (gray) and nuclei (magenta). Cells detached from the sprouting structures are indicated with arrowheads. Quantification of sprout characteristics is shown on the right (n=12 Cytodex3 beads per condition, N=4). Statistics: p-values: *<0.05 **<0.01 ***<0.001. Student’s t-test (paired CTRL-siSAM68) was used for (A, B, C).
-
Figure 7—source data 1
Quantification of individual cell tracks.
- https://cdn.elifesciences.org/articles/85165/elife-85165-fig7-data1-v1.zip
-
Figure 7—source data 2
Quantification of average closure speed.
- https://cdn.elifesciences.org/articles/85165/elife-85165-fig7-data2-v1.zip
-
Figure 7—source data 3
Quantification of endothelial sprouting.
- https://cdn.elifesciences.org/articles/85165/elife-85165-fig7-data3-v1.zip
Figure 7—figure supplement 1

SAM68 depletion regulates endothelial cell migration.
Migration of individual siRNA-transfected cells was analyzed by time lapse microscopy. (A) Representation of individual tracks of the experiment presented in Figure 7A for the second siRNA directed against SAM68. (B) Additional quantification of average speed and total distance travelled are shown (N=3). Statistics: p-values: *<0.05. Student’s t-test (paired CTRL-siSAM68) was used.
Figure 7—figure supplement 2

SAM68 depletion regulates endothelial cell angiogenic sprouting behavior.
Distribution of average sprout length per bead observed in the 3D angiogenesis assay presented in Figure 7C. Results from two SAM68-targeting siRNAs in four different experiments are shown (N1 to N4).
Figure 8
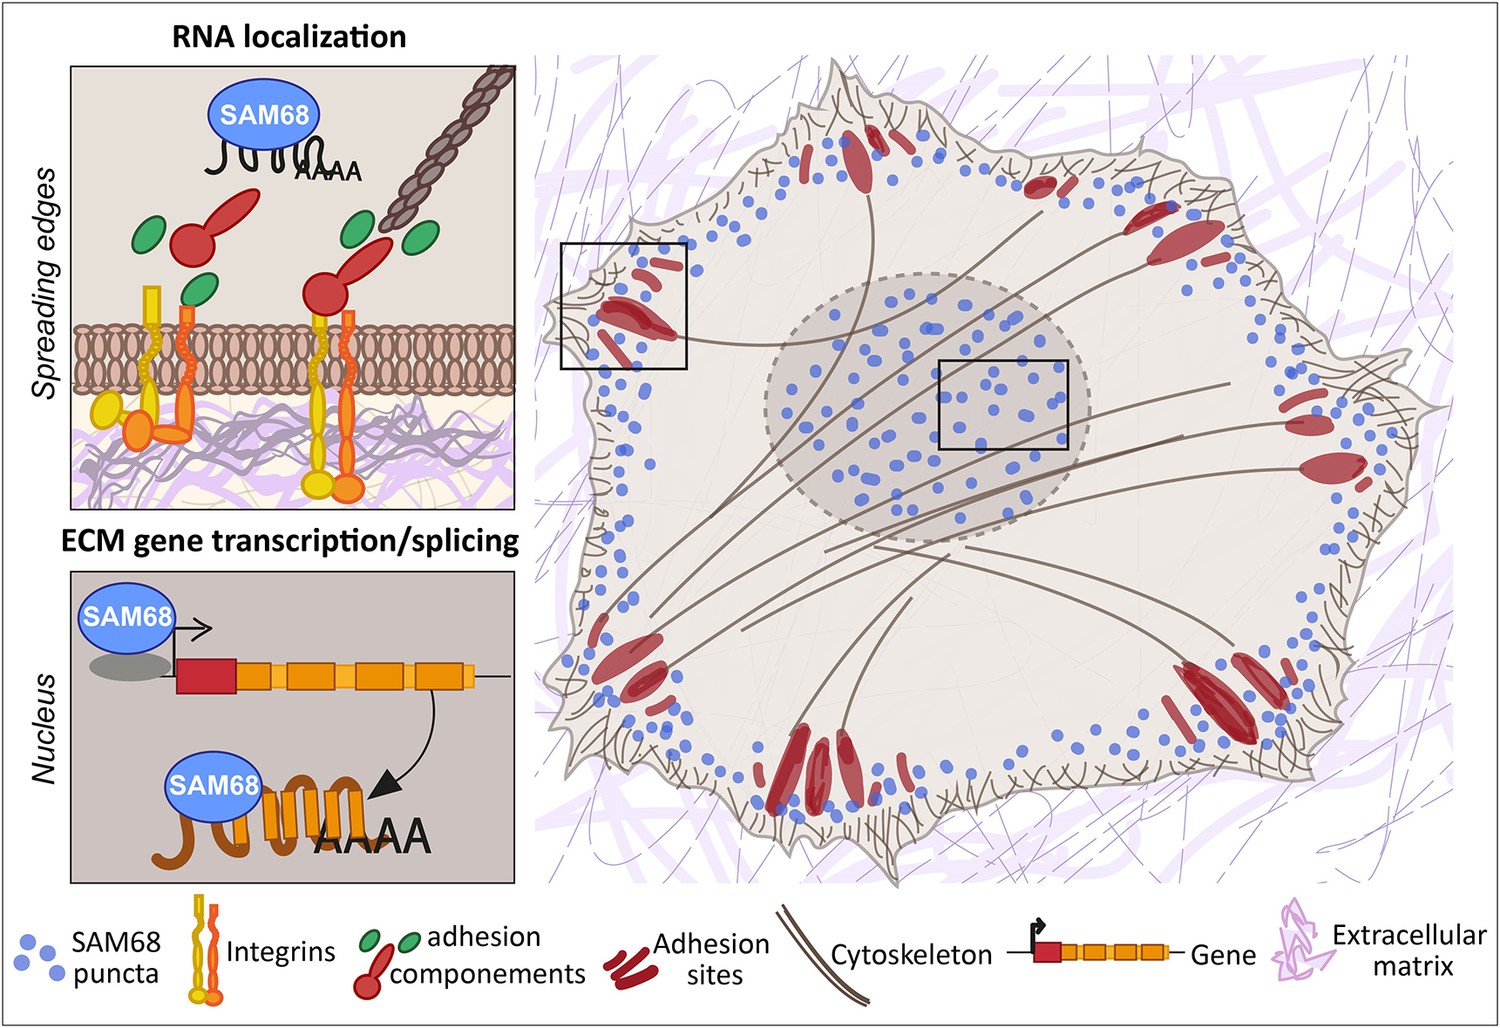
SAM68 regulates integrin adhesion maturation and matrix conditioning in endothelial cells.
Upon integrin activation, a cytoplasmic fraction of SAM68 participates transiently in adhesion complex stabilization, through regulation of integrin signaling and localization of β-actin mRNA. In the nucleus, SAM68 concomitantly regulates the expression of key subendothelial matrix genes, thereby promoting basement membrane assembly and conditioning. These coalescent functions of SAM68 enhance endothelial cell adaptation to their microenvironment and point to an important role for SAM68 during angiogenesis.
Figure 9
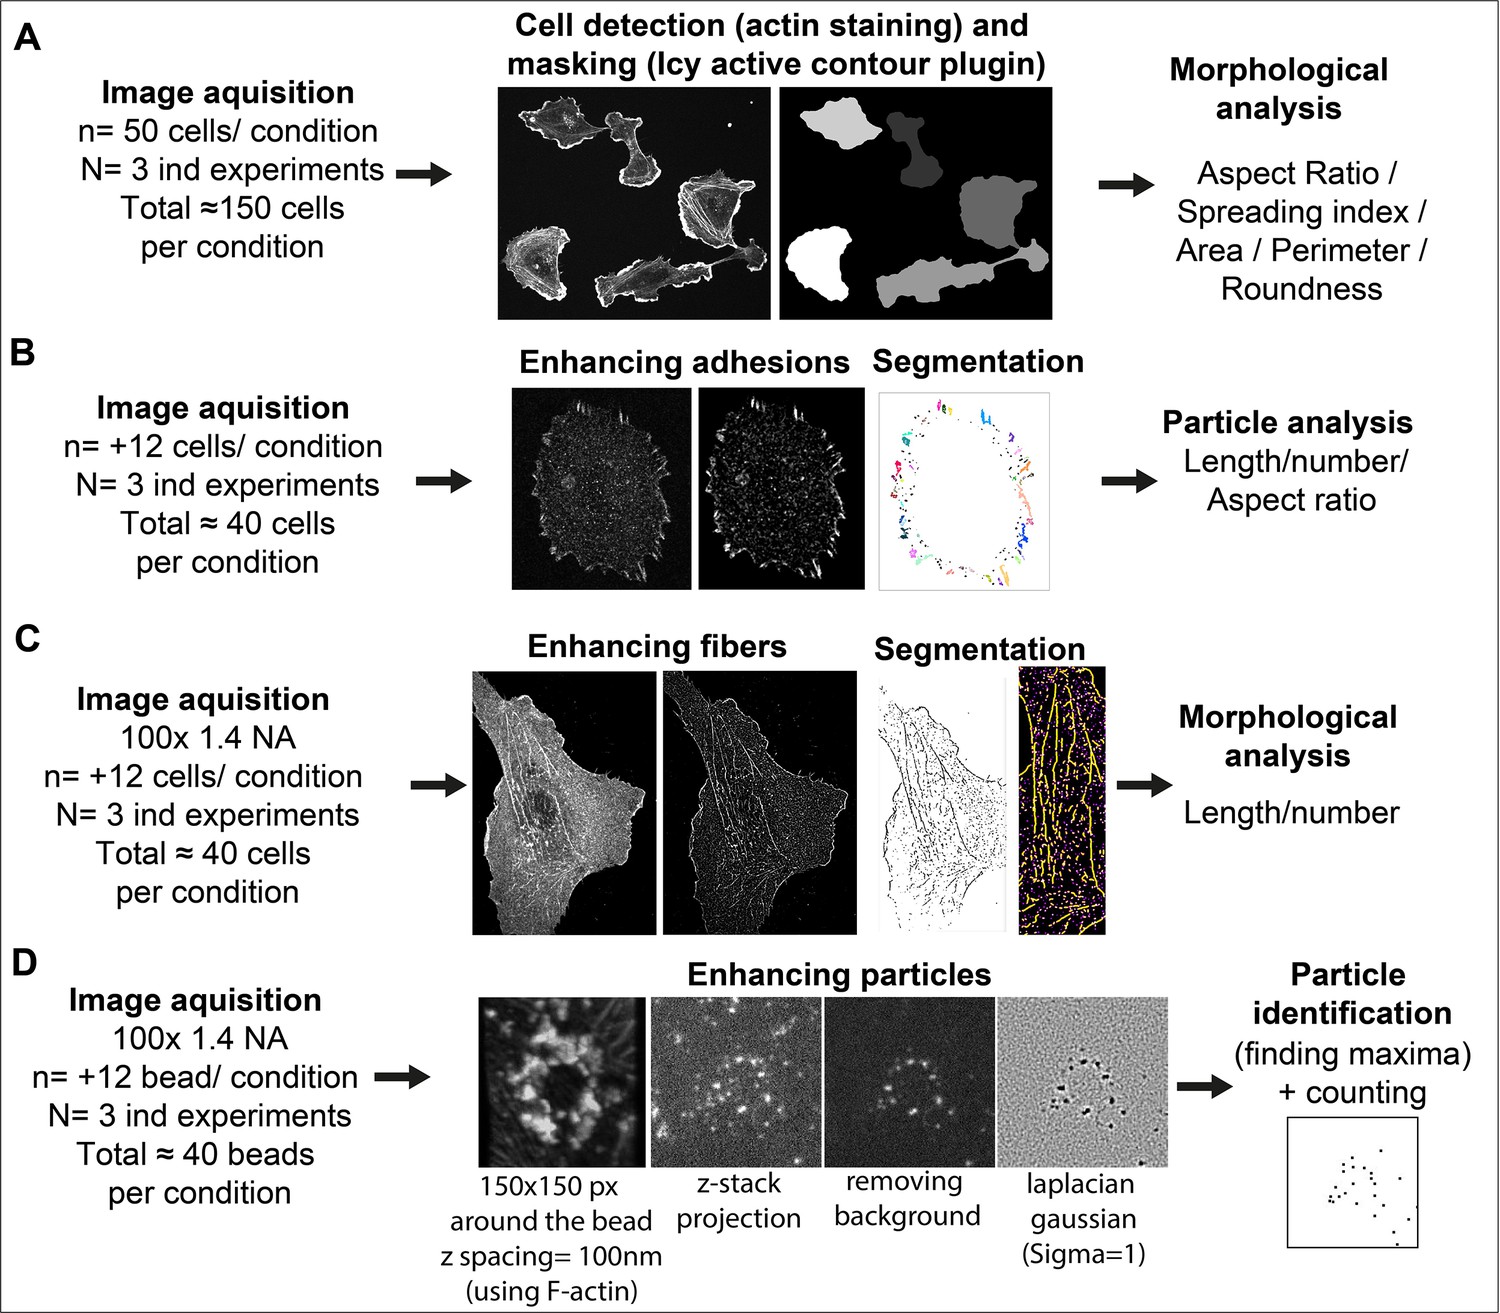
Image analysis workflow.
(A) Cell Morphology. General morphology of cells grown overnight on glass coverslips was assessed using F-actin staining. A mask of each individual cell was created with the ‘active contour’ plugin (Dufour et al., 2011) of ICY software (de Chaumont et al., 2012). Resulting binary masks were then imported in FIJI (Schindelin et al., 2012) for subsequent morphological feature extraction using the MorphoLibJ plugin (Legland et al., 2016). (B) Adhesion site analysis. Overnight HUVEC cultures were stained for vinculin and a z-stack (5 µm from coverslip contact site) was imaged. Intensities, brightness, and contrast of the focal plane was modified to enhance adhesive structures. Resulting images were then thresholded and diffuse vinculin staining in the masks was removed with a 5 µm ellipse circling the nucleus. Resulting segmented adhesions were quantified and described using the FIJI particle analysis plugin. Stained structures under 0.25 µm were not considered as focal complexes (Geiger et al., 2001). (C) Fibrillar adhesion analysis. Intensities, brightness, and contrast of the focus plan was modified to enhance these structures. Resulted images were then segmented using classic thresholding methods, and further skeletonized; fibrillar adhesions were analyzed using the FIJI analyze skeleton plugin. (D) pFAK-Y397 and β-actin mRNA particle analysis. Five µm z-stacks (100 nm spacing) were acquired around each FN-coated bead engaged in adhesion formation near the cell periphery. Cell attachment to each bead was assessed using F-actin staining when forming a dense ‘cup’ like ring structure around the bead. Background noise was removed (Fiji Process) and particles surrounding the beads (150-pixel square area) were enhanced using Laplacian gaussian filter (sigma = 1) followed by maxima detection using ‘FeatureJ’ plugin. For calculation of specific β-actin particle enrichment at the bead, an additional area of 150x150pixel from apical to basal plane of the cell was selected in the cytoplasm (non-bead area) of the same cell for quantification, as reference.
Tables
Appendix 1—key resources table
| Reagent type (species) or resource | Designation | Source or reference | Identifiers | Additional information |
|---|---|---|---|---|
| Antibody | anti-Vinculin (mouse monoclonal) | Sigma-Aldrich | Cat# V 9131, RRID:AB_477629 | IF (1:200) |
| Antibody | anti-SAM68 (rabbit polyclonal) | Sigma-Aldrich | Cat # HPA051280 | IF (1:200) WB (1:200) |
| Antibody | anti-Phosphotyrosine (rabbit polyclonal) | Sigma-Aldrich | Cat #05–321, RRID:AB_2891016 | IF (1:200) |
| Antibody | anti-FAK (rabbit polyclonal) | Cell Signaling | Cat# 3285 | IF (1:200) |
| Antibody | anti-pFAK-Y397(rabbit polyclonal) | Cell Signaling (#3283) | Cat# 3283 | IF (1:200) |
| Antibody | anti-Integrin α5β1 (mouse monoclonal) | Chemicon international | Cat# MAB1999 | IF (1:100) |
| Antibody | anti-Fibronectin (mouse monoclonal) | BD Transduction Laboratories | Cat# 610077 | IF (1:500) WB (1:4000) |
| Antibody | anti-HSP90 (mouse monoclonal) | Thermo Fisher Scientific | Cat# MA1-10372, RRID:AB_11155433 | WB (1:1000) |
| Antibody | anti-Perlecan (rat monoclonal) | Thermo Fisher Scientific | Cat# RT-794 | IF (1:200) |
| Antibody | anti-Collagen IV | Novotec | Cat# 20411 | IF (1:100) |
| Antibody | anti-mouse Alexa Fluor 488 (goat polyclonal) | Invitrogen | Cat# A-11029 | IF (1:4000) |
| Antibody | anti-mouse Alexa Fluor 546 (goat polyclonal) | Invitrogen | Cat# A-11030 | IF (1:4000) |
| Antibody | anti-rabbit Alexa Fluor 488 (goat polyclonal) | Invitrogen | Cat# A-11034 | IF (1:4000) |
| Antibody | anti-rabbit Alexa Fluor 546 (goat polyclonal) | Invitrogen | Cat# A-11035 | IF (1:4000) |
| Antibody | anti-rat Alexa Fluor 488 (goat polyclonal) | Invitrogen | Cat# A-11006 | IF (1:4000) |
| Antibody | anti-rat Alexa Fluor 546 (goat polyclonal) | Invitrogen | Cat# A-11081 | IF (1:4000) |
| Sequence-based reagent | Control siRNA (siCTL) | Eurogentec, Seraing, Belgium | Cat# SR-CL000-005 | nontargeting siRNA |
| Sequence-based reagent | SAM68 siRNA (si68-1)_F | Eurogentec, Seraing, Belgium | siRNA | CAGGAUUCCUGUUGCUUUACC |
| Sequence-based reagent | SAM68 siRNA (si68-1)_R | Eurogentec, Seraing, Belgium | siRNA | UAAAGCAACAGGAAUCCUGGG |
| Sequence-based reagent | SAM68 siRNA (si68-2)_F | Eurogentec, Seraing, Belgium | siRNA | GGAAGUCAAGAAAUUUCUAGU |
| Sequence-based reagent | SAM68 siRNA (si68-2)_R | Eurogentec, Seraing, Belgium | siRNA | UAGAAAUUUCUUGACUUCCUC |
| Sequence-based reagent | RPL27a_F | Eurogentec, Seraing, Belgium | qPCR primer | AGAGCTTCTGCCCAACTGTC |
| Sequence-based reagent | RPL27a_R | Eurogentec, Seraing, Belgium | qPCR primer | TCACGATGACAGGCTGCTTT |
| Sequence-based reagent | t-FN qPCR_F | Eurogentec, Seraing, Belgium | qPCR primer (all FN variants) | GGGTCATGTACCGCATTGGA |
| Sequence-based reagent | t-FN qPCR_R | Eurogentec, Seraing, Belgium | qPCR primer (all FN variants) | GACGCTTGTGGAATGTGTCG |
| Sequence-based reagent | EDA-FN qPCR_F | Eurogentec, Seraing, Belgium | qPCR primer | TGAGCTATTCCCTGCACCTG |
| Sequence-based reagent | EDA-FN qPCR_R | Eurogentec, Seraing, Belgium | qPCR primer | GTGGGTGTGACCTGAGTGAA |
| Sequence-based reagent | EDB-FN qPCR_F | Eurogentec, Seraing, Belgium | qPCR primer | TGGTCCATGCTGATCAGAGC |
| Sequence-based reagent | EDB-FN qPCR_R | Eurogentec, Seraing, Belgium | qPCR primer | CCTCAGGCCGATGCTTGAAT |
| Sequence-based reagent | COL4A1_F | Eurogentec, Seraing, Belgium | qPCR primer | GGCCAGAAAGGAGAGATGGG |
| Sequence-based reagent | COL4A1_R | Eurogentec, Seraing, Belgium | qPCR primer | ATCAACAGATGGGGTGCCTG |
| Sequence-based reagent | COL8A1_F | Eurogentec, Seraing, Belgium | qPCR primer | CAAGGGAGCTCACACGTTCA |
| Sequence-based reagent | COL8A1_R | Eurogentec, Seraing, Belgium | qPCR primer | GGGGCTGGTTTCTGTCTCTT |
| Sequence-based reagent | LAMA4_F | Eurogentec, Seraing, Belgium | qPCR primer | GAAGACATGAACAGGGCCAC |
| Sequence-based reagent | LAMA4_R | Eurogentec, Seraing, Belgium | qPCR primer | GAGGTGTTGTCAGAGAGTCCG |
| Sequence-based reagent | NID1_F | Eurogentec, Seraing, Belgium | qPCR primer | GTGTGGAGGGCTACCAGTTT |
| Sequence-based reagent | NID1_R | Eurogentec, Seraing, Belgium | qPCR primer | GCTGGGGTATGTCGCAGTTA |
| Sequence-based reagent | HSPG2_F | Eurogentec, Seraing, Belgium | qPCR primer | TGCGCTGGACACATTCGTA |
| Sequence-based reagent | HSPG2_R | Eurogentec, Seraing, Belgium | qPCR primer | ACTCGATGGAGCGAGTGAAAT |
| Sequence-based reagent | POSTN_F | Eurogentec, Seraing, Belgium | qPCR primer | AAGGAATGAAAGGCTGCCCA |
| Sequence-based reagent | POSTN_R | Eurogentec, Seraing, Belgium | qPCR primer | GTCAGAATAGCGCTGCGTTG |
| Sequence-based reagent | FBLN1_F | Eurogentec, Seraing, Belgium | qPCR primer | CTTCCGGCTCTCTGTGGATG |
| Sequence-based reagent | FBLN1_R | Eurogentec, Seraing, Belgium | qPCR primer | ACACTGGTAGGAGCCGTAGA |
| Sequence-based reagent | BGN_F | Eurogentec, Seraing, Belgium | qPCR primer | GCCAACTAGTCAGCCTGCG |
| Sequence-based reagent | BGN_R | Eurogentec, Seraing, Belgium | qPCR primer | CCATCGTCCAGGGTGAAGTC |
| Sequence-based reagent | 18 S rRNA_F | Eurogentec, Seraing, Belgium | qPCR primer | CGGCGACGACCCATTCGAAC |
| Sequence-based reagent | 18 S rRNA_R | Eurogentec, Seraing, Belgium | qPCR primer | GAATCGAACCCTGATTCCCCGTC |
| Sequence-based reagent | FN Promotor (–600 fragment)_F | Eurogentec, Seraing, Belgium | qPCR primer | GAAGAAGTCCGAACAGGGAGCTGTG |
| Sequence-based reagent | FN Promotor (–600 fragment)_R | Eurogentec, Seraing, Belgium | qPCR primer | GGCTGCCTTTCCCCCCATCCCGCTC |
| Sequence-based reagent | FN Promotor (–1000 fragment)_F | Eurogentec, Seraing, Belgium | qPCR primer | GCGGGGGATGGAGGGGGCATTCTGT |
| Sequence-based reagent | FN Promotor (–1000 fragment)_R | Eurogentec, Seraing, Belgium | qPCR primer | TATGTACTGTCTTGCCCTCCTTCGG |
| Sequence-based reagent | FN Promotor (–1500 fragment)_F | Eurogentec, Seraing, Belgium | qPCR primer | TGGGTCACAAAGATTCCTCAAGAGG |
| Sequence-based reagent | FN Promotor (–1500 fragment)_R | Eurogentec, Seraing, Belgium | qPCR primer | CAAGGATTTAAAACCAAACCAAAAC |
| Sequence-based reagent | FN Promotor (–3000 fragment)_F | Eurogentec, Seraing, Belgium | qPCR primer | GTTCTGTCTCTACCACATATATGCC |
| Sequence-based reagent | FN Promotor (–3000 fragment)_R | Eurogentec, Seraing, Belgium | qPCR primer | GACTTGCTCTCAGGTAGCAGCAAC |
| Sequence-based reagent | CTL antisense blocking oligonucleotide | Eurogentec, Seraing, Belgium | blocking oligonucleotide | (2'Ome)UCG-T(2'Ome)CA-CC(2'Ome)A-ATG-(2'Ome)CGT-T(2'Ome)AA-TG(2'Ome)U |
| Sequence-based reagent | SBE1 antisense blocking oligonucleotide | Eurogentec, Seraing, Belgium | blocking oligonucleotide | (2'Ome)AGT-G(2'Ome)AC-TA(2'Ome)C-TAA-(2'Ome)AAA-A(2'Ome)AC-CA(2'Ome)A-A |
| Sequence-based reagent | SBE2 antisense blocking oligonucleotide | Eurogentec, Seraing, Belgium | blocking oligonucleotide | (2'Ome)AAA-C(2'Ome)AA-TG(2'Ome)U-ACA-(2'Ome)ATC-A(2'Ome)AA-GT(2'Ome)C-C |
| Sequence-based reagent | hACTB-P1 | Eurogentec, Seraing, Belgium | smRNA FISH oligonucleotide | AAGGTGTGCACTTTTATTCAACTGGTCTCAAGCCTCCTAAGTTTCGAGCTGGACTCAGTG |
| Sequence-based reagent | hACTB-P2 | Eurogentec, Seraing, Belgium | smRNA FISH oligonucleotide | AGAAGCATTTGCGGTGGACGATGGAGGGGCCTCCTAAGTTTCGAGCTGGACTCAGTG |
| Sequence-based reagent | hACTB-P3 | Eurogentec, Seraing, Belgium | smRNA FISH oligonucleotide | GCTCAGGAGGAGCAATGATCTTGATCTTCCCTCCTAAGTTTCGAGCTGGACTCAGTG |
| Sequence-based reagent | hACTB-P4 | Eurogentec, Seraing, Belgium | smRNA FISH oligonucleotide | GGATGTCCACGTCACACTTCATGATGGAGCCTCCTAAGTTTCGAGCTGGACTCAGTG |
| Sequence-based reagent | hACTB-P5 | Eurogentec, Seraing, Belgium | smRNA FISH oligonucleotide | GAAGGTAGTTTCGTGGATGCCACAGGACTCCCTCCTAAGTTTCGAGCTGGACTCAGTG |
| Sequence-based reagent | hACTB-P6 | Eurogentec, Seraing, Belgium | smRNA FISH oligonucleotide | CAGCGGAACCGCTCATTGCCAATGGTCCTCCTAAGTTTCGAGCTGGACTCAGTG |
| Sequence-based reagent | hACTB-P7 | Eurogentec, Seraing, Belgium | smRNA FISH oligonucleotide | CAGCCTGGATAGCAACGTACATGGCTGCCTCCTAAGTTTCGAGCTGGACTCAGTG |
| Sequence-based reagent | hACTB-P8 | Eurogentec, Seraing, Belgium | smRNA FISH oligonucleotide | GTGTTGAAGGTCTCAAACATGATCTGGGTCATCCTCCTAAGTTTCGAGCTGGACTCAGTG |
| Sequence-based reagent | hACTB-P9 | Eurogentec, Seraing, Belgium | smRNA FISH oligonucleotide | TCGGGAGCCACACGCAGCTCATTGTACCTCCTAAGTTTCGAGCTGGACTCAGTG |
| Sequence-based reagent | hACTB-P10 | Eurogentec, Seraing, Belgium | smRNA FISH oligonucleotide | ACGAGCGCGGCGATATCATCATCCATCCTCCTAAGTTTCGAGCTGGACTCAGTG |
| Sequence-based reagent | hACTB-P11 | Eurogentec, Seraing, Belgium | smRNA FISH oligonucleotide | TTCTCCTTAGAGAGAAGTGGGGTGGCTTTTAGCCTCCTAAGTTTCGAGCTGGACTCAGTG |
| Sequence-based reagent | hACTB-P12 | Eurogentec, Seraing, Belgium | smRNA FISH oligonucleotide | CATTGTGAACTTTGGGGGATGCTCGCTCCCTCCTAAGTTTCGAGCTGGACTCAGTG |
| Sequence-based reagent | hACTB-P13 | Eurogentec, Seraing, Belgium | smRNA FISH oligonucleotide | GACTGCTGTCACCTTCACCGTTCCAGCCTCCTAAGTTTCGAGCTGGACTCAGTG |
| Sequence-based reagent | hACTB-P14 | Eurogentec, Seraing, Belgium | smRNA FISH oligonucleotide | GGACTCGTCATACTCCTGCTTGCTGACCTCCTAAGTTTCGAGCTGGACTCAGTG |
| Sequence-based reagent | hACTB-P15 | Eurogentec, Seraing, Belgium | smRNA FISH oligonucleotide | CAGTGATCTCCTTCTGCATCCTGTCGCCTCCTAAGTTTCGAGCTGGACTCAGTG |
| Sequence-based reagent | hACTB-P16 | Eurogentec, Seraing, Belgium | smRNA FISH oligonucleotide | GACAGCACTGTGTTGGCGTACAGGTCTTTCCTCCTAAGTTTCGAGCTGGACTCAGTG |
| Sequence-based reagent | hACTB-P17 | Eurogentec, Seraing, Belgium | smRNA FISH oligonucleotide | CGTGGCCATCTCTTGCTCGAAGTCCACCTCCTAAGTTTCGAGCTGGACTCAGTG |
| Sequence-based reagent | hACTB-P18 | Eurogentec, Seraing, Belgium | smRNA FISH oligonucleotide | GCGACGTAGCACAGCTTCTCCTTAATGTCCTCCTAAGTTTCGAGCTGGACTCAGTG |
| Sequence-based reagent | hACTB-P19 | Eurogentec, Seraing, Belgium | smRNA FISH oligonucleotide | AGGTGTGGTGCCAGATTTTCTCCATGTCGCCTCCTAAGTTTCGAGCTGGACTCAGTG |
| Sequence-based reagent | hACTB-P20 | Eurogentec, Seraing, Belgium | smRNA FISH oligonucleotide | CCAGTTGGTGACGATGCCGTGCTCGATCCTCCTAAGTTTCGAGCTGGACTCAGTG |
| Sequence-based reagent | hACTB-P21 | Eurogentec, Seraing, Belgium | smRNA FISH oligonucleotide | GGTACTTCAGGGTGAGGATGCCTCTCTCCTCCTAAGTTTCGAGCTGGACTCAGTG |
| Sequence-based reagent | hACTB-P22 | Eurogentec, Seraing, Belgium | smRNA FISH oligonucleotide | CCTCGTCGCCCACATAGGAATCCTTCCCTCCTAAGTTTCGAGCTGGACTCAGTG |
Additional files
Download links
A two-part list of links to download the article, or parts of the article, in various formats.
Downloads (link to download the article as PDF)
Open citations (links to open the citations from this article in various online reference manager services)
Cite this article (links to download the citations from this article in formats compatible with various reference manager tools)
Coalescent RNA-localizing and transcriptional activities of SAM68 modulate adhesion and subendothelial basement membrane assembly
eLife 12:e85165.
https://doi.org/10.7554/eLife.85165


