Structural and functional properties of a plant NRAMP-related aluminum transporter
- Department of Biochemistry, University of Zurich, Switzerland
Figures
Figure 1 with 2 supplements
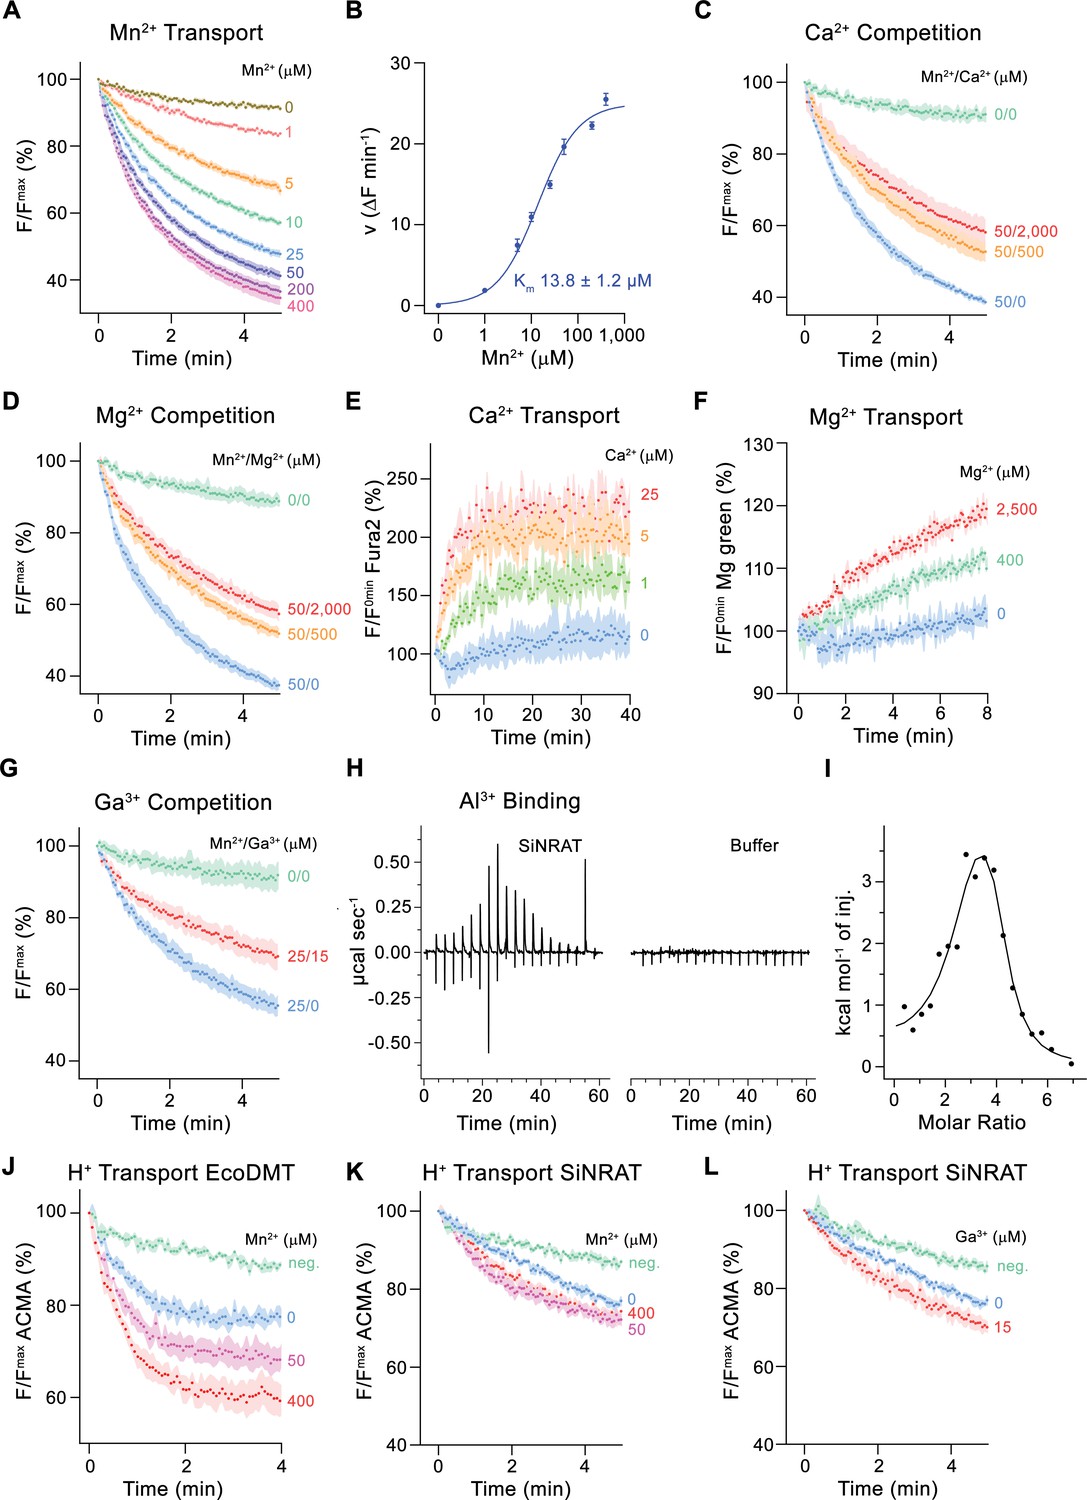
Functional characterization of SiNRAT.
(A) SiNRAT-mediated Mn2+ transport into proteoliposomes (six experiments from four independent reconstitutions). (B) Mn2+ concentration dependence of transport. Initial velocities were derived from individual traces of experiments displayed in (A), the solid line shows the fit to a Michaelis–Menten equation with an apparent Km of 13.8± 1.2 μM (with the error based on a 95% confidence interval). (C) Mn2+ transport in presence of Ca2+ (three experiments from three independent reconstitutions for all conditions). (D) Mn2+ transport in presence of Mg2+ (three experiments from three independent reconstitutions for all conditions). (E) SiNRAT-mediated Ca2+ import into proteoliposomes assayed with the fluorophore Fura2 trapped inside the liposome (three experiments from three independent reconstitutions for all conditions). (F) Assay of Mg2+ import into proteoliposomes assayed with the fluorophore Magnesium Green (three experiments from three independent reconstitutions for all conditions). (G) Mn2+ transport in presence of Ga3+ (five experiments from two independent reconstitutions for conditions containing Mn2+, four experiments for the condition 0 μM Mn2+/0 μM Ga3+). (A, C, D, G) Uptake of Mn2+ was assayed by the quenching of the fluorophore calcein trapped inside the vesicles. (H) Thermograms of Al3+ binding to SiNRAT (left) and buffer (right) obtained from isothermal titration calorimetry experiments. (I) Binding isotherm of Al3+ was fitted to a sum of two binding constants with the binding isotherm depicted as solid line. (J–L) Assay of H+ transport with the fluorophore ACMA. Experiments probing metal ion coupled H+ transport into proteoliposomes upon addition of metal ions to the outside. (J) H+ transport into proteoliposomes containing EcoDMT upon addition of Mn2+ (three experiments from two independent reconstitutions for all conditions). H+ transport into proteoliposomes containing SiNRAT upon addition of (K) Mn2+ (four experiments from three independent reconstitutions) and (L) Ga3+ (four experiments from three independent reconstitutions for SiNRAT with no substrate and empty liposomes with 15 μM Ga3+ and three experiments from three independent reconstitutions for SiNRAT with 7.5 or 15 μM Ga3+). (A–G) and (J–L) Panels show mean of indicated number of experiments, errors are s.e.m. (A), (C), (D–G), (J–L) Fluorescence is normalized to the value after addition of substrate (t=0). Applied ion concentrations are indicated. Negative controls (neg.) refer to empty liposomes in presence of 400 μM Mn2+ or 15 μM Ga3+, respectively.
-
Figure 1—source data 1
Transport and ITC data of SiNRAT.
- https://cdn.elifesciences.org/articles/85641/elife-85641-fig1-data1-v1.zip
Figure 1—figure supplement 1
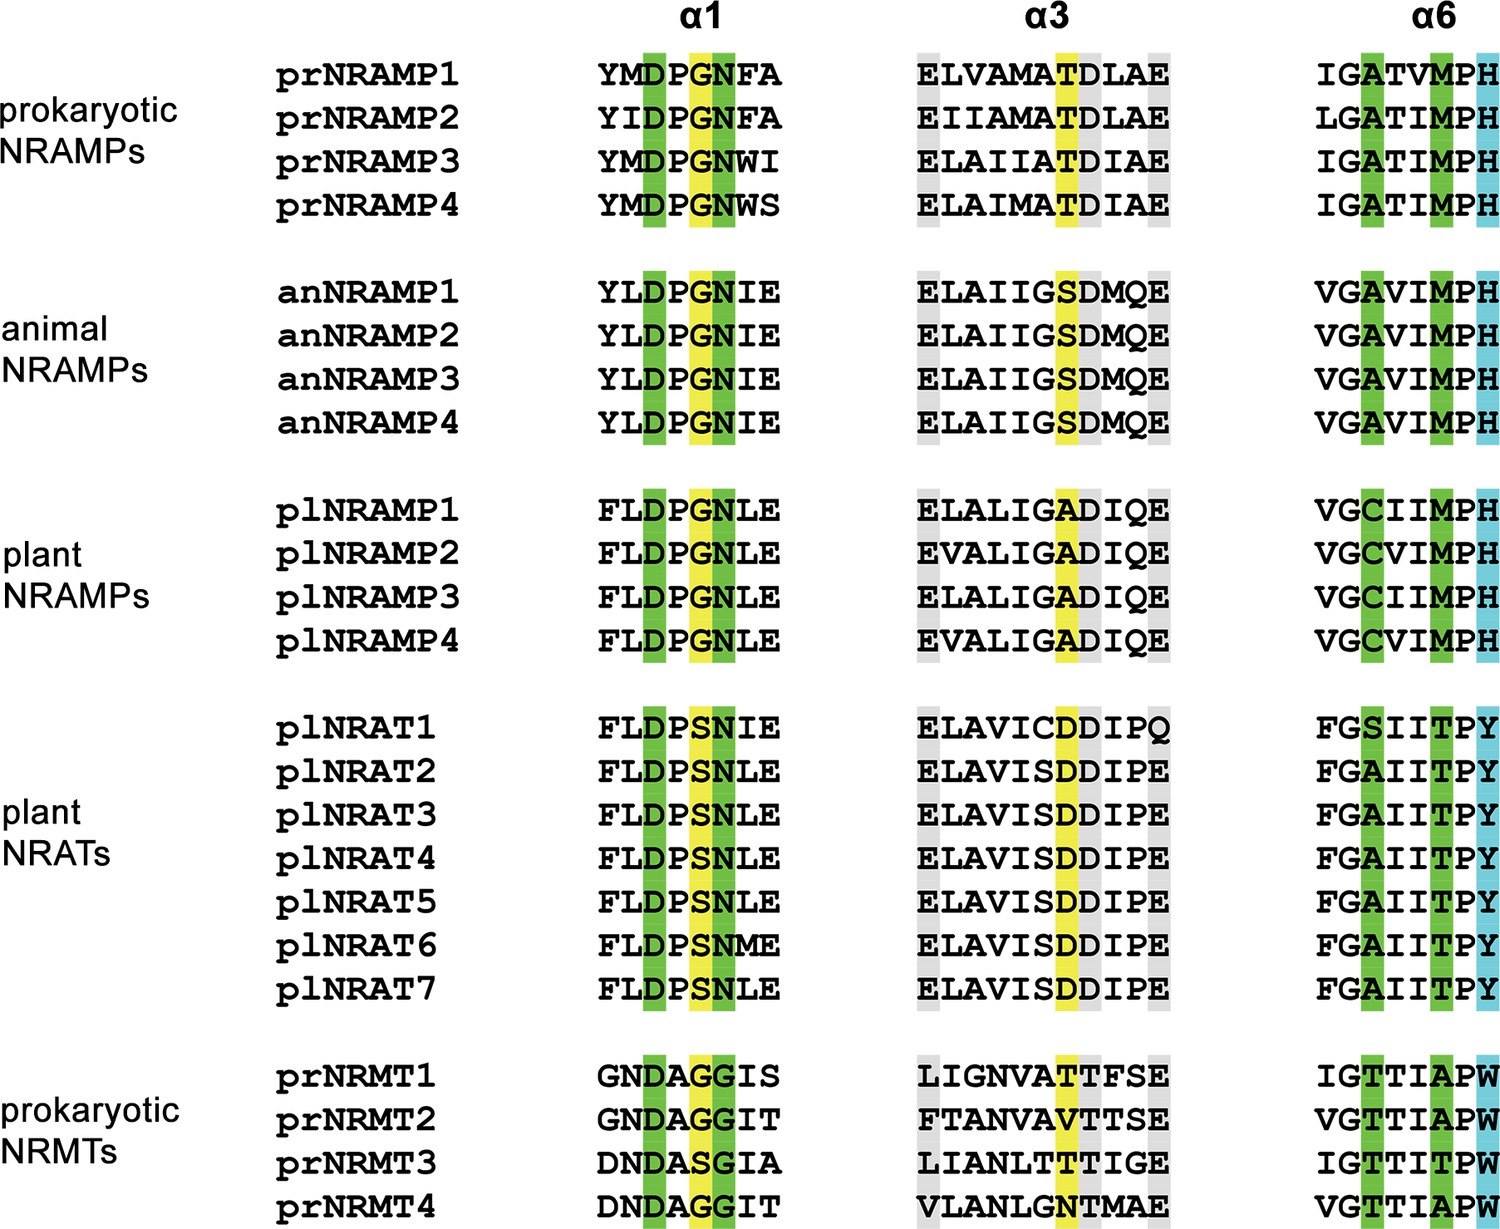
Sequence alignment of the metal ion binding site of SLC11 family members.
Residues constituting the ion binding site are highlighted in green, the position of additional residues contributing to the metal ion binding site of NRATs in yellow, a conserved histidine in H+-coupled metal ion transporters in cyan, and acidic residues on α3, which were also associated with H+ transport in gray. Shown are prokaryotic NRAMPSs (prNRAMP): 1 Deinococcus radiodurans (Uniprot: Q9RTP8), 2 Escherichia coli (UniProt: sp|P0A769|MNTH_ECOLI), 3 Staphylococcus capitis (Uniprot: A0A4U9TNH6), 4 Eremococcus coleocola (Uniprot: E4KPW4). Animal NRAMPs (anNRAMP): 1 Macaca mulatta NRAMP2 (NCBI: EHH20731.1), 2 Homo sapiens NRAMP2 (NCBI: NP_001366375.1), 3 Pan paniscus NRAMP2 (NCBI: XP_008949491.1), 4 Chlorocebus sabaeus NRAMP2 (NCBI: XP_037853046.1). Plant NRAMPs (plNRAMP): 1 Artemisia annua (NCBI: PWA53748.1), 2 Dendrobium crysotoxum (NCBI: KAH0462125.1), 3 Theobroma cacao (NCBI: XP_007047433.1), 4 Glycine max (NCBI: NP_001344702.1). Plant NRATs (plNRAT): 1 Panicum virgatum (NCBI: XP_039819678.1), 2 Zea mays (NCBI: PWZ19830.1), 3 Sorghum bicolor (NCBI: XP_002451480.2), 4 Oryza sativa (NCBI: XP_015625418.1), 5 Panicum miliaceum (NCBI: RLM80353.1), 6 Dichanthelium oligosanthes (NCBI: OEL35611.1), 7 S. italica (NCBI: XP_004952002.1). Prokaryotic NRMTs (prNRMT): 1 Eggerthella lenta (NCBI: WP_009305646.1), 2 Metanephrops australiensis (NCBI: WP_013780282.1), 3 Caldicellulosiruptor saccharolyticus (NCBI: WP_011916762.1), 4. Methanocella paludicola (NCBI: BAI61876.1).
Figure 1—figure supplement 2
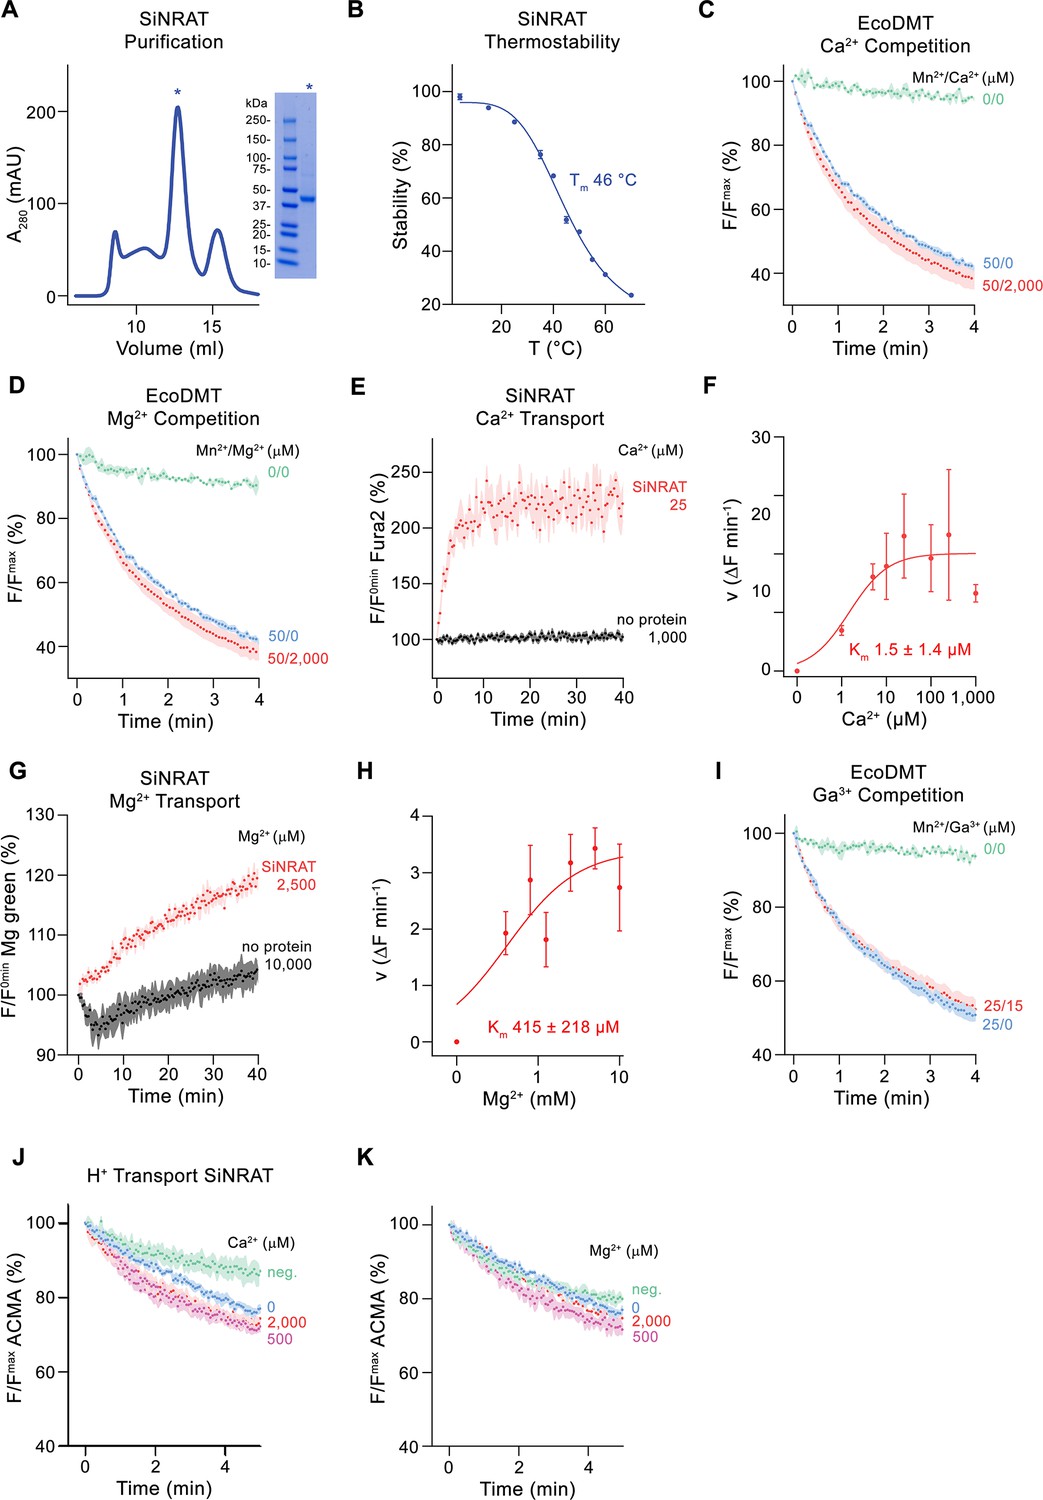
Purification and assay data.
(A) Size exclusion chromatogram of purified SiNRAT. SDS-PAGE gel of the purified peak fraction (asterisk) is shown on the right. (B) Thermal stability of SiNRAT assayed by fluorescence-based size exclusion chromatography. Data show averages of three technical replicates, errors are s.e.m. (C) Mn2+ transport in presence of Ca2+ (three experiments for the condition with 50 μM Mn2+, two experiments for the condition with no substrate and six experiments for the condition with 50 μM Mn2+ and 2000 μM Ca2+, all from two independent reconstitutions) and (D) of Mg2+ (three experiments for the condition with 50 μM Mn2+, two experiments for the condition with no substrate and six experiments for the condition with 50 μM Mn2+ and 2000 μM Mg2+, all from two independent reconstitutions) into proteoliposomes containing EcoDMT. (E) Comparison of Ca2+ import into proteoliposomes containing SiNRAT and protein-free liposomes assayed with the fluorophore Fura2 trapped inside the liposome (three experiments from three independent reconstitutions for SiNRAT in presence of 25 μM Ca2+ and eight experiments from three independent reconstitutions for empty liposomes in presence of 1000 μM Ca2+). (F) Ca2+ concentration dependence of transport. Initial velocities were derived from individual traces of experiments displayed in Figure 1E, the solid line shows the fit to a Michaelis–Menten equation with an apparent Km of 1.5±1.4 μM (with the error based on a 95% confidence interval). (G) Comparison of Mg2+ import into proteoliposomes containing SiNRAT and protein-free liposomes assayed with the fluorophore Magnesium Green (three experiments from three independent reconstitutions for all conditions). (H) Mg2+ concentration dependence of transport. Initial velocities were derived from individual traces of experiments displayed in Figure 1F, the solid line shows the fit to a Michaelis–Menten equation with an apparent Km of 415±218 μM (with the error based on a 95% confidence interval). Due to the low affinity of Magnesium Green for Mg2+, it is uncertain whether the measurements reflect the saturation of the ion binding site in SiNRAT. (I) Mn2+ transport into proteoliposomes containing EcoDMT in presence of Ga3+ (three experiments for the condition with 50 μM Mn2+, two experiments for the condition with no substrate and six experiments for the condition with 50 μM Mn2+ and 2000 μM Ca2+, all from two independent reconstitutions). (J), ( K) Experiments probing metal ion coupled H+ transport assayed with the fluorophore ACMA into proteoliposomes containing SiNRAT upon addition of (J) Ca2+ (four experiments from three independent reconstitutions for all conditions except 0.5 mM Ca2+ for which only three experiments were recorded) (K) and Mg2+ (four experiments from three independent reconstitutions for all conditions except 0.5 mM Mg2+ for which only three experiments were recorded). (B–K) Panels show mean of indicated number of experiments, errors are s.e.m. (C–E, G, and I–K) Fluorescence is normalized to the value after addition of substrate (t=0). Applied ion concentrations are indicated. Negative controls (neg.) refer to empty liposomes in presence of 2 mM Ca2+ or 2 mM Mg2+, respectively.
-
Figure 1—figure supplement 2—source data 1
Biochemistry and transport data of SiNRAT.
- https://cdn.elifesciences.org/articles/85641/elife-85641-fig1-figsupp2-data1-v1.zip
Figure 2 with 4 supplements

Structural characterization of the SiNRAT-Nb1 complex by cryo-electron microscopy (cryo-EM).
(A) Cryo-EM density of SiNRAT in complex with Nb1 at 3.66 Å viewed from within the membrane at indicated orientations with the extracellular side on top and (B) ribbon representation of the complex in the same views. (A), (B) Proteins are shown in unique colors, the density of a bound lipid with uncertain orientation in (A) is shown in gray.
Figure 2—figure supplement 1
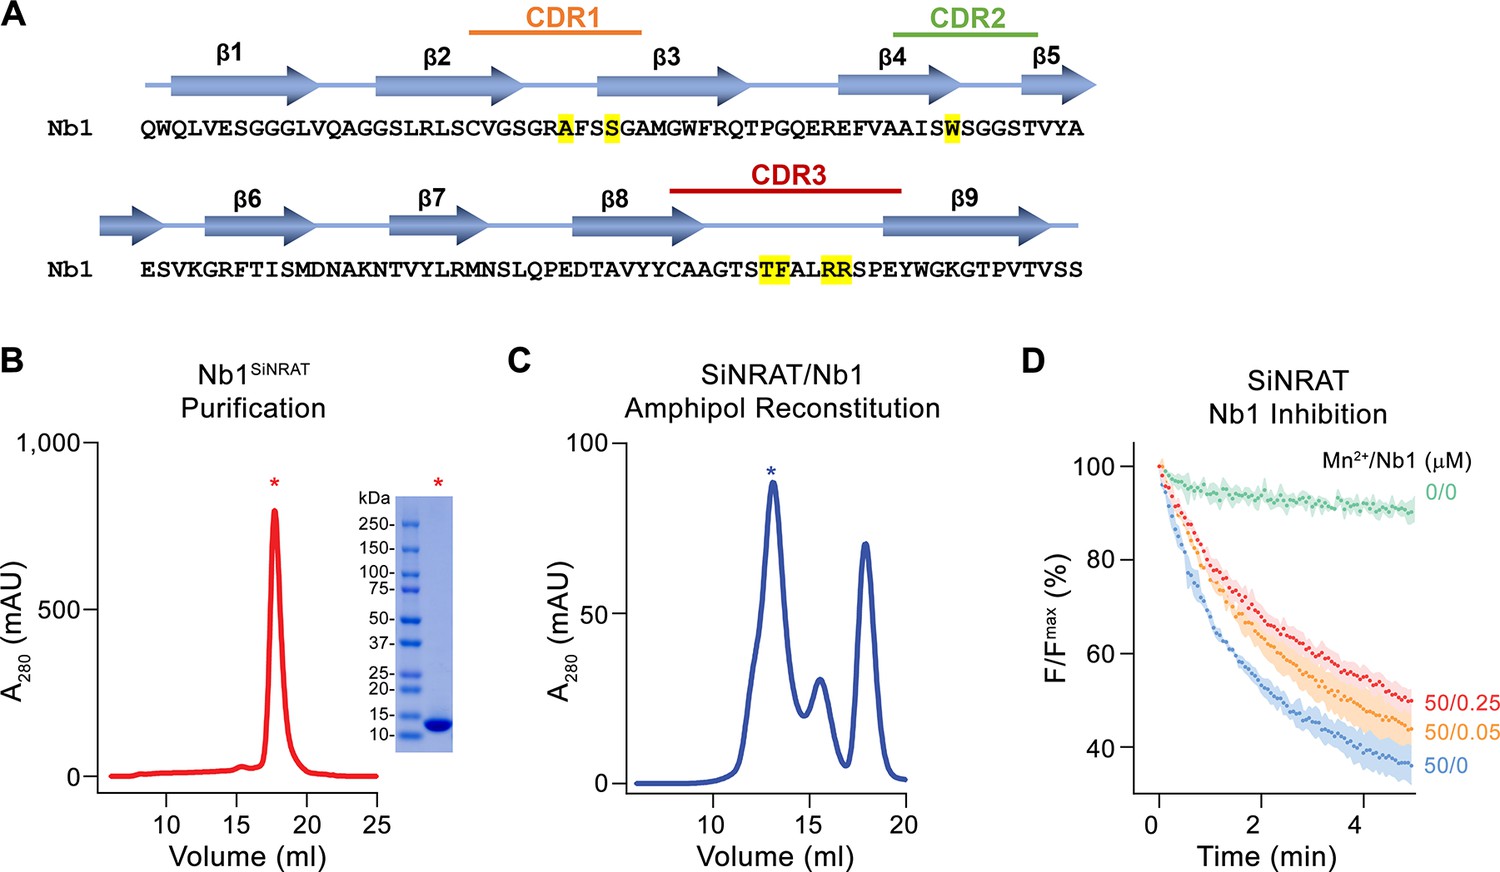
Nanobody characterization.
(A). Sequence of Nb1 with secondary structure elements shown above. Complementary determining regions (CDR) are indicated and residues in contact with SiNRAT are highlighted in yellow. (B) Size exclusion chromatogram of purified Nb1. SDS-PAGE gel of the purified peak fraction (asterisk) is shown on the right. (C) Size exclusion chromatogram of the purified SiNRAT-Nb1 complex reconstituted in amphipols. The peak fraction used for the preparation of cryo-EM grids is indicated by an asterisk. (D) Concentration-dependent inhibition of Mn2+ uptake into proteoliposomes containing SiNRAT upon addition of Nb1 to the outside. Data show mean of four experiments from two independent reconstitutions for all conditions except 0.25 μM Nb1 with five experiments, errors are s.e.m.
-
Figure 2—figure supplement 1—source data 1
Chromatograms, SDS PAGE gels and inhibition data.
- https://cdn.elifesciences.org/articles/85641/elife-85641-fig2-figsupp1-data1-v1.zip
Figure 2—figure supplement 2
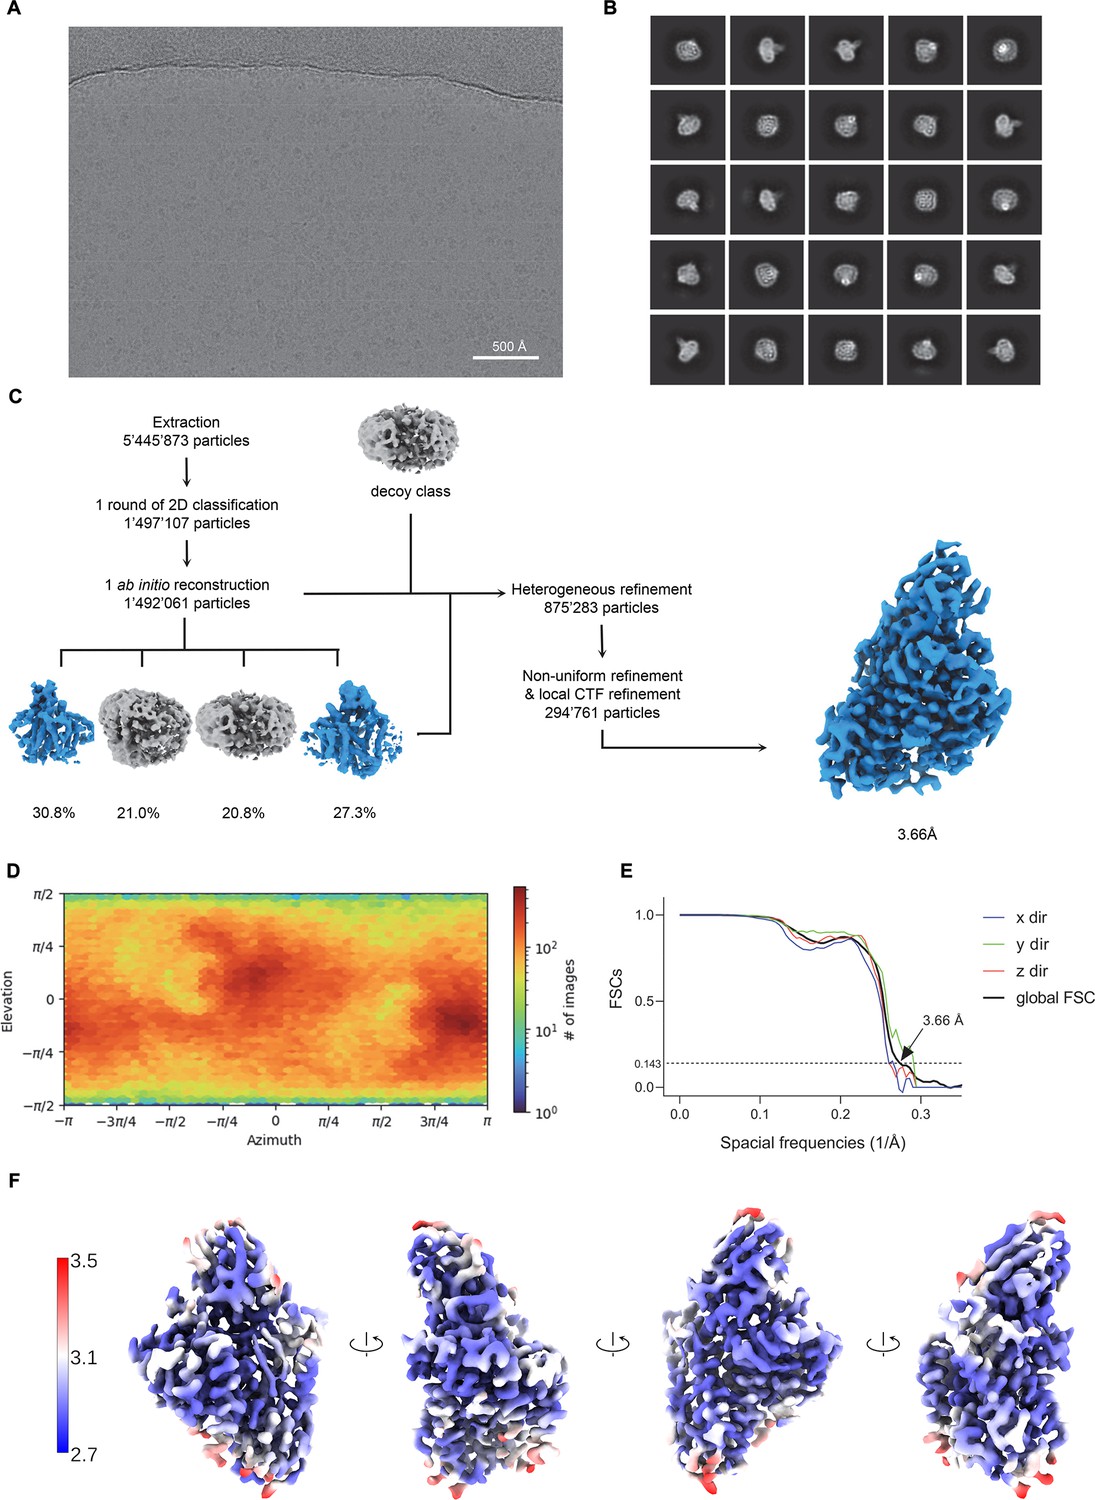
Cryo-electron microscopy (cryo-EM) reconstruction of the SiNRAT-Nb1 complex.
(A) Representative micrograph (out of a total of 16,530 images) of the complex acquired with a Titan Krios G3i microscope equipped with a K3 camera. (B) Two-dimensional (2D) class averages of the SiNRAT-Nb1 dataset. (C) Data processing workflow. After extraction and one round of 2D classification, a single ab initio reconstruction with four classes was performed. The particle distribution is indicated in %. The two most promising classes together with a decoy class were subjected to nine rounds of heterogeneous refinement. Non-uniform (NU) refinement, local CTF refinement, and a second round of NU refinement with C1 symmetry yielded a map at a resolution of 3.66 Å. (D) Angular distribution of particle orientations. The heatmap displays the number of particles for a given viewing angle. (E) Directional and global FSC plots. The global FSC is shown in black. Dashed line indicates 0.143 cut-off and the resolution at which the FSC curve drops below 0.143 is indicated. The directional FSC curves providing an estimation of anisotropy of the dataset are shown for directions x, y, and z. (F) Final 3D reconstruction of the SiNRAT-Nb1 complex in indicated orientations, colored according to the local resolution, estimated in cryoSPARC v.3.2.0.
Figure 2—figure supplement 3
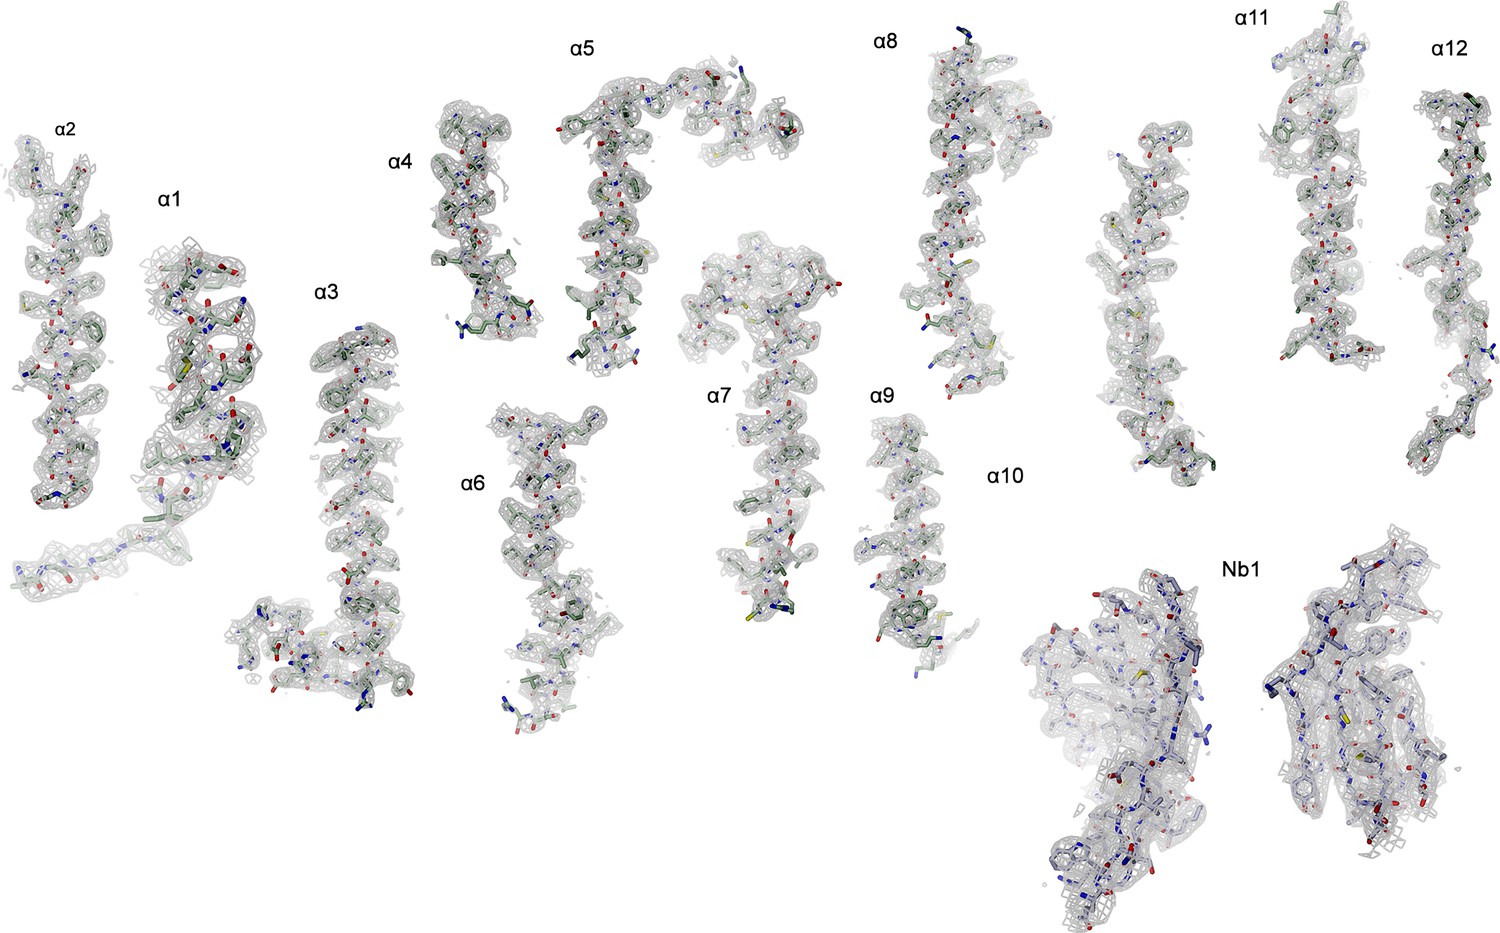
Cryo-electron microscopy (cryo-EM) density of the SiNRAT-Nb1 complex.
Cryo-EM density at 3.66 Å (contoured at 6σ, gray mesh) is shown superimposed on indicated protein regions.
Figure 2—figure supplement 4
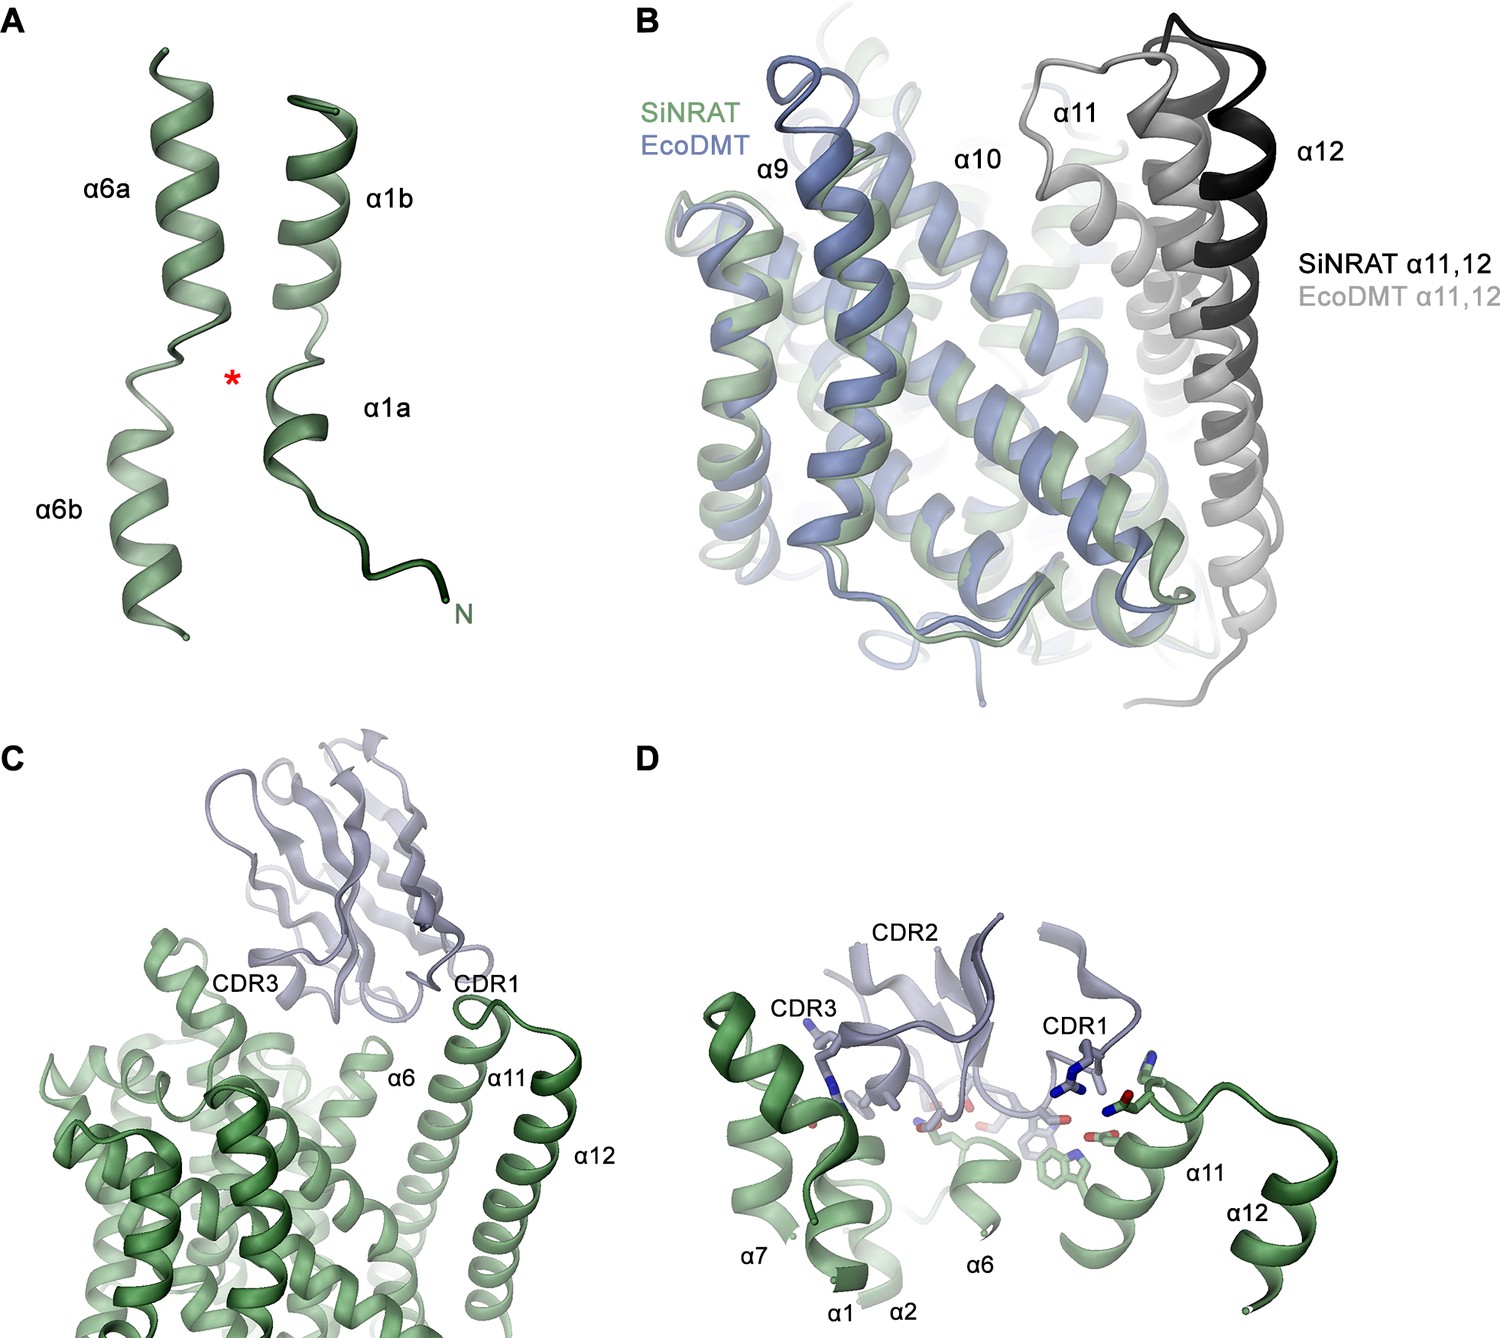
Structural features of the SiNRAT-Nb1 complex.
(A) Partially unwound α-helices 1 and 6 constituting the presumable metal ion binding site (indicated by asterisk). (B) Superposition of SiNRAT (green, black) and EcoDMT (blue gray, PDBID: 5M87) showing differences in the conformations of α-helices 11 and 12. (C) Ribbon representation of the interaction region between SiNRAT and Nb1. (D) Close-up of the interaction region with interacting side chains shown as sticks.
Figure 3 with 1 supplement
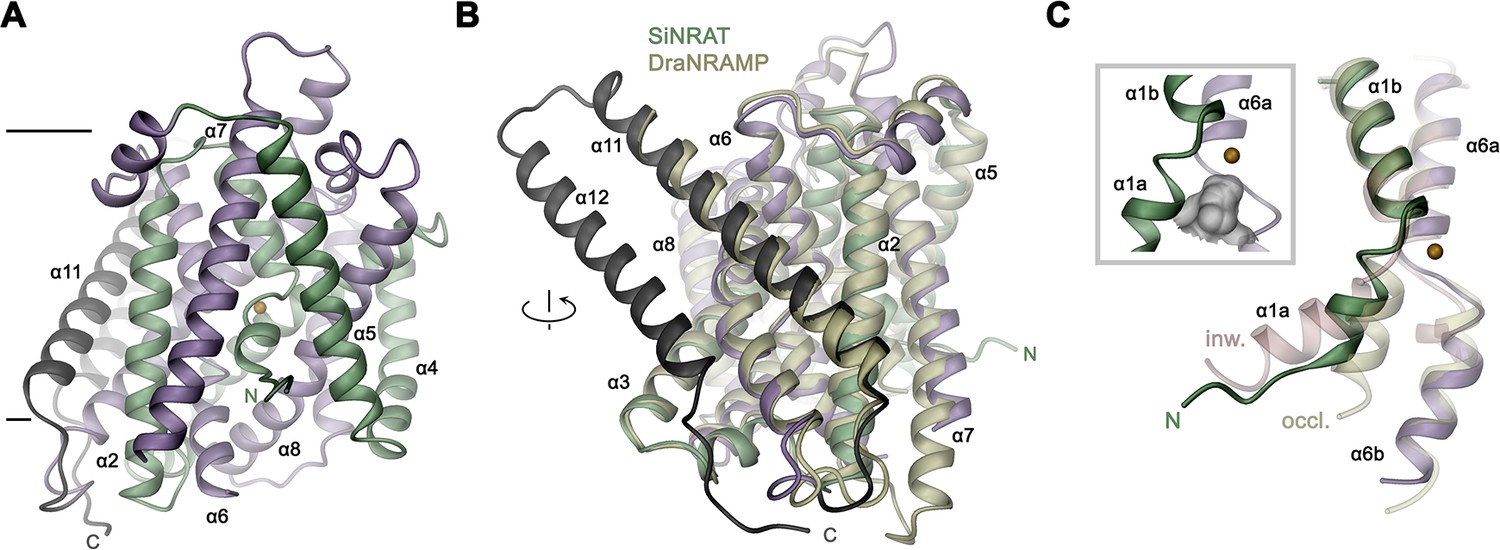
SiNRAT structure.
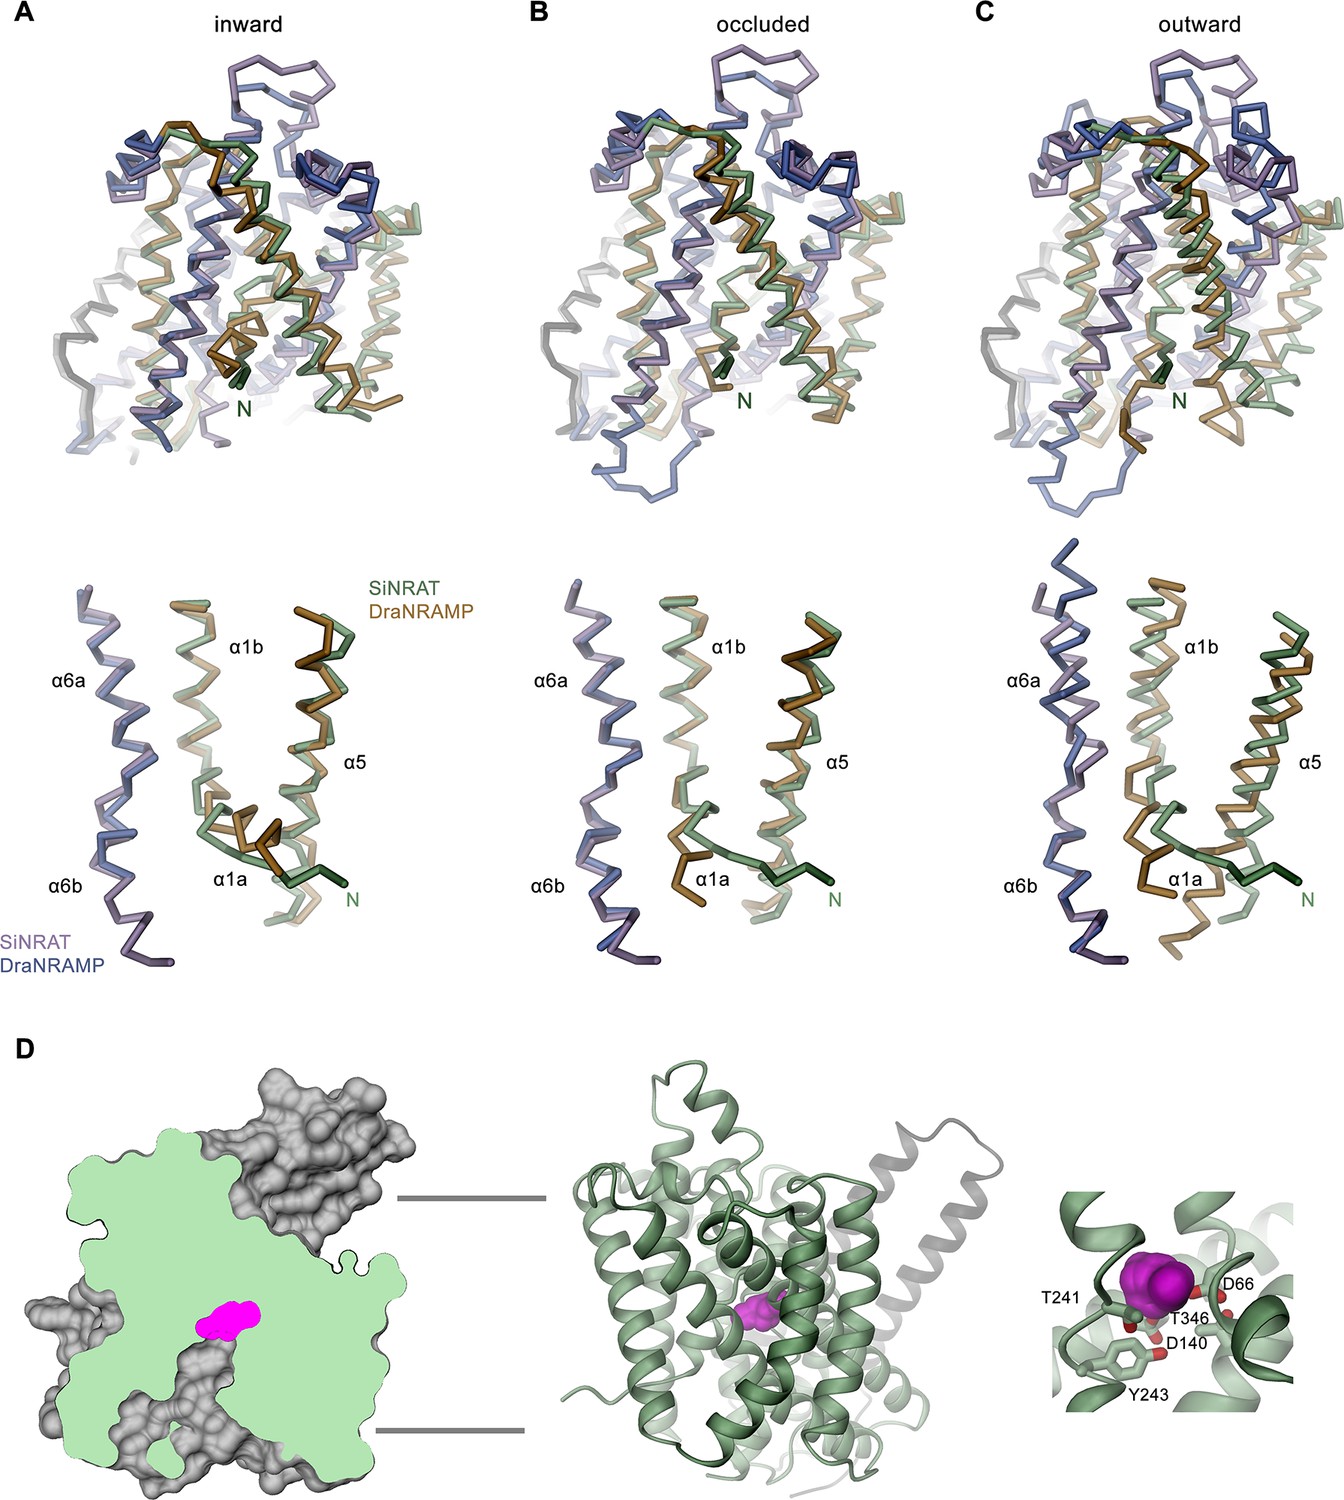
(A) Ribbon representation of SiNRAT viewed from within the membrane with membrane boundaries indicated. (B) Superposition of SiNRAT with the protein DraNRAMP in an inward-occluded conformation. The orientation compared to A is indicated. (C) Ion binding site in relation to the α-helices 1 and 6. The same helices of the superimposed structures of DraNRAMPocc (PDBID: 8E30, occl.) and DraNRAMPinw (PDBID: 6D9W, inw.) are shown for comparison. Inset (left, framed) shows the region surrounding the binding site with the molecular surface of the partially closed intracellular cavity displayed in gray. (A), (C) The position of the ion binding site is indicated by an orange sphere. (A–C) The N- and C-terminal repeats (α1–5 and a6–10) are colored in green and indigo, respectively, the terminal helices α11 and α12 in dark gray.
Figure 3—figure supplement 1
Conformational properties of SLC11 transporters.
(A–C) Cα representation of superpositions of SiNRAT and indicated conformations of DraNRAMP, (A) inward-facing (PDBID: 6D9W), (B) inward-occluded (PDBID: 8E60), (C) outward-facing (PDBID: 6BU5). Full-length proteins are shown on the top, selected helices on the bottom. (D) Slice through the molecular surface of SiNRAT (left) and ribbon representation (center) with zoom into the putative ion binding region with side chains of residues sealing the access from the intracellular side displayed as sticks (right). The occluded cavity enclosing a transported ion is shown in magenta.
Figure 4 with 1 supplement
SiNRAT metal ion binding site.
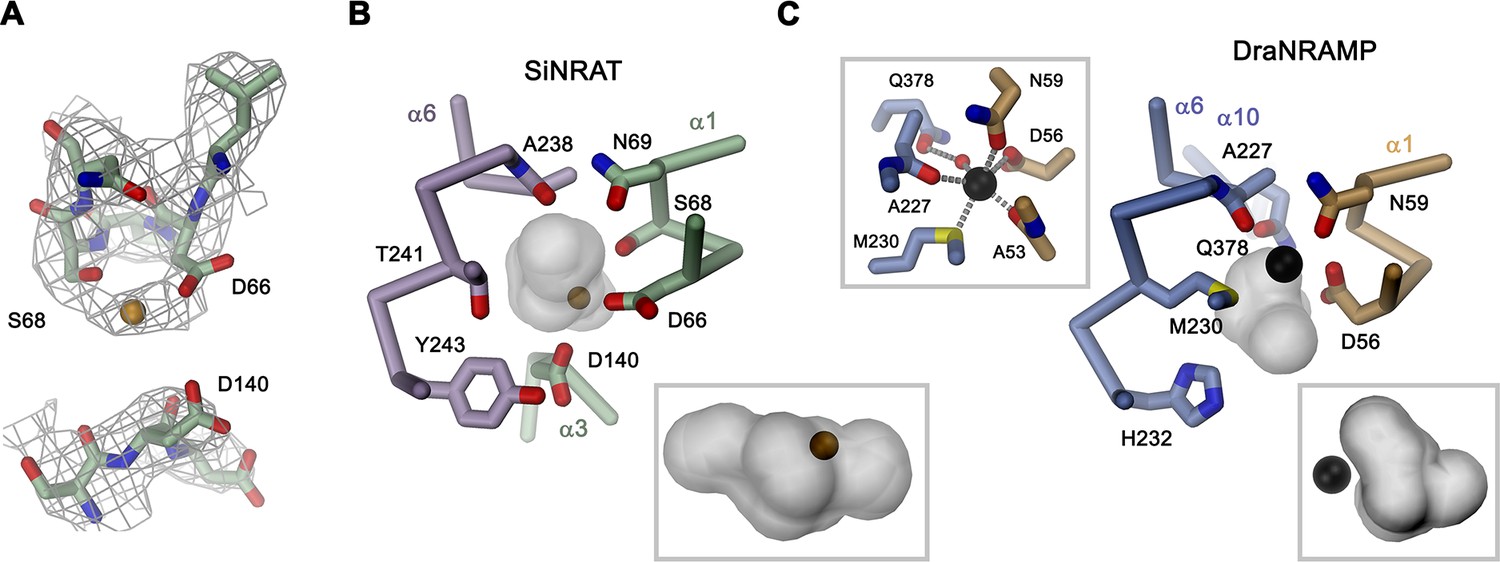
(A) Selected parts of the SiNRAT ion binding region with cryo-electron microscopy (cryo-EM) density superimposed. Top, loop connecting helices α1a and α1b. Residual density between Asp 66 and Ser 68 was used to define the presumable position of the ion binding site (with a bound ion represented as orange sphere). Bottom, density around Asp 140 located on α3. Comparison of the metal ion binding site in SiNRAT (B) and DraNRAMPocc (PDBID: 8E60) (C) viewed from within the membrane. Shown are the presumed positions of bound metal ions (spheres) and the surrounding protein as Cα trace with selected interacting side and main chain atoms labeled and displayed as sticks. In both cases, the occluded and presumably water-filled cavities surrounding the bound ions, which bury a volume of 6071 Å3 in SiNRAT and 2404 Å3 in DraNRAMP are shown as gray surfaces. Insets (marked by a gray frame, bottom right) show the same cavities viewed from the cytoplasm. In (C), a second inset (top left) shows the coordination geometry of the Mn2+ ion bound to DraNRAMP. (A–C) Residues of the N- and C-terminal repeats of both proteins are shown in unique colors.
Figure 4—figure supplement 1
Residues of potential relevance for H+ transport.
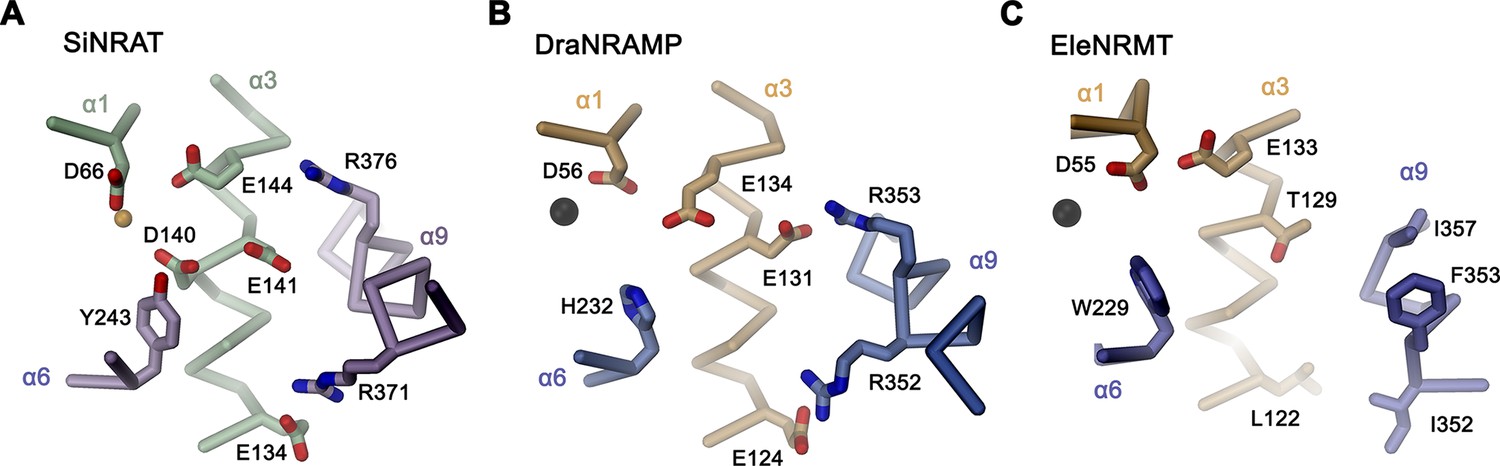
(A–C) Comparison of the corresponding regions bearing residues that were assigned a potential relevance for proton transport in NRAMPs in the uncoupled SiNRAT (A), the H+-coupled DraNRAMP (PDBID: 8E60) (B) and the uncoupled Mg2+ transporter EleNRMT (PDBID: 7QIA) (C). A region containing interacting acidic residues on α3 and basic residues on α9 in SiNRAT and DraNRAMP is lined by hydrophobic residues in EleNRMT. A conserved histidine (His 232) on α6 of DraNRAMP is replaced by a tyrosine (Tyr 243) in SiNRAT and a tryptophane (Trp 229) in EleNRMT.
Figure 5
Functional properties of binding site mutants.
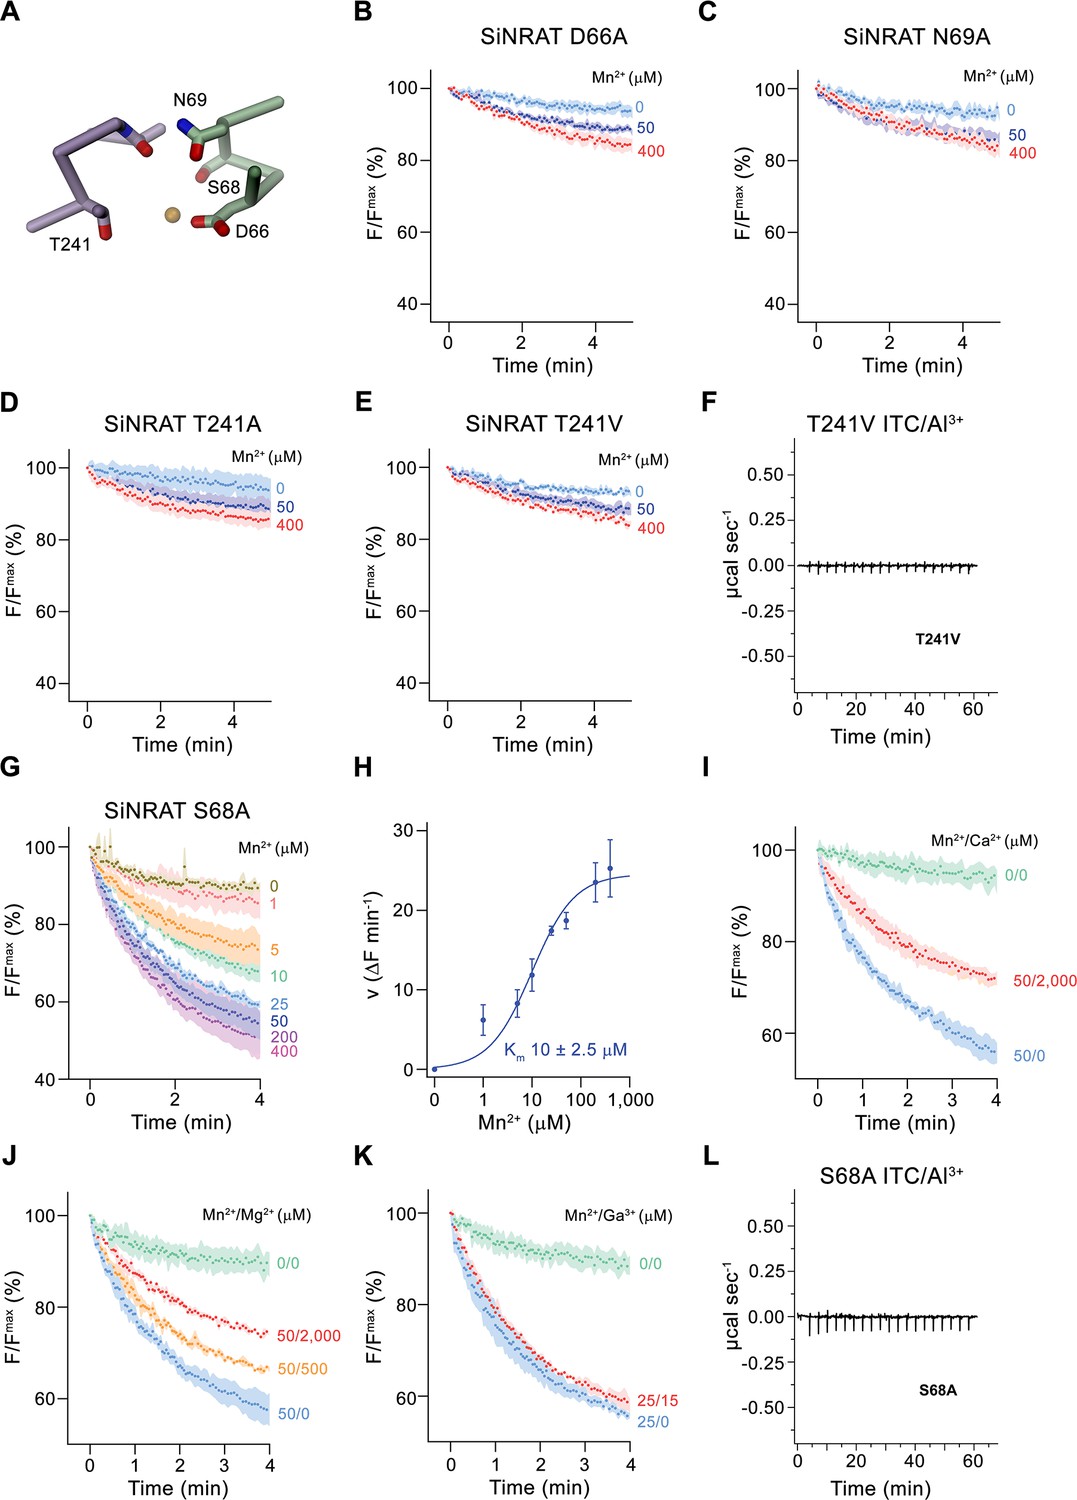
(A) Cα trace of the metal ion binding region of SiNRAT with selected residues involved in ion coordination shown as sticks. (B–E) Mn2+ transport into proteoliposomes of SiNRAT metal ion binding site mutants. (B) D66A (four experiments from three independent reconstitutions for all conditions); (C) N69A (three experiments from three independent reconstitutions); (D) T241A (four experiments from three independent reconstitutions for all conditions); (E) T241V (three experiments from three independent reconstitutions for all conditions). (F) Thermogram of Al3+ titrated to the SiNRAT mutant T241V obtained from isothermal titration calorimetry experiments. (G) Mn2+ transport into proteoliposomes containing the SiNRAT mutants S68A (three experiments from two independent reconstitutions for all conditions). (H) Mn2+ concentration dependence of transport by the mutant S68A. Data show mean of initial velocities derived from individual traces of experiments displayed in (G), errors are s.e.m., the solid line shows the fit to a Michaelis–Menten equation with an apparent Km of 10±2.5 μM. (I–K) Mn2+ transport in presence of other multivalent cations show interaction of the mutated binding site with Ca2+ and Mg2+ but not with Ga3+ at indicated ion concentrations. (I) Ca2+ (three experiments from two independent reconstitutions for all conditions); (J) Mg2+ (three experiments from two independent reconstitutions); (K) Ga3+ (three experiments from two independent reconstitutions). (L) Thermogram of Al3+ titrated to the SiNRAT mutant S68A obtained from isothermal titration calorimetry experiments. (B–E), (G), (I–K) Uptake of Mn2+ was assayed by the quenching of the fluorophore calcein trapped inside the vesicles. Panels show mean of indicated number of experiments, errors are s.e.m. Fluorescence is normalized to the value after addition of substrate (t=0). Applied ion concentrations are indicated.
-
Figure 5—source data 1
Transport and ITC data of SiNRAT mutants.
- https://cdn.elifesciences.org/articles/85641/elife-85641-fig5-data1-v1.zip
Figure 6
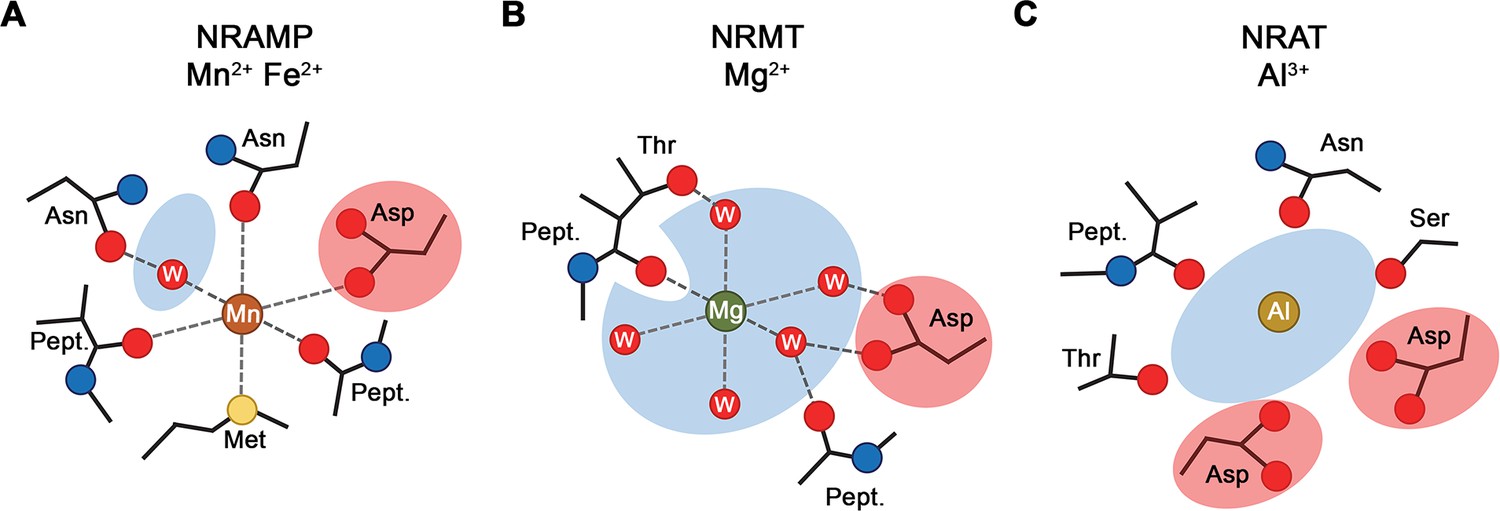
Selectivity and metal ion coordination in different clades of the SLC11 family.
(A) Coordination of Mn2+ in transition metal ion transporters (NRAMPs) of the SLC11 family as defined in the occluded conformation of the prokaryotic DraNRAMP (PDBID: 8E60). The octahedral coordination geometry is well defined. The largely dehydrated metal ion is predominantly forming direct protein interactions except for one interaction that is mediated by a bound water molecule. The thioether of a methionine serves as soft ligand in transition metal ion coordination. (B) Putative Mg2+ interaction in an NRAMP-related Mg2+ transporter (NRMT). The interactions were obtained from the inward-facing conformation of the protein EleNRMT (PDBID: 7QIA). The position of the metal ion was defined by bound Mn2+ obtained from anomalous X-ray scattering experiments, coordinating water molecules are modeled. Owing to the larger volume of the binding site, the ion has retained most of its first coordination shell and the majority of ion-protein interactions are presumably indirect. (C) Putative coordination of Al3+ in the transporter SiNRAT. The binding position was inferred from residual density in the SiNRAT cryo-electron microscopy (cryo-EM) map. The ion is placed in an aqueous cavity and likely undergoes interactions with the protein that are either direct or mediated by water molecules. A second presumably deprotonated aspartate increases the negative charge density in the binding site and thus stabilizes the greater charge density of the trivalent metal ion. (A–C) Interacting waters (W) are labeled, an aqueous cavity is indicated in blue, negatively charged groups involved in metal ion coordination are highlighted in red. Pept. refers to the interaction with the carbonyl of a peptide bond.
Tables
Table 1
Cryo-electron microscopy (cryo-EM) data collection, refinement, and validation statistics.
| Dataset 1SiNRAT-NB1(EMDB-17000)(PDB 8ONT) | |
|---|---|
| Data collection and processing | |
| Microscope | FEI Titan Krios |
| Camera | Gatan K3 GIF |
| Magnification | 130,000 |
| Voltage (kV) | 300 |
| Electron exposure (e–/Å2) | 69.739/69.63 |
| Defocus range (μm) | –1.0 to –2.4 |
| Pixel size* (Å) | 0.651 (0.3255) |
| Initial number of micrographs (no.) | 16,530 |
| Initial particle images (no.) | 5,445,873 |
| Final particle images (no.) | 294,761 |
| Symmetry imposed | C1 |
| Map resolution (Å) FSC threshold | 3.66 0.143 |
| Map resolution range (Å) | 2.8–7.0 |
| Refinement | |
| Model resolution (Å) FSC threshold | 3.7 0.5 |
| Map sharpening b-factor (Å2) | –186.3 |
| Model vs Map CC (mask) | 0.78 |
| Model composition Non-hydrogen atoms Protein residue Water Ligand (PLC) | 4381 558 1 1 |
| B factors (Å2) Protein Water Ligand | 205.39 129.77 126.19 |
| R.m.s. deviations Bond lengths (Å) Bond angles (°) | 0.003 0.386 |
| Validation MolProbity score Clashscore Poor rotamers (%) | 2.39 31.28 0.22 |
| Ramachandran plot Favored (%) Allowed (%) Disallowed (%) | 93.84 6.16 0 |
-
*
Values in parentheses indicate the pixel size in super-resolution.
Table 2
Nanobody and primer sequences.
| Name | sequence |
|---|---|
| Nanobody 1 | CAGTGGCAGTTGGTGGAGTCTGGGGGAGGATTGGTGCA GGCTGGGGGCTCTCTGAGACTCTCCTGTGTAGGCTCTGG ACGCGCCTTCAGTAGCGGCGCCATGGGCTGGTTCCGCCA GACTCCAGGGCAGGAGCGTGAGTTTGTCGCAGCTATTAGC TGGAGTGGTGGTAGTACCGTCTATGCAGAGTCCGTGAAGG GCCGATTCACCATCTCCATGGACAACGCCAAGAACACGGT GTATCTGCGAATGAACAGCCTGCAACCTGAGGACACGGCC GTTTATTACTGTGCAGCCGGGACCAGTACATTCGCACTGCG TAGGTCCCCGGAATACTGGGGCAAAGGGACCCCGGTCACC GTCTCCAGT |
| D66A primer | for: CAT TGG CTT CCT GGC TCC TAG CAA CTT G rev: CAA GTT GCT AGG AGC CAG GAA GCC AAT G |
| S68A primer | for: GGC TTC CTG GAT CCT GCC AAC TTG GAA ACT G rev: CAG TTT CCA AGT TGG CAG GAT CCA GGA AGC C |
| N69A primer | for: CTT CCT GGA TCC TAG CGC CTT GGA AAC TGA CAT G rev: CAT GTC AGT TTC CAA GGC GCT AGG ATC CAG GAA G |
| T241A primer | for: CTA TTT GGC GCT ATC ATC GCA CCG TAC AAC TTG TTC rev: GAA CAA GTT GTA CGG TGC GAT GAT AGC GCC AAA TAG |
| T241V primer | for: CTA TTT GGC GCT ATC ATC GTA CCG TAC AAC TTG TTC TTG rev: CAA GAA CAA GTT GTA CGG TAC GAT GAT AGC GCC AAA TAG |
Appendix 1—key resources table
| Reagent type (species) or resource | Designation | Source or reference | Identifiers | Additional information |
|---|---|---|---|---|
| Cell line (Homo sapiens) | HEK293S GnTI- | ATCC | CRL-3022 | Cells were checked for mycoplasma contamination |
| Cell line (Homo sapiens) | HEK293T | ATCC | CRL-3216 | Cells were checked for mycoplasma contamination |
| Chemical compound, drug | 1-Palmitoyl-2-oleoyl-sn-glycero-3-phospho-(1'rac-glycerol) (18:1 06:0 POPG) | Avanti Polar Lipids | 840457C | |
| Chemical compound, drug | 1-Palmitoyl-2-oleoyl-sn-glycero-3-phosphoethanolamine (18:1 06:0 POPE) | Avanti Polar Lipids | 850757C | |
| Chemical compound, drug | HyClone HyCell TransFx-H medium | Cytiva | SH30939.02 | |
| Chemical compound, drug | FBS | Sigma | F2442-500ML | |
| Chemical compound, drug | L-Glutamine | Thermo Fisher Scientific | 25030081 | |
| Chemical compound, drug | PEI | Fisher Scientific | NC1014320 | |
| Chemical compound, drug | PEI Max | Fisher Scientific | NC1038561 | |
| Chemical compound, drug | DMEM-Glutamax, High Glucose | Sigma | D6429 | |
| Chemical compound, drug | Triton X-100 | Sigma | Cat#T9284 | |
| Chemical compound, drug | Lysozyme | Applichem | Cat#A3711 | |
| Chemical compound, drug | Benzamidine | Sigma | B6506 | |
| Chemical compound, drug | Chloroform | Fluka | 25690 | |
| Chemical compound, drug | Egg PC | Avanti Polar Lipids | 840051C | |
| Chemical compound, drug | DDM | Anatrace | D310S | |
| Chemical compound, drug | Diethyl ether | Sigma | 296082 | |
| Chemical compound, drug | DNase I | AppliChem | A3778 | |
| Chemical compound, drug | Glycerol 99% | Sigma | G7757 | |
| Chemical compound, drug | HCl | Merck Millipore | 1.00319.1000 | |
| Chemical compound, drug | HEPES | Sigma | H3375 | |
| Chemical compound, drug | Imidazole | Roth | X998.4 | |
| Chemical compound, drug | L-(+)-arabinose | Sigma | A3256 | |
| Chemical compound, drug | Leupeptin | AppliChem | A2183 | |
| Chemical compound, drug | Pepstatin | AppliChem | A2205 | |
| Chemical compound, drug | Valinomycin | Thermo Fisher Scientific | V1644 | |
| Chemical compound, drug | Calcimycin | Thermo Fisher Scientific | A1493 | |
| Chemical compound, drug | Ionomycin | Thermo Fisher Scientific | I24222 | |
| Chemical compound, drug | Fura2 | Thermo Fisher Scientific | F1200 | |
| Chemical compound, drug | Magnesium Green | Thermo Fisher Scientific | M3733 | |
| Chemical compound, drug | ACMA | Thermo Fisher Scientific | A1324 | |
| Chemical compound, drug | CCCP | Sigma | C2759 | |
| Chemical compound, drug | Calcein | Thermo Fisher Scientific | C481 | |
| Chemical compound, drug | Phosphate buffered saline | Sigma | D8537 | |
| Chemical compound, drug | D-Desthiobiotin | Sigma | D1411 | |
| Chemical compound, drug | Strep-Tactin Superflow high capacity resin | IBA | 2-1208-010 | |
| Chemical compound, drug | Kolliphor P188 | Sigma | K4894 | |
| Chemical compound, drug | Penicillin- streptomycin | Sigma | P0781 | |
| Chemical compound, drug | Calcium chloride | Sigma | 223506 | |
| Chemical compound, drug | Manganese chloride | Fluka | 31422 | |
| Chemical compound, drug | Magnesium chloride | Fluka | 63065 | |
| Chemical compound, drug | Aluminum chloride | Sigma | 237078 | |
| Chemical compound, drug | Gallium iodide | Sigma | 399116 | |
| Chemical compound, drug | PMSF | Sigma | P7626 | |
| Chemical compound, drug | Potassium chloride | Sigma | 746346 | |
| Chemical compound, drug | Sodium chloride | Sigma | 71380 | |
| Chemical compound, drug | Terrific broth | Sigma | T9179 | |
| Commercial assay, kit | 4–20% Mini-PROTEAN TGX Precast Protein Gels, 15-well, 15 µl | Bio-Rad Laboratories | 4561096DC | |
| Commercial assay, kit | Amicon Ultra-4 Centrifugal Filters Ultracel 10K, 4 ml | Merck Millipore | UFC801096 | |
| Commercial assay, kit | Amicon Ultra-4 Centrifugal Filters Ultracel 50K, 4 ml | Merck Millipore | UFC805096 | |
| Commercial assay, kit | Amicon Ultra-4 Centrifugal Filters Ultracel 100K, 4 ml | Merck Millipore | UFC810024 | |
| Commercial assay, kit | Biobeads SM-2 adsorbents | Bio-Rad Laboratories | 152-3920 | |
| Commercial assay, kit | Avestin Extruder kit | Sigma | Cat#Z373400 | |
| Commercial assay, kit | 400 nm polycarbonate filters | Sigma | Cat#Z373435 | |
| Commercial assay, kit | 96-Well black-walled microplates | Thermo Fisher Scientific | Cat#M33089 | |
| Commercial assay, kit | Ni-NTA resin | ABT Agarose Bead Technologies | 6BCL-NTANi-X | |
| Commercial assay, kit | QuantiFoil R1.2/1.3 Au 200 mesh | Electron Microscopy Sciences | Q2100AR1.3 | |
| Commercial assay, kit | Superdex 200 10/300 GL | Cytiva | 17517501 | |
| Commercial assay, kit | Superdex 200 Increase 3.2/300 | Cytiva | 28990946 | |
| Commercial assay, kit | Superdex 200 Increase 5/150 GL | Cytiva | 28990945 | |
| Commercial assay, kit | Superdex 75 10/300 GL | Cytiva | 17517401 | |
| Other | BioQuantum Energy Filter | Gatan | NA | Electron microscope component |
| Other | HPL6 | Maximator | NA | Cell lyser |
| Other | K3 Direct Detector | Gatan | NA | Electron microscope component |
| Other | Titan Krios G3i | Thermo Fisher Scientific | NA | Electron microscope |
| Other | TECAN M1000 Infinite | TECAN | NA | Used for in vitro transport assays |
| Other | Vitrobot Mark IV | Thermo Fisher Scientific | NA | Used for freezing cryo-EM grids |
| Recombinant DNA reagent | gDNA Eremococcus coleocola | DSMZ | 15696 | |
| Recombinant DNA reagent | Bacterial expression vector with C-terminal 3C cleavage site, GFP-tag and His-tag | Dutzler laboratory | NA | |
| Recombinant DNA reagent | Mammalian expression vector with C terminal 3C cleavage site, GFP, Myc, and SBP tag | Dutzler laboratory | NA | |
| Recombinant DNA reagent | Bacterial expression vector with N terminal pelB sequence, His-tag, MBP, 3C cleavage site | Dutzler laboratory | NA | |
| Peptide, recombinant protein | HRV 3C protease | Expressed (pET_3C) and purified in Dutzler laboratory | NA | |
| Software, algorithm | 3DFSC | Tan et al., 2017 | https://3dfsc.salk.edu/ | |
| Software, algorithm | ASTRA7.2 | Wyatt Technology | https://www.wyatt.com/products/software/astra.html | RRID:SCR_016255 |
| Software, algorithm | Chimera v.1.15 | Pettersen et al., 2004 | https://www.cgl.ucsf.edu/chimera/ | RRID:SCR_004097 |
| Software, algorithm | ChimeraX v.1.1.1 | Pettersen et al., 2021 | https://www.rbvi.ucsf.edu/chimerax/ | RRID:SCR_015872 |
| Software, algorithm | Coot v.0.9.4 | Emsley and Cowtan, 2004 | https://www2.mrc-lmb.cam.ac.uk/personal/pemsley/coot/ | RRID:SCR_014222 |
| Software, algorithm | cryoSPARC v.3.0.1/v.3.2.0 | Structura Biotechnology Inc | https://cryosparc.com/ | RRID:SCR_016501 |
| Software, algorithm | DINO | http://www.dino3d.org | RRID:SCR_013497 | |
| Software, algorithm | EPU2.9 | Thermo Fisher Scientific | NA | |
| Software, algorithm | Phenix | Liebschner et al., 2019 | https://www.phenix-online.org/ | RRID:SCR_014224 |
| Software, algorithm | RELION 3.0.7 | Zivanov et al., 2018 | https://www3.mrc-lmb.cam.ac.uk/relion/ | RRID:SCR_016274 |
| Software, algorithm | WEBMAXC calculator | Bers et al., 2010 | https://somapp.ucdmc.ucdavis.edu/pharmacology/bers/maxchelator/webmaxc/webmaxcS.htm | RRID:SCR_018807 |
| Software, algorithm | JALVIEW | Waterhouse et al., 2009 | ||
| Software, algorithm | Muscle | Edgar, 2004 | ||
| Strain, strain background (Escherichia coli) | MC1061 | Thermo Fisher Scientific | C66303 |
Additional files
Download links
A two-part list of links to download the article, or parts of the article, in various formats.
Downloads (link to download the article as PDF)
Open citations (links to open the citations from this article in various online reference manager services)
Cite this article (links to download the citations from this article in formats compatible with various reference manager tools)
Structural and functional properties of a plant NRAMP-related aluminum transporter
eLife 12:e85641.
https://doi.org/10.7554/eLife.85641


