Cryo-EM structure of the endothelin-1-ETB-Gi complex
- Department of Biological Sciences, Graduate School of Science, The University of Tokyo, Japan
Figures
Figure 1 with 2 supplements
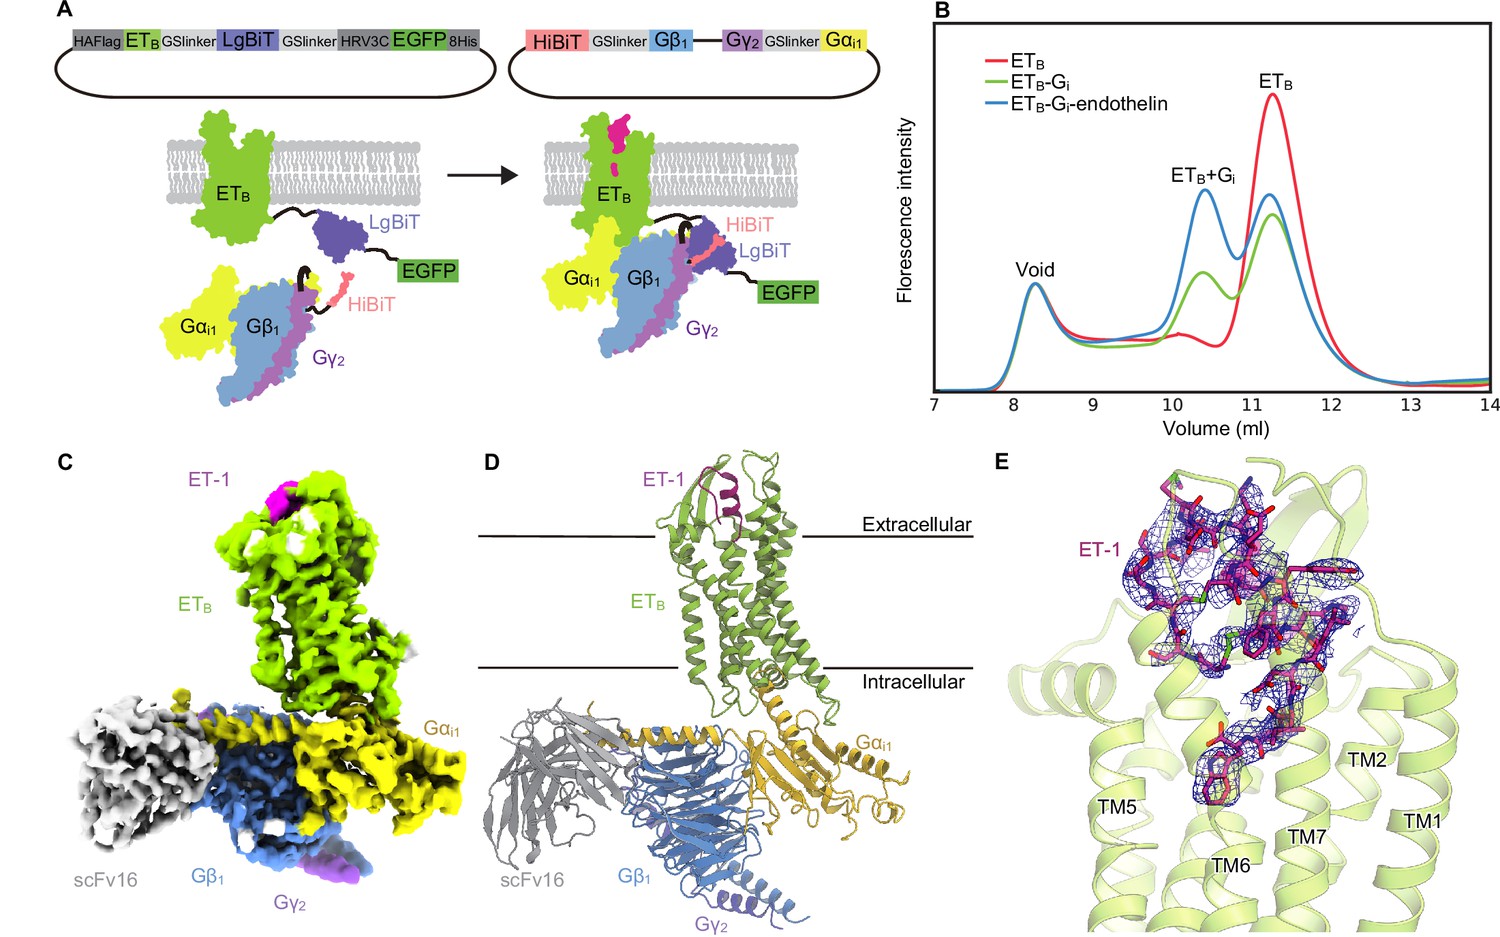
Overall structure of the ET-1-ETB-Gi signaling complex.
(A) Schematic representations of the fusion-G system. (B) Fluorescence-detection size-exclusion chromatography (FSEC) analysis of complex formation by the ETB receptor. The fluorescence intensities are adjusted to equalize those corresponding to the void volumes. (C) Cryo-electron microscopy (cryo-EM) map with variously colored densities. (D) Structure of the complex determined after refinement in the cryo-EM map, shown as a ribbon representation. (E) Density focused on ET-1.
Figure 1—figure supplement 1
Fusion-G system.
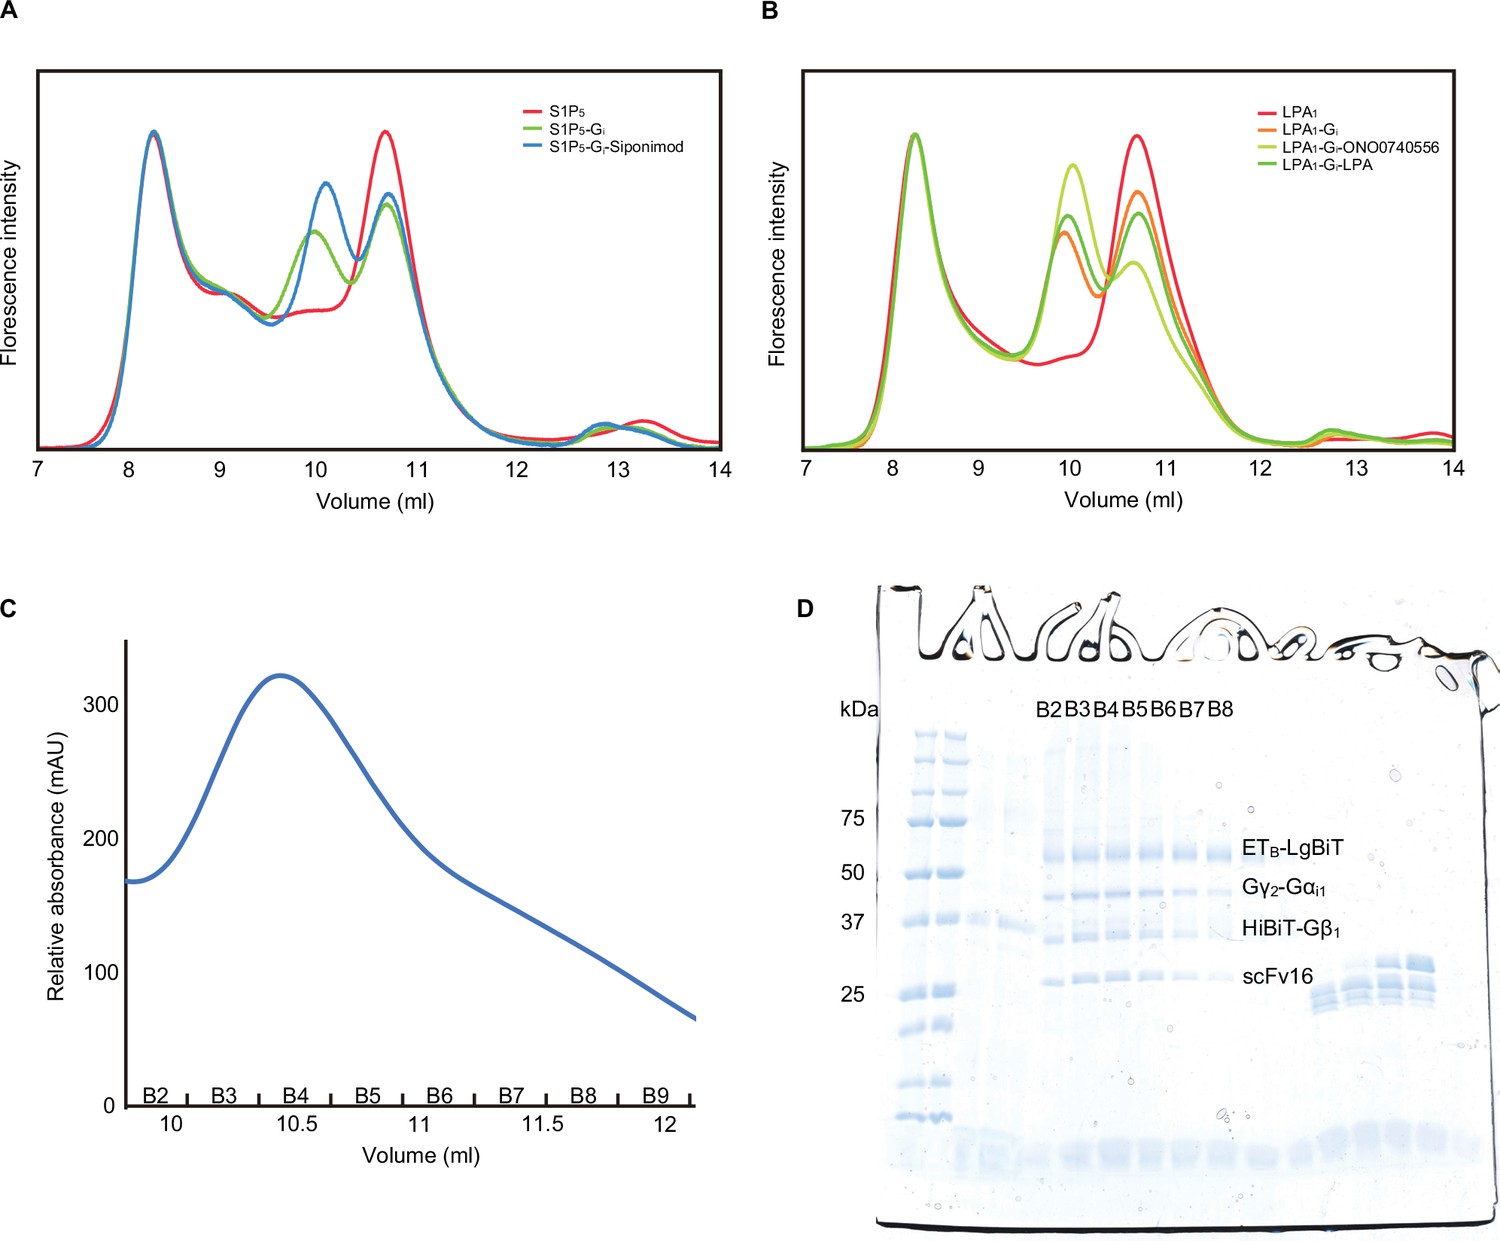
(A, B) Fluorescence-detection size-exclusion chromatography (FSEC) analysis of the complex formation of LPA1 (A) and S1P5 (B). The fluorescence intensities are adjusted to equalize those corresponding to the void volumes. When co-expressed with the Gi trimer, the peak corresponding to the complex appears on the high molecular weight side of the receptor, reflecting the basal activity and the HiBiT-LgBiT binding, independent of the G-protein. When the co-expressed cells were treated with the agonists and apyrase, the complex peak of LPA1 and S1P5 became larger, corresponding to the GPCR-G-protein complex. (C) Size-exclusion chromatography elution profiles of the ETB -Gi complex. (D) SDS-PAGE analysis of the gel filtration fractions. Although the unbound receptor was present, the complex could be separated and purified effectively.
-
Figure 1—figure supplement 1—source data 1
An uncropped image of a gel.
- https://cdn.elifesciences.org/articles/85821/elife-85821-fig1-figsupp1-data1-v1.zip
Figure 1—figure supplement 2
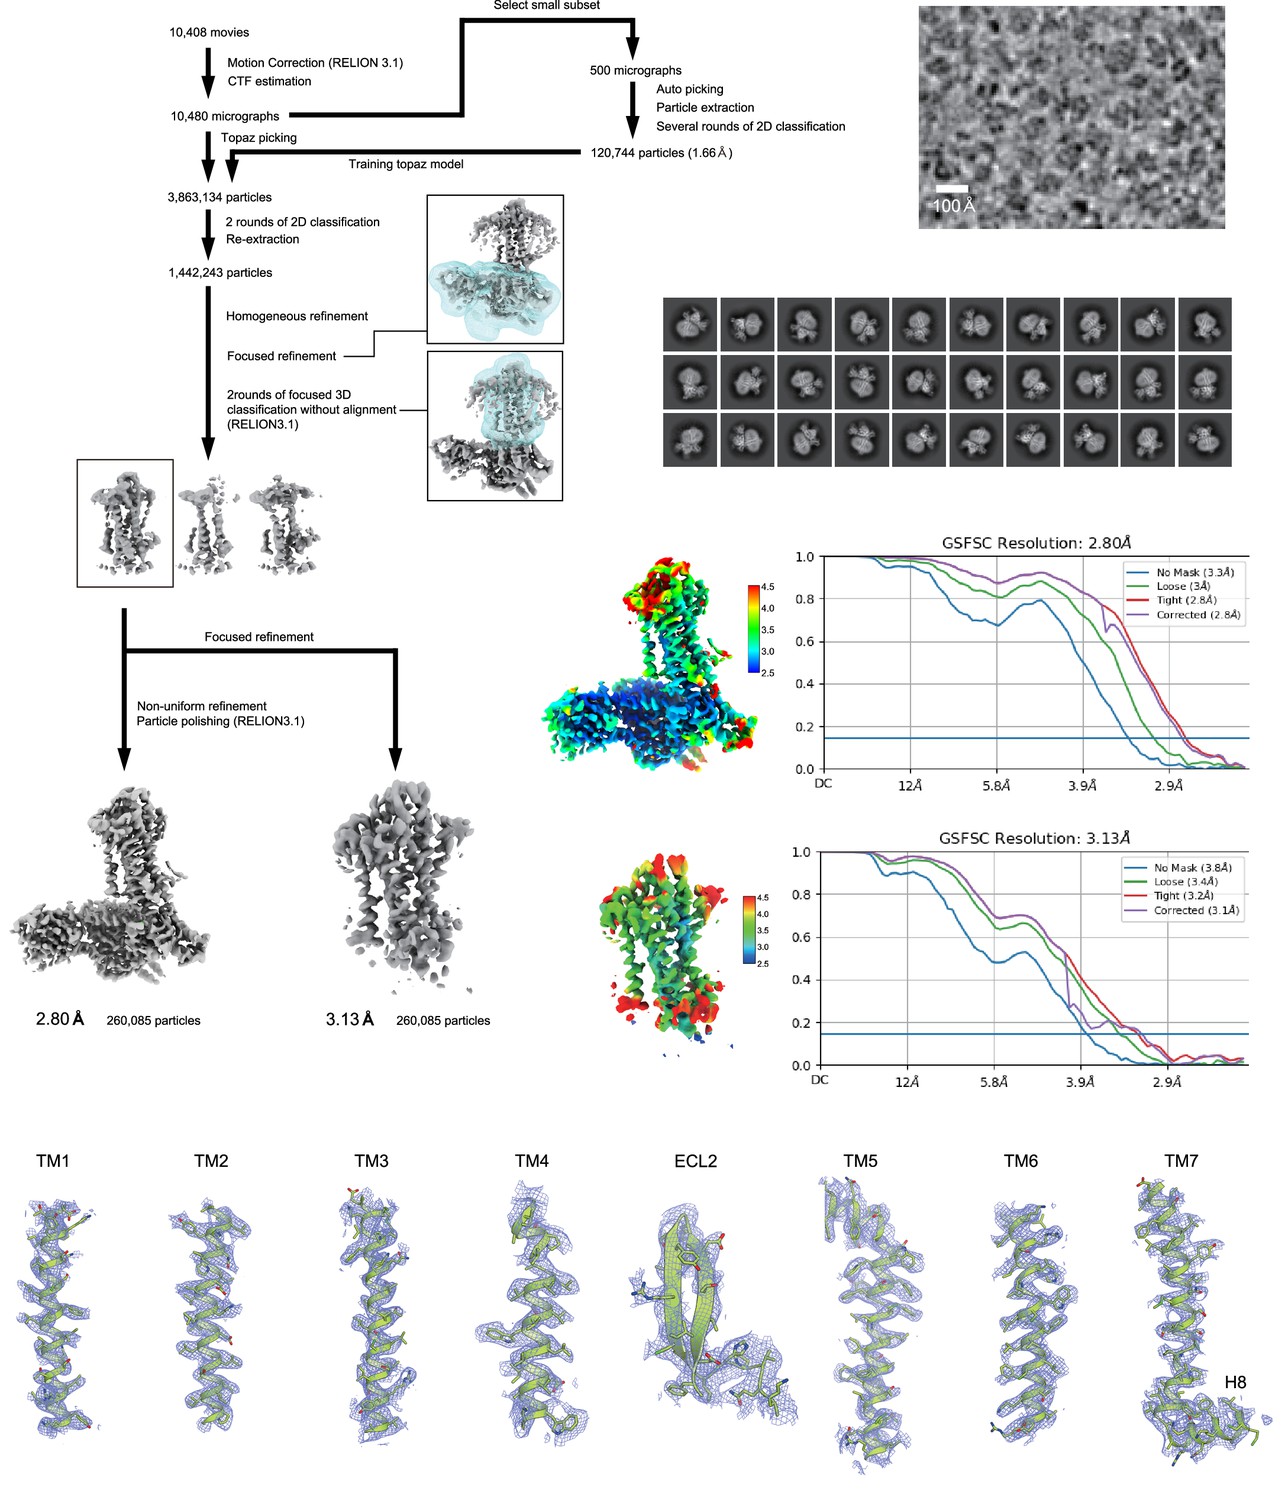
Cryo-electron microscopy (Cryo-EM) workflow, maps, and model quality.
Flow chart of the cryo-EM data processing for the ETB -Gi complex, including particle projection selection, classification, and three-dimensional (3D) density map reconstruction. Local resolution maps, FSC curves, and cryo-EM density maps are also shown. Unless otherwise noted, analysis jobs were run on cryoSPARC v3.3. Details are provided in the Methods section.
Figure 2
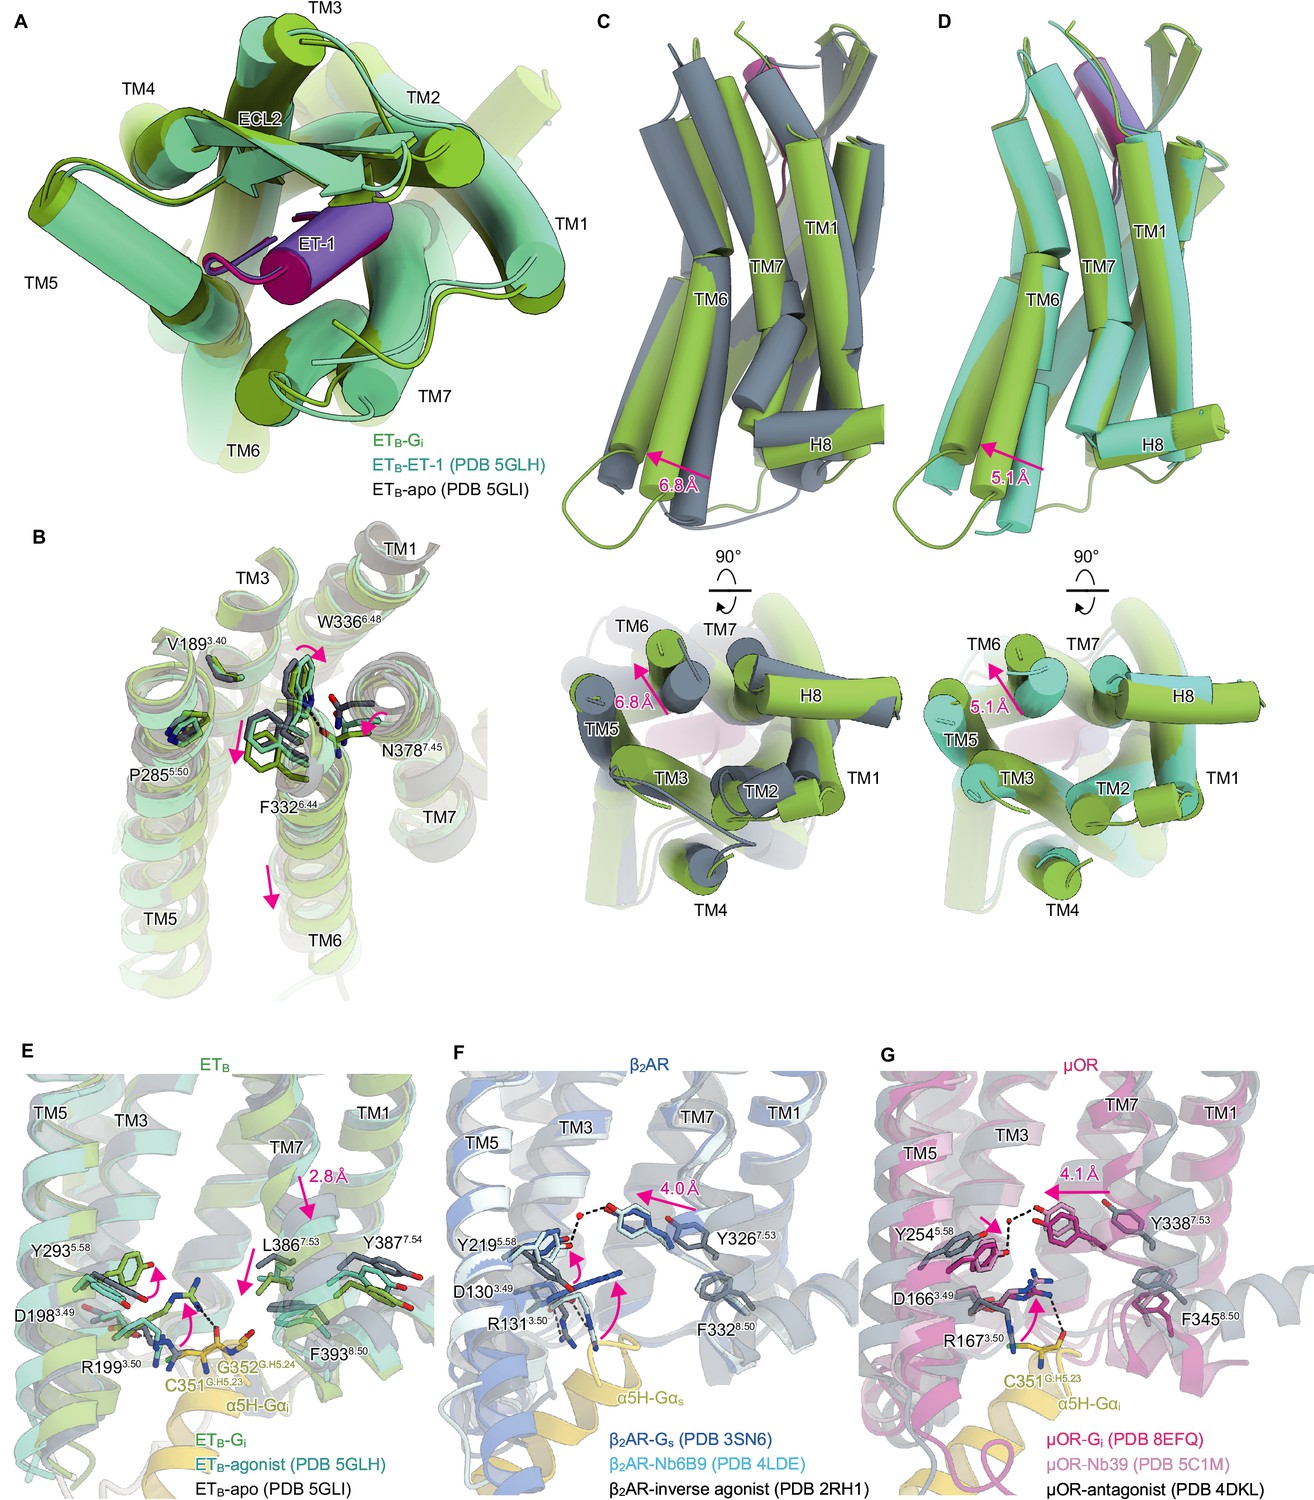
Structural changes upon G-protein activation.
(A) Superimposition of the ET-1-bound receptor in the crystal and cryo-electron microscopy (cryo-EM) structures. (B) Superimposition of the ETB structures, focused on the receptor core. (C, D) Superimpositions of the Gi-complexed ETB structure with the ET-1-bound crystal structure (C) and apo structure (D). (E-G) D3.49R3.50Y3.51 and N7.49P7.50xxY7.53 motifs in ETB (E), β2AR (F), and μOR (G). Black dashed lines indicate hydrogen bonds.
Figure 3 with 2 supplements
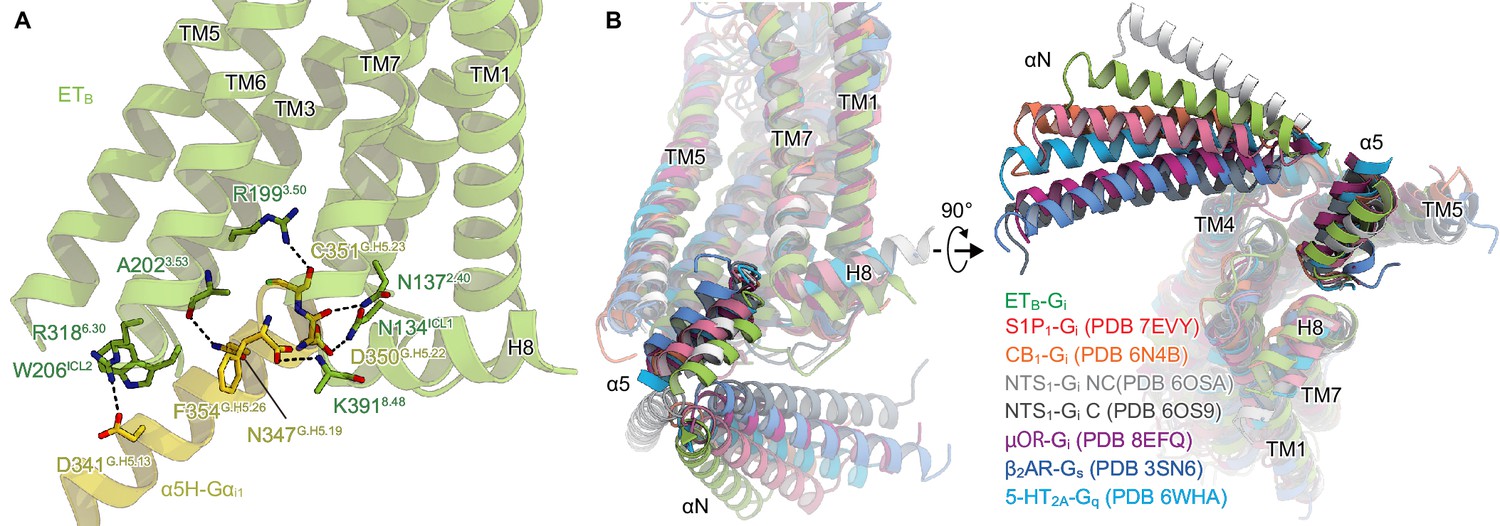
Comparison of the Gi binding modes.
(A) Hydrogen-bonding interactions between ETB and the α5-helix, indicated by black dashed lines. (B) Comparison of the Gα positions in the GPCR-G-protein complexes. The structures are superimposed on the receptor structure of the NTS1-C state.
Figure 3—figure supplement 1
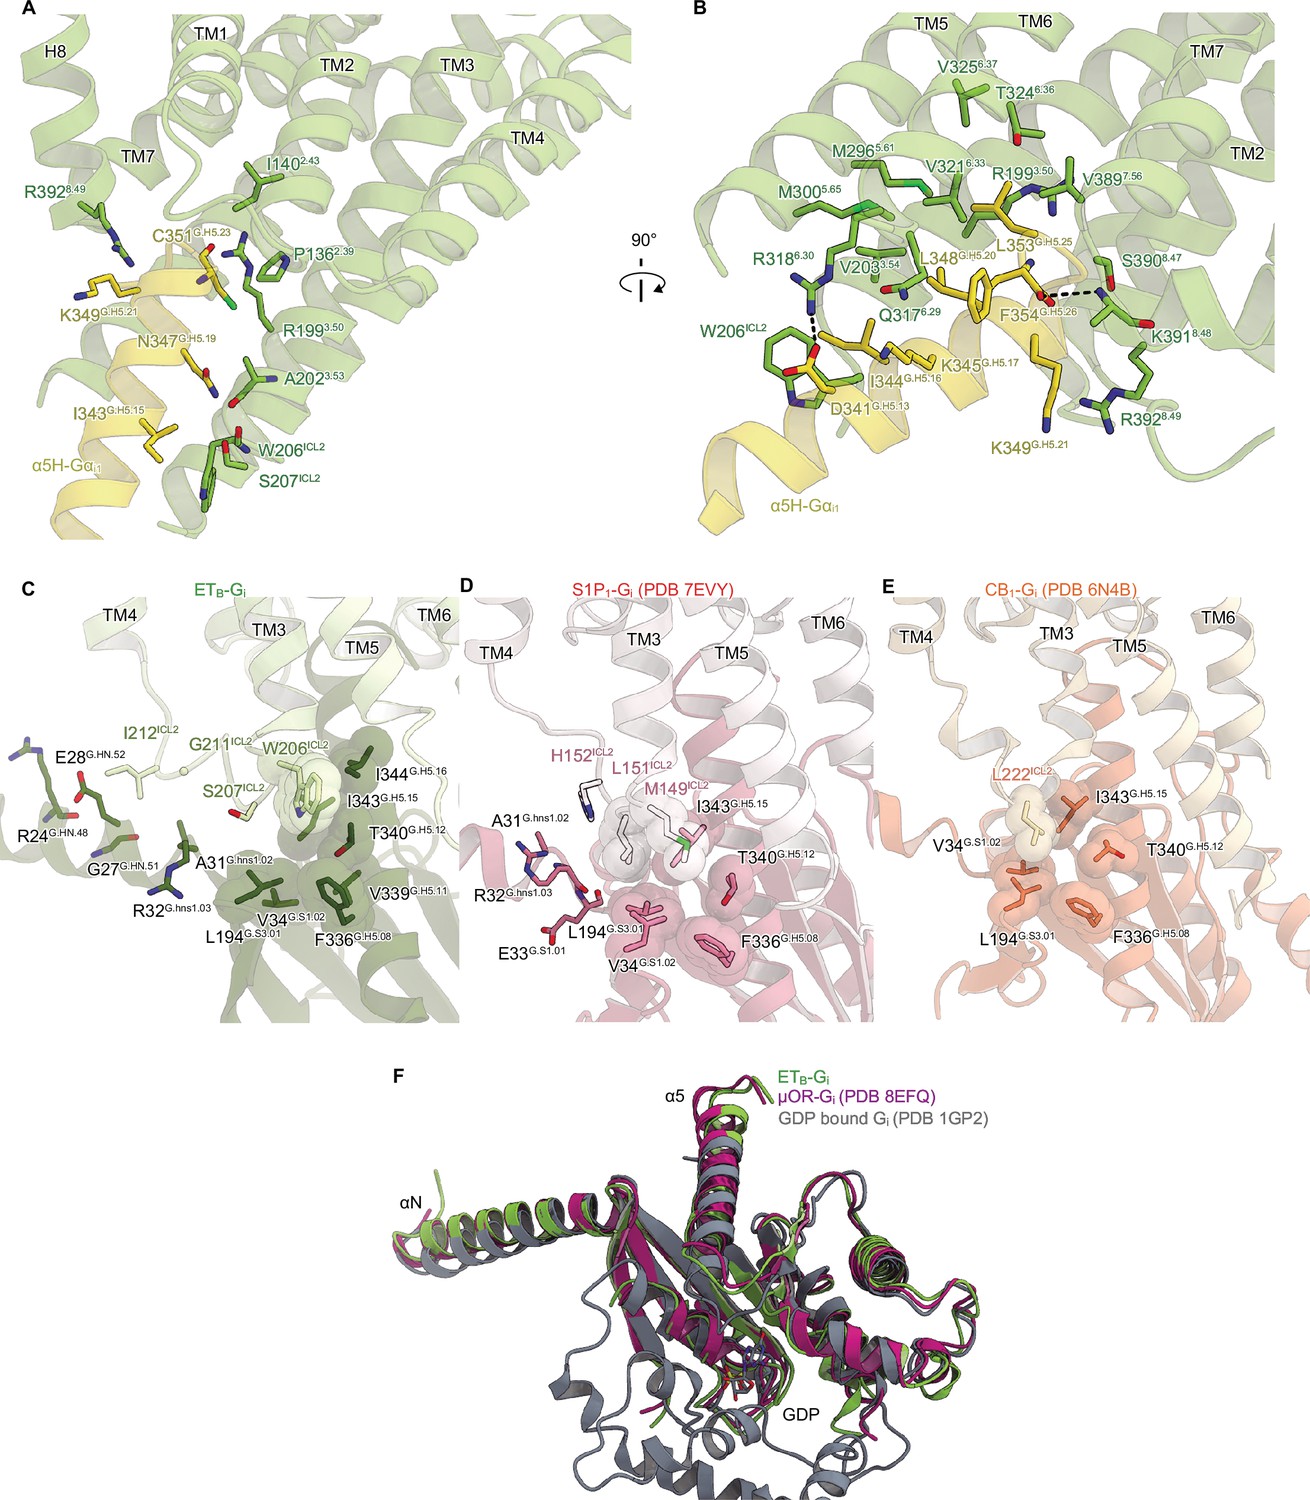
Detailed ETB-Gi interface.
(A, B) Receptor-Gi interactions within 4.5 Å. Black dashed lines indicate hydrogen bonds. (C-E) Structural comparisons of the interactions between ICL2 and Gi in ETB (C), S1P1 (D), and CB1 (E). Residues are shown as stick and CPK models. (F) Structural comparison of the Gαi1 subunits.
Figure 3—figure supplement 2
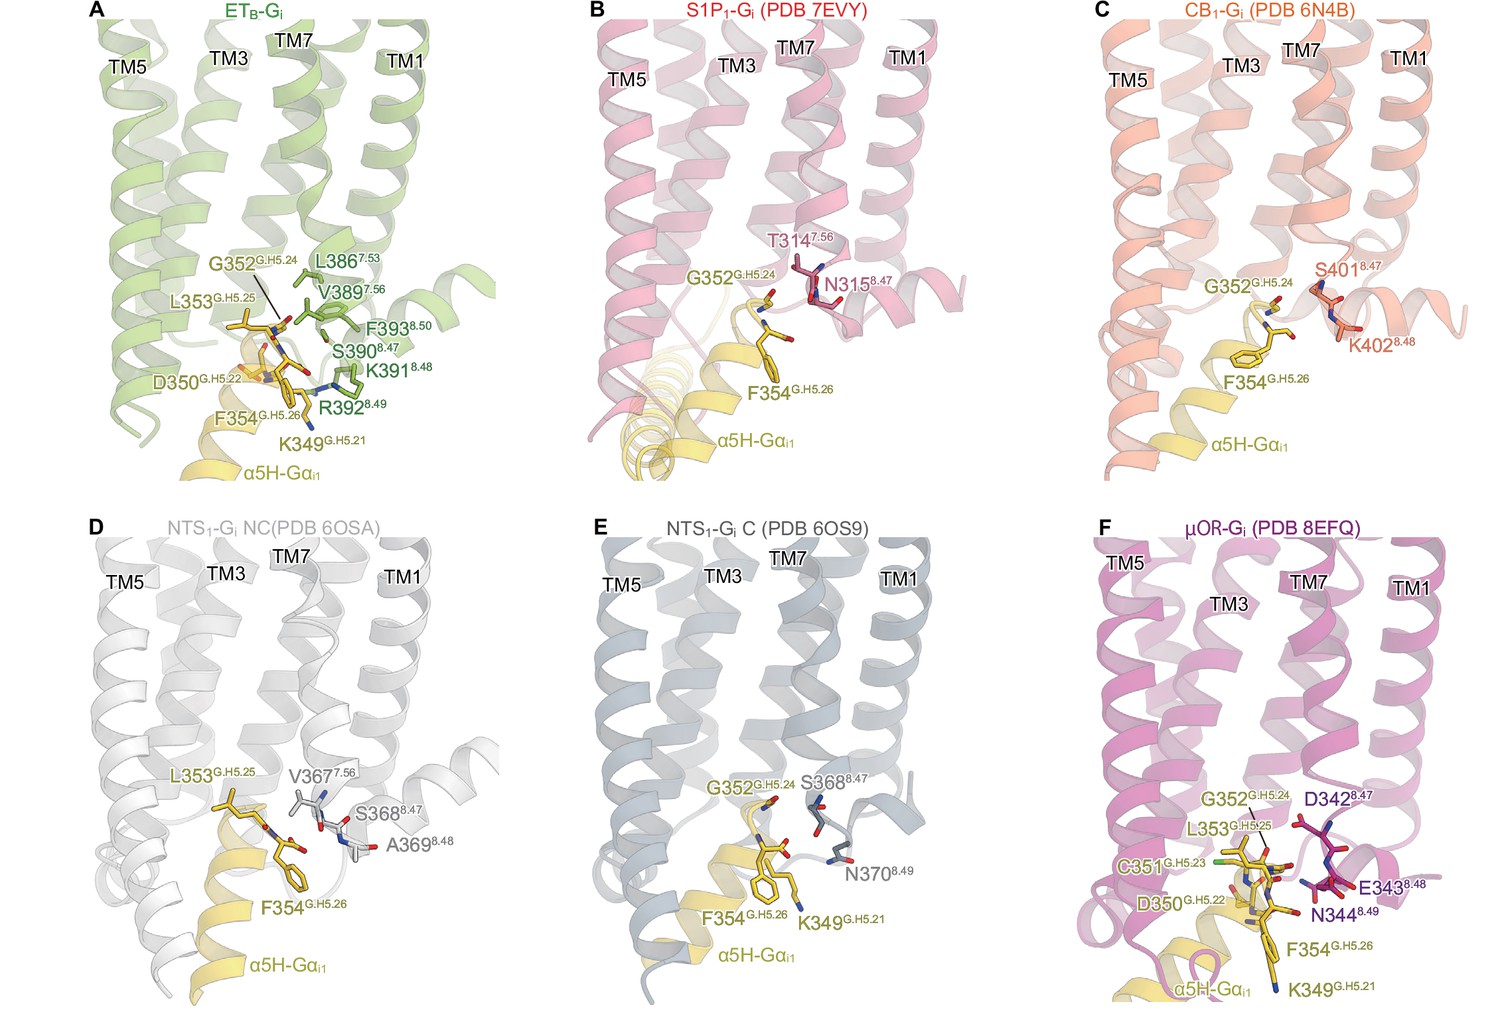
Comparison of the interactions between the α5-helix and TM7-H8.
(A-F) Interactions between the α5-helix and TM7-H8 within 4.5 Å in the respective complexes.
Tables
Table 1
Cryo-EM data collection, refinement, and validation statistics.
| Data collection | ETB-Gi (overall) | ETB-Gi (receptor focused) |
|---|---|---|
| Microscope | Titan Krios (Thermo Fisher Scientific) | |
| Voltage (keV) | 300 | |
| Electron exposure (e-/Å2) | 49.965 | |
| Detector | Gatan K3 summit camera (Gatan) | |
| Magnification | ×105,000 | |
| Defocus range (μm) | –0.8–1.6 | |
| Pixel size (Å/pix) | 0.83 | |
| Number of movies | 10,408 | |
| Symmetry | C1 | |
| Picked particles | 3,863,134 | |
| Final particles | 260,085 | |
| Map resolution (Å) | 2.80 | 3.13 |
| FSC threshold | 0.143 | |
| Model refinement | ||
| Atoms | 9,367 | 2,523 |
| R.m.s. deviations for ideal | ||
| Bond lengths (Å) | 0.002 | 0.003 |
| Bond angles (°) | 0.56 | 0.52 |
| Validation | ||
| Clashscore | 11.68 | 7.7 |
| Rotamers (%) | 0.00 | 0.00 |
| Ramachandran plot | ||
| Favored (%) | 96.55 | 98.04 |
| Allowed (%) | 3.19 | 1.96 |
| Outlier (%) | 0.26 | 0.00 |
Key resources table
| Reagent type (species) or resource | Designation | Source or reference | Identifiers | Additional information |
|---|---|---|---|---|
| peptide, recombinant protein | ET-1 | PEPTIDE INSTITUTE, INC. | Cat #, 4198 v | Ligand for ETB |
| Other | Sf-900 II SFM | Thermo Fisher Scientific | Cat #, 10902088 | Expression medium for sf9 cells |
| chemical compound, drug | n-dodecyl-β-D-maltoside | Calbiochem | CAS number: 69227-93-6 | Detergents used in purification of ETB-Gi complex |
| chemical compound, drug | Cholesteryl hemisuccinate | Merck Millipore | CAS number: 1510-21-0 | For purifying ETB-Gi complex |
| peptide, recombinant protein | Apyrase | New England Biolabs | Cat #, M0398 | Enzyme used for ETB-Gi complex formation |
| Other | Anti-DYKDDDDK G1 Affinity resin | Gen Script | Cat #, L00432 | Affinity resin for DYKDDDDK tags |
| chemical compound, drug | Lauryl Maltose Neopentyl Glycol | Anatrace | CAS number: 1257852-96-2 | Detergents used in purification of ETB-Gi complex |
| Software, algorithm | EPU | Thermo Fisher Scientific | For Cryo-EM data collection | |
| Software, algorithm | RELION-3.1 | Zivanov et al., 2018 | RRID:SCR_016274 | For Cryo-EM data processing |
| Software, algorithm | cryoSPARC v3.3 | STRUCTURA BIOTECHNOLOGY | RRID:SCR_016501 | For cryo-EM data processing |
| Software, algorithm | Coot | Emsley et al., 2010 | RRID:SCR_014222 | For structure model building |
| Software, algorithm | Phenix 1.19–4092 | Afonine et al., 2018 | RRID:SCR_014224 | For structure refinement |
| other | Quantifoil holey carbon grid | Quantifoil | R1.2/1.3, Au, 300 mesh | For cryo-EM specimen preparation |
Additional files
Download links
A two-part list of links to download the article, or parts of the article, in various formats.
Downloads (link to download the article as PDF)
Open citations (links to open the citations from this article in various online reference manager services)
Cite this article (links to download the citations from this article in formats compatible with various reference manager tools)
Cryo-EM structure of the endothelin-1-ETB-Gi complex
eLife 12:e85821.
https://doi.org/10.7554/eLife.85821


