Resting-state alterations in behavioral variant frontotemporal dementia are related to the distribution of monoamine and GABA neurotransmitter systems
- Institute of Neuroscience and Medicine, Brain & Behaviour (INM-7), Research Centre Jülich, Germany
- Institute of Systems Neuroscience, Medical Faculty, Heinrich Heine University Düsseldorf, Germany
- Max Planck Institute for Human Cognitive and Brain Sciences, Germany
- LVR-Klinikum Düsseldorf, Germany
- Medical Faculty, Ludwig-Maximilians-Universität, Germany
- Department for Nuclear Medicine, University Hospital Leipzig, Germany
- Department of Neurology, Saarland University Hospital, Germany
- Department of Psychiatry and Psychotherapy, University Hospital Bonn, Germany
- German Center for Neurodegenerative Diseases (DZNE), Germany
- Department of Psychiatry and Psychotherapy, University Hospital Erlangen, Friedrich-Alexander-University Erlangen-Nuremberg, Germany
- Department of Neurology, University Medicine Rostock, Germany
- Department of Neurodegenerative Diseases, Center of Neurology, Hertie Institute for Clinical Brain Research, Germany
- Department of Psychiatry and Psychotherapy, University Medical Center Göttingen (UMG), Medical University Göttingen, Germany
- Neurosciences and Signaling Group, Institute of Biomedicine (iBiMED), Department of Medical Sciences, University of Aveiro, Portugal
- Department of Psychiatry and Psychotherapy, Technical University of Munich, Germany
- kbo-Inn-Salzach-Klinikum, Clinical Center for Psychiatry, Psychotherapy, Psychosomatic Medicine, Geriatrics and Neurology, Germany
- Department of Neurology, Ulm University, Germany
- Department of Neurology, Martin-Luther-University Halle-Wittenberg, Germany
- Department of Neurology, Max Planck Institute for Human Cognitive and Brain Sciences, Germany
- Clinic for Cognitive Neurology, University Hospital Leipzig, Germany
Figures
Figure 1 with 2 supplements
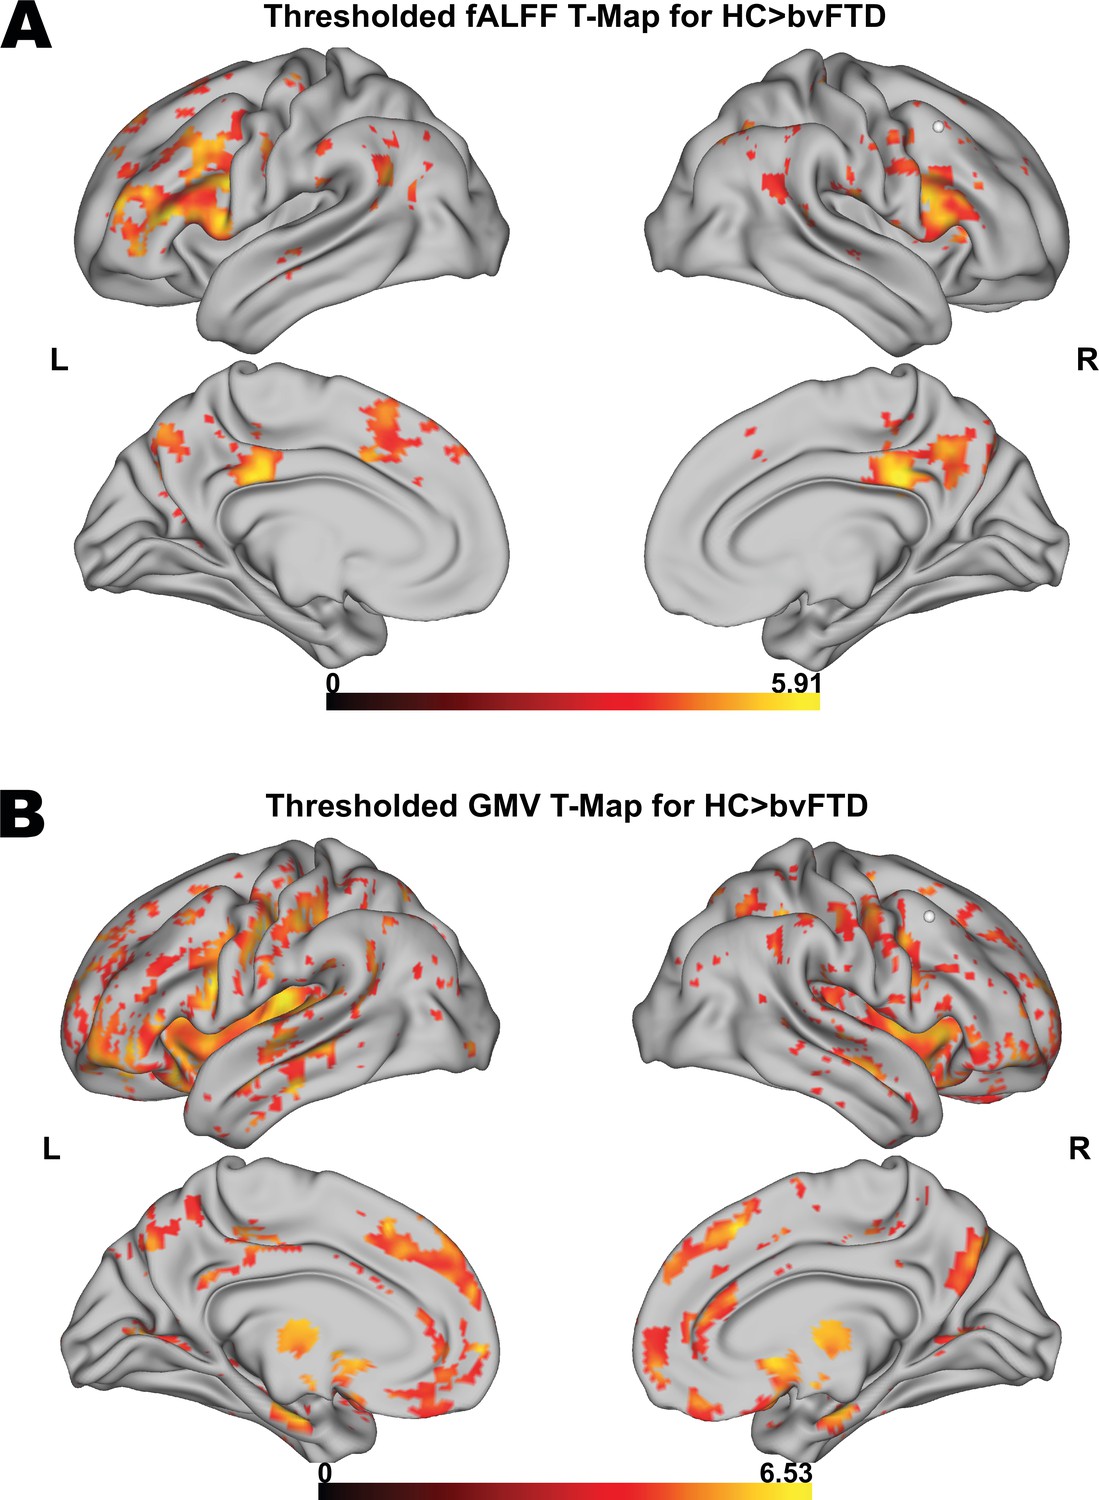
Voxel-wise results for fractional amplitude of low-frequency fluctuation (fALFF) and gray matter volume (GMV) group comparisons.
Thresholded fALFF t-map (A) and thresholded GMV t-map (B) for healthy control (HC; N = 22) > behavioral variant frontotemporal dementia (bvFTD; N = 52) using a permutation-based threshold (1000 permutations permuting group labels) at cluster-level p < 0.05 and voxel-level p < 0.001.
Figure 1—figure supplement 1
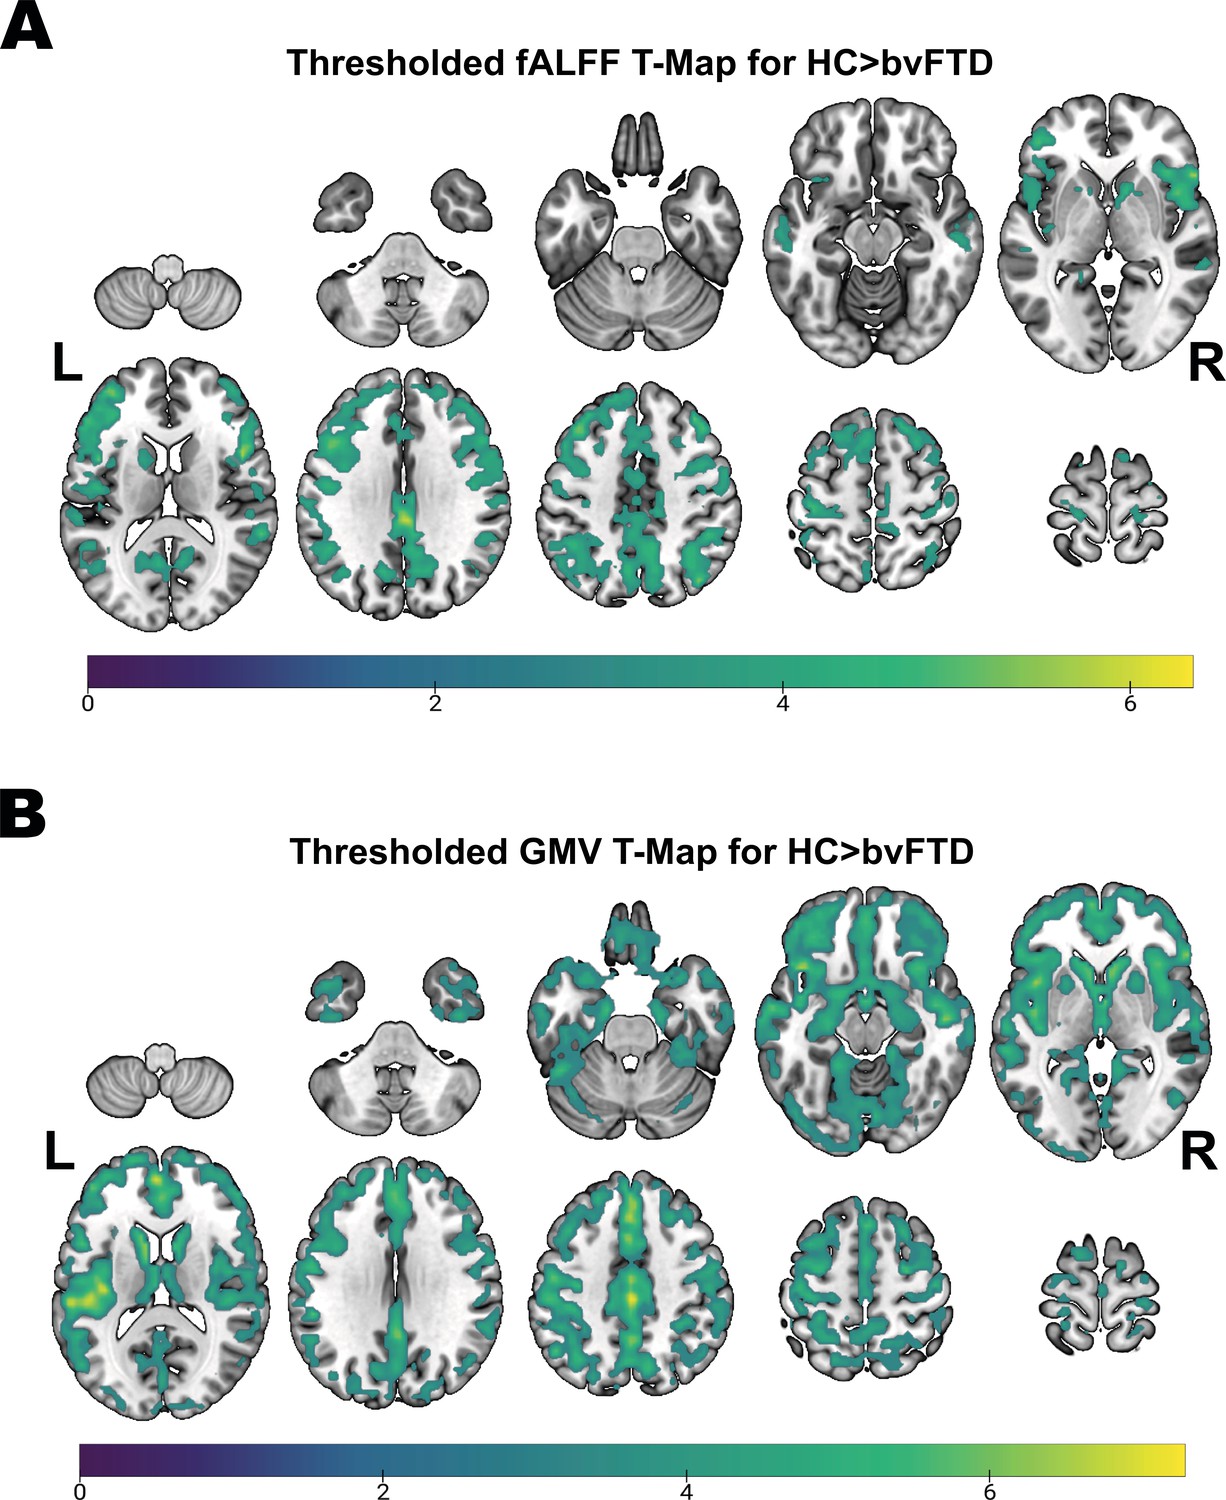
Detailed voxel-wise results for fractional amplitude of low-frequency fluctuation (fALFF) and gray matter volume (GMV) group comparisons.
Thresholded fALFF t-map (A) and thresholded GMV t-map (B) for healthy control (HC; N = 22) > behavioral variant frontotemporal dementia (bvFTD; N = 52) using a permutation-based threshold (1000 permutations permuting group labels) at cluster-level p < 0.05 and voxel-level p < 0.001.
Figure 1—figure supplement 2
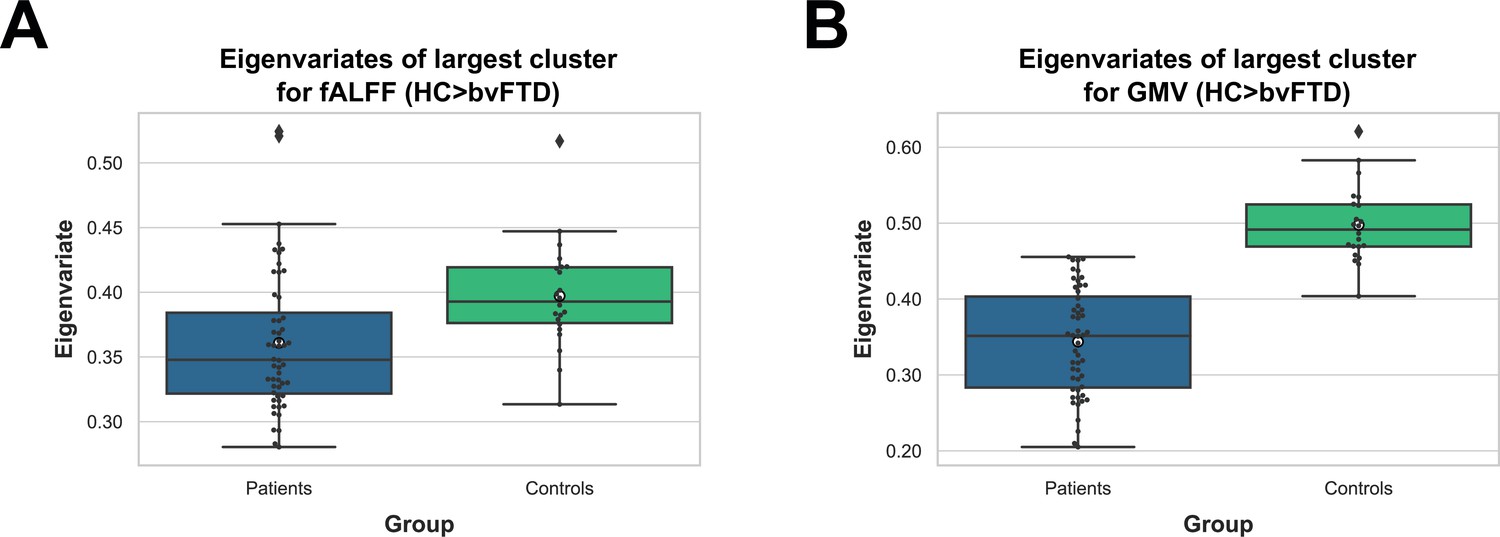
Eigenvariates from fractional amplitude of low-frequency fluctuation (fALFF) and gray matter volume (GMV) for behavioral variant frontotemporal dementia (bvFTD) patients and controls.
Eigenvariates were derived from the largest cluster in the healthy control (HC; N = 22) > behavioral variant frontotemporal dementia (bvFTD; N = 52) contrasts for fALFF (A) and GMV (B). Means are represented by white circles.
-
Figure 1—figure supplement 2—source data 1
Eigenvariates of fractional amplitude of low-frequency fluctuation (fALFF) and gray matter volume (GMV) for largest clusters of healthy control (HC) > behavioral variant frontotemporal dementia (bvFTD) t-contrasts shown in Figure 1—figure supplement 2.
- https://cdn.elifesciences.org/articles/86085/elife-86085-fig1-figsupp2-data1-v1.xlsx
Figure 2 with 1 supplement

Results of spatial correlation analyses with in vivo and mRNA data.
Correlation of fractional amplitude of low-frequency fluctuation (fALFF) (A) and gray matter volume (GMV) (B) with spatial distribution of neurotransmitter systems incl. 95% confidence intervals. Correlations of Verbal Fluency (N = 49) (C) and Mini Mental State Exam (N = 50) (D) with fALFF–neurotransmitter strength of association incl. bootstrapped 95% confidence intervals. Correlations of fALFF with mRNA gene expression maps (N = 52) (E). Statistically significant correlations in (A), (B), and (E) are marked in red and means are represented by white circles. Black circles in (A), (B), and (E) represent individual Fisher’s z-transformed Spearman correlation coefficients for each patient (N = 52) relative to controls with each neurotransmitter map. Colored circles in (C) and (D) represent individual Fisher’s z-transformed Spearman correlation coefficients between fALFF–neurotransmitter correlations and each neuropsychological scale. The statistical significance of all correlation coefficients was evaluated at p < 0.05 including FDR correction for (A), (B), and (E).
-
Figure 2—source data 1
Fisher’s z-transformed Spearman correlation coefficients shown in Figure 2A–E.
- https://cdn.elifesciences.org/articles/86085/elife-86085-fig2-data1-v1.xlsx
Figure 2—figure supplement 1
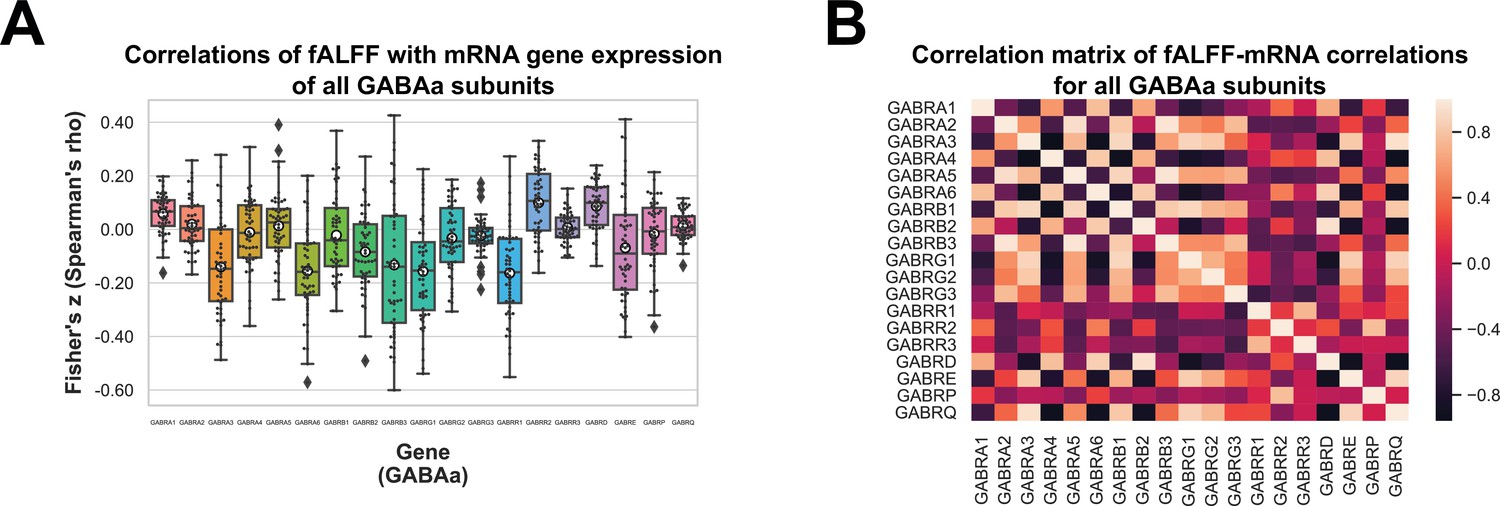
Results of spatial correlation of fractional amplitude of low-frequency fluctuation (fALFF) with mRNA gene expression maps of all γ-aminobutyric acid type A (GABAa) subunits.
Spearman correlation coefficients of mRNA gene expression maps with fALFF for all GABAa subunits (N = 52) (A) and their corresponding correlation matrix (B).
-
Figure 2—figure supplement 1—source data 1
Fisher’s z-transformed Spearman correlation coefficients of fractional amplitude of low-frequency fluctuation (fALFF) with mRNA gene expression of all γ-aminobutyric acid type A (GABAa) subunits shown in Figure 2—figure supplement 1.
- https://cdn.elifesciences.org/articles/86085/elife-86085-fig2-figsupp1-data1-v1.xlsx
Figure 3 with 1 supplement
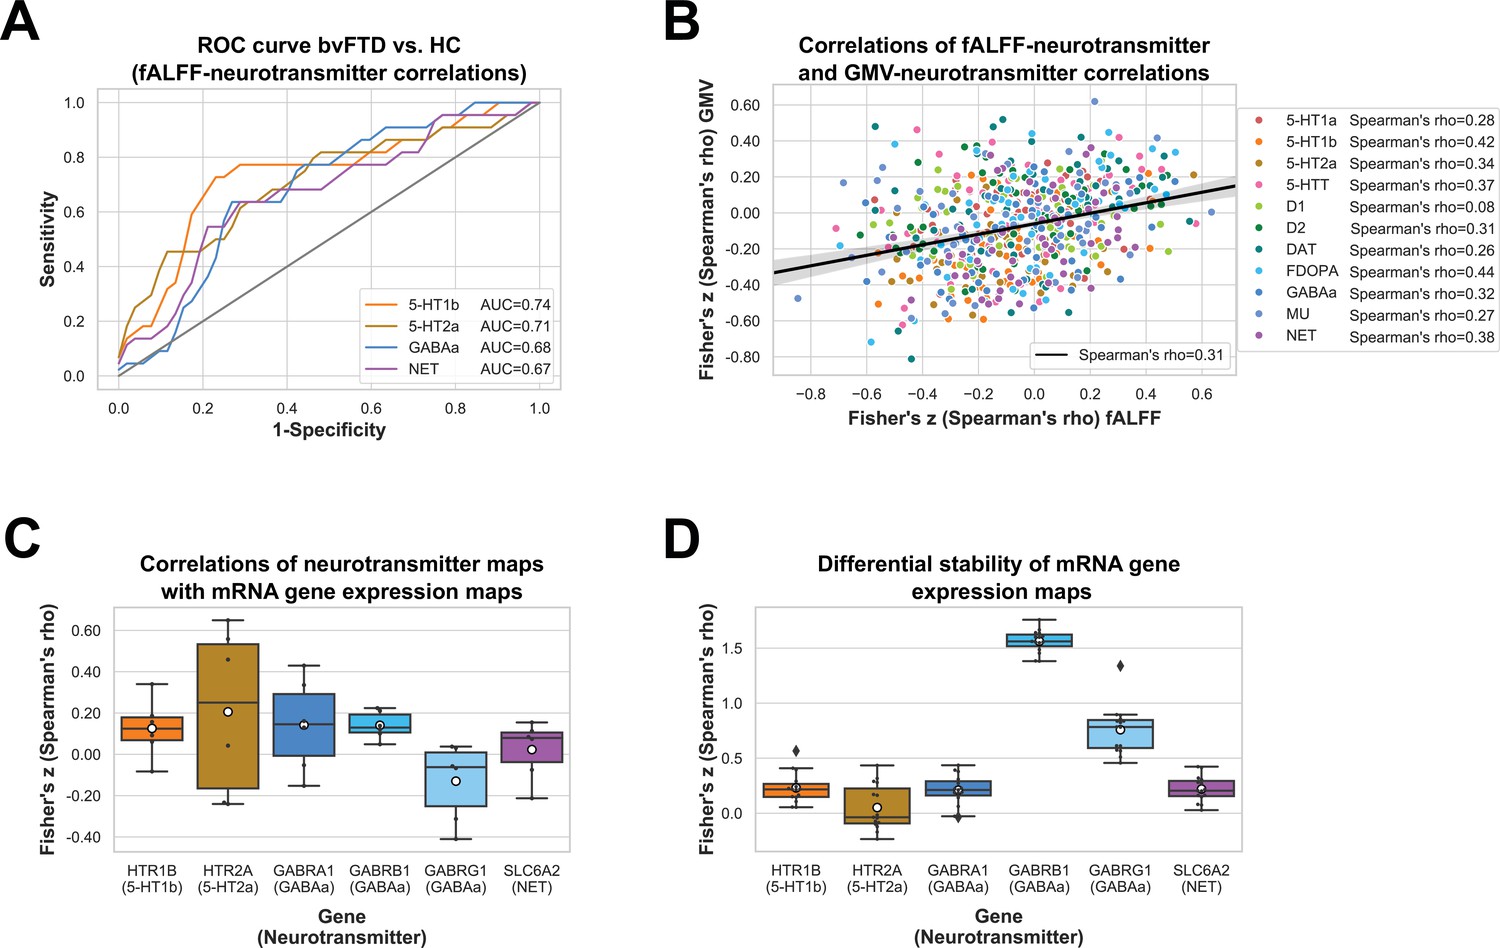
Results for fractional amplitude of low-frequency fluctuation (fALFF)–neurotransmitter receiver operating characteristic (ROC) curve, correlations of fALFF–neurotransmitter and gray matter volume (GMV)–neurotransmitter correlations, correlations of neurotransmitter and mRNA gene expression maps, and autocorrelations of mRNA gene expression maps.
ROC curves for healthy controls (HC) vs. behavioral variant frontotemporal dementia (bvFTD) patients are displayed for significant fALFF–neurotransmitter correlations (NbvFTD = 52, NHC = 22) (A). Spearman correlation coefficients of fALFF–neurotransmitter and GMV–neurotransmitter correlations are displayed for each patient and each significant neurotransmitter (N = 52) (B). Spearman correlation coefficients of neurotransmitter and mRNA gene expression maps (C) and autocorrelations of mRNA gene expression maps averaged across mRNA donors (N = 6) (D) are displayed for significant fALFF–neurotransmitter associations incl. 95% confidence intervals.
-
Figure 3—source data 1
Sensitivity and 1 − specificity shown in Figure 3A, fractional amplitude of low-frequency fluctuation (fALFF)–neurotransmitter and gray matter volume (GMV)–neurotransmitter Fisher’s z-transformed Spearman correlation coefficients shown in Figure 3B, and Fisher’s z-transformed Spearman correlation coefficients of neurotransmitter and mRNA gene expression maps shown in Figure 3C ,D.
- https://cdn.elifesciences.org/articles/86085/elife-86085-fig3-data1-v1.xlsx
Figure 3—figure supplement 1
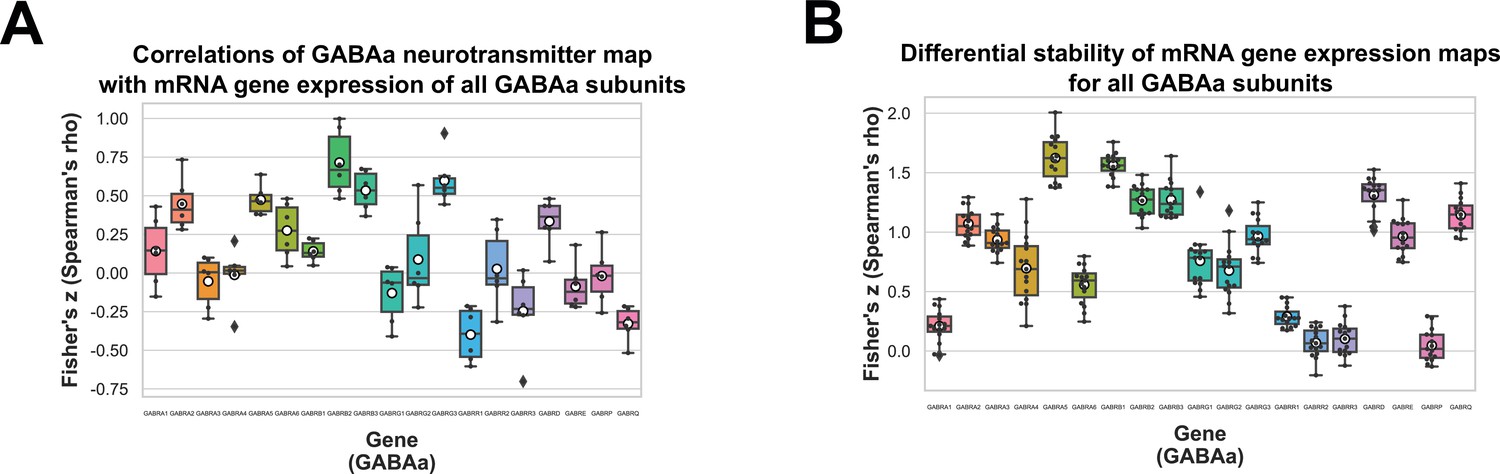
Results for correlations of neurotransmitter and mRNA gene expression mapsof all γ-aminobutyric acid type A (GABAa) subunits.
Spearman correlation coefficients of mRNA gene expression maps with the GABAa neurotransmitter map (N = 6) (A) and their mRNA autocorrelations (N = 6) (B). The genes encoding the 19 GABAa subunits include GABRA1–6, GABRB1–3, GABRG1–3, GABRR1–3, GABRD, GABRE, GABRP, and GABRQ. Means are represented by white circles.
-
Figure 3—figure supplement 1—source data 1
Fisher’s z-transformed Spearman correlation coefficients of neurotransmitter and mRNA gene expression maps for all γ-aminobutyric acid type A (GABAa) subunits shown in Figure 3—figure supplement 1.
- https://cdn.elifesciences.org/articles/86085/elife-86085-fig3-figsupp1-data1-v1.xlsx
Tables
Table 1
Demographic and clinical information for bvFTD patients and HC.
| bvFTD | HC | Group comparison | ||||
|---|---|---|---|---|---|---|
| Age (years) | 61.5 ± 10.0 | N = 52 | 63.6 ± 11.9 | N = 22 | t = −0.78 | p = 0.44 |
| Sex (male/female) | 38/14 | N = 52 | 9/13 | N = 22 | Χ² = 6.90 | p = 0.009* |
| Education (years) | 13.7 ± 3.19 | N = 50 | 13.5 ± 2.56 | N = 22 | t = 0.21 | p = 0.84 |
| Disease duration (years) | 3.98 ± 5.22 | N = 49 | – | – | – | – |
| Verbal Fluency (number of animals) | 12.2 ± 6.48 | N = 49 | 27.5 ± 4.77 | N = 19 | t = −9.30 | p < 0.001* |
| Boston Naming Test (total score) | 12.9 ± 2.79 | N = 49 | 15.0 ± 0.22 | N = 20 | t = −3.28 | p = 0.002* |
| Mini Mental State Exam (total score) | 25.2 ± 4.48 | N = 50 | 29.3 ± 0.64 | N = 20 | t = −4.03 | p < 0.001* |
| Trail Making Test B (s) | 179 ± 84.4 | N = 36 | 78.5 ± 22.0 | N = 19 | t = 5.09 | p < 0.001* |
| Apathy Evaluation Scale (total score) | 32.7 ± 11.0 | N = 35 | 9.50 ± 5.26 | N = 4 | t = 4.13 | p < 0.001* |
| Frontal Systems Behavior Scale (companion-rated, total frequency) | 72.7 ± 16.1 | N = 34 | 38.8 ± 12.3 | N = 5 | t = 4.49 | p < 0.001* |
| Frontal Systems Behavior Scale (companion-rated, total distress) | 66.9 ± 21.0 | N = 29 | 32 ± 9.56 | N = 4 | t = 3.25 | p = 0.003* |
| Frontal Systems Behavior Scale: Executive Function (companion-rated, total distress) | 23.6 ± 7.39 | N = 34 | 11.8 ± 4.50 | N = 4 | t = 3.11 | p = 0.004* |
| Clinical Dementia Rating-Frontotemporal Lobar Degeneration (total score) | 8.06 ± 3.92 | N = 45 | 0.05 ± 0.16 | N = 19 | t = 5.07 | p < 0.001* |
-
bvFTD – behavioral variant frontotemporal dementia, HC – healthy controls.
-
*
Significant at p < 0.05.
Table 2
Center-specific imaging parameters for structural and functional imaging.
| Center | rsfMRI | Structural MRI | |||||||
|---|---|---|---|---|---|---|---|---|---|
| TE (ms) | TR (ms) | FOV(X, Y, Z) | Voxel size (mm) | Volumes | TE (ms) | TR (ms) | FOV(X, Y, Z) | Voxel size (mm) | |
| Bonn | 30 | 2000 | 64 × 64 × 30 | 3 × 3 × 5 | 300 | 3.06 | 2300 | 240 × 256 × 176 | 1 × 1 × 1 |
| Erlangen | 34 | 3000 | 64 × 64 × 30 | 3 × 3 × 5 | 300 | 2.98 | 2300 | 240 × 256 × 176 | 1 × 1 × 1 |
| Göttingen | 30 | 2000 | 64 × 64 × 30 | 3 × 3 × 6 | 300 | 2.96 | 2300 | 256 × 256 × 176 | 1 × 1 × 1 |
| Homburg | 30 | 2000 | 64 × 64 × 30 | 3 × 3 × 5 | 300 | 2.98 | 2300 | 240 × 256 × 176 | 1 × 1 × 1 |
| Leipzig | 30 | 2000 | 64 × 64 × 30 | 3 × 3 × 5 | 300 | 2.98 | 2300 | 240 × 256 × 176 | 1 × 1 × 1 |
| München (TU) | 30 | 2000 | 64 × 64 × 30 | 3 x 3 × 5 | 300 | 2.98 | 2300 | 240 × 256 × 176 | 1 × 1 × 1 |
| Rostock | 30 | 2200 | 64 × 64 × 34 | 3.5 × 3.5 × 3.5 | 300 | 4.82 | 2500 | 256 × 256 × 192 | 1 × 1 × 1 |
| Tübingen | 30 | 2000 | 64 × 64 × 30 | 3 × 3 × 5 | 300 | 2.96 | 2300 | 240 × 256 × 176 | 1 × 1 × 1 |
| Ulm | 30 | 2000 | 64 × 64 × 30 | 3 × 3 × 5 | 300 | 2.05 | 2300 | 240 × 256 × 192 | 1 × 1 × 1 |
-
rsfMRI – resting-state functional magnetic resonance imaging, MRI – magnetic resonance imaging, TE – echo time, TR – repetition time, FOV – field of view.
-
Bonn – University of Bonn, German Center for Neurodegenerative Diseases (DZNE), University Hospital Bonn.
-
Erlangen – University Hospital Erlangen.
-
Göttingen – Medical University Göttingen.
-
Homburg – Saarland University Hospital.
-
Leipzig – Max-Planck-Institute for Human Cognitive and Brain Sciences.
-
TU München – Technical University of Munich.
-
Rostock – University Hospital Rostock, German Center for Neurodegenerative Diseases (DZNE).
-
Tübingen – University Hospital Tübingen, Centre for Neurology, Hertie-Institute for Clinical Brain Research.
-
Ulm – Ulm University.
Additional files
-
Supplementary file 1
Supplementary tables including information about the subject distribution across centers, detailed information about the neurotransmitter maps, contrast peak voxel information for the t-contrasts, Spearman correlation coefficients and corresponding p-values from the fALFF- and GMV-neurotransmitter analyses and their relationship to clinical symptoms.
- https://cdn.elifesciences.org/articles/86085/elife-86085-supp1-v1.docx
-
MDAR checklist
- https://cdn.elifesciences.org/articles/86085/elife-86085-mdarchecklist1-v1.pdf
Download links
A two-part list of links to download the article, or parts of the article, in various formats.
Downloads (link to download the article as PDF)
Open citations (links to open the citations from this article in various online reference manager services)
Cite this article (links to download the citations from this article in formats compatible with various reference manager tools)
Resting-state alterations in behavioral variant frontotemporal dementia are related to the distribution of monoamine and GABA neurotransmitter systems
eLife 13:e86085.
https://doi.org/10.7554/eLife.86085


