VO2max prediction based on submaximal cardiorespiratory relationships and body composition in male runners and cyclists: a population study
- Department of Physical Education and Health in Biala Podlaska, Faculty in Biala Podlaska, Jozef Pilsudski University of Physical Education, Poland
- Students' Scientific Group of Lifestyle Medicine, 3rd Department of Internal Medicine and Cardiology, Medical University of Warsaw, Poland
- Department of Experimental and Clinical Pharmacology, Center for Preclinical Research and Technology CEPT, Medical University of Warsaw, Poland
- Institute of Sport-National Research Institute, Poland
Figures
Figure 1
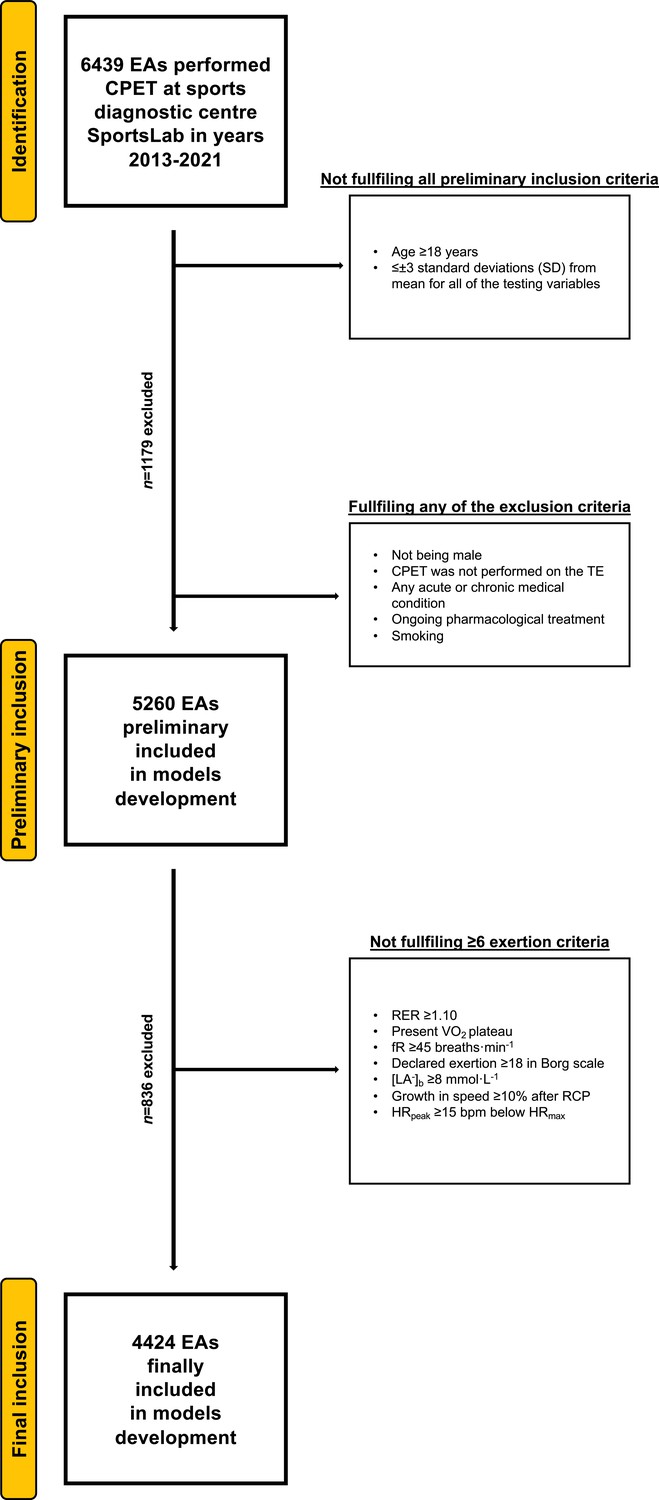
Flowchart of the preliminary inclusion and exclusion process.
Abbreviations: EA, endurance athlete; CPET, cardiopulmonary exercise testing; SD, standard deviation; TE, treadmill; RER, respiratory exchange ratio; VO2, oxygen uptake (mL·min−1·kg−1); [La−]b, lactate concentration (mmol·L−1); fR, breathing frequency (breaths·min−1); RCP, respiratory compensation point; HRpeak, peak heart rate (beats·min−1); HRmax, maximal heart rate (bpm). At both stages of the selection, some participants met several (>1) exclusion criteria.
Figure 2
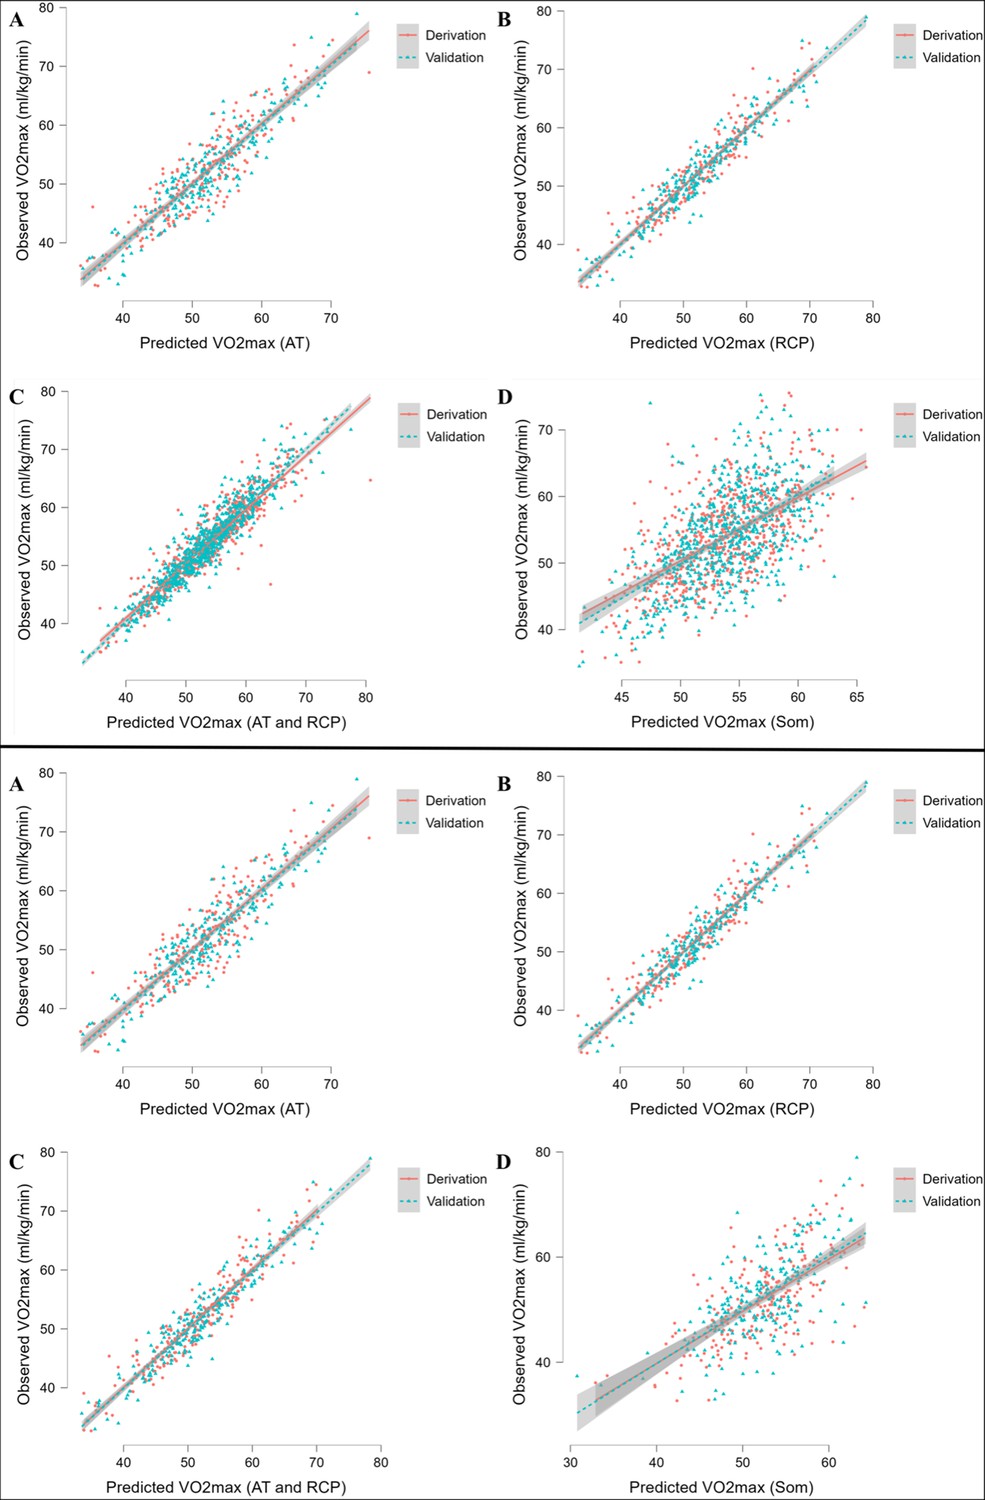
Performance of prediction equations for VO2max.
Abbreviations: VO2max; maximal oxygen uptake; AT, anaerobic threshold; RCP, respiratory compensation point; Max, maximal; Som, somatic. All values are presented in mL·min–1·kg–1. Upper panel shows performance for running equations, while the lower panel shows performance for cycling equations. Panel A shows performance of the prediction model for AT; panel B for RCP; panel C for AT and RCP; panel D for somatic-only equation.
Figure 3
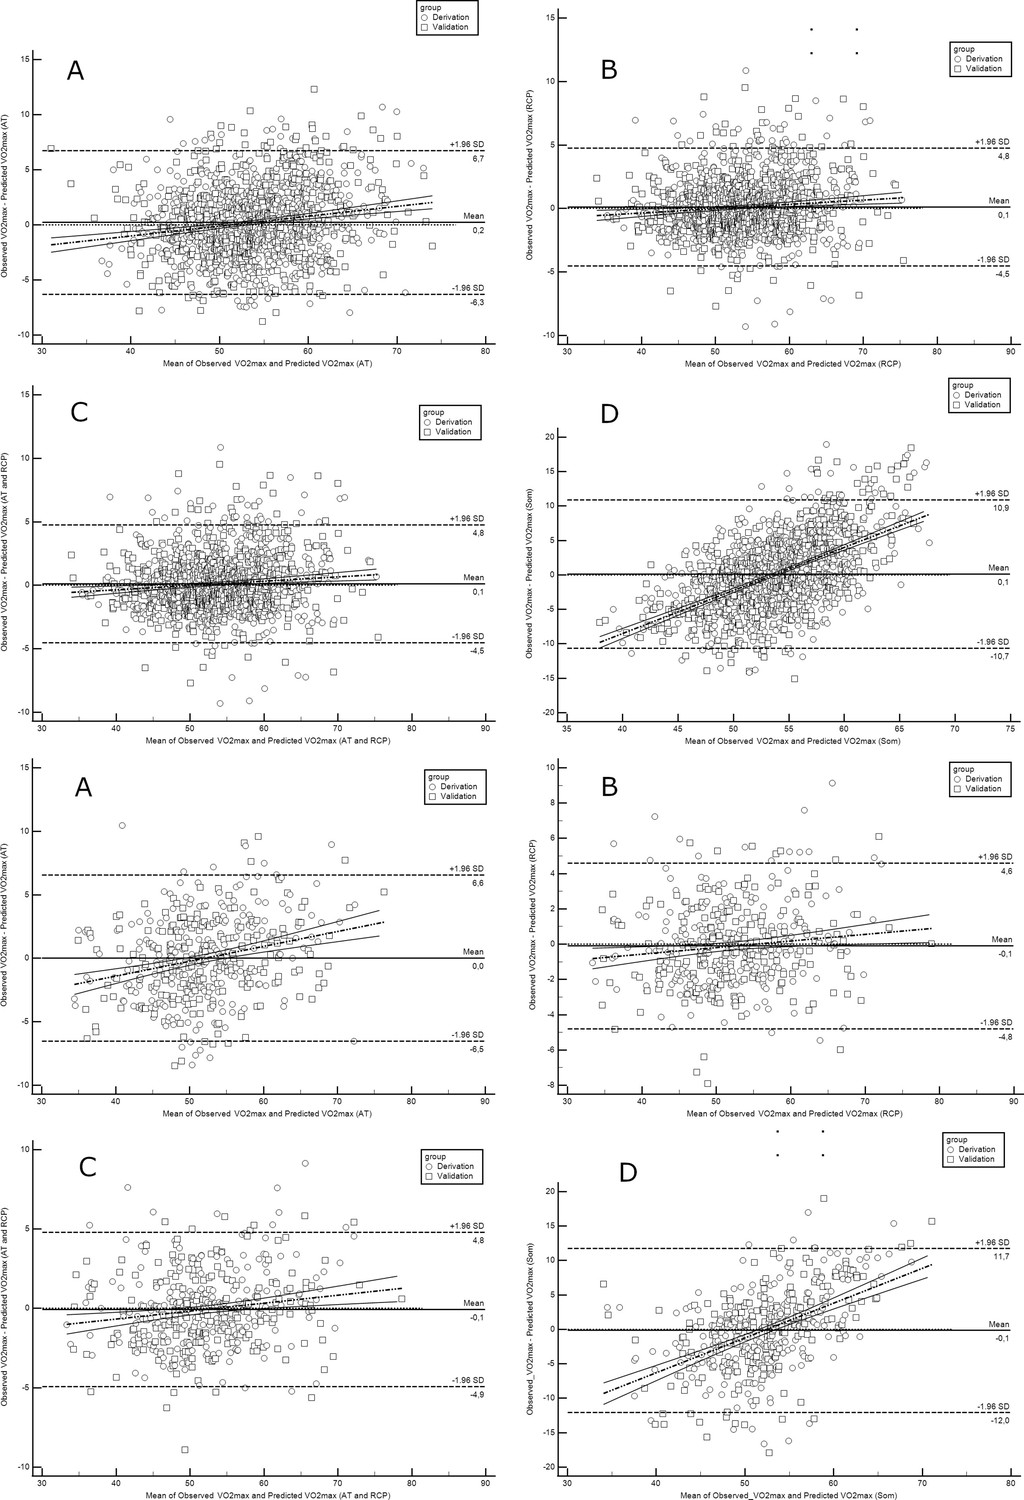
Bland-Altman plots comparing observed with predicted VO2max in runners derivation and validation cohorts.
Abbreviations: VO2max; maximal oxygen uptake; AT, anaerobic threshold; RCP, respiratory compensation point; Max, maximal; Som, somatic. All values are presented in mL·min–1·kg–1. Upper panel shows performance for running equations, while the lower panel shows performance for cycling equations. Panel A shows performance of the prediction model for AT; panel B for RCP; panel C for AT and RCP; panel D for the somatic-only equation.
Tables
Table 1
Basic anthropometric characteristics for runners.
| Variable (unit) | Derivation group n=1998 | Testing group n=666 | Validation group n=666 | ||||||
|---|---|---|---|---|---|---|---|---|---|
| Mean | CI | SD | Mean | CI | SD | Mean | CI | SD | |
| Age (years) | 36.2 | 35.6–36.9 | 8.45 | 35.9 | 35.5–36.3 | 8.05 | 35.5 | 34.9–36.2 | 8.14 |
| Height (cm) | 180.0 | 179.6–180.5 | 6.04 | 179.4 | 179.1–179.7 | 6.13 | 179.7 | 179.2–180.2 | 6.61 |
| BM (kg) | 77.7 | 77.0–78.4 | 9.35 | 77.7 | 77.3–78.1 | 9.29 | 77.9 | 77.1–78.6 | 10.1 |
| BMI (kg·m–2) | 23.9 | 23.8–24.1 | 2.43 | 24.1 | 24.0–24.2 | 2.41 | 24.1 | 23.9–24.3 | 2.56 |
| BF (%) | 15.4 | 15.1–15.7 | 4.55 | 15.5 | 15.3–15.7 | 4.52 | 15.4 | 15.1–15.8 | 4.55 |
| FM (kg) | 12.2 | 11.9–12.6 | 4.68 | 12.3 | 12.1–12.5 | 4.65 | 12.3 | 11.9–12.7 | 4.92 |
| FFM (kg) | 65.5 | 65.0–66.0 | 6.43 | 65.4 | 65.1–65.7 | 6.31 | 65.6 | 65.1–66.1 | 6.86 |
-
BM, body mass; BMI, body mass index; BF, body fat; FM, fat mass; FFM, fat-free mass; CI, 95% confidence interval; SD, standard deviation.
Table 2
Basic anthropometric characteristics for cyclists.
| Variable (unit) | Derivation group n=656 | Testing group n=219 | Validation group n=219 | ||||||
|---|---|---|---|---|---|---|---|---|---|
| Mean | CI | SD | Mean | CI | SD | Mean | CI | SD | |
| Age (years) | 37.3 | 36.6–38.0 | 9.13 | 37.1 | 35.9–38.4 | 9.50 | 37.6 | 36.5–38.8 | 8.46 |
| Height (cm) | 179.9 | 179.4–180.4 | 6.27 | 180.1 | 179.2–181.0 | 6.96 | 180.2 | 179.4–181.0 | 6.13 |
| BM (kg) | 78.8 | 78.1–79.6 | 9.80 | 79.1 | 77.7–80.5 | 10.4 | 79.8 | 78.4–81.3 | 10.9 |
| BMI (kg·m–2) | 24.3 | 24.1–24.6 | 2.63 | 24.4 | 24.0–24.7 | 2.80 | 24.6 | 24.2–25.0 | 2.96 |
| BF (%) | 16.4 | 15.7–17.1 | 4.99 | 16.1 | 15.7–16.5 | 4.81 | 16.2 | 15.5–16.8 | 4.87 |
| FM (kg) | 13.3 | 12.6–14.1 | 5.66 | 13.0 | 12.6–13.4 | 5.27 | 13.3 | 12.5–14.0 | 5.85 |
| FFM (kg) | 65.8 | 64.9–66.6 | 6.25 | 65.8 | 65.4–66.3 | 6.06 | 66.6 | 65.7–67.4 | 6.58 |
-
BM, body mass; BMI, body mass index; BF, body fat; FM, fat mass; FFM, fat-free mass; CI, 95% confidence interval; SD, standard deviation.
Table 3
Cardiopulmonary exercise testing (CPET) characteristics for runners.
| Variable (unit) | Derivation group n=1998 | Testing group n=666 | Validation group n=666 | ||||||
|---|---|---|---|---|---|---|---|---|---|
| Mean | CI | SD | Mean | CI | SD | Mean | CI | SD | |
| rVO2AT (mL·min–1·kg–1) | 38.4 | 38.1–38.8 | 5.01 | 38.5 | 38.3–38.7 | 4.88 | 38.1 | 37.7–38.5 | 5.16 |
| RERAT | 0.87 | 0.86–0.87 | 0.04 | 0.87 | 0.86–0.87 | 0.04 | 0.87 | 0.86–0.87 | 0.04 |
| HRAT (beats·min–1) | 151.5 | 150.8–152.3 | 10.3 | 151.0 | 150.6–151.5 | 10.8 | 152.0 | 151.2–152.8 | 10.8 |
| VEAT (L·min–1) | 79.1 | 78.1–80.0 | 12.2 | 78.3 | 77.8–78.9 | 12.0 | 77.2 | 76.3–78.2 | 12.0 |
| SPEEDAT (km·h–1) | 11.0 | 10.9–11.1 | 1.45 | 11.0 | 11.0–11.1 | 1.36 | 10.9 | 10.8–11.0 | 1.42 |
| LAAT (mmol·L–1) | 2.08 | 2.02–2.14 | 0.63 | 1.80 | 1.76–1.83 | 0.62 | 2.35 | 2.27–2.42 | 0.72 |
| rVO2RCP (mL·min–1·kg–1) | 47.5 | 47.0–48.0 | 5.88 | 47.7 | 47.4–48.0 | 6.15 | 47.3 | 46.8–47.8 | 6.16 |
| RERRCP | 1.00 | 1.00–1.00 | 0.04 | 1.00 | 1.00–1.00 | 0.04 | 1.00 | 1.00–1.00 | 0.03 |
| HRRCP (beats·min–1) | 173.4 | 172.7–174.1 | 9.21 | 173.2 | 172.8–173.6 | 9.30 | 174.3 | 173.5–175.0 | 9.50 |
| VERCP (L·min–1) | 114.7 | 113.5–116.0 | 15.9 | 113.9 | 113.1–114.6 | 16.7 | 112.7 | 111.4–114.0 | 16.2 |
| SPEEDRCP (km·h–1) | 14.0 | 13.9–14.1 | 1.77 | 14.1 | 14.0–14.1 | 1.70 | 13.9 | 13.8–14.1 | 1.75 |
| LARCP (mmol·L–1) | 4.72 | 4.63–4.82 | 1.04 | 4.40 | 4.34–4.45 | 1.04 | 4.81 | 4.69–4.93 | 1.14 |
| rVO2max (mL·min–1·kg–1) | 53.8 | 53.3–54.3 | 6.67 | 54.3 | 54.0–54.6 | 6.95 | 53.8 | 53.3–54.3 | 7.09 |
-
CI, 95% confidence interval; SD, standard deviation; rVO2AT, oxygen uptake at anaerobic threshold relative to body mass; RERAT, respiratory exchange ratio at anaerobic threshold; HRAT, heart rate at anaerobic threshold; VEAT, pulmonary ventilation at anaerobic threshold; SPEEDAT, velocity at anaerobic threshold; LAAT, blood lactate concentration at anaerobic threshold; rVO2RCP, oxygen uptake at respiratory compensation point relative to body mass; RERRCP, respiratory exchange ratio at respiratory compensation point; HRRCP, heart rate at respiratory compensation point; VERCP, pulmonary ventilation at respiratory compensation point; SPEEDRCP, velocity at respiratory compensation point; LARCP, blood lactate concentration at respiratory compensation point; rVO2max, maximal oxygen uptake relative to body mass.
Table 4
Cardiopulmonary exercise testing (CPET) characteristics for cyclists.
| Variable (unit) | Derivation group n=656 | Testing group n=219 | Validation group n=219 | ||||||
|---|---|---|---|---|---|---|---|---|---|
| Mean | CI | SD | Mean | CI | SD | Mean | CI | SD | |
| rVO2AT (mL·min–1·kg–1) | 33.0 | 32.5–33.4 | 5.84 | 33.2 | 32.4–33.9 | 5.68 | 33.7 | 32.9–34.5 | 5.89 |
| RERAT | 0.87 | 0.87–0.87 | 0.04 | 0.87 | 0.87–0.88 | 0.04 | 0.87 | 0.87–0.88 | 0.04 |
| HRAT (beats·min–1) | 142.2 | 141.3–143.1 | 11.7 | 140.7 | 139.1–142.3 | 11.8 | 141.2 | 139.7–142.6 | 10.8 |
| VEAT (L·min–1) | 64.9 | 64.0–65.7 | 11.0 | 65.1 | 63.7–66.5 | 10.6 | 67.4 | 66.0–68.9 | 11.2 |
| rPOWAT (W·kg–1) | 2.28 | 2.24–2.32 | 0.48 | 2.27 | 2.21–2.34 | 0.48 | 2.33 | 2.27–2.39 | 0.46 |
| LAAT (mmol·L–1) | 1.86 | 1.82–1.90 | 0.51 | 1.84 | 1.77–1.90 | 0.50 | 1.80 | 1.74–1.87 | 0.51 |
| rVO2RCP (mL·min–1·kg–1) | 44.0 | 43.5–44.6 | 7.38 | 44.4 | 43.4–45.4 | 7.32 | 44.9 | 43.8–45.9 | 7.63 |
| RERRCP | 1.01 | 1.01–1.01 | 0.04 | 1.01 | 1.01–1.02 | 0.04 | 1.01 | 1.01–1.02 | 0.04 |
| HRRCP (beats·min–1) | 168.8 | 168.0–169.7 | 10.5 | 167.7 | 166.2–169.2 | 11.3 | 168.4 | 167.1–169.6 | 9.11 |
| VERCP (L·min–1) | 106.2 | 104.8–107.6 | 17.7 | 107.6 | 105.3–109.8 | 16.8 | 110.4 | 107.9–112.9 | 18.7 |
| rPOWRCP (W·kg–1) | 3.34 | 3.29–3.38 | 0.63 | 3.33 | 3.25–3.42 | 0.63 | 3.40 | 3.32–3.48 | 0.61 |
| LARCP (mmol·L–1) | 4.54 | 4.47–4.61 | 0.97 | 4.61 | 4.48–4.75 | 1.04 | 4.47 | 4.34–4.61 | 1.03 |
| rVO2MAX (mL·min–1·kg–1) | 51.7 | 51.1–52.4 | 7.99 | 52.0 | 50.9–53.1 | 8.01 | 52.3 | 51.2–53.4 | 8.08 |
-
CI, 95% confidence interval; SD, standard deviation; rVO2AT, oxygen uptake at anaerobic threshold relative to body mass; RERAT, respiratory exchange ratio at anaerobic threshold; HRAT, heart rate at anaerobic threshold; VEAT, pulmonary ventilation at anaerobic threshold; rPOWAT, power at anaerobic threshold relative to body mass; LAAT, blood lactate concentration at anaerobic threshold; rVO2RCP, oxygen uptake at respiratory compensation point relative to body mass; RERRCP, respiratory exchange ratio at respiratory compensation point; HRRCP, heart rate at respiratory compensation point; VERCP, pulmonary ventilation at respiratory compensation point; LARCP, blood lactate concentration at respiratory compensation point; rPOWRCP, power at respiratory compensation point relative to body mass; rVO2max, maximal oxygen uptake relative to body mass.
Table 5
VO2max prediction equations for cyclists.
| Model’s category | Multiple linear regression equation | R2 | Derivation group performance | Validation group performance | ||
|---|---|---|---|---|---|---|
| RMSE | MAE | RMSE | MAE | |||
| AT | VO2max = 21.29 + 0.95 * rVO2AT + 1.74 * rPOWAT - 0.30 * BF | 0.811 | 3.62 | 2.89 | 3.42 | 2.72 |
| RCP | VO2max = 8.57 + 1.08 * rVO2RCP - 0.04 * VERCP | 0.913 | 2.12 | 1.66 | 2.03 | 1.64 |
| AT+RCP | VO2max = 10.57 + 0.98 * rVO2RCP - 0.12 * BF | 0.909 | 2.26 | 1.78 | 2.11 | 1.72 |
| SOM | VO2max = 82.36–0.14 * BM - 0.66 * BF - 0.22 * Age | 0.43 | 6.06 | 4.70 | 6.11 | 4.74 |
-
AT, equation based on anaerobic threshold; RCP, equation based on respiratory compensation point; SOM, equation based on somatic variables only; R2, adjusted R2; RMSE, root mean square error; MAE, mean absolute error (mL·min–1·kg–1); VO2max, maximal oxygen uptake relative to body mass (mL·min–1·kg–1); rVO2AT, oxygen uptake at anaerobic threshold relative to body mass (mL·min–1·kg–1); rPOWAT, power at anaerobic threshold relative to body mass (W·kg–1); rVO2RCP, oxygen uptake at respiratory compensation point relative to body mass (mL·min–1·kg–1); VERCP, pulmonary ventilation at respiratory compensation point (L·min–1); BF, body fat (%); BM, body mass (kg).
Table 6
VO2max prediction equations for runners.
| Model’s category | Multiple linear regression equation | R2 | Derivation group performance | Validation group performance | ||
|---|---|---|---|---|---|---|
| RMSE | MAE | RMSE | MAE | |||
| AT | VO2max = 19.78 + 1.05 * rVO2AT + 0.94 * SPEEDAT - 0.12 * FFM - 0.06 * VEAT - 0.07 * HRAT | 0.775 | 3.43 | 2.61 | 3.60 | 2.74 |
| RCP | VO2max = 1.98 + 1.03 * rVO2RCP + 0.23 * SPEEDRCP | 0.899 | 2.0 | 1.58 | 2.08 | 1.60 |
| AT+RCP | VO2max = 1.98 + 1.03 * rVO2RCP + 0.23 * SPEEDRCP | 0.899 | 2.0 | 1.58 | 2.08 | 1.60 |
| SOM | VO2max = 72.37–0.77 * BF - 0.19 * Age | 0.35 | 5.53 | 4.36 | 5.54 | 4.37 |
-
AT, equation based on anaerobic threshold; RCP, equation based on respiratory compensation point; SOM, equation based on somatic variables only; R2, adjusted R2; RMSE, root mean square error; MAE, mean absolute error (mL·min–1·kg–1); VO2max, maximal oxygen uptake relative to body mass (mL·min–1·kg–1); rVO2AT, oxygen uptake at anaerobic threshold relative to body mass (mL·min–1·kg–1); SPEEDAT, velocity at anaerobic threshold (km·h–1); FFM, fat free mass (kg); VEAT, pulmonary ventilation at anaerobic threshold (L·min–1); HRAT, heart rate at anaerobic threshold (beats·min–1); BF, body fat (%); rVO2RCP, oxygen uptake at respiratory compensation point relative to body mass (mL·min–1·kg–1); SPEEDRCP, velocity at respiratory compensation point (km·h–1).
Additional files
-
MDAR checklist
- https://cdn.elifesciences.org/articles/86291/elife-86291-mdarchecklist1-v2.docx
-
Source code 1
Source code in Python for transforming files in the database.
- https://cdn.elifesciences.org/articles/86291/elife-86291-code1-v2.zip
-
Reporting standard 1
TRIPOD checklist.
- https://cdn.elifesciences.org/articles/86291/elife-86291-repstand1-v2.docx
Download links
A two-part list of links to download the article, or parts of the article, in various formats.
Downloads (link to download the article as PDF)
Open citations (links to open the citations from this article in various online reference manager services)
Cite this article (links to download the citations from this article in formats compatible with various reference manager tools)
VO2max prediction based on submaximal cardiorespiratory relationships and body composition in male runners and cyclists: a population study
eLife 12:e86291.
https://doi.org/10.7554/eLife.86291


