Risk of second primary cancers after a diagnosis of first primary cancer: A pan-cancer analysis and Mendelian randomization study
- Department of Urology, Ruijin Hospital, Shanghai Jiao Tong University School of Medicine, China
- Division of Urology, Department of Surgery, Queen Mary Hospital, The University of Hong Kong, China
Figures
Figure 1 with 4 supplements
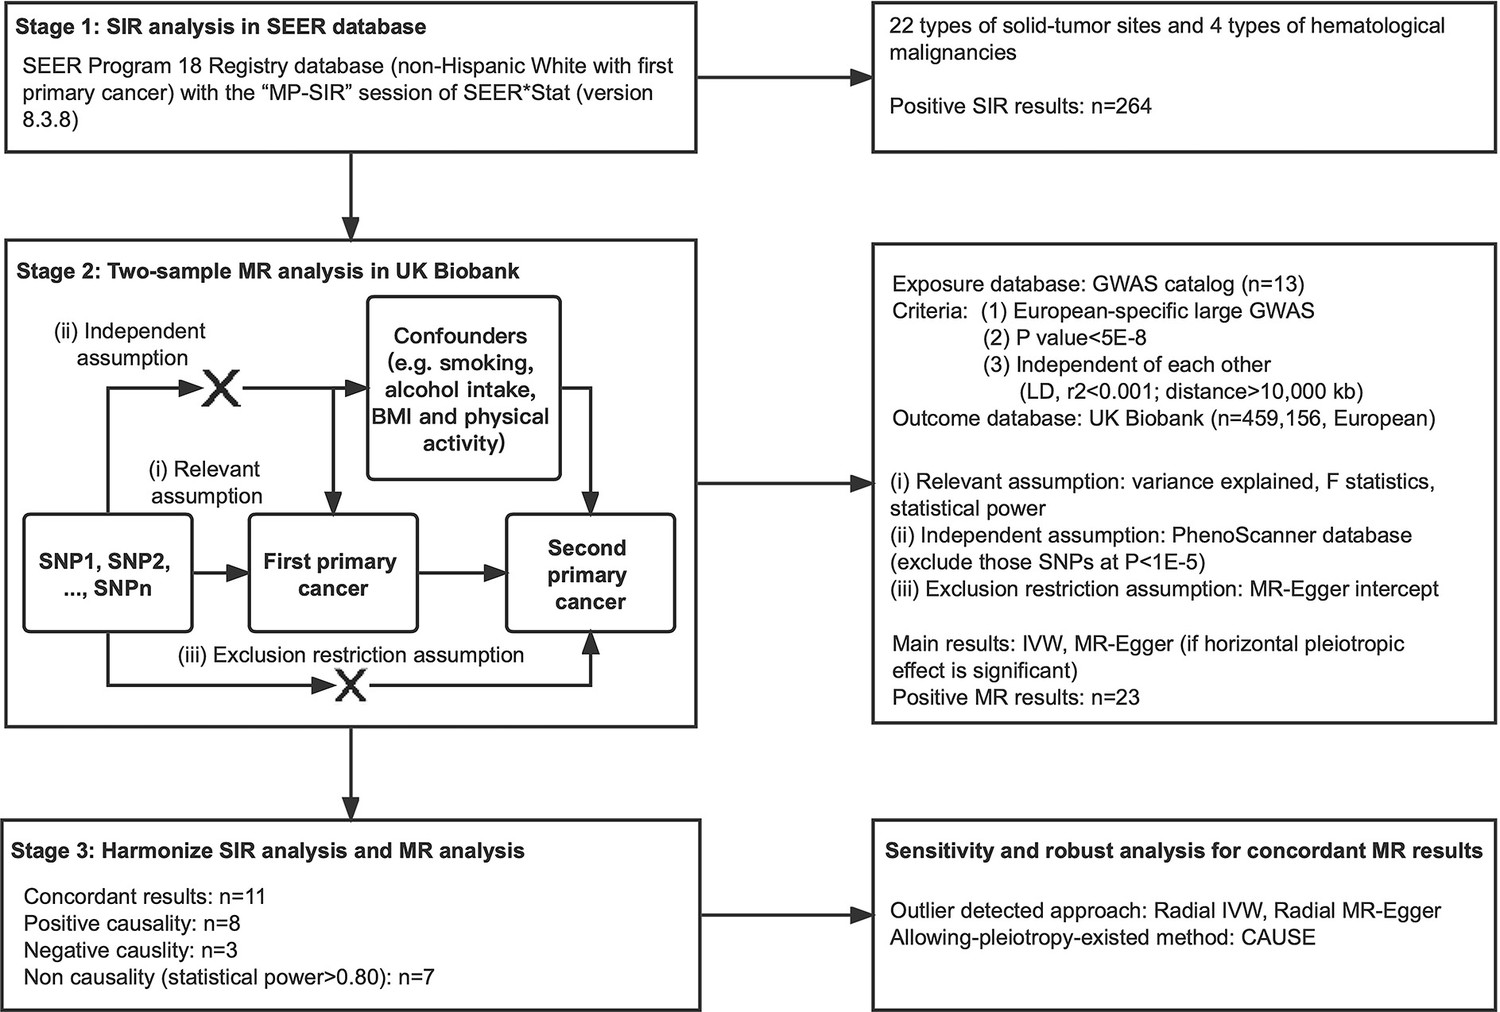
Study design and work flowchart.
Figure 1—figure supplement 1
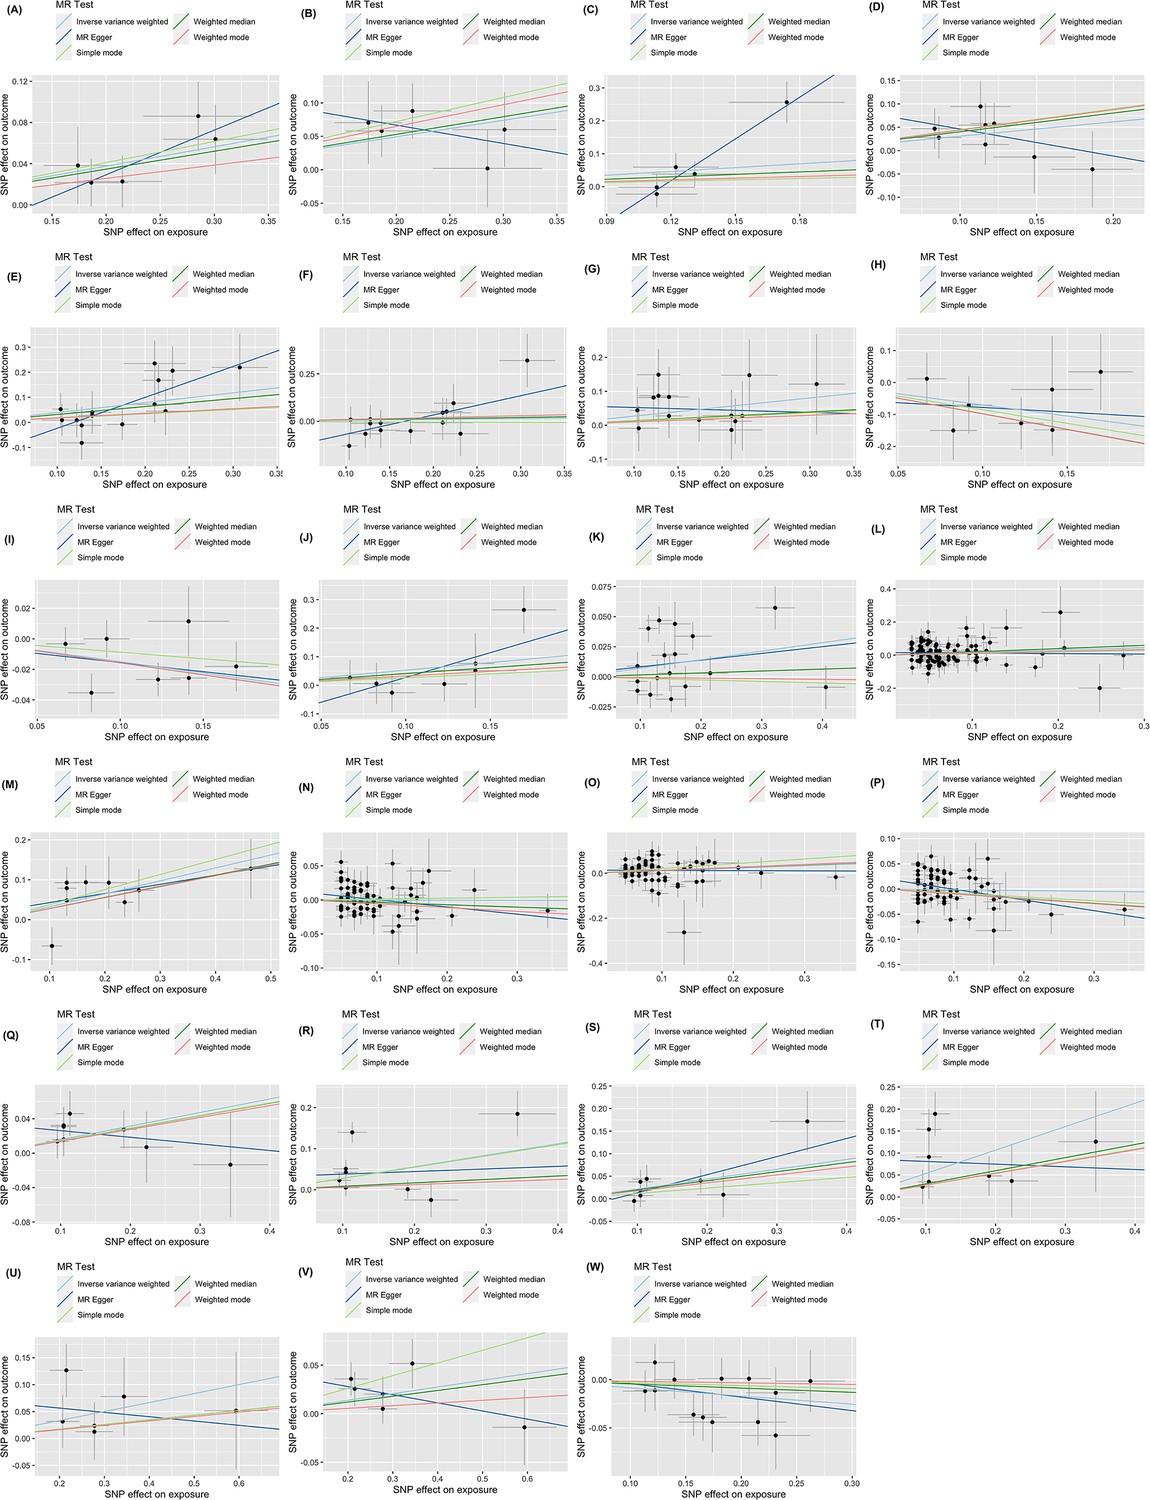
Scatter plot.
(A) Oral and pharyngeal cancer on non-Hodgkin lymphoma; (B) oral and pharyngeal cancer on myeloma; (C) esophageal cancer on myeloma; (D) colorectal cancer on liver cancer; (E) pancreatic cancer on gallbladder cancer; (F) pancreatic cancer on small intestin cancer; (G) pancreatic cancer on lary cancer; (H) lung cancer on bone cancer; (I) lung cancer on female breast cancer; (J) lung cancer on Hodgkin lymphoma; (K) melanoma on female breast cancer; (L) female breast cancer on liver cancer; (M) ovary cancer on soft tissue cancer; (N) prostate cancer on colorectal cancer; (O) prostate cancer on pancreatic cancer; (P) prostate cancer on melanoma; (Q) kidney cancer on lung cancer; (R) kidney cancer on melanoma; (S) kidney cancer on non-hodgkin lymphoma; (T) kidney cancer on myeloma; (U) thyroid cancer on liver; (V) thyroid cancer on colorectal cancer; (W) myeloma on lung cancer.
Figure 1—figure supplement 2
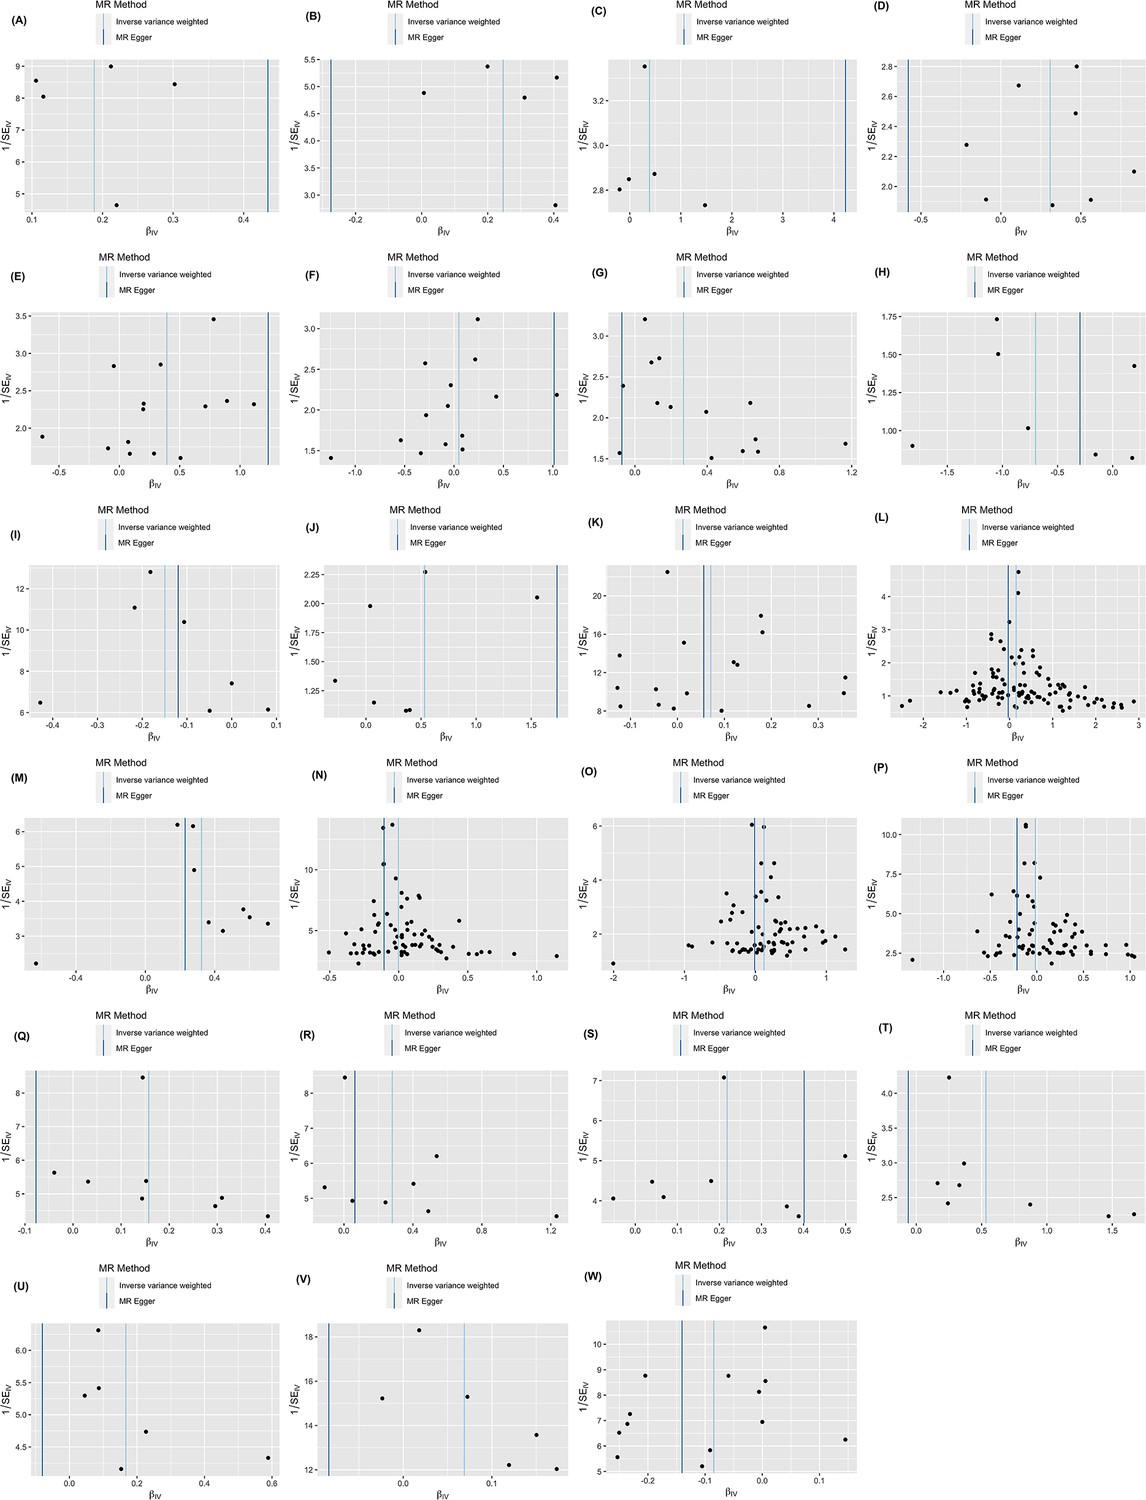
Funnel plot.
(A) Oral and pharyngeal cancer on non-Hodgkin lymphoma; (B) oral and pharyngeal cancer on myeloma; (C) esophageal cancer on myeloma; (D) colorectal cancer on liver cancer; (E) pancreatic cancer on gallbladder cancer; (F) pancreatic cancer on small intestin cancer; (G) pancreatic cancer on lary cancer; (H) lung cancer on bone cancer; (I) lung cancer on female breast cancer; (J) lung cancer on Hodgkin lymphoma; (K) melanoma on female breast cancer; (L) female breast cancer on liver cancer; (M) ovary cancer on soft tissue cancer; (N) prostate cancer on colorectal cancer; (O) prostate cancer on pancreatic cancer; (P) prostate cancer on melanoma; (Q) kidney cancer on lung cancer; (R) kidney cancer on melanoma; (S) kidney cancer on non-hodgkin lymphoma; (T) kidney cancer on myeloma; (U) thyroid cancer on liver; (V) thyroid cancer on colorectal cancer; (W) myeloma on lung cancer.
Figure 1—figure supplement 3
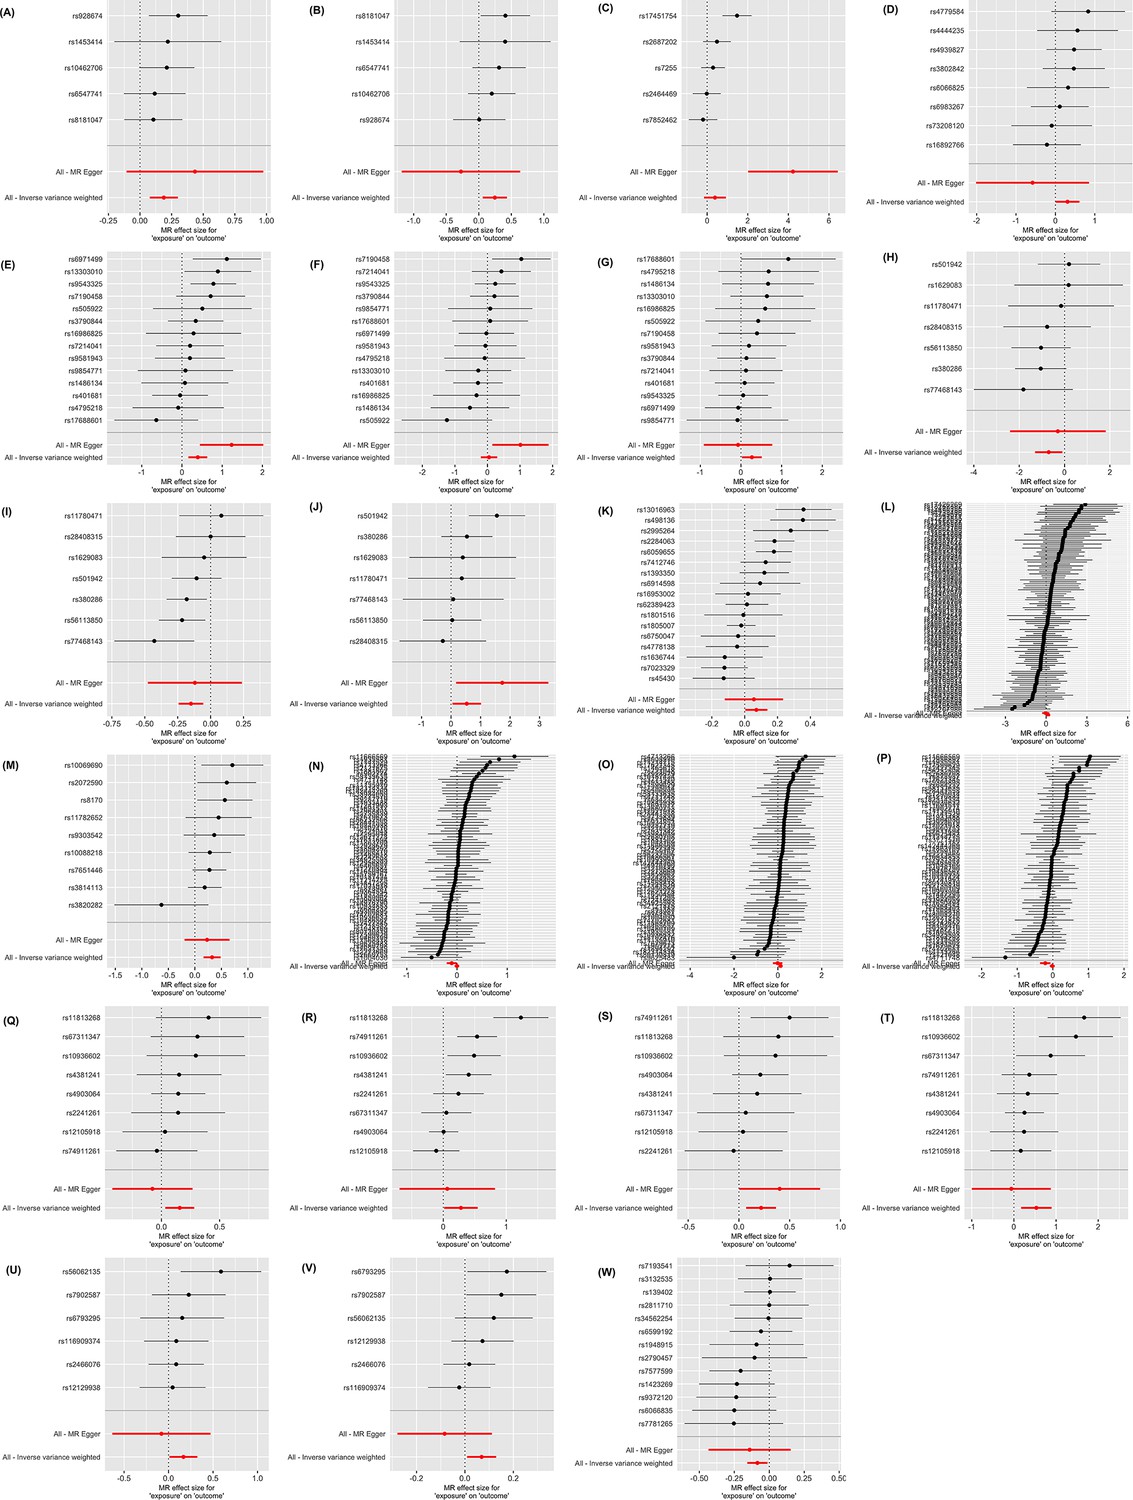
Forrest plot.
(A) Oral and pharyngeal cancer on non-Hodgkin lymphoma; (B) oral and pharyngeal cancer on myeloma; (C) esophageal cancer on myeloma; (D) colorectal cancer on liver cancer; (E) pancreatic cancer on gallbladder cancer; (F) pancreatic cancer on small intestin cancer; (G) pancreatic cancer on lary cancer; (H) lung cancer on bone cancer; (I) lung cancer on female breast cancer; (J) lung cancer on Hodgkin lymphoma; (K) melanoma on female breast cancer; (L) female breast cancer on liver cancer; (M) ovary cancer on soft tissue cancer; (N) prostate cancer on colorectal cancer; (O) prostate cancer on pancreatic cancer; (P) prostate cancer on melanoma; (Q) kidney cancer on lung cancer; (R) kidney cancer on melanoma; (S) kidney cancer on non-hodgkin lymphoma; (T) kidney cancer on myeloma; (U) thyroid cancer on liver; (V) thyroid cancer on colorectal cancer; (W) myeloma on lung cancer.
Figure 1—figure supplement 4
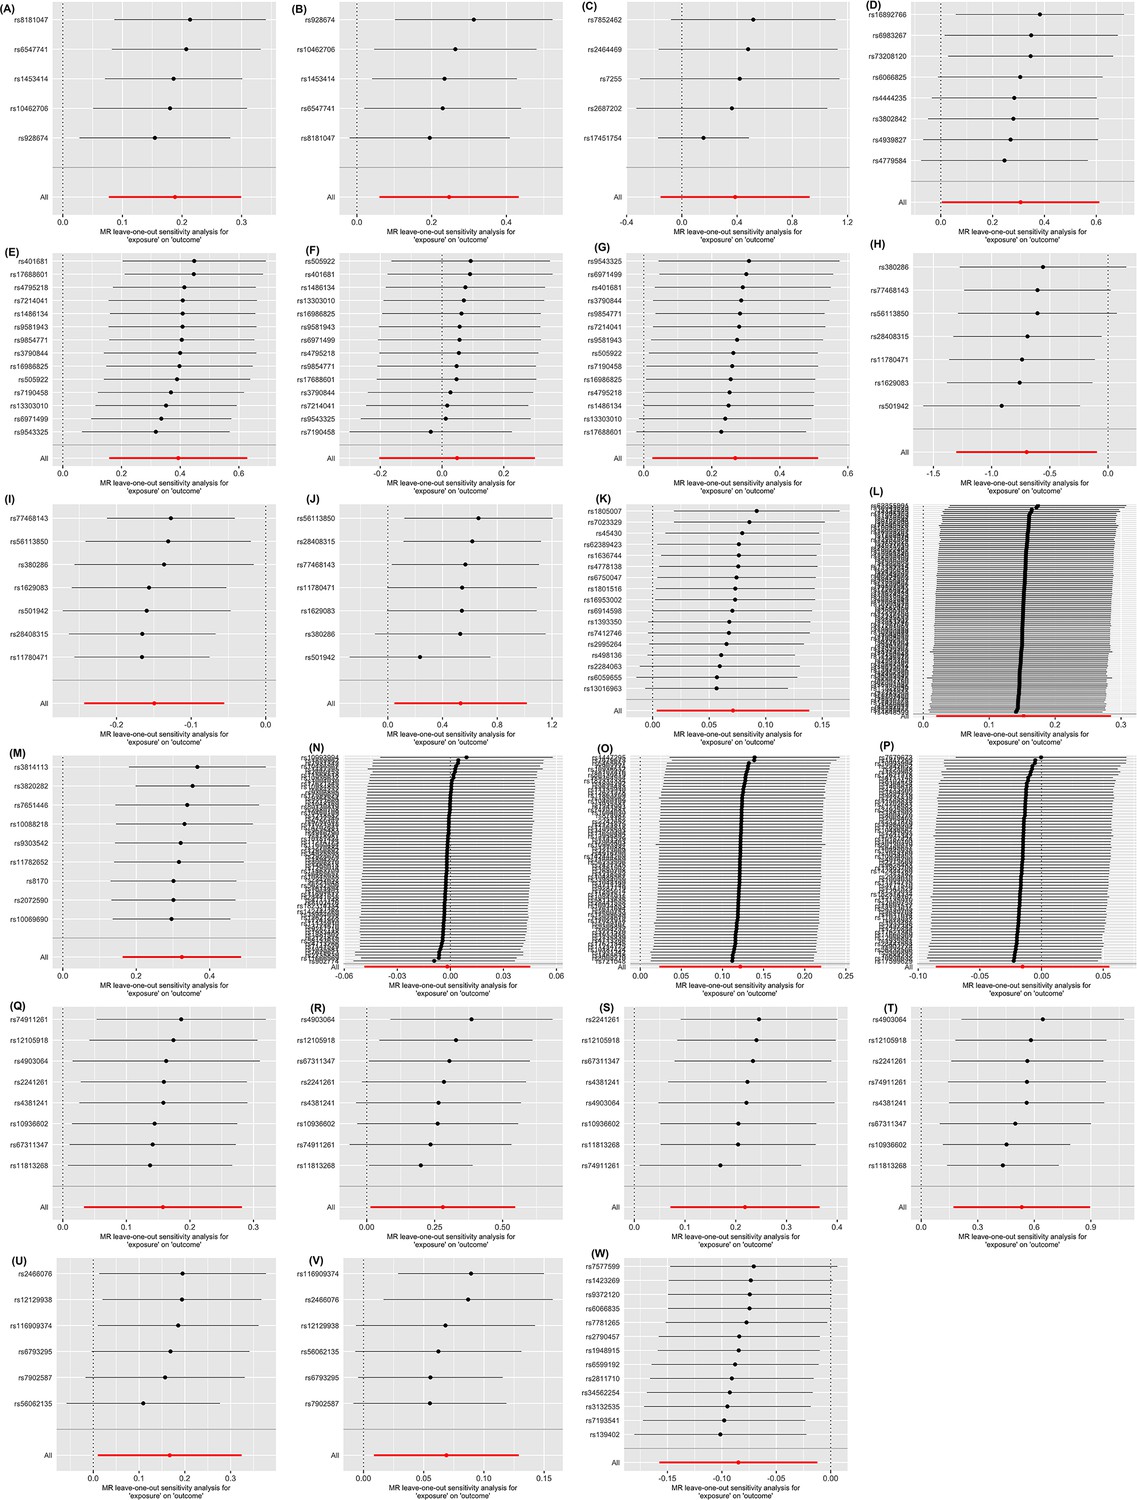
Leave-one-out plot.
(A) Oral and pharyngeal cancer on non-Hodgkin lymphoma; (B) oral and pharyngeal cancer on myeloma; (C) esophageal cancer on myeloma; (D) colorectal cancer on liver cancer; (E) pancreatic cancer on gallbladder cancer; (F) pancreatic cancer on small intestin cancer; (G) pancreatic cancer on lary cancer; (H) lung cancer on bone cancer; (I) lung cancer on female breast cancer; (J) lung cancer on Hodgkin lymphoma; (K) melanoma on female breast cancer; (L) female breast cancer on liver cancer; (M) ovary cancer on soft tissue cancer; (N) prostate cancer on colorectal cancer; (O) prostate cancer on pancreatic cancer; (P) prostate cancer on melanoma; (Q) kidney cancer on lung cancer; (R) kidney cancer on melanoma; (S) kidney cancer on non- hodgkin lymphoma; (T) kidney cancer on myeloma; (U) thyroid cancer on liver; (V) thyroid cancer on colorectal cancer; (W) myeloma on lung cancer.
Figure 2
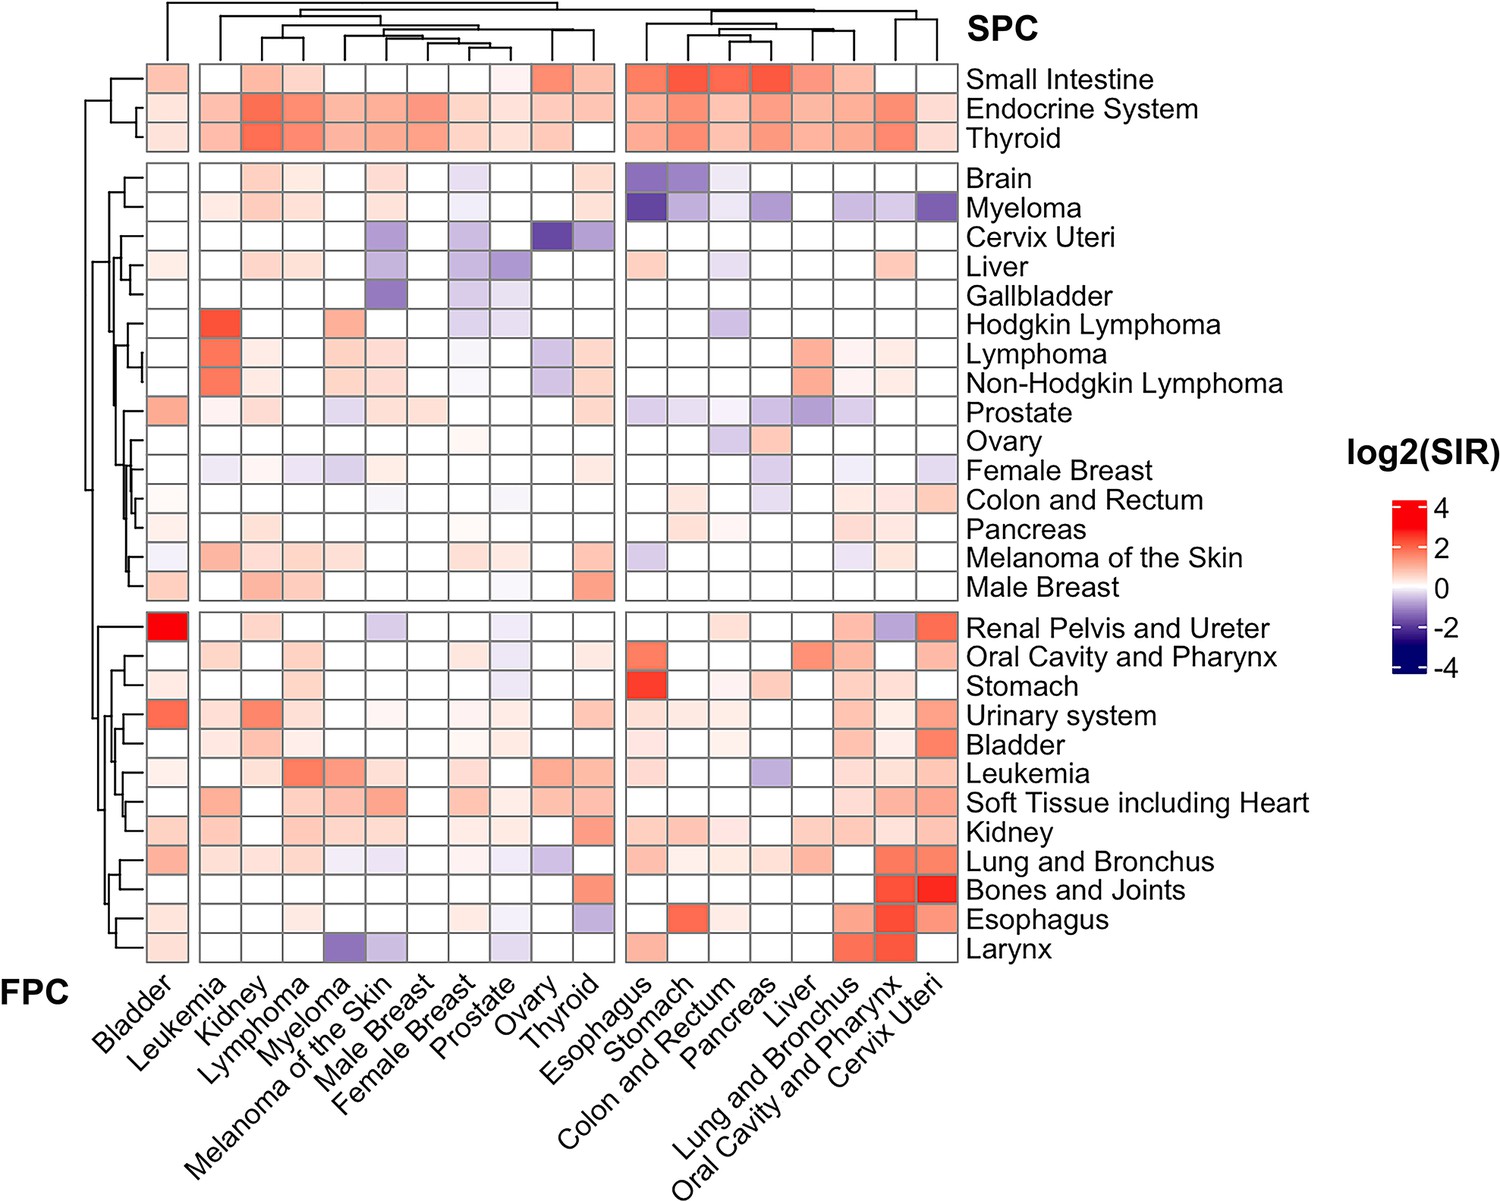
Heat-map of standard incidence ratio for First primary cancers (FPC, horizontal, cancer listed in the bottom) and second primary cancers (SPC, vertical, cancer listed on the right) in the SEER 18 registry (2000–2016).
The standardized incidence observed/expected (O/E) ratios and the corresponding 95% confidence intervals were derived using the “MP-SIR” session of SEER*stat (version 8.3.8).
Tables
Table 1
Summary of the cancer-specific instrument variables used in this study (European ancestry).
| Cancer type | GWAS Source | PMID | Number of SNPs* | Cases | Total population | Variance explained, R2, % | F-statistics |
|---|---|---|---|---|---|---|---|
| Oral and pharynx | GCST003857 | 27749845 | 7 | 6034 | 12,619 | 2.22 | 283.68 |
| Larynx | GCST010285 | 32276964 | 1† | 394 | 4887 | 0.28 | 13.72 |
| Esophagus | GCST003740 | 27527254 | 5 | 10,279 | 27,438 | 0.72 | 198.94 |
| Stomach | GCST002990 | 26098866 | 1† | 2043 | 202,533 | 0.02 | 34.44 |
| Colon and rectum | GCST003017 | 26151821 | 8 | 18,299 | 37,955 | 0.89 | 340.75 |
| Pancreas | GCST005434 | 29422604 | 14 | 9040 | 21,536 | 4.28 | 962.28 |
| Melanoma | GCST004142 | 28212542 | 17 | 6628 | 293,193 | 0.29 | 852.68 |
| Lung | GCST004748 | 28604730 | 7 | 29,266 | 85,716 | 0.55 | 474.00 |
| Male Breast | GCST011526 | 32785646 | 2† | 2190 | 6836 | 1.27 | 87.91 |
| Female Breast | GCST004988 | 29059683 | 104 | 122,977 | 228,951 | 4.95 | 11917.81 |
| Cervix uteri | GCST004833 | 28806749 | 1† | 2866 | 9347 | 0.45 | 42.24 |
| Ovary | GCST002748 | 25581431 | 9 | 18,530 | 69,745 | 1.16 | 818.42 |
| Prostate | GCST006085 | 29892016 | 71 | 79,148 | 140,254 | 5.47 | 8111.66 |
| Bladder | GCST002240 | 24163127 | 7 | 2305 | 6206 | 8.46 | 572.81 |
| Kidney | GCST004710 | 28598434 | 8 | 10,784 | 31,190 | 1.11 | 349.99 |
| Thyroid | GCST004144 | 28195142 | 6 | 3001 | 290,551 | 0.10 | 290.83 |
| Myeloma | GCST004483 | 27363682 | 13 | 9866 | 249,054 | 0.31 | 774.24 |
-
Note: See Supplementary file 2a: the list of SNPs included in the final calculation for each phenotype.
-
No study found in European: bone and joint, brain, liver, small intestine, gallbladder, renal pelvis and ureter.
-
Heterogeneity: lymphoma, leukemia.
-
Too few SNPs: larynx, stomach, male breast cancer.
-
*
Number of SNPs included in the final calculation of PRS in our study; not necessarily the total number of SNPs from the source due to the filtering steps discussed in the main text and germline data availability.
-
†
MR would be performed based on at least 4 SNPs.
Table 2
Concordant causality between Mendelian randomization results and SEER analysis.
| Cancer type(first primary cancer) | Cancer type (second primary cancer) | ||
|---|---|---|---|
| Positive Causality | Negative Causality | No Causality(statistical power ≥0.80) | |
| Oral and pharynx | Non-hodgkin lymphoma | - | Female breast, Prostate |
| Esophagus | - | - | - |
| Colon and rectum | - | - | - |
| Pancreas | Small intestin | - | Melanoma |
| Melanoma | Female breast | - | Colon and Rectum |
| Lung | - | Female Breast | - |
| Female Breast | - | - | - |
| Ovary | Soft tissue | - | - |
| Prostate | - | Colon and Rectum | Non-Hodgkin lymphoma |
| Bladder | - | - | Female breast, Non-hodgkin lymphoma |
| Kidney | Lung and Bronchus, Melanoma, Non-hodgkin lymphoma, Myeloma | - | - |
| Thyroid | - | - | - |
| Myeloma | - | Lung and Bronchus | - |
-
See Supplementary file 2c for unconcordant causality result; Supplementary file 2d-p for the details of Mendelian randomization results (IVW and MR-Egger).
Table 3
Sensitivity and robust analysis of the concordant causality with outlier-filtering approaches.
| Exp-out | Radial IVW | Radial MR-Egger | CAUSE | |||
|---|---|---|---|---|---|---|
| OR (95% CI) | p | OR (95% CI) | p | OR (95% CI) | p | |
| Oropharynx-NHL | 1.21 (1.13–1.30) | 6.00×10⁻³ | 1.21 (1.13–1.30) | 0.52 | 1.17 (1.05–1.31) | 8.90×10⁻³ |
| Pancreas-Intestin | 1.05 (0.83–1.32) | 0.69 | 2.39 (0.91–6.31) | 0.10 | 1.03 (0.79–1.35) | 1.00 |
| Melanoma-Breast | 1.08 (1.00–1.15) | 0.06 | 1.05 (0.84–1.32) | 0.69 | 1.04 (0.95–1.16) | 0.75 |
| Lung-Breast | 0.86 (0.79–0.93) | 9.76×10⁻³ | 0.77 (0.54–1.08) | 0.19 | 0.89 (0.76–1.04) | 0.23 |
| Ovary-Soft | 1.39 (1.22–1.58) | 1.07×10⁻³ | 1.3 (0.74–2.29) | 0.39 | 1.36 (1.16–1.58) | 0.01 |
| Prostate-CRC | 1.00 (0.95–1.04) | 0.94 | 0.88 (0.80–0.98) | 0.02 | 0.99 (0.93–1.04) | 0.99 |
| Kidney-Lung | 1.17 (1.08–1.27) | 6.60×10⁻³ | 0.94 (0.62–1.43) | 0.78 | 1.16 (1.02–1.31) | 0.05 |
| Kidney-Melanoma | 1.33 (1.02–1.73) | 0.04 | 0.56 (0.18–1.80) | 0.37 | 1.25 (0.96–1.73) | 0.51 |
| Kidney-NHL | 1.25 (1.11–1.40) | 7.87×10⁻³ | 1.33 (0.72–2.46) | 0.39 | 1.20 (0.99–1.43) | 0.09 |
| Kidney-Myeloma | 1.72 (1.21–2.45) | 0.02 | 0.43 (0.11–1.77) | 0.29 | 1.49 (1.04–2.34) | 0.02 |
| Myeloma-Lung | 0.92 (0.86–0.98) | 0.02 | 1.09 (0.79–1.51) | 0.61 | 0.93 (0.86–1.00) | 0.21 |
-
IVW, Inverse variance weighted; CAUSE, Causal Analysis Using Summary Effect estimates; OR, odds ratio; CI, confidence interval; exp, exposure; out, outcome; NHL, non-Hodgkin lymphoma; CRC, colorectal cancer.
Additional files
-
Supplementary file 1
Standard incidence ratio analysis of different types of cancers in patients with malignancies in SEER database.
- https://cdn.elifesciences.org/articles/86379/elife-86379-supp1-v1.xlsx
-
Supplementary file 2
Mendelian randomization results of FPCs and SPCs in UK Biobank database.
- https://cdn.elifesciences.org/articles/86379/elife-86379-supp2-v1.xlsx
-
MDAR checklist
- https://cdn.elifesciences.org/articles/86379/elife-86379-mdarchecklist1-v1.docx
Download links
A two-part list of links to download the article, or parts of the article, in various formats.
Downloads (link to download the article as PDF)
Open citations (links to open the citations from this article in various online reference manager services)
Cite this article (links to download the citations from this article in formats compatible with various reference manager tools)
Risk of second primary cancers after a diagnosis of first primary cancer: A pan-cancer analysis and Mendelian randomization study
eLife 12:e86379.
https://doi.org/10.7554/eLife.86379


