An unexpected role of neutrophils in clearing apoptotic hepatocytes in vivo
- Department of Neurosurgery, State Key Laboratory of Biotherapy and Cancer Center, West China Hospital, Sichuan University, China
- Guangzhou Regenerative Medicine and Health Guangdong Laboratory (GRMH-GDL), China
- Department of Anatomy, Histology & Embryology, Shanghai Medical College, China
- Clinical Laboratory, Longhua Hospital, Shanghai University of Traditional Medicine, China
- Department of Pathology, Zhongshan Hospital Fudan University, China
- Department of Rheumatology and Immunology, West China Hospital, Sichuan University, China
- Program for Lung and Vascular Biology, Stanley Manne Children's Research Institute, Ann & Robert H. Lurie Children's Hospital of Chicago, and Department of Pediatrics, Division of Critical Care, Northwestern University Feinberg School of Medicine, United States
- State Key Laboratory of Membrane Biology, Institute of Zoology, Chinese Academy of Sciences, China
- Department of Pharmacology, University of Illinois, College of Medicine, United States
- State Key Laboratory of Genetic Engineering, School of Life Sciences, Fudan University, China
Figures
Figure 1 with 1 supplement
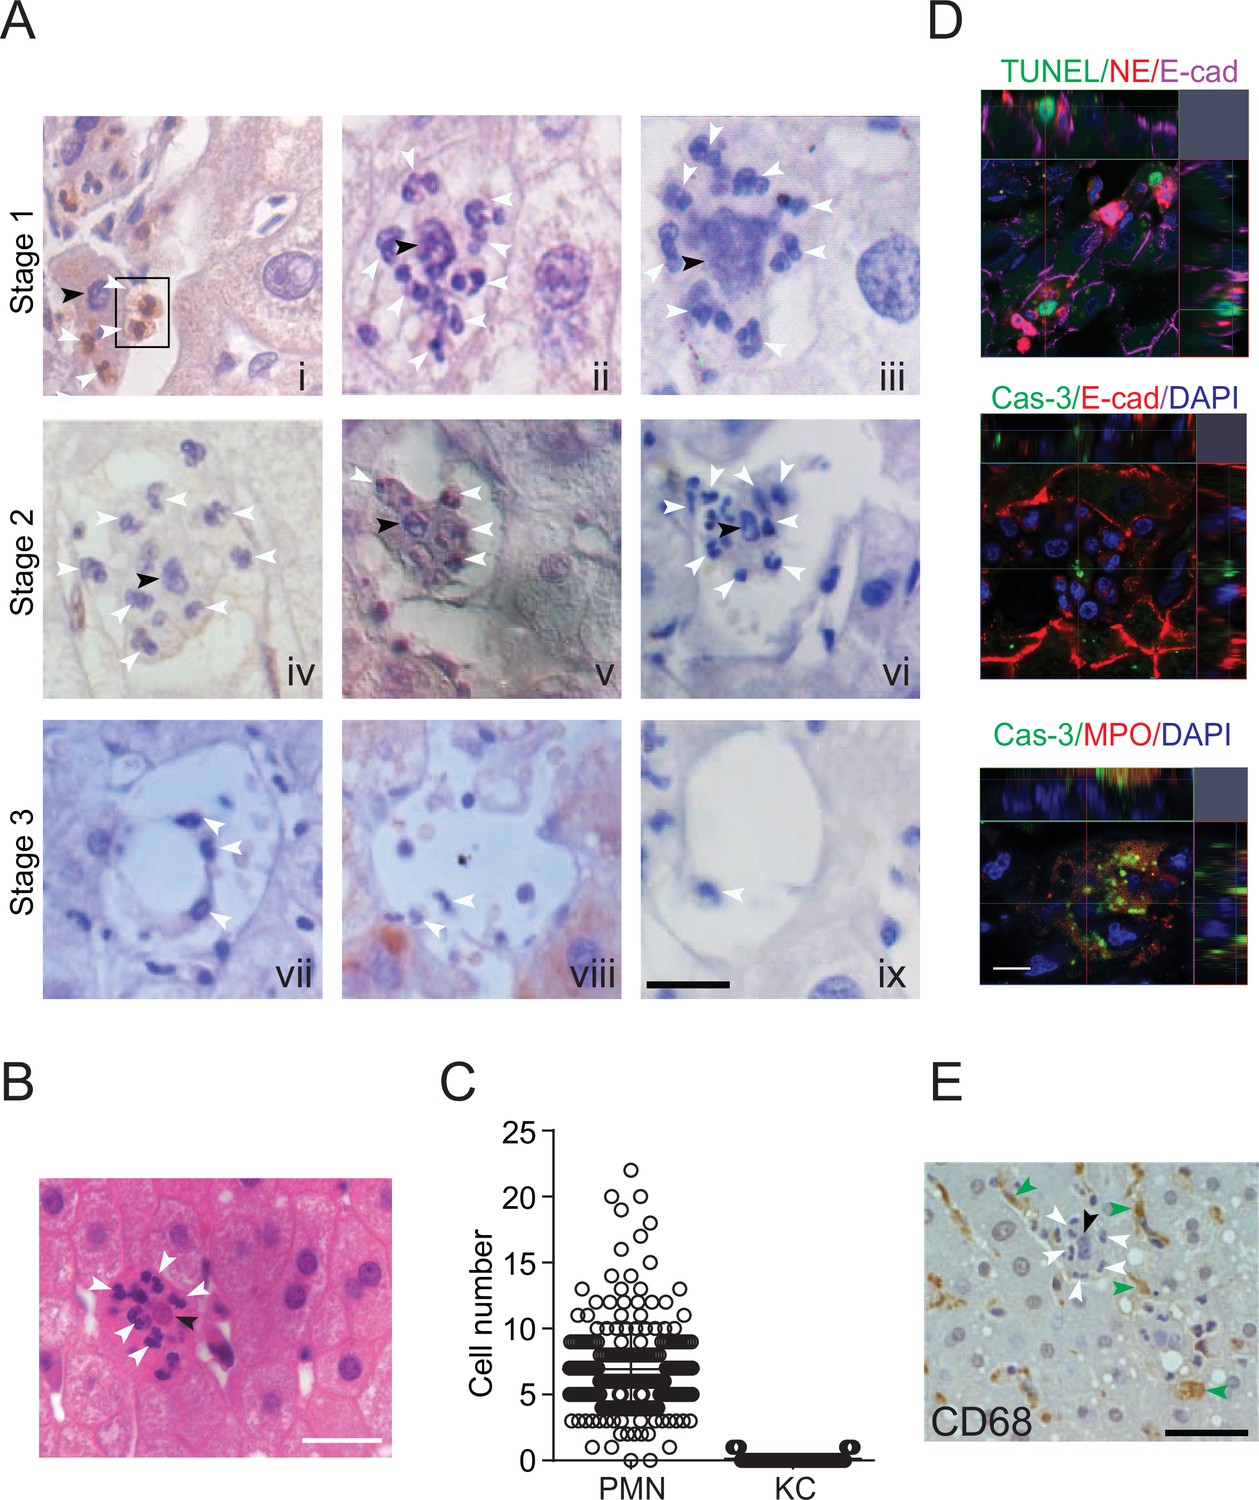
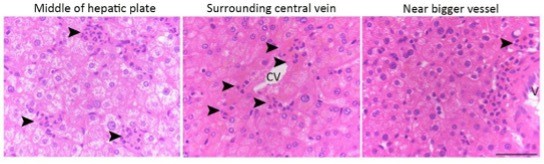
Neutrophil-mediated clearance of apoptotic cells in livers.
(A) Hematoxylin staining of human noncancerous liver tissues from patients with hepatocellular carcinoma. Apoptotic hepatocytes with apparent condensed chromatin are being scavenged by several neutrophils (black arrowhead indicates condensed chromatin and white arrowheads point to neutrophils with a characteristic multilobed nucleus). There are three stages of neutrophil scavenging apoptotic hepatocytes in human samples. Stage 1 (i–iii), initial invading stage: two neutrophils start to invade an apoptotic hepatocyte with apparent condensed chromatin (outlined by the black rectangle); three other neutrophils are already inside the cytoplasm (i); at this stage, the apoptotic hepatocytes are still attached to neighboring hepatocytes and occupied by 2–16 neutrophils (ii–iii, 37 out of 241 apoptotic hepatocytes observed are at stage 1). Stage 2, phagocytosis and shrinking stage: The apoptotic hepatocytes are being phagocytosed by invading neutrophils and are partially detached from neighboring hepatocytes (iv–vi, 130 out of 241 apoptotic cells are at stage 2). Stage 3, complete digestion stage: apoptotic hepatocytes are completely detached and largely cleared, and only neutrophils remain in the cleared region (vii–ix, 74 out of 241 apoptotic cells are at stage 3). Scale bar, 20 µm. (B) Hematoxylin staining of human liver tissues from patients with hemangioma (a total of 40 apoptotic hepatocytes were observed). Scale bar, 20 µm. (C) Cell counts of neutrophils (polymorphonuclear neutrophils [PMNs]) and Kupffer cells (KCs) inside or associated with apoptotic hepatocytes, also see Tables 1 and 3. (D) Fluorescent images of human liver tissues with neutrophils scavenging apoptotic hepatocytes. Apoptotic hepatocytes are confirmed with TUNEL staining or Caspase-3 immunostaining. Neutrophils are labeled with immunostaining of neutrophil elastase (NE), myeloperoxidase (MPO), or DAPI staining (with a segmented nucleus signature). Scale bar, 10 µm. (E) Images of liver tissue stained with an antibody against CD68, a marker of KCs (indicated by green arrowheads). KCs do not invade or phagocytose apoptotic hepatocytes (black arrowheads). Data are representative of (A, B, D, E) or from (C) a total of 281 apoptotic hepatocytes observed, mean and sem in (C).
Figure 1—figure supplement 1
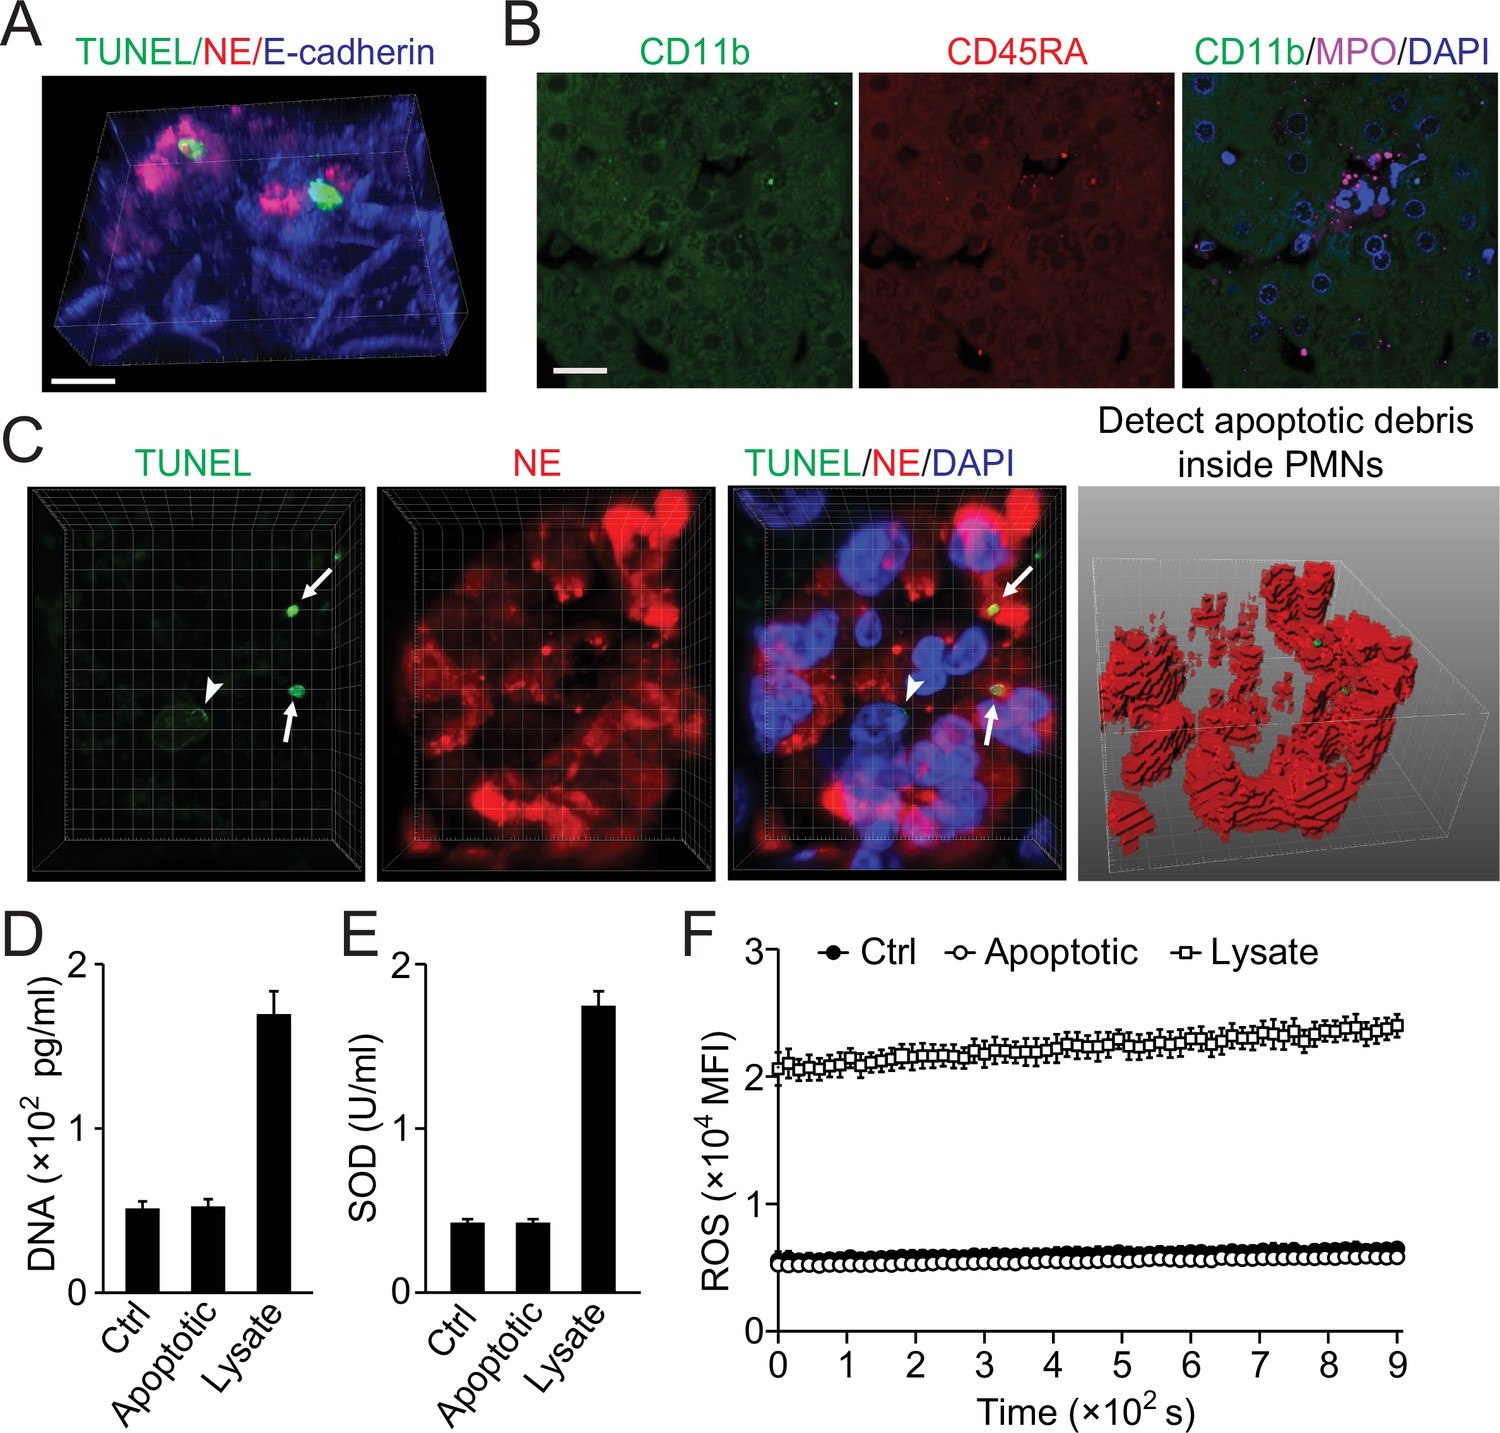
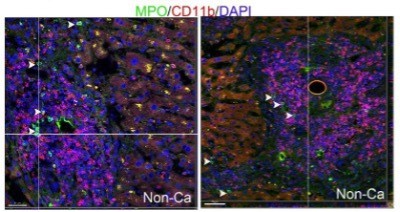
Little leakage during perferocytosis.
(A) Reconstructed 3D images of neutrophils (NE staining, red) burrowed into apoptotic hepatocytes (TUNEL, green). (B) Few CD11b+ or CD45RA+ cells around the perforocytosis site. Bar, 20 µm. (C) Fluorescent images of human liver tissue with neutrophils scavenging apoptotic liver cells. TUNEL staining (green) shows apoptotic nucleus (white arrowheads) and apoptotic nuclear debris (white arrows). The apoptotic debris is phagocytosed by burrowed neutrophils (labeled with NE-red, analyzed and projected with IMARIS software). The burrowing neutrophils have intact nuclei (shown by DAPI staining) with negative TUNEL signals. (D–F) Extracellular levels of DNA (D), SOD (E), and ROS (F) are not significantly changed during phagocytosis of apoptotic NCTC cells by HL60 cells as compared with that of nonapoptotic control NCTC cells. Cell lysate was used as positive control. Data are representative of (A–C) or from (D–F) three independent experiments (mean and sem in D–F).
Figure 2

Neutrophil burrowing into apoptotic hepatocytes.
(A) Intravital microscopy images of liver tissues from wild-type (WT) and MRP8cre/DTR mice. Neutrophils are labeled with an i.v. injection of anti-Ly6G antibody (green), KCs are labeled with anti-F4/80 antibody (red), and apoptotic cells are labeled with Annexin V (blue). Neutrophils inside and KCs associated with apoptotic hepatocytes are detected and analyzed with IMARIS software as described in Methods. The distances from neutrophils to the apoptotic hepatocyte border are recorded in Table 6. A total of 24 apoptotic cells were observed in the WT liver with an average of two burrowed neutrophils. Scale bar, 100 µm. (B) Intravital image sequences of neutrophils phagocytosing apoptotic hepatocytes in mouse livers at indicated time points. Neutrophils are labeled with an i.v. injection of anti-Ly6G antibody (green), and apoptotic cells are labeled with Annexin V (red). A total of 13 apoptotic cells with burrowed neutrophils were observed in 12 WT mouse livers. Scale bar, 20 µm. (C) Electron microscopy images of apoptotic mouse hepatocytes occupied by neutrophils. The apoptotic hepatic nucleus (AN) is evident by distorted nuclear membrane (pointed by black arrowheads). The neutrophils are indicated by white arrowheads with a characteristic multilobed nucleus. 29 apoptotic cells with burrowed neutrophils were observed. Scale bar, 5 µm. Data are representative of three independent experiments.
Figure 3 with 1 supplement
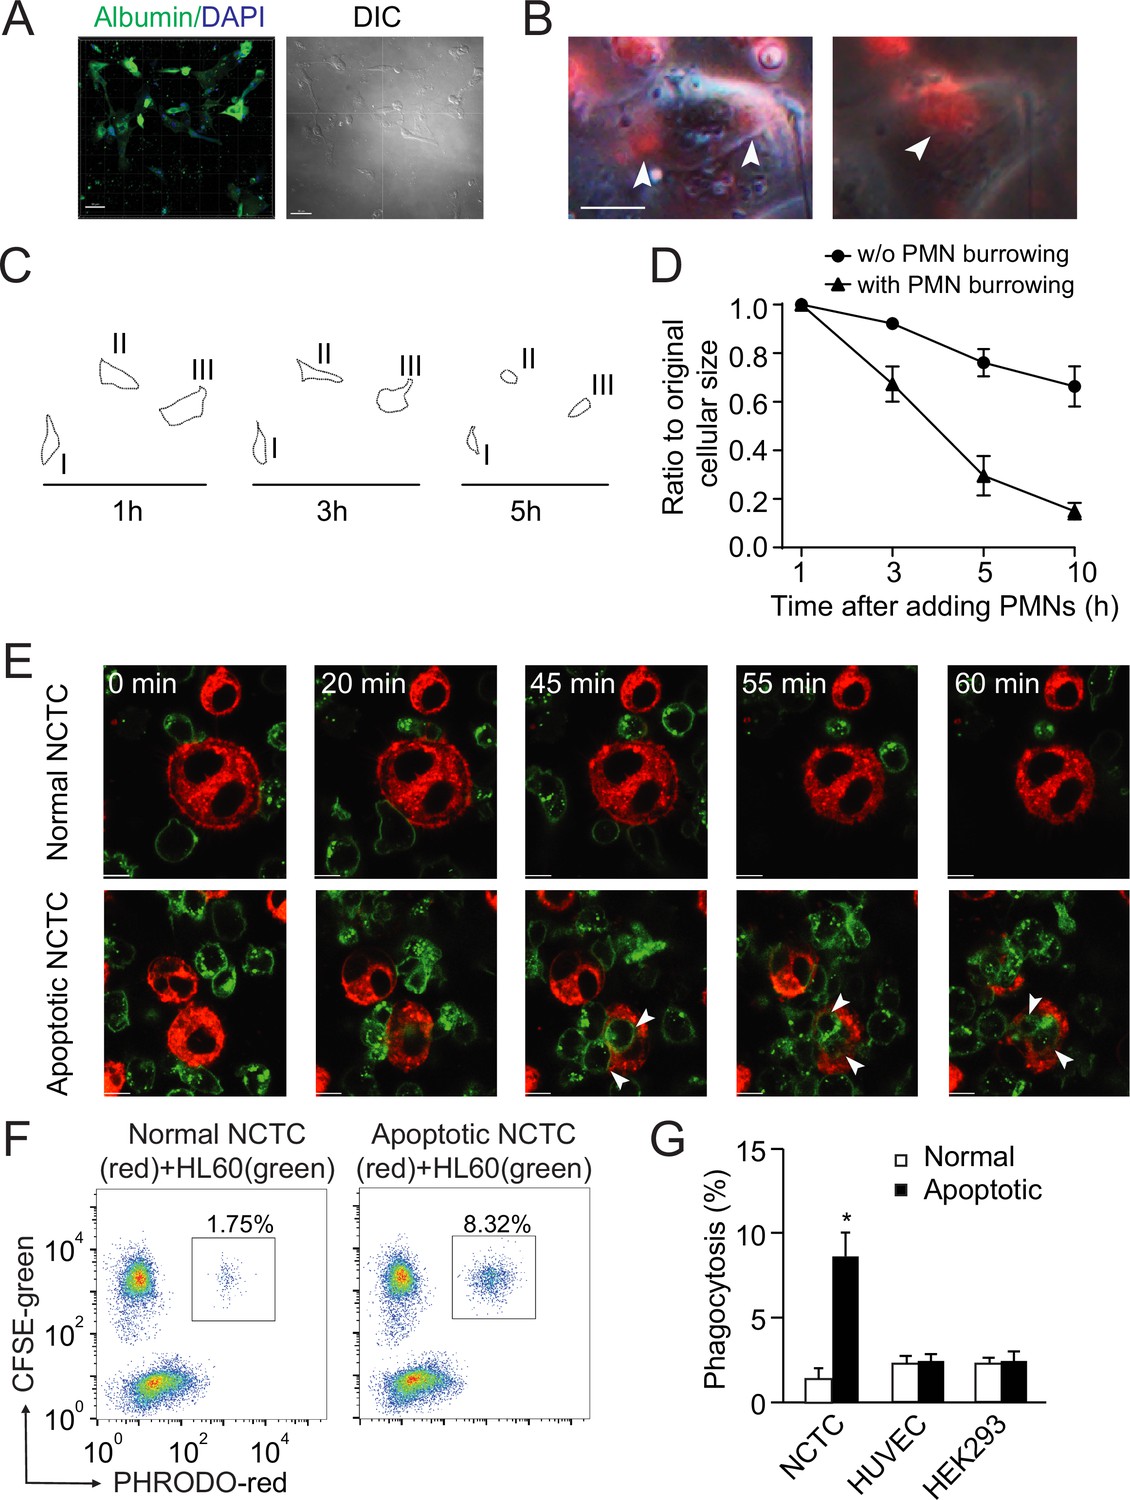
Neutrophils preferentially phagocytose apoptotic hepatocytes.
(A) Fluorescent and phase contract images of isolated and cultured human primary hepatocytes stained with anti-albumin antibody (green). Scale bar, 50 µm. (B) Fluorescent and phase contract images of burrowed human neutrophils (red) inside apoptotic human primary hepatocytes from A (treated with puromycin). Scale bar, 10 µm. (C, D) Cell outlines (C) and cell size quantification (D) of apoptotic human primary hepatocytes occupied with burrowed neutrophils at indicated time points. (E) Fluorescence images of PKH67 (green)-labeled HL60 cells interacting with PKH26 (red)-labeled NCTC cells at the indicated time points. HL60 cells exhibited littler responses to nonapoptotic NCTC cells (top row). In contrast, HL60 cells polarized and penetrated apoptotic NCTC cells (bottom row). Scale bar, 10 µm. (F) Flow cytometry analysis of HL60 cells (labeled with CFSE, green) incubated with nonapoptotic (first column) or apoptotic hepatocytes (second column, hepatocytes were labeled with PHrodo-red dye with weak fluorescent at neutral pH but high fluorescent with a drop in pH). The population of double fluorescent HL60 cells in this subgroup (with higher PHrodo-red fluorescent indicating engulfment) was calculated, and these cells were considered phagocytosing cells. (G) Quantification of (F). HL60 cells exhibited significantly higher phagocytosis of apoptotic NCTC cells than that of nonapoptotic controls. *, p<0.05 (Student’s t-test). Data are representative of (A–C, E, F) or from (D, G) three independent experiments, mean and sem in (D, G).
Figure 3—figure supplement 1
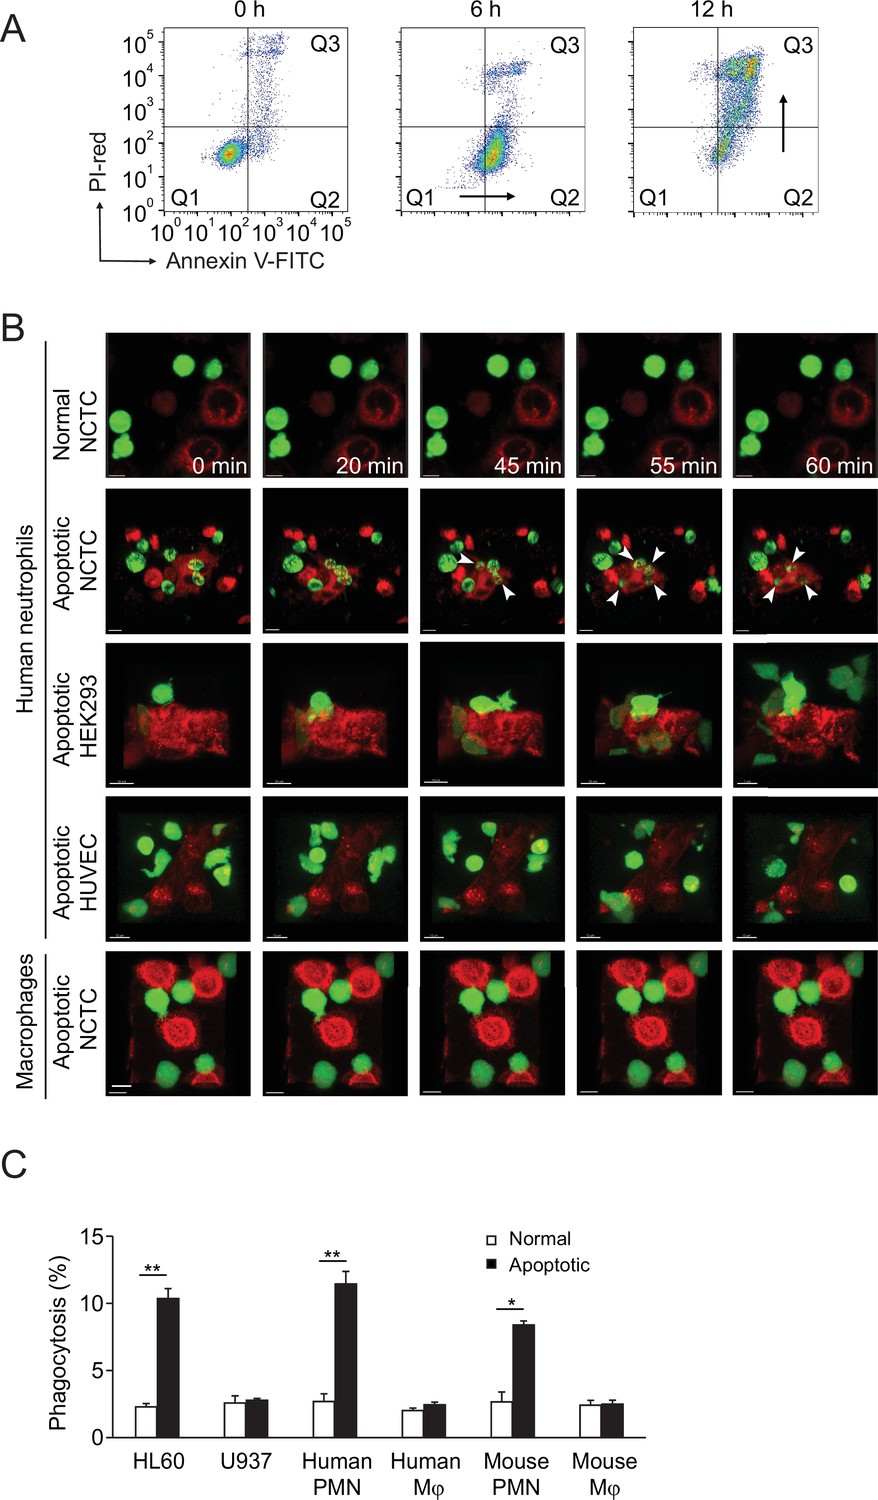
Neutrophils selectively phagocytose apoptotic liver cells.
(A) Flow analysis of NCTC cells treated with puromycin at indicated time points in the presence of PI-red and Annexin-V-FITC. A lag time seen between PtdSer+ and PI+ is a characteristic feature of apoptotic cells, the cell population moves first from Q1 (AnnexinV-/PI-) to Q2 (AnnexinV+/PI-), then moves to Q3 (AnnexinV+/PI+). In contrast, necrotic cells immediately move from Q1 to Q3 without passing though the Q2 stage. (B) PKH67 (green)-labeled human neutrophils or macrophages interacting with PKH26 (red)-labeled NCTC, HEK293 cells, and HUVECs at the indicated times. Neutrophils only burrowed inside apoptotic NCTC cells (second row, white arrowheads point to the burrowing neutrophil). Bar, 10 µm. (C) Phagocytosis of HL60, U937, human/mouse neutrophils (polymorphonuclear neutrophil [PMN]), or macrophages (Mφ), toward nonapoptotic and apoptotic NCTC cells. *, p<0.05, **, p<0.01 (Student’s t-test). Data are representative of (A, B) or from (C) three independent experiments (mean and sem in C).
Figure 4 with 1 supplement

Apoptotic hepatocytes release signals that attract neutrophils for phagocytosis.
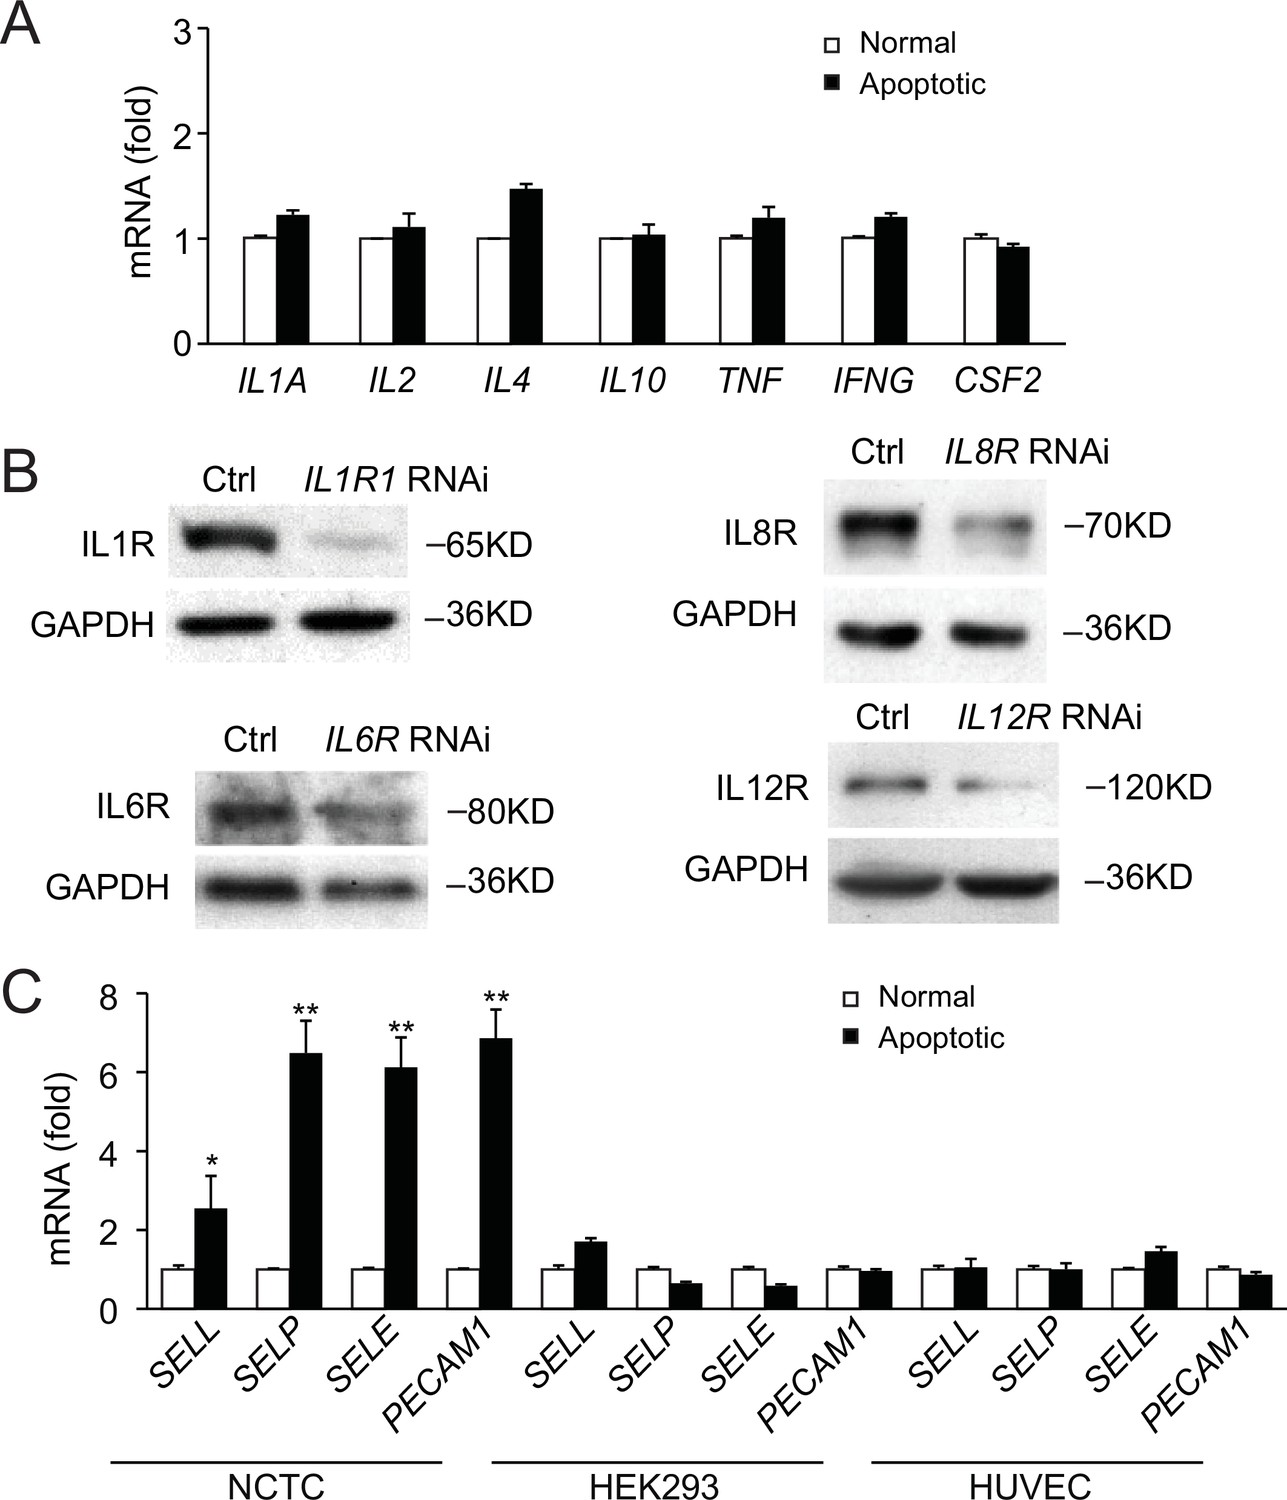
(A–D) Cytokine secretion in apoptotic NCTC cells. IL-1β (A), IL-6 (B), IL-8 (C), and IL-12 (D) levels were significantly increased in apoptotic cells compared with nonapoptotic controls, **, p<0.01, ***, p<0.001 (Student’s t-test). (E) Phagocytosis of nonapoptotic NCTC cells by HL60 cells (ctrl) and of apoptotic NCTC cells by HL60 cells treated without (NT) or with RNAi knockdown of IL-1β, IL-8, IL-6, IL-12 receptors, or with selectin antagonist (bimosiamose), PECAM blocking antibody. *, p<0.05 (Student’s t-test). (F) Images of liver tissues stained with anti-IL-1β or anti-Cas-3. Top row, IL-1β is only associated with apoptotic hepatocytes with condensed chromatin (indicated by black arrowheads) but not with nonapoptotic hepatocytes. Bottom row, IL-1β and Cas-3 staining in 2 µm consecutive liver sections. Both IL-1β and Cas-3 signals are accumulated in the same apoptotic hepatocyte (indicated by black arrowhead). Scale bar, 20 µm. (G) Cell surface receptors in apoptotic NCTC cells compared with nonapoptotic controls. **, p<0.01 (Student’s t-test). Data are from (A–E, G) or representative of three independent experiments (F), mean and sem in (A–E, G).
Figure 4—figure supplement 1
Cytokines and cell surface receptors for perforocytosis.
(A) Cytokines secreted by normal nonapoptotic and apoptotic NCTC cells are not significantly changed, including IL-1α, IL-2, IL-4, IL-10, TNF-α, IFN-γ, and GM-CSF. (B) Immunoblots of target proteins (IL-1b, IL-8, IL-6, IL-12 receptors) in nontreated (Ctrl) and RNAi-treated HL60 cells. RNAi knockdown efficiency ranges from 70% to 90%. (C) Cell surface receptors in apoptotic and nonapoptotic NCTC cells, HEK293 cells, or HUVECs. Data are from (A, C) or representative of (B) three independent experiments (mean and sem in A, C).
-
Figure 4—figure supplement 1—source data 1
Immunoblots of target proteins (IL-1b, IL-8, IL-6, IL-12 receptors) in nontreated (Ctrl) and RNAi-treated HL60 cells.
- https://cdn.elifesciences.org/articles/86591/elife-86591-fig4-figsupp1-data1-v1.pdf
Figure 5 with 1 supplement

Impaired apoptotic clearance in the neutrophil-depleted liver.
(A) Fluorescent images of liver samples from control mice (top row) or neutrophil-depleted mice (antibody depletion; without or with antibiotic, second and third rows). Neutrophils are labeled with neutrophil elastase (NE) immunostaining (purple), macrophages are labeled with F4/80 immunostaining (red), and apoptotic cells are labeled with TUNEL staining (green). Scale bar, 15 µm. (B–D) Cell counts of neutrophils (B) and macrophages (C) in or associated with apoptotic hepatocytes (D) in tissue samples as described in (A). *, p<0.05, **, p<0.01, compared to control (Student’s t-test). Data are representative of (A) or from three independent experiments (B–D; mean and sem in B–D).
Figure 5—figure supplement 1
Neutrophil depletion impairs liver functions.
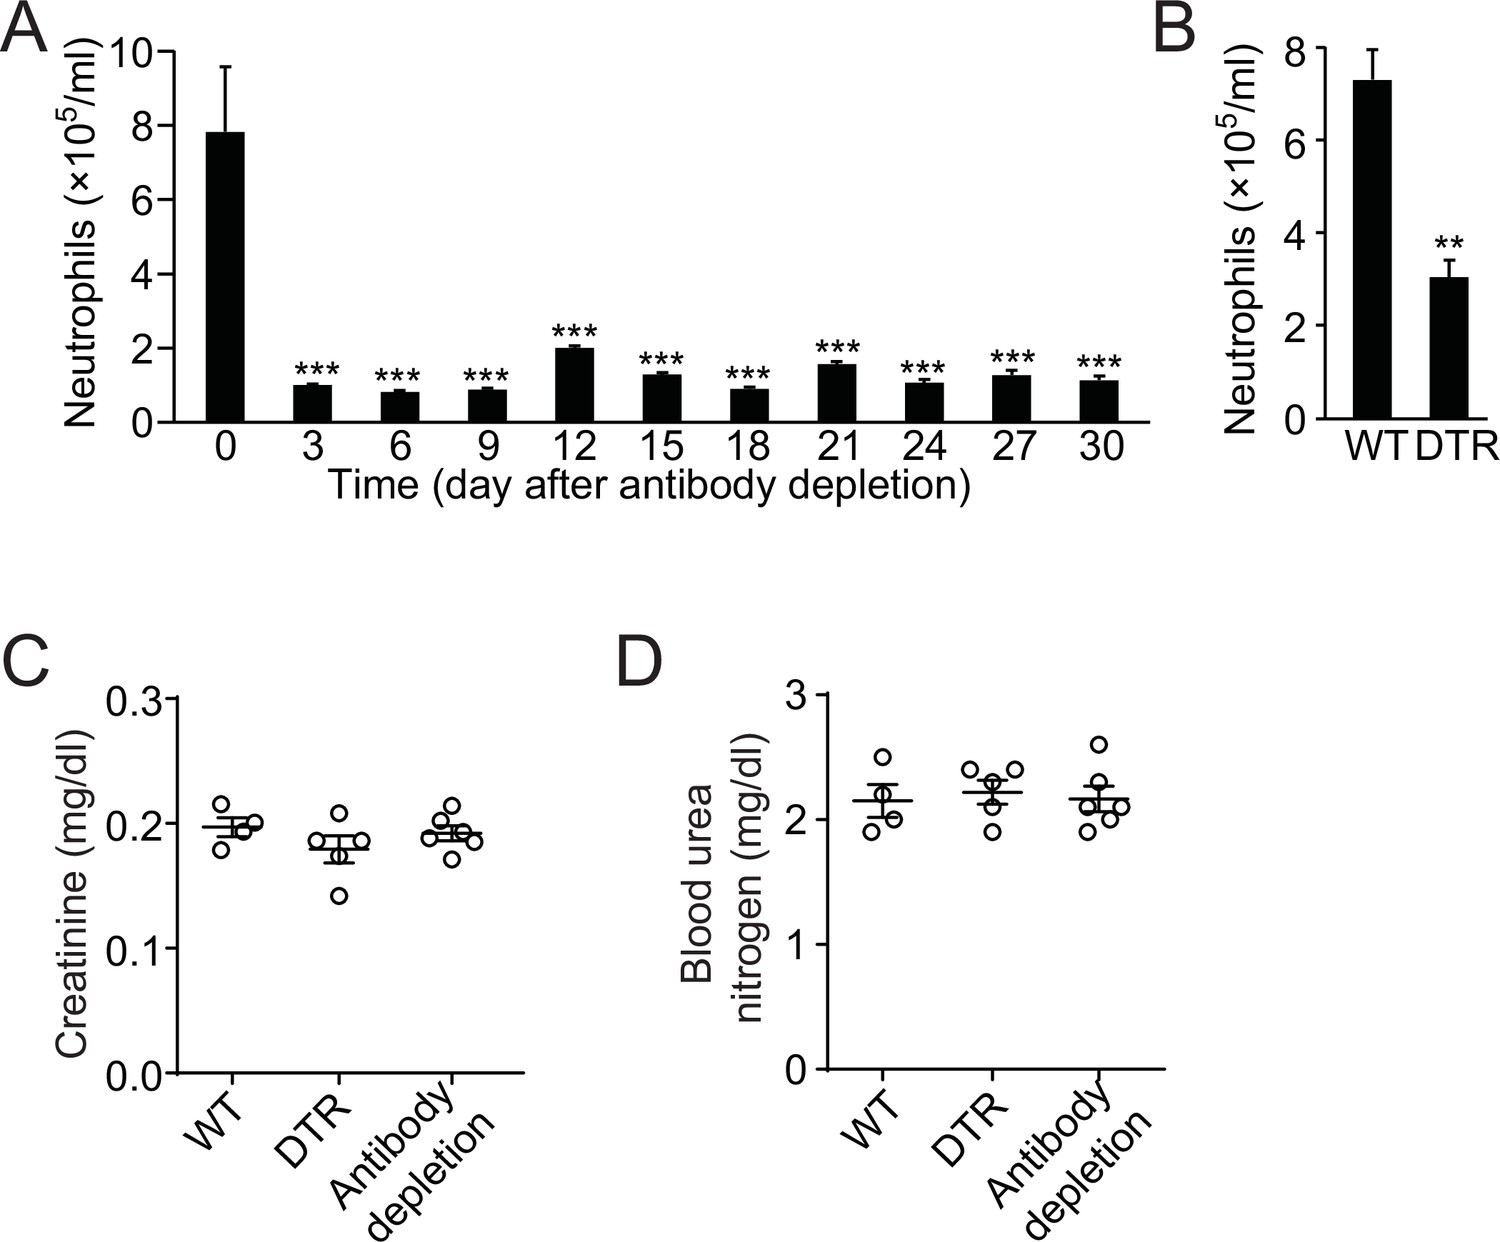
(A, B) Blood neutrophil count after antibody depletion at times indicated (A) or in wild-type (WT) and MRP8cre/DTR mice (B). (C, D) Analysis of creatinine (C) and blood urea nitrogen (D) in WT, MRP8Cre/DTR, and neutrophil-depleted (by antibody) mice. Data are from three independent experiments (mean and sem in A–D).
Figure 6
Analysis of liver function and autoantibody generation in neutrophil-depleted mice.
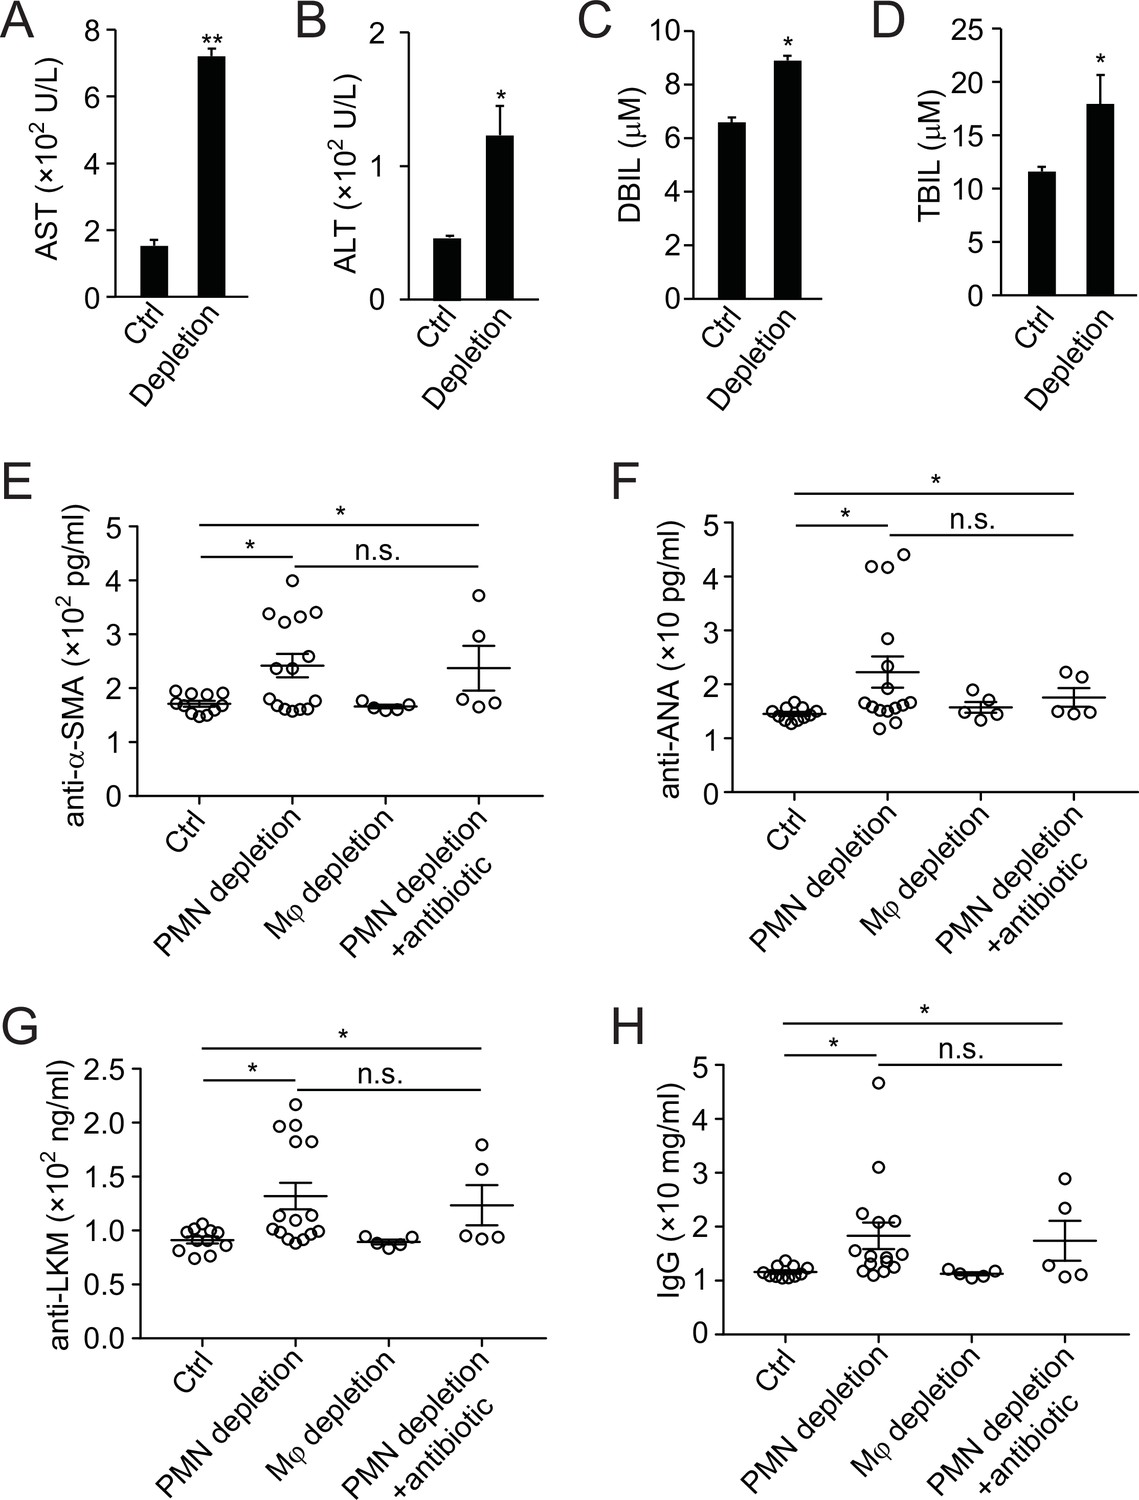
(A–D) Liver function analysis of aspartate aminotransferase (AST, A), alanine aminotransferase (ALT, B), direct bilirubin (DBIL, C), and total bilirubin (TBIL, D) in ctrl or neutrophil-depleted mice (antibody depletion). *, p<0.05, **, p<0.01 (Student’s t-test). (E–H) Expression of autoantibodies against smooth muscle actin (anti-α-SMA, E), antinuclear antigen (anti-ANA, G), liver-kidney microsome (anti-LKM, G), and total IgG (H) in serum of control, neutrophil-depleted (with antibody), macrophage-depleted, or neutrophil-depleted plus antibiotic-treated mice. Data are from three independent experiments (A–H; mean and sem in A–H).
Figure 7
Defective neutrophil perforocytosis in human autoimmune liver (AIL) disease.
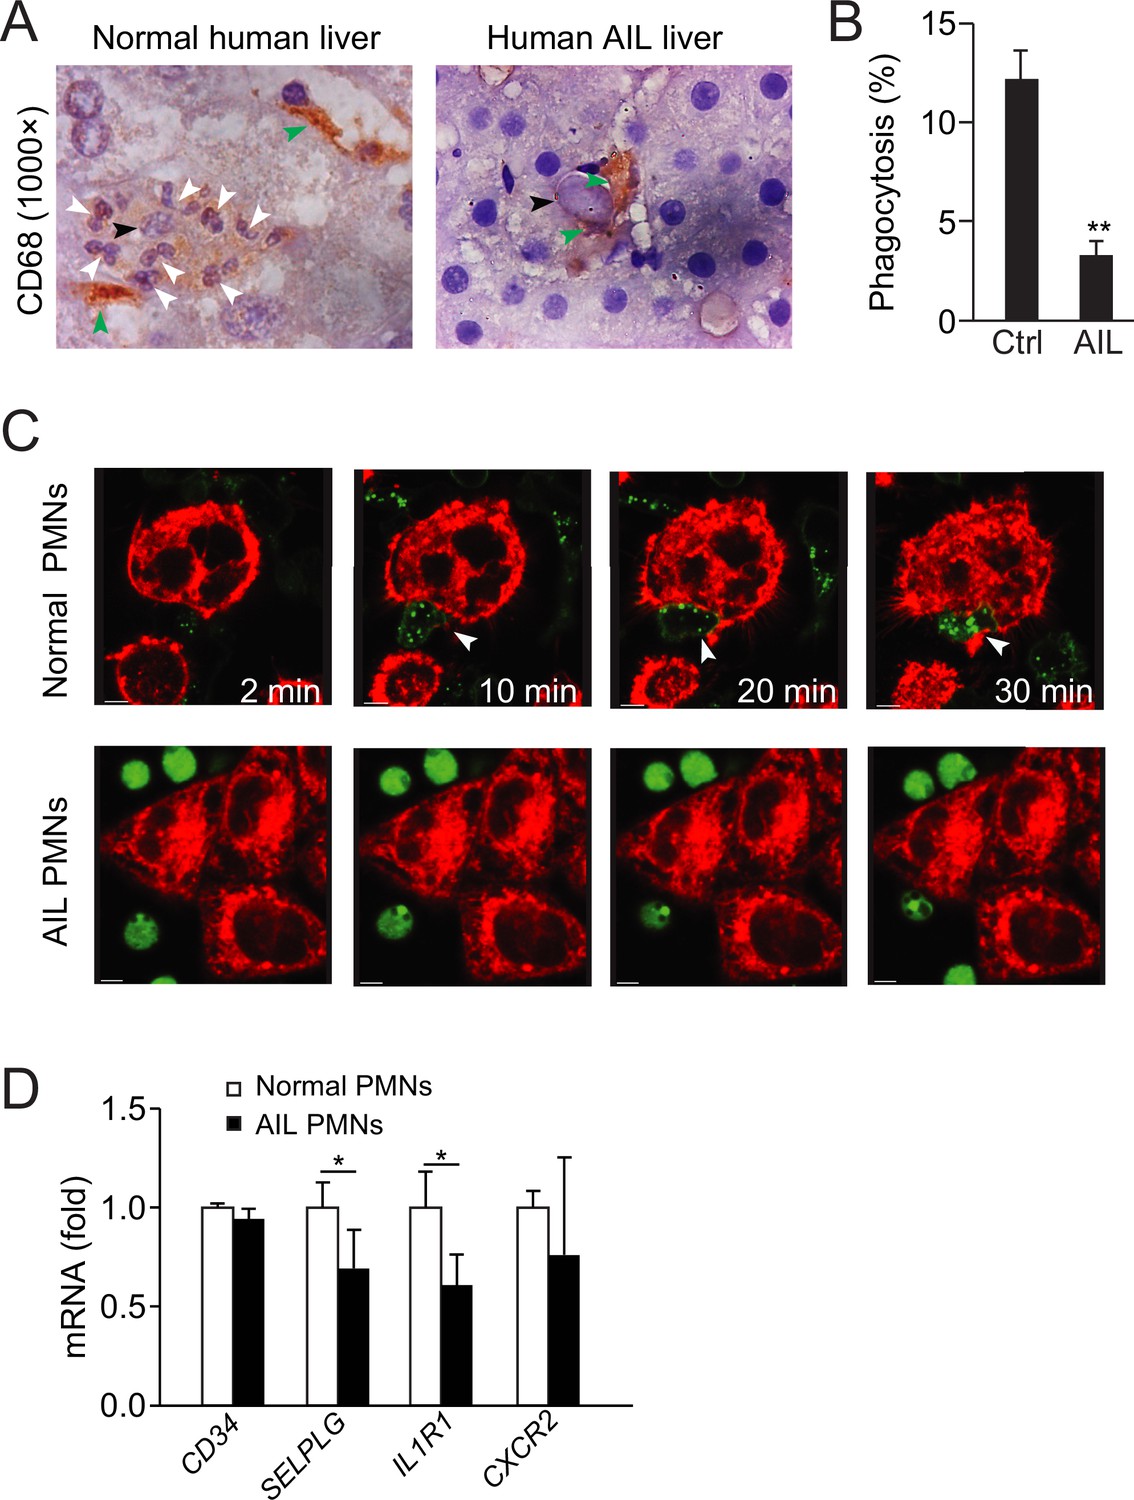
(A) Images of CD68 staining from normal or AIL disease human liver samples. Green arrowheads indicate macrophages, black arrowheads indicate apoptotic bodies, and white arrowheads point to neutrophils. (B, C) Quantification (B) and images (C) of in vitro phagocytosis of apoptotic NCTC cells by neutrophils isolated from normal or AIL disease human patients. White arrowheads point to burrowed neutrophils. Scale bar, 10 µm. *, p<0.05 (Student’s t-test). (D) Analysis of CD34, SELPLG, IL1R1, and CXCR2 expression in neutrophils from normal human and AIL patients by microarray. Data are representative of (A, C) or from three independent experiments (B, D; mean and sem in B, D).
-
Figure 7—source data 1
Analysis of gene expression in neutrophils from normal human and autoimmune liver (AIL) patients by microarray.
- https://cdn.elifesciences.org/articles/86591/elife-86591-fig7-data1-v1.zip
Author response image 1
Author response image 2
Videos
Video 1
Mouse neutrophils burrowed and digested apoptotic hepatocytes in the mouse liver.
Neutrophils were labeled with an i.v. injection of anti-Ly6G antibody (green) and apoptotic cells were labeled with Annexin V (red). Time-lapse images were acquired by the Cellvizio system. The cytoplasm of apoptotic hepatocyte with neutrophil burrowing quickly dwindled and finally disappeared. Two out of 13 apoptotic hepatocytes are shown in Video 1 and Video 2.
Video 2
Neutrophils burrow and clear apoptotic hepatocytes in vivo.
Video 3
Human neutrophils burrowed inside apoptotic hepatocytes.
A human neutrophil (green, pointed by white arrow) was burrowing into an apoptotic hepatocyte (red). Time-lapse video was recorded for 60 min and followed by reconstructed 3D images at 20 and 60 min. At 20 min, the neutrophil partially entered the hepatic cell and did not phagocytose (neutrophil was extracted and analyzed by IMARIS software and no red dye inside the neutrophil). At 60 min, the neutrophil completely burrowed inside the hepatocyte and started to phagocytose hepatocyte (with uptake of red dye).
Tables
Table 1
The cell numbers of burrowed neutrophils (polymorphonuclear neutrophils [PMNs]) in apoptotic hepatocytes from human liver tissues.
2D images were taken from regular tissue sections (5 μm thick), and 3D images were taken from 45 μm thick tissue sections and reconstructed by confocal microscope.
| Perferocytosis stage | I | II | III | |
|---|---|---|---|---|
| 2D images | Apoptotic hepatocytes (total 241) | 37 | 130 | 74 |
| Burrowing PMNs (total 1716) | 312 | 931 | 473 | |
| PMNs per apoptotic hepatocyte (mean±sem) | 8.4±4.2 | 7.2±3.4 | 6.4±3.4 | |
| 3D images | Apoptotic hepatocytes (total 60) | 28 | 18 | 14 |
| Burrowing PMNs (total 820) | 406 | 348 | 66 | |
| PMNs per apoptotic hepatocyte (mean±sem) | 14.5±10.0 | 19.3±15.5 | 4.7±2.4 |
Table 2
Analysis of neutrophils burrowing inside apoptotic hepatocytes from human liver samples.
Reconstructed 3D images of neutrophils inside apoptotic hepatocytes (as shown in Figure 1D) are remodeled and analyzed with IMARIS software: anti-E-Cadherin blue staining is set as the source channel to detect hepatic cell boundary, and anti-NE red staining is set as the source channel to detect neutrophils inside blue cells. Only neutrophils inside hepatic cells can be detected. The cell positions of both neutrophils and hepatocytes, and the distances from neutrophils to the hepatocyte border are recorded below (a total of eight apoptotic hepatocytes are analyzed).
| Apoptotic hepatocytes | Hepatocyte position X,Y,Z (µm) | PMNs inside hepatocytes | PMN position X,Y,Z (µm) | PMN distance to hepatocyte border (µm) |
|---|---|---|---|---|
| #1 | 10.8, 10.6, 4.6 | #1 | 13.3, 3.7, 1.9 | 0 |
| #2 | 10.1, 4.1, 3.9 | 1.9 | ||
| #3 | 18.6, 9.8, 3.1 | 1.1 | ||
| #4 | 8.5, 12.2, 3.5 | 1.5 | ||
| #5 | 3.2, 22.6, 7.1 | 1.2 | ||
| #6 | 8.1, 22.7, 7.7 | 3.8 | ||
| #2 | 31.4, 14.7, 7.5 | #1 | 28.1, 21.0, 0.8 | 0 |
| #2 | 31.2, 18.9, 3.5 | 1.5 | ||
| #3 | 30.4, 5.1, 5.1 | 3.1 | ||
| #3 | 38.9, 15.1, 3.0 | #1 | 38.9, 15.2, 3.5 | 1.5 |
| #4 | 28.9, 24.1, 7.9 | #1 | 34.1, 19.4, 11.3 | 10.1 |
| #5 | 16.7, 35.4, 14.2 | #1 | 12.6, 33.2, 7.2 | 5.9 |
| #2 | 15.6, 35.5, 5.6 | 4.4 | ||
| #3 | 18.9, 37.9, 5.1 | 3.9 | ||
| #4 | 13.1, 36.5, 9.9 | 8.6 | ||
| #6 | 25.5, 22.8, 3.0 | #1 | 27.5, 21.9, 2.4 | 1.1 |
| #2 | 25.1, 23.2, 3.4 | 2.2 | ||
| #7 | 15.3, 44.1, 9.4 | #1 | 16.0, 43.0, 8.3 | 3.5 |
| #2 | 13.8, 45.4, 11.0 | 1.2 | ||
| #8 | 24.0, 35.4, 8.8 | #1 | 24.0, 35.7, 9.4 | 8.1 |
Table 3
CD68+ cells’ distribution in human liver tissues with or without apoptotic hepatocytes (perforocytosed by polymorphonuclear neutrophils [PMNs]).
Five μm thick tissue sections were used to stain and count CD68+ cells.
| Total area (μm2) | CD68+ cells | Apoptotic hepatocytes | CD68+ cells/104 μm2(mean±sem) | |
|---|---|---|---|---|
| Liver tissue with PMN perferocytosis | 579,175 | 280 | 40 | 5.8±2.2* |
| Liver tissue without PMN perferocytosis | 403,025 | 267 | 0 | 6.7±2.8* |
-
*
p=0.0962 (Student’s t-test), CD68+ cell numbers are not different in liver tissues with or without PMN perferocytosis.
Table 4
The distribution of CD11b+ cells in human liver tissues with or without apoptotic hepatocytes (perferocytosed by polymorphonuclear neutrophils [PMNs]).
45 μm thick tissue sections were used to stain and count CD11b+ cells.
| Total area (μm2) | CD11b+ cells | Apoptotic hepatocytes | CD11b+ cells/104 μm2(mean±sem) | |
|---|---|---|---|---|
| Liver tissue with PMN perferocytosis | 138,905 | 12 | 17 | 1.1±1.4* |
| Liver tissue without PMN perferocytosis | 228,508 | 72 | 0 | 3.1±3.0* |
-
*
p=0.0013 (Student’s t-test), CD11b+ cell numbers are lower in liver tissues with PMN perferocytosis compared with that without PMN perferocytosis.
Table 5
The distribution of CD45RA+ cells in human liver tissues with or without apoptotic hepatocytes (perferocytosed by polymorphonuclear neutrophils [PMNs]).
45 μm thick tissue sections were used to stain and count CD45RA+ cells.
| Total area (μm2) | CD45RA+ cells | Apoptotic hepatocytes | CD45RA+ cells/104 μm2(mean±sem) | |
|---|---|---|---|---|
| Liver tissue with PMN perferocytosis | 57,367 | 7 | 10 | 1.4±1.2* |
| Liver tissue without PMN perferocytosis | 280,880 | 54 | 0 | 1.9±1.9* |
-
*
p=0.309 (Student’s t-test), CD45RA+ cell numbers are not different in liver tissues with or without PMN perferocytosis.
Table 6
Analysis of neutrophils burrowing inside apoptotic hepatocytes from mouse liver samples.
Intravital images of neutrophils inside apoptotic hepatocytes (as shown in Figure 2A) are remodeled and analyzed with IMARIS software: Annexin V blue staining is set as the source channel to detect hepatic cell boundary, and Ly-6G green staining is set as the source channel to detect neutrophils inside blue cells. Only neutrophils inside hepatic cells are detected and calculated. The cell positions of both neutrophils and hepatocytes, and the distances from neutrophils to the hepatocyte border are recorded below (a total of 10 apoptotic hepatocytes are analyzed).
| Apoptotic hepatocytes | Hepatocyte position X,Y,Z (µm) | PMNs inside hepatocytes | PMN position X,Y,Z (µm) | PMN distance to hepatocyte border (µm) |
|---|---|---|---|---|
| #1 | 33772.8, 25874.0, 3077.5 | #1 | 33771.5, 25882.7, 3085.1 | 42.2 |
| #2 | 33768.9, 25877.5, 3083.2 | 44.1 | ||
| #3 | 33780.6, 25864.5, 3071.5 | 55.8 | ||
| #2 | 13583.7, 17933.4, 3955.6 | #1 | 13586.7, 17935.1, 3956.1 | 6.16 |
| #2 | 13581.7, 17932.3, 3955.5 | 6.76 | ||
| #3 | 13550.8, 17833.9, 3950.7 | #1 | 13551.5, 17833.9, 3950.7 | 11.6 |
| #4 | 13493.1, 18060.3, 3947.0 | #1 | 13491.3, 18060.9, 3946.8 | 15.4 |
| #5 | 13539.1, 17922.4, 3946.5 | #1 | 13539.3, 17922.8, 3946.3 | 16.0 |
| #6 | 13504.1, 17853.5, 3946.2 | #1 | 13504.1, 17853.3, 3946.1 | 16.2 |
| #7 | 13440.5, 18190.0, 3941.9 | #1 | 13440.9, 18189.2, 3941.4 | 20.9 |
| #8 | 13368.4, 18069.1, 3938.1 | #1 | 13369.0, 18068.6, 3938.0 | 24.3 |
| #9 | 13034.7, 18056.6, 3909.4 | #1 | 13034.6, 18054.8, 3909.7 | 24.8 |
| #2 | 13034.9, 18060.0, 3908.2 | 24.9 | ||
| #10 | 13019.5, 18118.2, 3902.9 | #1 | 13019.5, 18118.7, 3902.2 | 9.7 |
Table 7
Apoptotic hepatocytes burrowed with polymorphonuclear neutrophils (PMNs) or monocytes in normal human or autoimmune liver (AIL) liver samples.
45 μm thick tissue sections were used to stain and count apoptotic hepatocytes.
| Total liver sample numbers | Apoptotic hepatocytes | Apoptotic hepatocytes burrowed by PMNs | Apoptotic hepatocytes burrowed by monocytes | |
|---|---|---|---|---|
| Normal liver samples | 32 | 227 | 227 | 0 |
| AIL liver samples | 22 | 110 | 8 | 40 |
Appendix 1—key resources table
| Reagent type (species) or resource | Designation | Source or reference | Identifiers | Additional information |
|---|---|---|---|---|
| Strain, strain background C57BL/6 (mouse M) | C57BL/6-Gt(ROSA)26Sortm1(HBEGF)Awai/J | The Jackson Laboratory | 007900 | |
| Strain, strain background B6.cg (mouse M) | B6.Cg-Tg(S100A8-cre,-EGFP)1Ilw/J, Mrp8creTg | The Jackson Laboratory | 021614 | |
| Strain, strain background B6.129 (mouse M) | B6.129S7-Il1r1tm1Imx/J | The Jackson Laboratory | 003245 | |
| Cell line (human) | HL-60 | ATCC | CCL-240 | https://www.cellosaurus.org/CVCL_0002 |
| Cell line (human) | NCTC | ZQXZBIO | ZQ0631 | https://www.cellosaurus.org/CVCL_3066 |
| Cell line (human) | U937 | ATCC | CRL-1593 | https://www.cellosaurus.org/CVCL_0007 |
| Biological sample (human) | Freshly surged human liver from angioma | Huashan Hospital | Dr. Wang Xiangyu | |
| Biological sample (human) | Human hepatocellular patient tissue slides | Zhongshan Hospital | Dr. Ji Yuan | |
| Biological sample (human) | Human paraffin tissue slides from hemangioma patients | Zhongshan Hospital | Dr.Ji Yuan | |
| Biological sample (human) | Freshly surged liver cancer samples | Zhongshan Hospital | Dr. Ji Yuan | |
| Biological sample (human) | Human Blood sample | Longhua Hospital | Dr. Xiaobo Hu | |
| Antibody | Anti-Neutrophil Elastase (Mouse monoclonal) | Abcam | ab131260 | 1:200 |
| Antibody | Anti-E Cadherin antibody (Mouse monoclonal) | Abcam | ab40772 | 1:1000 |
| Antibody | Anti-E Cadherin antibody (Mouse monoclonal) | Abcam | ab76319 | 1:100 |
| Antibody | Cleaved Caspase-3 (Asp175) Antibody (Mouse monoclonal) | Cell Signaling | #9661 | 1:500 |
| Antibody | Anti-Caspase-3 antibody (Mouse monoclonal) | Abcam | ab13847 | 1:200 |
| Antibody | Anti-Myeloperoxidase antibody (Mouse monoclonal) | Abcam | ab9535 | 1:1000 |
| Antibody | Anti-CD68 antibody (Mouse monoclonal) | Abcam | ab955 | 1:1000 |
| Antibody | Anti-CD11b antibody (Mouse monoclonal) | Abcam | ab133357 | 1:2000 |
| Antibody | CD45RA antibody (Rabbit polyclonal) | BD | 337167 | 1:2000 |
| Antibody | Anti-Ly6G antibody (Rabbit polyclonal) | BD | 551460 | 1:1000 |
| Antibody | Anti-F4/80 antibody (Rabbit polyclonal) | BD | 565410 | 1:1000 |
| Antibody | IL-1RI Antibody (Rabbit polyclonal) | SCBT | sc-393998 | 1:1000 |
| Antibody | IL-6Rα Antibody (H-7) (Rabbit polyclonal) | SCBT | sc-373708 | 1:1000 |
| Antibody | IL-8RA Antibody (Rabbit polyclonal) | SCBT | sc-7303 | 1:1000 |
| Antibody | IL-12Rβ1 Antibody (Rabbit polyclonal) | SCBT | sc-365395 | 1:1000 |
| Antibody | PECAM Antibody (Rabbit polyclonal) | Affinity | AF6191 | 1:1000 |
| Antibody | InVivoPlus anti-mouse Ly6G (Rabbit polyclonal) | Bio X Cell | BP0075-1 | 1:1000 |
| Recombinant DNA reagent | IL-1RI shRNA plasmid | SCBT | sc-35651-SH | |
| Recombinant DNA reagent | IL-6Rα shRNA plasmid | SCBT | sc-35663-SH | |
| Recombinant DNA reagent | IL-8RA shRNA plasmid | SCBT | sc-40026-SH | |
| Recombinant DNA reagent | IL-12Rβ1 shRNA Plasmid | SCBT | sc-35649-SH | |
| Commercial assay or kit | In Situ Cell Death Detection Kit | Roche | 11684795910 | |
| Commercial assay or kit | PKH26 Red Fluorescent Cell Linker Kit | Sigma | PKH26GL | |
| Commercial assay or kit | PKH67 Green Fluorescent Cell Linker Kit | Sigma | PKH67GL | |
| Commercial assay or kit | Quant-iT PicoGreen dsDNA | Invitrogen | P11495 | |
| Commercial assay or kit | Total Superoxide Dismutase Assay Kit | Beyotime | S0101S | |
| Commercial assay or kit | Reactive Oxygen Species Assay Kit | Beyotime | S0033S | |
| Commercial assay or kit | Multi-Analyte ELISArray Kits | QIAGEN | MEM‐004A | |
| Commercial assay or kit | Multi-Analyte ELISArray Kits | QIAGEN | MEH‐004A | |
| Commercial assay or kit | Mouse ALT ELISA Kit | mlbio | ml063179-J | |
| Commercial assay or kit | Mouse AST ELISA Kit | mlbio | ml058659 | |
| Commercial assay or kit | Mouse DBIL ELISA Kit | mlbio | ml037215 | |
| Commercial assay or kit | Mouse TB ELISA Kit | mlbio | ml037201 | |
| Commercial assay or kit | Mouse Creatinine ELISA Kit | mlbio | ml037580 | |
| Commercial assay or kit | Mouse Blood urea ELISA Kit | mlbio | ml057588 | |
| Commercial assay or kit | Mouse anti-ANA ELISA Kit | mlbio | ml002245 | |
| Commercial assay or kit | Mouse IgG ELISA Kit | mlbio | ml037601-J | |
| Commercial assay or kit | Mouse anti-LKM ELISA Kit | mlbio | ml025842 | |
| Commercial assay or kit | Mouse anti-α-SMA ELISA Kit | mlbio | ml002066 | |
| Chemical compound, drug | Annexin V | Abbkine | KTA0001 | |
| Chemical compound, drug | Puromycin | Gibco | A1113803 | |
| Chemical compound, drug | pHrodo Red AM | Invitrogen | P35372 | |
| Chemical compound, drug | Bimosiamose | MCE | TBC-1269 | |
| Chemical compound, drug | Ampicillin | Sigma | A9518 | |
| Chemical compound, drug | Clodronate-liposome | YEASEN | 40337ES05 | |
| Chemical compound, drug | α-Galactosylceramide | Abcam | ab144262 | |
| Chemical compound, drug | FasL | R&D Systems | 6128-SA | |
| Chemical compound, drug | NycoPrep | Progen | 1114550 | |
| Chemical compound, drug | Percoll | GE Healthcare | 17-0891-01 | |
| Software, algorithm | Imaris | Bitplane | https://imaris.oxinst.com/ | |
| Software, algorithm | FlowJo | BD Biosciences | https://www.flowjo.com/ | |
| Software, algorithm | GraphPad Prism | GraphPad | https://www.graphpad.com/scientific-software/prism/ | |
| Software, algorithm | ZEN Digital Imaging for Light Microscopy | ZEISS | https://www.zeiss.com |
Author response table 1
| No.total apototic cells | phagocytlized by PMNS | phagocytlized by Monoctye | ||
|---|---|---|---|---|
| normal liver | 32 | 227 | 227 | 0 |
| AIL | 16 | 110 | 8 | 40 |
Additional files
Download links
A two-part list of links to download the article, or parts of the article, in various formats.
Downloads (link to download the article as PDF)
Open citations (links to open the citations from this article in various online reference manager services)
Cite this article (links to download the citations from this article in formats compatible with various reference manager tools)
An unexpected role of neutrophils in clearing apoptotic hepatocytes in vivo
eLife 12:RP86591.
https://doi.org/10.7554/eLife.86591.3


