The Mycobacterium ulcerans toxin mycolactone causes destructive Sec61-dependent loss of the endothelial glycocalyx and vessel basement membrane to drive skin necrosis
- Discipline of Microbes, Infection & Immunity, School of Biosciences, Faculty of Health and Medical Sciences, University of Surrey, United Kingdom
- Cambridge Centre for Proteomics, University of Cambridge, United Kingdom
- Department of Chemistry, Ball State University, United States
- Texas A&M Veterinary Medical Diagnostic Laboratory, United States
- United Kingdom Health Security Agency, UKHSA-Porton Down, United Kingdom
Figures
Figure 1 with 6 supplements

Sec61 inhibition alters primary human endothelial cell morphology and adhesion under static and shear conditions.
HDMECs were exposed to 10 ng/mL mycolactone (Myco), 0.02% DMSO, 400 nM Ipomoeassin F or 20 nM ZIF-80. (A–C). Mycolactone-treated cells were imaged at indicated times in (A) and cell numbers of each phenotype (i.e. normal, elongated or rounded) were counted and presented as a percentage of total cell number per field in (B) (mean ± SEM of three independent experiments, **, p<0.01, *, p<0.05. (C) Length and width of each cell exposed to mycolactone for 16 and 24 hr or DMSO for 24 hr per image were measured and presented as a ratio. Data is representative of three independent experiments. ****, p<0.0001 (D) A scratch was introduced to a HDMEC monolayer prior to the treatment and visualised at 0, 16, 24 hr. The scratch area is presented as a percentage of the value obtained at 0 hr (mean ± SEM of three independent experiments) ns, not significant, *, p<0.05. Cells exposed to an alternative Sec61 inhibitor ipomoeassin F (IpomF) (E) or ZIF-80 (F) were imaged at indicated times. Images are representative of three independent experiments. Scale bar = 100 μm. (G–H). Live cell imaging was performed with the zenCELL Owl incubator microscope every 30 min over 48 hr. Algorithms of cell coverage (G), detached cell numbers (H) per time point from three independent experiments are summarised as mean ± SEM. Data presented as cell coverage relative to the value obtained from initial time point (G) or a % of detached cells to total cell number (H) of each condition. (I) Confluent HDMECs under uniaxial shear stress (SHEAR) or not (STATIC) for 24 hr were then exposed to 0.02% DMSO or 10 ng/ml mycolactone. Phase-contrast images were taken 0, 24 and 48 hr later following return to the same conditions. Data is representative of three independent experiments. (J). Cell numbers of each phenotype at different time points, presented as a percentage of total cell number per field in (I), showing mean of three independent experiments ± SEM, * p<0.05. (K). Length and width measurements of cells exposed to mycolactone or DMSO under shear stress conditions for 24 and 48 hr presented as a ratio. Data is representative of three independent experiments. ****, p<0.0001. Statistical analysis was performed by two-way ANOVA (panel B, D and J) or one-way ANOVA with Dunnett’s (panel C) or Tukey’s (panel D) correction in GraphPad Prism Version 9.4.1 and 10.2.3. Panel K) was analysed using a mixed-effects model with Tukey’s correction for multiple comparisons.
-
Figure 1—source data 1
Data points used to generate the graphs in Figure 1B, C, D, J and K.
Data were generated as described in the respective legend of Figure 1.
- https://cdn.elifesciences.org/articles/86931/elife-86931-fig1-data1-v2.xlsx
Figure 1—figure supplement 1

Dose response of HDMEC to mycolactone produced synthetically (Myco-Syn) or purified from natural sources (Myco-Bio).
Cells were exposed in triplicate to serial dilutions of compound for 96 hr and viability measured with resazurin. Results are expressed as a percentage of the DMSO control. Data from three independent experiments (mean ± SEM).
Figure 1—figure supplement 2
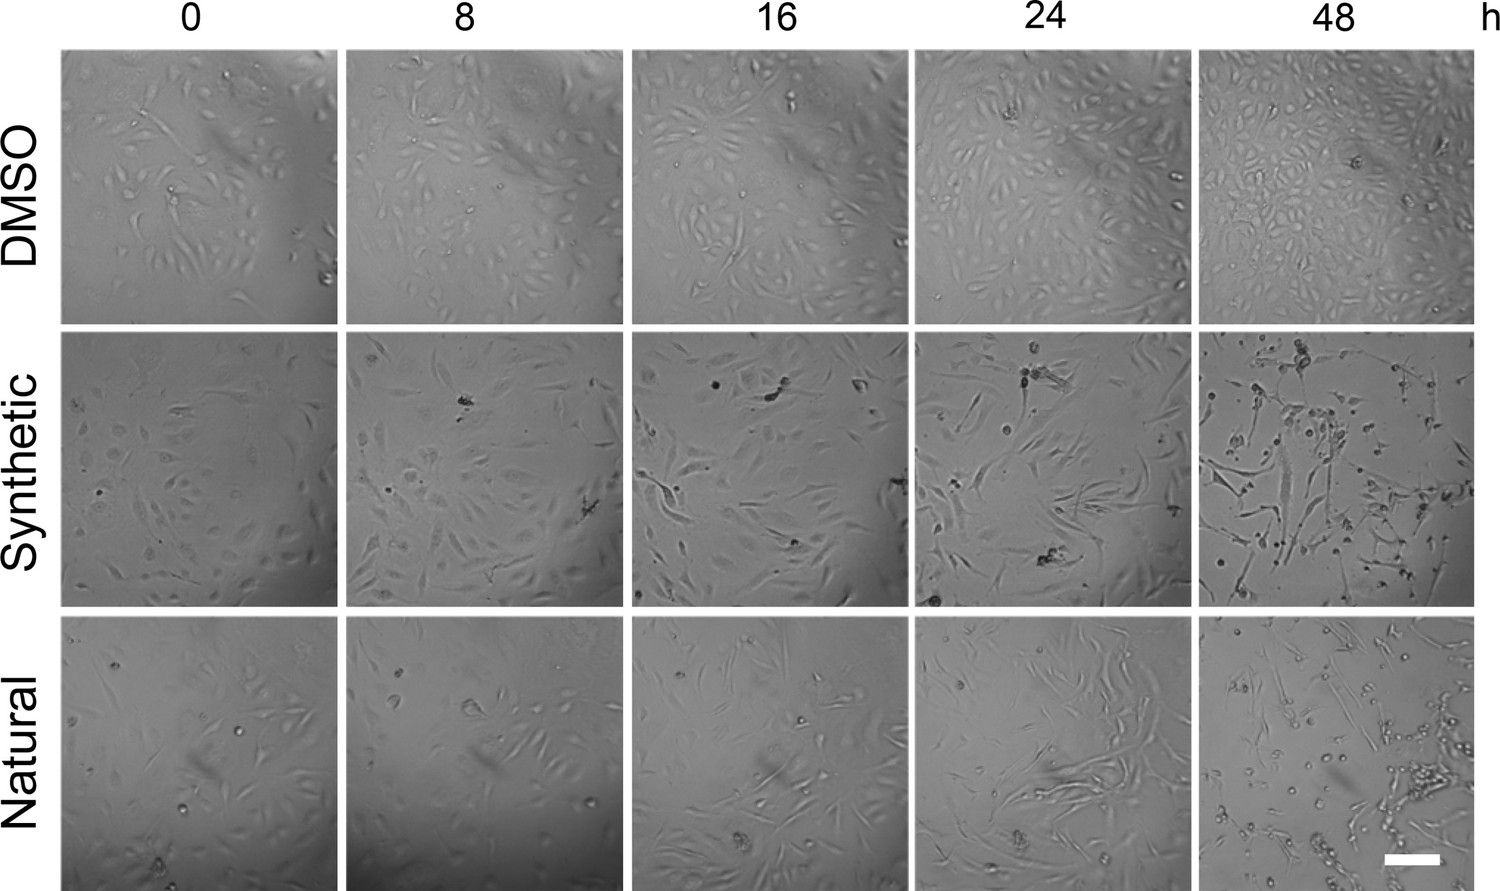
Images of HDMEC treated with 10 ng/ml synthetic (Syn) or natural (Nat) or 0.02% DMSO.
Imaging was performed with the zenCELL Owl incubator microscope over 48 hr. Images from selected times are shown. Scale bar = 50 μm. Images are representative of three independent experiments.
Figure 1—figure supplement 3

Quantification of cell phenotypes in Figure 1—figure supplement 2.
Left panel: Cell numbers of each phenotype were counted and presented as a percentage of total cell number per field (mean ± SD for triplicate wells) *, p<0.05; **, p<0.01, n=1. Right panel: Length and width of cells exposed to mycolactone for 16 and 24 hr or DMSO for 24 hr measured and presented as a ratio. Data is representative of duplicate independent experiments. Statistical analysis was performed by two-way ANOVA in GraphPad Prism Version 9.4.1 and 10.2.3. **, p<0.01; ****, p<0.0001.
Figure 1—figure supplement 4

Quantification of coverage and detachment in Figure 1—figure supplement 2 using zenCELL Owl algorithms of cell coverage (Left panel), detached cell numbers (Right panel).
Data represents the mean ± SD for triplicate wells, and is representative of two independent experiments.
Figure 1—video 1
Timelapse video of HDMECs exposed to 10 ng/mL mycolactone.
Images were taken every 30 min for 48 hr using the zenCELL Owl incubator microscope.
Time stamp and scale bar as indicated.
Figure 1—video 2
Timelapse video of HDMECs exposed to 0.02% DMSO.
Images were taken every 30 min for 48 hr using the zenCELL Owl incubator microscope. Time stamp and scale bar as indicated.
Figure 2 with 2 supplements
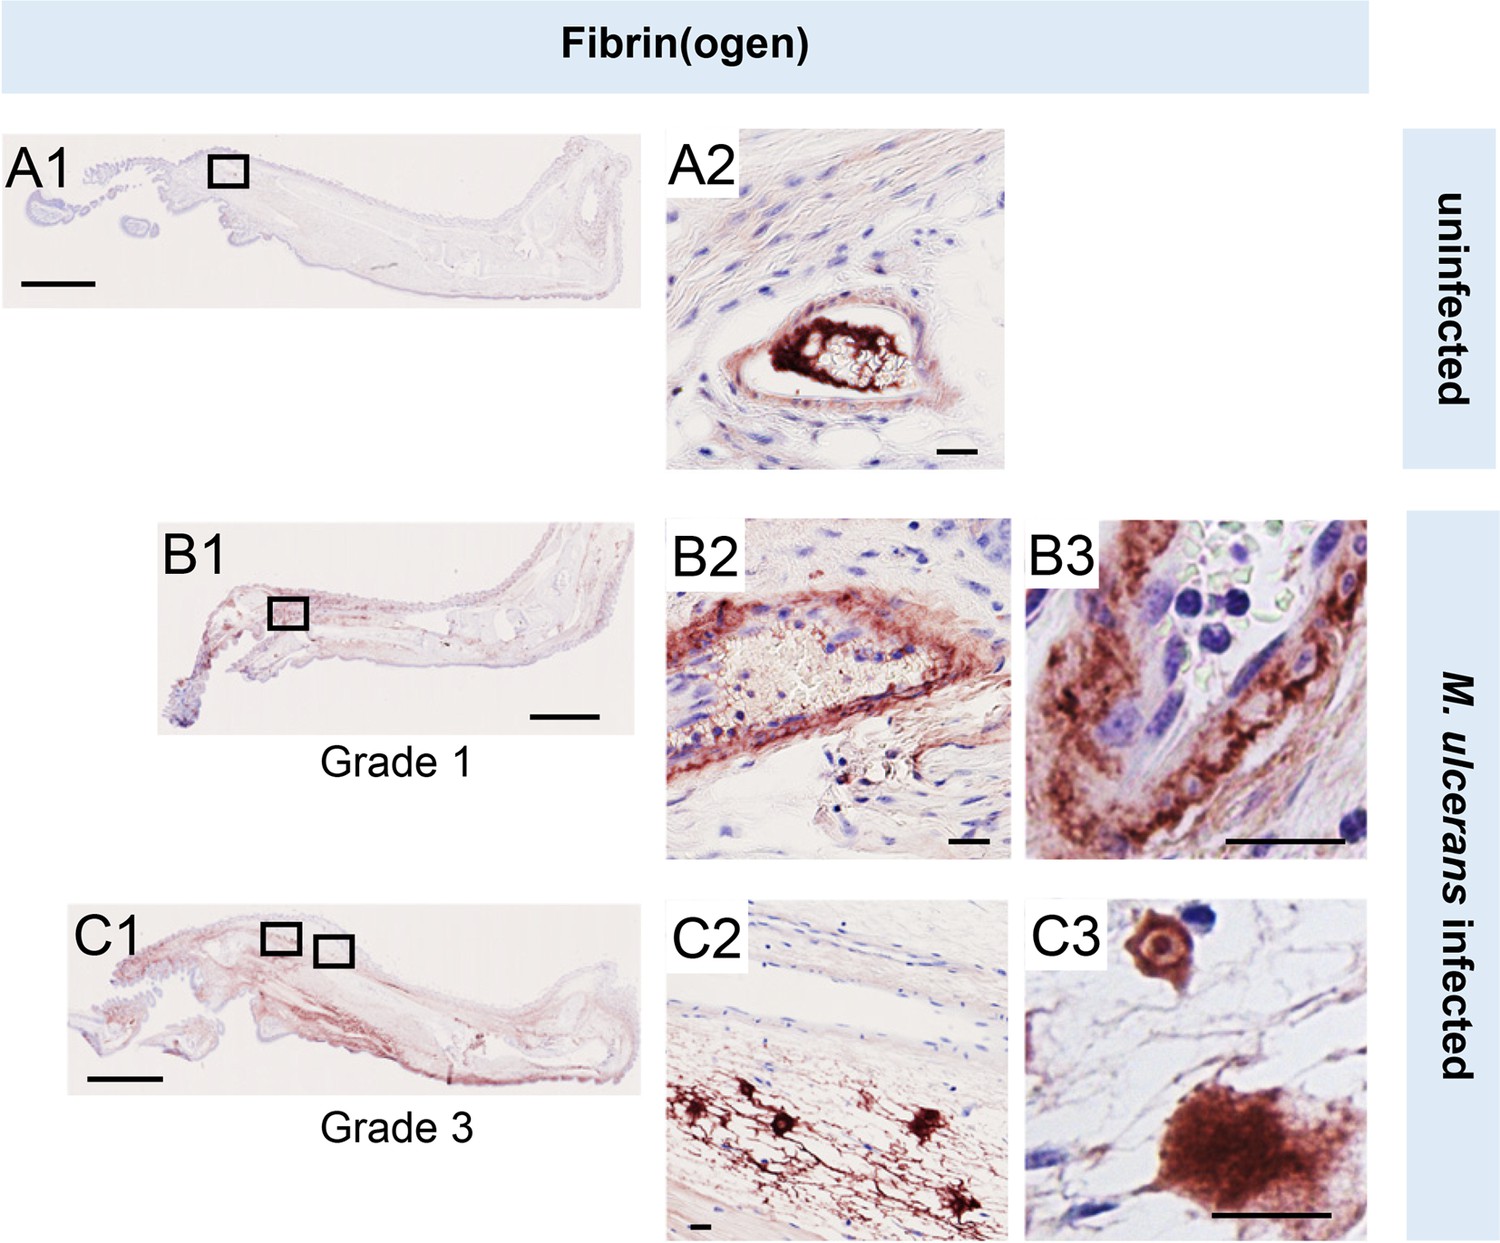
Fibrinogen penetrates the vascular wall at early stages of mouse infection.
Immunohistochemistry for fibrin(ogen) in the feet of C57BL/6 J mice that received vehicle control (PBS) (A1-2) or intradermal injection of 1x10⁵ colony forming units M. ulcerans at 21 (Grade 1; B1-3) or 28 days (Grade 3; C1-3) post-infection. Positive fibrin(ogen) staining is brown in colour, the haematoxylin counterstain is purple. Scale bars in A1, B1, and C1: 2 mm; all others: 20 µm. Data representative of three mice at each infection grade, in two independent infections.
Figure 2—figure supplement 1

Sections stained for acid fast bacilli with Ziehl Neelson stain from mice infected for 21 days (G1) or 28 days (G2).
At 21 days immune cell infiltration as well as apparently intracellular bacteria can be clearly seen in proximity to mycobacterial clusters. Scale bars: 20 μm.
Figure 2—figure supplement 2

M.ulcerans infected mouse feet stained with isotype control antibody.
Scale bars: 20 µm.
Figure 3 with 4 supplements

Mycolactone causes loss of proteins associated with glycosylation, adhesion and migration in primary human endothelial cells.
(A) Workflow for isolation and proteomic analysis of HDMEC membrane proteins. In three independent replicates, HDMEC were exposed to 10 ng/ml mycolactone or DMSO for 24 hr, lysed by hypotonic lysis and membrane fractions enriched by differential centrifugation as described in Methods. Acetone precipitated proteins were reduced, alkylated and trypsinised then subjected to TMT labelling for quantitative proteomic analysis by LC-MS/MS. (B) Volcano Plot of differential expression between DMSO and mycolactone treated samples, plotting mean fold change against false discovery rate adjusted p-values; orange = downregulated, p<0.05; blue = upregulated, p<0.05; black = p > 0.05 (C) Pie charts showing subcellular localisation of proteins in total, >twofold upregulated or downregulated (p<0.05) fractions. (D) Quantitation of membrane or secreted proteins according to type: blue = upregulated; white = unchanged; orange = downregulated. (E) Percentage of downregulated, unchanged and upregulated multi-pass membrane proteins possessing a signal peptide. (F) Overlap between mycolactone downregulated endothelial membrane proteome and Sec61-dependent proteome. Venn diagram created using JVenn (Bardou et al., 2014), showing overlap in significantly downregulated proteome between the dataset presented here and those obtained in Hela cells treated with siRNA for Sec61α (Nguyen et al., 2018). (G) Top significantly over-represented (p<0.05) GO groups in downregulated and upregulated data sets, compared to whole genome. Data generated with WebGestalt. (H) Quantitation of numbers of up and down regulated proteins in GO groups identified in (G).
-
Figure 3—source data 1
Mass spectrometry proteomics data for membrane fractions of HDMEC exposed to DMSO or Mycolactone for 24 hr.
Raw data: HDMEC membrane fraction raw peptide data. Total proteins: Normalised differential expression analysis. Downregulated proteins. Upregulated proteins. Multi-pass membrane proteins >twofold downregulated by mycolactone in HDMEC, with information on whether they have a signal peptide, the amino terminus extracellular, whether they are glycosylated or have at least one long loops (>50aa).
- https://cdn.elifesciences.org/articles/86931/elife-86931-fig3-data1-v2.xlsx
Figure 3—figure supplement 1

Heat map showing fold change detected in this dataset for previously validated endothelial cell mycolactone targets (Ogbechi et al., 2018; Hsieh et al., 2022) Dual-colour coding is shown.
significantly downregulated (p<0.05) or not (p≥0.05) in bold or Italic, respectively.
Figure 3—figure supplement 2

Left panel: Significant association between multipass protein membrane protein signal peptide (SP) ΔG values and level of downregulation by mycolactone (p<0.05).
Membrane protein type and SP sequence based on Uniprot data, ΔG quantified using ΔG Prediction Server V1.0. Right panel: Impact of distance between signal peptide and first transmembrane domain on susceptibility of multipass proteins to downregulation by mycolactone. Statistical analysis was performed by one-way ANOVA with Tukey’s correction for multiple comparisons in GraphPad Prism Version 9.4.1 and 10.2.3. *, p<0.05.
Figure 3—figure supplement 3
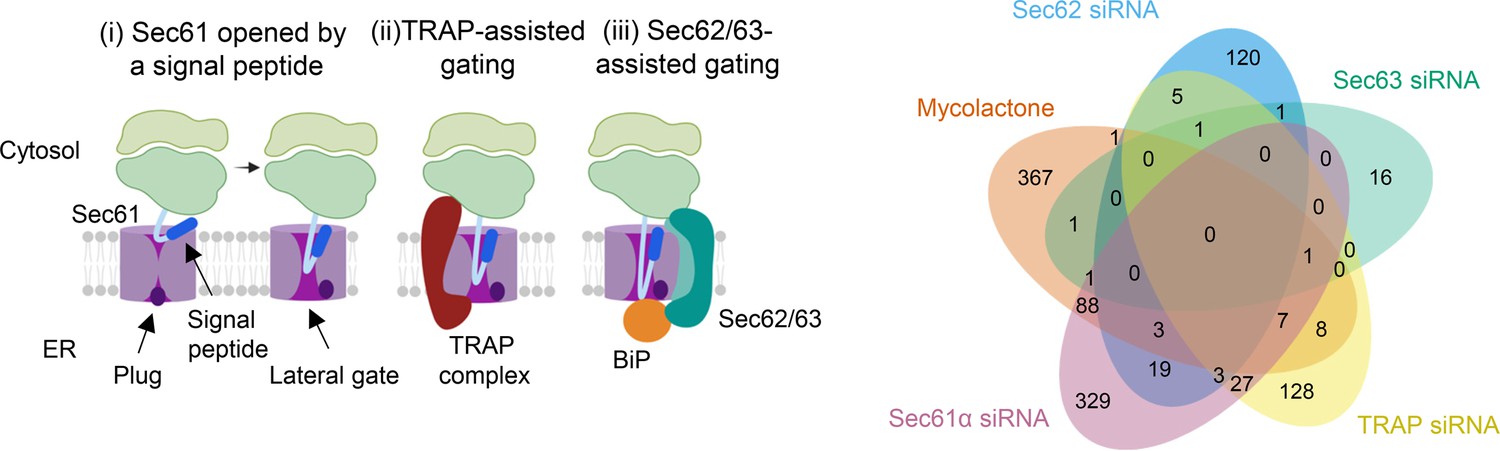
Left panel: Model depicting assisted and unassisted channel opening by signal peptides.
(i) Binding of a nascent chain signal peptide to Sec61α opens a lateral gate into the membrane and causes a shift in the position of the plug domain, allowing access to the ER lumen. (ii) TRAP increases translocation of proteins whose signal peptides bear a high GP content. TRAP is a heterotetrameric complex which interacts with the ribosome on the cytosolic side of the ER membrane and with Sec61α on the luminal side, binding to a hinge region between the N- and C-terminal halves of the protein facilitating channel opening (iii) The Sec62/63 complex is involved in post-translational translocation but can also assist opening of the channel for proteins with signal peptides that gate slowly due to the presence relatively long but less hydrophobic “H-regions” and lower carboxy terminal polarity. This complex also interacts with the ribosome and the translocon and may also interact directly with the nascent peptide chain. In addition, Sec63 recruits BiP to the translocon to further assist channel opening on the luminal side. Right panel: Overlap between mycolactone-downregulated endothelial membrane proteome and translocon-dependent proteome. Venn diagram created using JVenn showing overlap in significantly downregulated proteome between the dataset presented here and those obtained in Hela cells treated with siRNA for Sec61α and translocon associated protein TRAP or HEK293 cells with Sec62 or Sec623 knocked out (Nguyen et al., 2018; Schorr et al., 2020).
Figure 3—figure supplement 4

Top significantly over-represented (P<0.05) Gene Ontology groups in upregulated data set, compared to whole genome.
Data generated with WebGestalt.
Figure 4 with 3 supplements

Endothelial glycosaminoglycan chain synthesis is blocked by mycolactone in primary human endothelial cells.
HDMECs exposed to 10 ng/mL of mycolactone (Myco) or 0.02% DMSO for 24 hr or indicated times were subjected to proteomic analysis (A–D), surface immunostaining (E–F, H) or immunoblotting (G). (A) Volcano Plot of differential expression between DMSO and mycolactone-treated samples, plotting mean fold change against false discovery rate adjusted p-values. Pale blue = total detected proteins; dark blue = Type II membrane proteins; yellow = Golgi-localised Type II membrane proteins. (B) Violin plot showing fold change in protein levels for Type II membrane proteins grouped according to subcellular location. ns, not significant; **, p<0.01; ****, p<0.0001. (C) Heat map showing fold change in Golgi-localised O- and N-glycosylation enzymes in mycolactone exposed HDMEC. Dual-colour coding is shown, only one unique peptide detected in asterisks, and significantly downregulated (p<0.05) or not (p≥0.05) in bold or Italic, respectively. (D) Genes in GAG biosynthesis categorised according to function and side chains of chondroitin sulphate/ dermatan sulphate (CS/DS), heparan sulphate (HS) or keratan sulphate (KS). Heatmap showing Log2 fold change of these genes in response to mycolactone in three independent experiments. Dual-colour coding is shown. Genes undetected are indicated as crossed, only one unique peptide detected in asterisks, and significantly downregulated (p<0.05) or not (p≥0.05) in bold or Italic, respectively. (E–F) Cells were treated with or without chondroitinase ABC (ABC) or heparinase III (HepIII), immunostained with anti-chondroitin sulphate (CS), anti-Δ-heparan sulphate (dHS) antibodies or the isotype controls for flow cytometry analysis. Histogram plot for single cell population of CS (E) and dHS (F) and the respective mean fluorescence intensity (MFI) are shown. Unstained untreated cells filled grey; isotype control of untreated cells, dashed line in black; untreated cells incubated with chondroitinase ABC prior to CS staining or without HepIII prior to dHS staining, grey line; untreated cells with CS-PE or dHS-PE, black line; cells exposed to DMSO stained with antibodies, blue line; cells exposed to mycolactone stained with antibodies, red line. MFI is presented as a % of untreated control (mean ± SEM of three independent experiments). **, p<0.01; ***, p<0.001; ****, p<0.0001. (G) Cells were lysed, treated with heparinase III and analysed by immunoblotting. HS neoepitopes were visualised with anti- Δ-heparan sulphate (dHS) antibody with the approximate migration of molecular weight markers in kDa. GAPDH used as loading control. Images are representative of three independent experiments. (H) Cells were incubated with HepIII, fixed and immunostained with anti-dHS antibody (green), permeabilised and labelled with TRITC-conjugated phalloidin (magenta). Nuclei were stained with DAPI (blue). Images are representative of two independent experiments. Scale bar = 50 μm. Statistical analysis was performed one-way ANOVA with Tukey’s (panel B) or Dunnett’s (panel E&F) correction for multiple comparisons in GraphPad Prism Version 9.4.1 and 10.2.3.
-
Figure 4—source data 1
Data points used to generate the graphs in Figure 4E and F.
Data were generated as described in the respective legend of Figure 4.
- https://cdn.elifesciences.org/articles/86931/elife-86931-fig4-data1-v2.xlsx
-
Figure 4—source data 2
Annotated immunoblots from Figure 4G.
- https://cdn.elifesciences.org/articles/86931/elife-86931-fig4-data2-v2.zip
-
Figure 4—source data 3
Raw immunoblots from Figure 4G.
- https://cdn.elifesciences.org/articles/86931/elife-86931-fig4-data3-v2.zip
Figure 4—figure supplement 1

Downregulated intracellular proteins in HDMECs following 24 hr exposure to 10 ng/mL mycolactone, according to subcellular location, presented as percentage of total.
Figure 4—figure supplement 2

Impact of membrane anchor ΔG values on fold change in expression induced by mycolactone for all identified Type II membrane proteins.
Figure 4—figure supplement 3

Cartoon representing mycolactone-downregulated steps of GAG enzymatic synthesis.
Each intermediate product is shown in blue and alongside with its responsible enzyme(s). Candidates significantly downregulated (p<0.05) by mycolactone are shown in red, unchanged in black and undetected in grey. Unique peptide numbers detected in proteome are in purple (underlined).
Figure 5 with 2 supplements
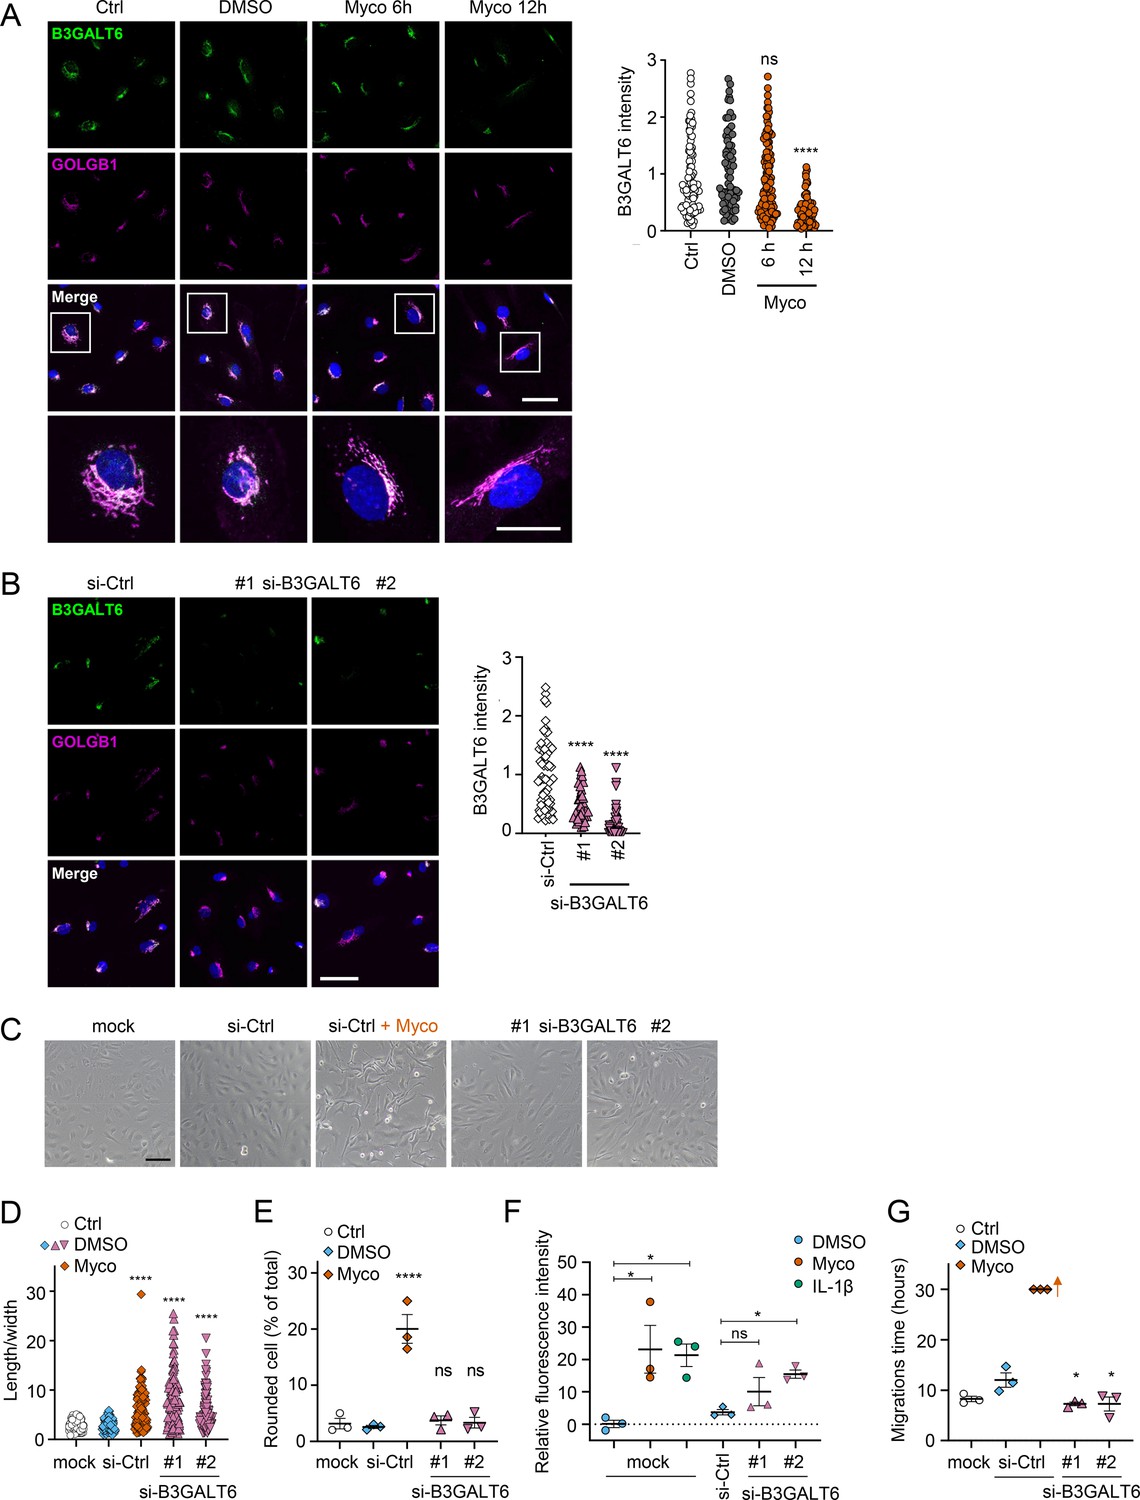
Loss of B3GALT6 affects endothelial cell morphology and monolayer permeability in primary human endothelial cells.
(A) HDMECs exposed to 10 ng/mL mycolactone (Myco) or 0.02% DMSO for indicated times. (B–G) HUVECs transfected with si-B3GALT6 or si-negative control (Ctrl) oligos for 48 hr. (A–B) Cells were fixed, permeabilised and immunostained with anti-B3GALT6 and anti-GOLGB1 antibodies. B3GALT6 (green) and the Golgi apparatus (magenta) were visualised and nuclei stained with DAPI (blue). Scale bar = 50 μm (20 μm in the crop panels of A). Corrected total cell fluorescence of B3GALT6 in Golgi apparatus per cell was measured and presented as a value normalised to the mean value obtained from untreated control of each experiment. More than 30 cells per condition were measured per experiment. Images and quantification are representative of three independent experiments. (C–E) HUVECS exposed to 10 ng/mL mycolactone (Myco) or 0.02% DMSO for 24 hr one day post-transfection were imaged by an inverted microscope. (D) Length and width of each cell presented as a ratio. At least 100 cells were measured for each treatment. Values are representative of three independent experiments. (E) Rounded cell number per image presented as a % of total cell number per condition (values represent the mean ± SEM of three independent experiments). (F) Permeability of transfected HUVEC monolayers on inserts with 1 μm pores treated with 100 ng/mL IL-1β, 10 ng/mL mycolactone (Myco) or 0.02% DMSO for 24 hr was quantified. Fluorescence intensity of FITC-dextran in the receiver wells was measured and presented as a % where 100% is the value obtained from transwells lacking a cell monolayer, and 0% is untreated control wells (mean ± SEM of three independent experiments). (G) HUVECs were transfected with si-B3GALT6 or si-negative control (si-Ctrl) oligos. A scratch was introduced to the monolayer prior to the treatment (10 ng/mL mycolactone (Myco) or DMSO) and live cell imaging was performed with the zenCELL Owl incubator microscope every 15 min for 30 hr. Migration time in hours (hrs) to reform the monolayer is presented as mean ± SEM (n=3); wells with no visible monolayer at the end point were given a maximum value = 30. ns, not significant; *, p<0.05; ****, p<0.0001. Statistical analysis was performed using one-way ANOVA with Dunnett’s correction for multiple comparisons in GraphPad Prism Version 9.4.1 and 10.2.3 (all analysed panels).
-
Figure 5—source data 1
Data points used to generate the graphs in Figure 5A, B, D, E, F and G.
Data were generated as described in the respective legend of Figure 5.
- https://cdn.elifesciences.org/articles/86931/elife-86931-fig5-data1-v2.xlsx
Figure 5—figure supplement 1

HDMECs exposed to 10 ng/mL synthetic (Myco-Syn) or natural mycolactone (Myco-Bio) or 0.02% DMSO for 24 hr were fixed, permeabilised and immunostained with anti-B3GALT6 and anti-GOLGB1 antibodies.
B3GALT6 (green) and GOLGB1 (magenta) were visualised and nuclei stained with DAPI (blue). Scale bar = 50 μm (20 μm in the crop panels). Corrected total cell fluorescence of B3GALT6 in Golgi apparatus per cell measured and presented as a value normalised to the mean value obtained from untreated control of each experiment. At least 60 cells per condition were measured. Data is representative of duplicate experiments. Statistical analysis was performed by one-way ANOVA with Dunnett’s correction for multiple comparisons in GraphPad Prism Version 9.4.1 and 10.2.3. ****, p<0.0001.
Figure 5—figure supplement 2

HDMECs exposed to 10 ng/mL of mycolactone (Myco), 0.02% DMSO, 20 nM ZIF-80 or untreated for 24 hr were fixed, permeabilised and immunostained with anti-B3GALT6 and anti-GOLGB1 antibodies and nuclei stained with DAPI.
Images are representative of two independent experiments. Scale bar = 50 μm.
Figure 6 with 3 supplements

Mycolactone causes a rapid loss of multiple proteoglycans in primary human endothelial cells.
HDMECs exposed to 10 ng/mL mycolactone (Myco), 0.02% DMSO or 20 nM ZIF-80 for 24 hr or indicated times. (A) Heatmap showing representative data for genes encoding proteoglycans. Dual-colour coding for log2 fold change in response to Myco is shown. Possible attached glycosaminoglycan chains such as heparan sulphate (HS), chondroitin sulphate (CS) or dermatan sulphate (DS) shown. Candidates with one unique peptide detected indicated with asterisks, significantly downregulated (p<0.05) or not (p≥0.05) in bold or Italic, respectively. (B) Cells were harvested for flow cytometry analysis. Histogram plots for single cell population of HSPG2, GPC1, and BGN. Unstained untreated cells, filled grey; isotype control of untreated cells, dashed black line. untreated cells stained with antibodies, black line; cells exposed to DMSO stained with antibodies, blue line; cells exposed to mycolactone stained with antibodies, red line. MFI is presented as a % of untreated control (mean ± SEM of three independent experiments). **, p<0.01; ***, p<0.001; ****, p<0.0001. (C) Cells were fixed and immunostained with anti-perlecan antibody (green), permeabilised and labelled with TRITC-conjugated phalloidin (magenta). Nuclei were stained with DAPI (blue). Images are representative of three independent experiments. Scale bar = 50 μm. Statistical analysis was performed using one-way ANOVA with Dunnett’s correction for multiple comparisons in GraphPad Prism Version 9.4.1 and 10.2.3 (all analysed panels).
-
Figure 6—source data 1
Data points used to generate the graphs in Figure 6B.
Data were generated as described in the respective legend of Figure 6.
- https://cdn.elifesciences.org/articles/86931/elife-86931-fig6-data1-v2.xlsx
Figure 6—figure supplement 1

HUVECs exposed to 10 ng/mL of mycolactone (Myco), 0.02% DMSO or remained untreated for indicated times.
Cells were harvested for flow cytometry analysis. Histogram plots for single cell population of HSPG2 and GPC1. Unstained, untreated cells, filled grey; isotype control of untreated cells, dashed black line. untreated cells stained with antibodies, black line; cells exposed to DMSO stained with antibodies, blue line; cells exposed to mycolactone for 2, 6, and 24 hr stained with antibodies, pink, orange and red line, respectively. MFI is presented as a % of untreated control (mean ± SEM of three independent experiments). Statistical analysis was performed by one-way ANOVA with Dunnett’s correction for multiple comparisons in GraphPad Prism Version 9.4.1 and 10.2.3. ns, not significant; **, p<0.01; ***, p<0.001.
Figure 6—figure supplement 2

HDMECs exposed to 10 ng/mL synthetic (Syn) or natural mycolactone (Nat) or 0.02% DMSO for 24 hr.
Cells were fixed and immunostained with anti-HSPG2 antibody (green), permeabilised and labelled with TRITC-conjugated phalloidin (magenta). Nuclei were stained with DAPI (blue). Scale bar = 20 μm, Data from one experiment.
Figure 6—figure supplement 3

Confluent HDMECs under uniaxial shear stress for 24 hr were then exposed to 0.02% DMSO or 10 ng/ml mycolactone (Myco) for 48 hr under the same conditions then fixed and stained with anti-HSPG2 antibody (green) and counterstained with DAPI (blue).
Scale bar = 10 μm, data from one experiment.
Figure 7 with 4 supplements
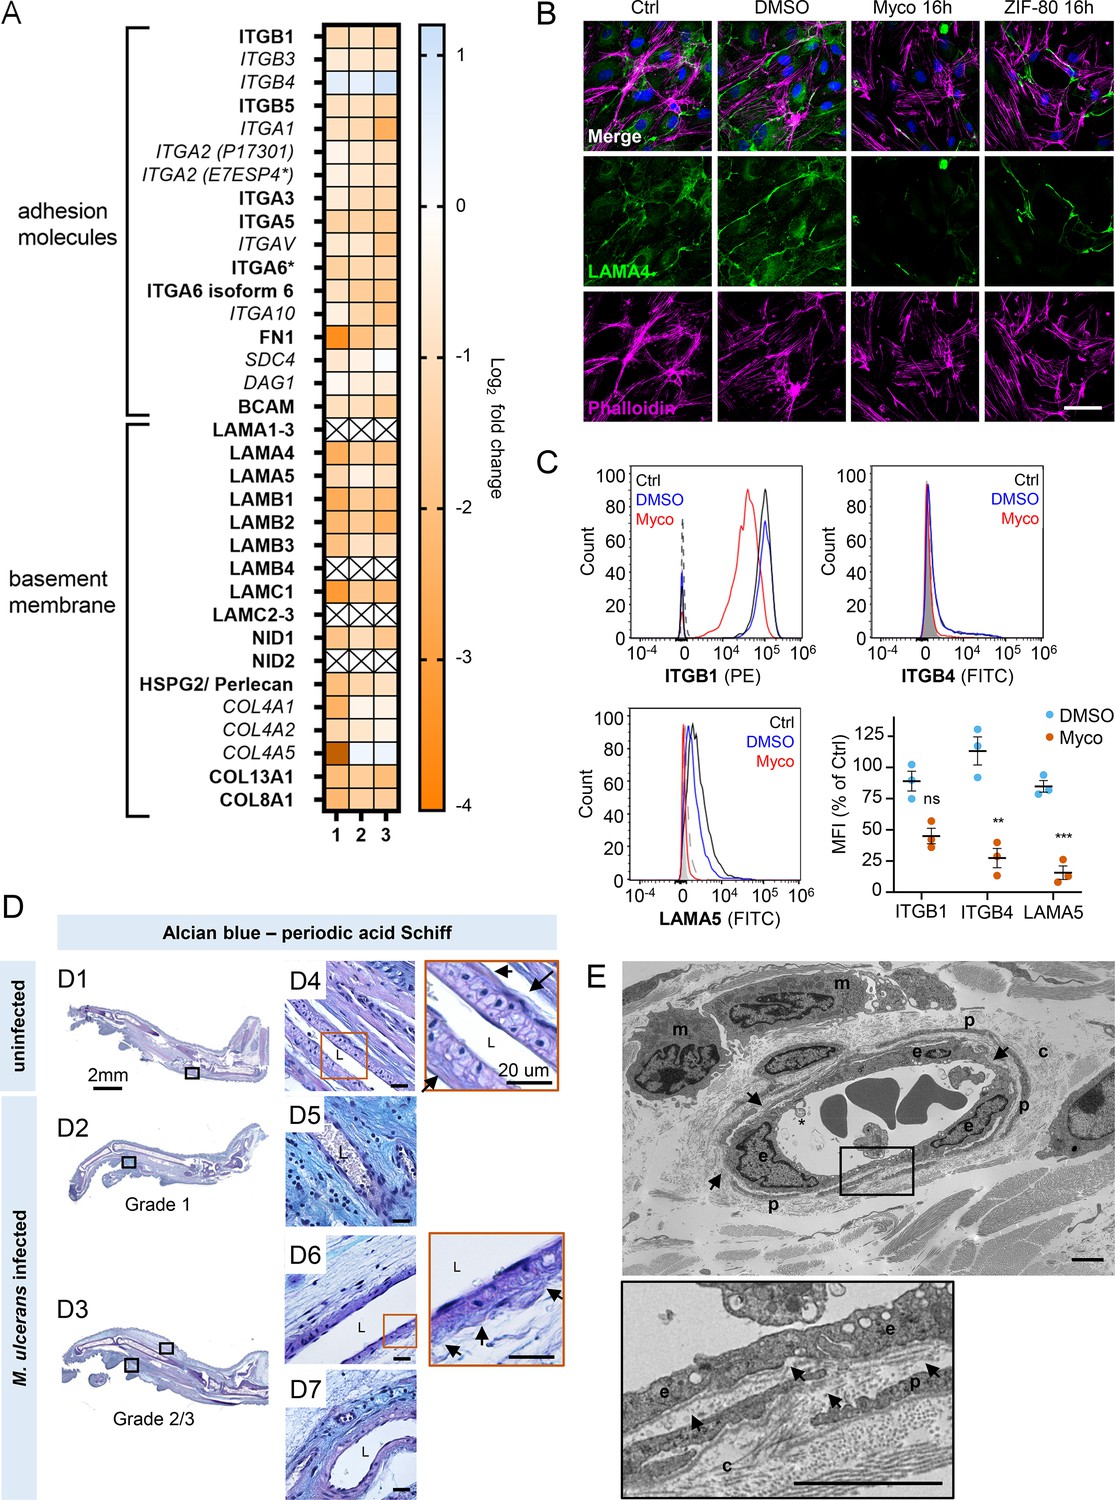
Mycolactone depletes primary human endothelial adhesion molecules and basement membrane proteins, and damages the basement membrane during mouse infection.
(A–C) HDMECs exposed to 10 ng/mL mycolactone (Myco), 0.02% DMSO or 20 nM ZIF-80 for 24 hr or indicated times. (A) Heatmap showing representative data for genes encoding junctional or adhesion molecules, basement membrane components and proteins involved in platelet adhesion. Dual-colour coding for log2 fold change in response to Myco is shown. Candidate with one unique peptide detected is indicated with asterisks, significantly downregulated (p<0.05) or not (p≥0.05) in bold or Italic, respectively. (B) HDMEC were fixed and immunostained with anti-laminin α4 antibody (green), permeabilised and labelled with TRITC-conjugated phalloidin (magenta). Nuclei were stained with DAPI (blue). Images are representative of two independent experiments. Scale bar = 50 μm. (C) HDMEC were harvested for flow cytometry analysis. Histogram plots for single cell population of integrin β1, integrin β4, and laminin α5. Unstained, untreated cells, filled grey; isotype control of untreated cells, dashed black line. untreated cells stained with antibodies, black line; cells exposed to DMSO stained with antibodies, blue line; cells exposed to Myco stained with antibodies, red line. MFI is presented as a % of untreated control (mean ± SEM of three independent experiments). Statistical analysis was performed using one-way ANOVA with Dunnett’s correction for multiple comparisons in GraphPad Prism Version 9.4.1 and 10.2.3; ns, not significant; **, p<0.01; ***, p<0.001. (D–E) C57BL/6 J mice were infected with M. ulcerans bacteria using the footpad model (D) Alcian blue-periodic acid Schiff stain of mice that received vehicle control (PBS) (D1, D4) or intradermal injection of 1*105 colony forming units M. ulcerans at 21 (Grade 1; D2, D5) or 28 days (Grade 2/3; D3, D6-7) post-infection. Neutral glycans are indicated by purple staining and acidic glycans by light blue Blood vessel lumens are indicated by an “L”. Scale bars in D1-3: 2 mm; all others: 20 µm. (E) Representative transmission electron microscopy scan of grade 1 M. ulcerans infected murine footpad. The ultrathin section of glabrous skin shows the pericapillary interstitium slightly expanded, collagen (c) fibrils variably disaggregated and infiltrating macrophages (m). The endothelial cells (e) are reactive and exhibit cytoplasmic projections (*) whilst the basement membrane is multifocally disrupted (arrows). A thin layer of pericytes (p) is variably expanded by oedema. Scale bar: 2 μm.
-
Figure 7—source data 1
Data points used to generate the graphs in Figure 7C.
Data were generated as described in the respective legend of Figure 7.
- https://cdn.elifesciences.org/articles/86931/elife-86931-fig7-data1-v2.xlsx
-
Figure 7—source data 2
Annotated immunoblots from Figure 7—figure supplement 3.
Immunoblots for Figure 7—figure supplement 3 were performed as described in the legend of Figure 7—figure supplement 3. This file shows the full-size blots probed with anti-FN1 and anti-GAPDH antibodies for each of three biological repeats (‘rep 1&2’ and ‘rep 3’), alongside molecular weight markers and annotated for treatments.
- https://cdn.elifesciences.org/articles/86931/elife-86931-fig7-data2-v2.zip
-
Figure 7—source data 3
Raw immunoblots from Figure 7—figure supplement 3.
Immunoblots for Figure 7—figure supplement 3 were performed as described in the legend of Figure 7—figure supplement 3. This folder contains the raw images collected on the Fusion FX Imager (Vilber-Lourmat) for blots probed with anti-FN1 and anti-GAPDH antibodies for each of three biological repeats (‘rep 1&2’ and ‘rep 3’).
- https://cdn.elifesciences.org/articles/86931/elife-86931-fig7-data3-v2.zip
-
Figure 7—source data 4
Annotated immunoblots from Figure 7—figure supplement 4.
Immunoblots for Figure 7—figure supplement 4 were performed as described in the legend of Figure 7—figure supplement 4. This file shows the full-size blots probed with anti-ITGA5 and anti-GAPDH antibodies for each of three biological repeats (‘rep a&b’ and ‘rep c’), alongside molecular weight markers and annotated for treatments.
- https://cdn.elifesciences.org/articles/86931/elife-86931-fig7-data4-v2.zip
-
Figure 7—source data 5
Raw immunoblots from Figure 7—figure supplement 4.
Immunoblots for Figure 7—figure supplement 4 were performed as described in the legend of Figure 7—figure supplement 4. This file shows the full-size blots probed with anti-ITGA5 and anti-GAPDH antibodies for each of three biological repeats (‘rep a&b’ and ‘rep c’), alongside molecular weight markers and annotated for treatments.
- https://cdn.elifesciences.org/articles/86931/elife-86931-fig7-data5-v2.zip
Figure 7—figure supplement 1

HDMECs exposed to 10 ng/mL synthetic (Myco-Syn) or natural mycolactone (Myco-Bio) or 0.02% DMSO for 24 hrs.
Cells were fixed and immunostained with anti-LAMA4 antibody (green), permeabilised and labelled with TRITC-conjugated phalloidin (magenta). Nuclei were stained with DAPI (blue). Scale bar = 20 μm, Data from one experiment.
Figure 7—figure supplement 2

Confluent HDMECs under uniaxial shear stress for 24 hr were then exposed to 0.02% DMSO or 10 ng/ml mycolactone (Myco) for 48 hr under the same conditions, then fixed and stained with anti-LAMA4 antibody (green) and counterstained with DAPI (blue).
Scale bar = 10 μm. Data from one experiment.
Figure 7—figure supplement 3

HDMECs exposed to 10 ng/mL of mycolactone (Myco), 0.02% DMSO or remained untreated for indicated times.
Cells were lysed and subjected to immunoblotting with anti-FN1 antibodies. Each immunoblot intensity was normalised according to GAPDH and untreated controls. Statistical analysis was performed by one-way ANOVA with Dunnett’s correction for multiple comparisons in GraphPad Prism Version 9.4.1 and 10.2.3. ****, p<0.0001. Data from three independent experiments (mean ± SEM).
Figure 7—figure supplement 4

HDMECs exposed to 10 ng/mL of mycolactone (Myco), 0.02% DMSO or remained untreated for indicated times.
Cells were lysed and subjected to immunoblotting with anti-ITGA5 antibodies. Each immunoblot intensity was normalised according to GAPDH and untreated controls. Statistical analysis was performed by one-way ANOVA with Dunnett’s correction for multiple comparisons in GraphPad Prism Version 9.4.1 and 10.2.3. ns, not significant; **, p<0.01. Data from three independent experiments (mean ± SEM).
Figure 8 with 9 supplements

Laminin α5 ameliorates mycolactone-driven primary human endothelial cell detachment and impaired migration.
Endothelial cells exposed to 10 ng/mL mycolactone (Myco) or 0.02% DMSO for 24 hr or indicated times. (A) Treated HDMECs were harvested and re-seeded to laminin-511, 411, 111 or uncoated plates. After an hour, unbound cells were washed away and attached cells were imaged and cell numbers per field are presented as mean ± SEM of three independent experiments. (B–D) Endothelial cells seeded onto laminin-511 or uncoated plates were exposed to mycolactone (Myco) or DMSO. (B–C) HDMECs were imaged every 30 min over 48 hr. Rounded or attached cells per condition were counted at 0, 24, 36, 48 hr. Data are presented as a % of total cell number of each condition (B) or normalised to the attached cell number counted at 0 hr (C) (mean ± SEM of three independent experiments). (D) A scratch was introduced to a HUVEC monolayer prior to treatment. The wounded area was imaged every 15 min for 24 h. Scale bar: 200 μm. Cells migrating into the original scratch area were counted at 0, 8, and 16 hr. Data are presented as cell count per scratch area (mean ± SEM of three independent experiments). ns, not significant; *, p<0.05; **, p<0.01; ***, p<0.001; ****, p<0.0001. Statistical analysis was performed in GraphPad Prism Version 9.4.1 and 10.2.3 using two-way ANOVA with Tukey’s correction for multiple comparisons (all analysed panels; panels B&C also included the Geisser Greenhouse correction for sphericity).
-
Figure 8—source data 1
Data points used to generate the graphs in Figure 8A, B, C and D.
Data were generated as described in the respective legend of Figure 8.
- https://cdn.elifesciences.org/articles/86931/elife-86931-fig8-data1-v2.xlsx
Figure 8—figure supplement 1

HDMECs were harvested and layered to laminin-511, 411, 111 or uncoated wells for one hour.
Non-adherent cells were washed away and attached cells per field were counted. Data from three independent experiments (mean ± SEM). Statistical analysis was performed by a repeated measures one-way ANOVA with Dunnett’s correction for multiple comparisons in GraphPad Prism Version 9.4.1 and 10.2.3. *, p<0.05; ***, p<0.001.
Figure 8—figure supplement 2

HDMEC seeded onto laminin-411, 111 or uncoated plates were exposed to mycolactone (Myco) or DMSO and imaged every 30 min over 48 hr.
Rounded or attached cells per condition were counted at 0, 24, 36, 48 hr. Data are presented as a % of total cell number of each condition (Left panel) or normalised to the attached cell number counted at 0 hr (Right panel). Statistical analysis was performed by a two-way ANOVA with Tukey’s correction for multiple comparisons and the Geisser Greenhouse correction for sphericity in GraphPad Prism Version 9.4.1 and 10.2.3. Data from three independent experiments (mean ± SEM).
Figure 8—figure supplement 3

HDMECs seeded onto different laminin isoforms were untreated or exposed to 0.02% DMSO or 10 ng/mL mycolactone (Myco) for 48 hr.
Their viability was assessed using CellEvent detection kit as described in Ogbechi et al., 2018. The number of live cells (negative for both active caspase 3/7 and PI) in three fields was determined and expressed as a proportion of total cells. Data from three independent experiments (mean ± SEM).
Figure 8—figure supplement 4

A scratch was introduced to a HUVEC monolayer prior to treatment.
The wounded area was imaged every 15 min for 24 hr. Scale bar: 200 μm. Cells migrating into the original scratch area were counted at 0, 8, and 16 hr. Data are presented as cell count per scratch area (mean ± SEM of three independent experiments). Statistical analysis was performed by a two-way ANOVA with Tukey’s correction for multiple comparisons in GraphPad Prism Version 9.4.1 and 10.2.3. ns, not significant; **, p<0.01; ***, p<0.001.
Figure 8—video 1
Scratch repair in HUVECs exposed to 0.02% DMSO.
A scratch was introduced to the monolayer and live cell imaging was performed with the zenCELL Owl incubator microscope every 15 min for 23 hr. Time-lapse videos (representative of three independent experiments) were generated with zencell-owl software. Time stamp and scale bar as indicated.
Figure 8—video 2
Scratch repair in HUVECs exposed to 10 ng/mL mycolactone.
A scratch was introduced to the monolayer and live cell imaging was performed with the zenCELL Owl incubator microscope every 15 min for 23 hr. Time-lapse videos (representative of three independent experiments) were generated with zencell-owl software. Time stamp and scale bar as indicated.
Figure 8—video 3
HUVECs were seeded on to laminin-511 coated well.
The following day, a scratch was introduced to the monolayer and the cells were exposed to 10 ng/mL mycolactone. Live cell imaging was then performed with the zenCELL Owl incubator microscope every 15 min for 23 hr. Time-lapse videos (representative of three independent experiments) were generated with zencell-owl software. Time stamp and scale bar as indicated.
Figure 8—video 4
HUVECs were seeded on to laminin-411 coated well.
The following day, a scratch was introduced to the monolayer and the cells were exposed to 10 ng/mL mycolactone. Live cell imaging was then performed with the zenCELL Owl incubator microscope every 15 min for 23 h. Time-lapse videos (representative of three independent experiments) were generated with zencell-owl software. Time stamp and scale bar as indicated.
Figure 8—video 5
HUVECs were seeded on to laminin-111 coated well.
The following day, a scratch was introduced to the monolayer and the cells were exposed to 10 ng/mL mycolactone. Live cell imaging was then performed with the zenCELL Owl incubator microscope every 15 min for 23 hr. Time-lapse videos (representative of three independent experiments) were generated with zencell-owl software. Time stamp and scale bar as indicated.
Tables
Key resources table
| Reagent type (species) or resource | Designation | Source or reference | Identifiers | Additional information |
|---|---|---|---|---|
| Strain, strain background (Mus musculus, female) | C57BL/6 J | Charles River | RRID:MGI:3028467 | |
| Strain, strain background (M. ulcerans) | Mu_1082 | Richard Phillips, KCCR, Ghana | ||
| Cell line (Human primary cells) | HUVEC | PromoCell | C-12200 | Single Donor |
| Cell line (Human primary cells) | HDMEC | PromoCell | C-12210 | Juvenile, Single Donor, male |
| Antibody | Anti-fibrinogen (rabbit polyclonal) | Agilent DAKO | A0080 RRID:AB_2894406 | IHC: (1:3000) |
| Antibody | Biotinylated anti-rabbit IgG (horse polyclonal) | Vector laboratories | BP-100–50 RRID:AB_3661924 | IHC (1:50) |
| Antibody | Anti-human Δ-HS (mouse monoclonal F69-3G10) | AMSBIO | 370260 S RRID:AB_10892311 | FACS (1:200) WB (1:1000) |
| Antibody | Anti-chondroitin sulphate (mouse monoclonal CS56) | Merck | C8035 RRID:AB_476879 | FACS (1:200) |
| Antibody | Anti-perlecan (mouse monoclonal 7B5) | Thermo Fisher Scientific | 13–4400 RRID:AB_86311 | FACS (1:200) IFA (1:500) |
| Antibody | Anti-glypican-1 (goat polyclonal) | Novus Biologicals | AF4519 RRID:AB_2232505 | FACS (2.5 µg/106 cells) |
| Antibody | Anti-integrin β4/CD104 (rat monoclonal 439-9B) | eBioscience | 14-1049-82 RRID:AB_1210460 | FACS (1:100) |
| Antibody | Anti-integrin β1/CD29 (mouse monoclonal P4C10) | Novus Biologicals | NBP2-36561 RRID:AB_3295906 | FACS (1:200) |
| Antibody | Anti-syndecan-2 (rat monoclonal 305515) | Novus Biologicals | MAB2965 RRID:AB_2182871 | FACS (0.25 µg/106 cells) |
| Antibody | Anti-biglycan (goat polyclonal) | Novus Biologicals | AF2667 RRID:AB_2065204 | FACS (0.1 µg/106 cells) |
| Antibody | Anti-laminin α5 (mouse monoclonal CL3118) | Novus Biologicals | NBP2-42391 RRID:AB_3306362 | FACS (1:200) |
| Antibody | Anti-laminin α4 (sheep polyclonal) | Biotechne | AF7340 RRID:AB_3644426 | IFA (1:200) |
| Antibody | Isotype control (mouse monoclonal IgG1κ P3.6.2.8.1) | Thermo Fisher Scientific (Invitrogen) | 14-4714-81 RRID:AB_470110 | FACS (1:100) |
| Antibody | Isotype control (mouse monoclonal IgG2b) | Thermo Fisher Scientific | MG2B00 RRID:AB_2921189 | As appropriate (same as test Ab) |
| Antibody | Isotype control (polyclonal goat IgG) | R&D Systems | AB-108-C RRID:AB_354267 | As appropriate (same as test Ab) |
| Antibody | Isotype control rat monoclonal IgG2bκ (eB149/10H5) | Thermo Fisher Scientific | 14-4031-81 RRID:AB_470098 | As appropriate (same as test Ab) |
| Antibody | Isotype control (mouse monoclonal IgM, clone PFR-03) | Thermo Fisher Scientific | MA1-10438 RRID:AB_2536806 | As appropriate (same as test Ab) |
| Antibody | PE-F(ab’)2-anti-mouse IgG (rat polyclonal) | Thermo Fisher Scientific | 12-4010-82 RRID:AB_11063706 | As appropriate |
| Antibody | FITC-anti-goat IgG (donkey polyclonal) | Thermo Fisher Scientific | A16000 RRID:AB_2534674 | As appropriate |
| Antibody | FITC-anti-rat IgG (goat polyclonal) | Thermo Fisher Scientific | 31629 RRID:AB_228240 | As appropriate |
| Antibody | Anti-fibronectin (rabbit polyclonal) | Merck Millipore | AB1945 RRID:AB_2231910 | WB (1:1000) |
| Antibody | Anti-integrin α5 (mouse monoclonal IgG1κ A-11) | Santa Cruz Biotechnology | sc-166665 RRID:AB_2280538 | WB (1:1000) |
| Antibody | HRP-Anti-rabbit IgG (donkey polyclonal) | GE Healthcare | NA934V RRID:AB_2722659 | WB (1:5000) |
| Antibody | HRP-Anti-mouse IgG (sheep polyclonal) | GE Healthcare | NA931V RRID:AB_772210 | WB (1:5000) |
| Antibody | Anti-B3GALT6 (mouse polyclonal) | Bio-Techne | H00126792-B01P RRID:AB_3146818 | IF (1:100) |
| Antibody | Anti-giantin (rabbit polyclonal) | Abcam | Ab80864 RRID:AB_10670397 | IF (1:200) |
| Antibody | Alexa Fluor 594 anti-rabbit IgG (goat polyclonal) | Thermo Fisher Scientific | A11012 RRID:AB_2534079 | IF (1:400) |
| Antibody | Alexa Fluor 488 anti-mouse IgG (donkey polyclonal) | Thermo Fisher Scientific | A21202 RRID:AB_141607 | IF (1:400) |
| Antibody | Alexa Fluor 488 anti-sheep IgG (donkey polyclonal) | Thermo Fisher Scientific | A11015 RRID:AB_2534082 | IF (1:500) |
| Antibody | Alexa Fluor 647 anti-mouse IgG (goat polyclonal) | Thermo Fisher Scientific | A21235 RRID:AB_2535804 | IF (1:400) |
| Antibody | Alexa Fluor 647 anti-rabbit IgG (goat polyclonal) | Thermo Fisher Scientific | A21244 RRID:AB_2535812 | IF (1:400) |
| Sequence-based reagent | Silencer SiRNA negative control No 1 | ThermoFisher Scientific | AM4611 | 50 nM |
| Sequence-based reagent | Human B3GALT6 siRNA | ThermoFisher Scientific | Assay ID#112321 | 50 nM |
| Sequence-based reagent | Human B3GALT6 siRNA | ThermoFisher Scientific | Assay ID#112322 | 50 nM |
| Peptide, recombinant protein | Human Laminin-111 | BioLamina | LN111-02 | 5 μg/ml |
| Peptide, recombinant protein | Human Laminin-411 | BioLamina | LN411-02 | 5 μg/ml |
| Peptide, recombinant protein | Human Laminin-511 | BioLamina | LN511-0202 | 5 μg/ml |
| Peptide, recombinant protein | Human IL-1β | Gibco | PHC0813 | 100 ng/ml |
| Commercial assay or kit | ImmPACT NovaRED peroxidase substrate kit | Vector Laboratories | SK4805 | |
| Commercial assay or kit | VECTASTAIN Elite ABC kit | Vector Laboratories | PK6100 | |
| Chemical compound, drug | Dimethyl sulfoxide HYBRI-MAX | Merck | D2650 | |
| Chemical compound, drug | Synthetic Mycolactone | Prof Yoshito Kishi, Harvard University | CAS: 222050-77-3 | |
| Chemical compound, drug | Biological Mycolactone | Dr Estelle Marion, INSERM | CAS: 222050-77-3 | |
| Chemical compound, drug | Ipomoeassin F | Prof Wei Shi, University of Arkansas | CHEMBL4163767 | |
| Chemical compound, drug | ZIF-80 | Prof Wei Shi, University of Arkansas | None | |
| Software, algorithm | Image J (v1.52n) | Fiji | RRID:SCR_002285 | |
| Software, algorithm | Zencell-owl software (version 3.3) | innoME GmbH | ||
| Software, algorithm | Prism Version 9.4.1 and 10.2.3 | GraphPad | RRID:SCR_002798 | |
| Software, algorithm | ΔG prediction server v1.0 | dgpred.cbr.su.se | ||
| Software, algorithm | FlowJo v9 | FlowJo.com | RRID:SCR_008520 | |
| Software, algorithm | JVenn | jvenn.toulouse.inrae.fr | RRID:SCR_016343 | |
| Software, algorithm | Webgestalt | https://www.webgestalt.org/ | RRID:SCR_006786 | |
| Other | Optimem | ThermoFisher Scientific | 15392402 | Serum free medium |
| Other | Escort IV transfection reagent | Merck | L3287 | Transfection reagent |
| Other | Endothelial cell growth medium 2 | PromoCell | C-22011 | Culture medium |
| Other | Osteosoft | Merck | 1.01728 | Decalcifying reagent for histopathology |
| Other | Heparinase III (EC4.2.2.8 from Flavobacterium heparinum) | Merck | H8891 | Enzyme used at 1mU/ml |
| Other | Chondroitinase ABC (EC 4.2.2.4 from Proteus vulgaris) | AMSBIO | 100330–1 A | Enzyme used at 10mU/ml |
| Other | Immobilon western chemiluminescence HRP substrate | ThermoFisher Scientific | 11556345 | |
| Other | TRITC-conjugated phalloidin | Merck | FAK100 | Stain for F-Actin used at 1:500 |
| Other | FITC-dextran 70 kDa | Merck | 46945 | Fluorescently-labelled dextran used for permeability studies used at 1:500 |
Additional files
Download links
A two-part list of links to download the article, or parts of the article, in various formats.
Downloads (link to download the article as PDF)
Open citations (links to open the citations from this article in various online reference manager services)
Cite this article (links to download the citations from this article in formats compatible with various reference manager tools)
The Mycobacterium ulcerans toxin mycolactone causes destructive Sec61-dependent loss of the endothelial glycocalyx and vessel basement membrane to drive skin necrosis
eLife 12:RP86931.
https://doi.org/10.7554/eLife.86931.3


