De novo identification of universal cell mechanics gene signatures
- Biotechnology Center, Center for Molecular and Cellular Bioengineering, Technische Universität Dresden, Germany
- Max Planck Institute for the Science of Light & Max-Planck-Zentrum für Physik und Medizin, Germany
- Center for Complex Network Intelligence, Tsinghua Laboratory of Brain and Intelligence, Department of Computer Science and School of Biomedical Engineering, Tsinghua University, China
- Department of Computer Science and Department of Economics, Jamia Millia Islamia, India
- Center for Regenerative Therapies Dresden, Center for Molecular and Cellular Bioengineering, Technische Universität Dresden, Germany
- Klinik und Poliklinik für Kinder- und Jugendmedizin, Universitätsklinikum Carl Gustav Carus, Technische Universität Dresden, Germany
- Signalling Programme, The Babraham Institute, United Kingdom
- Mechanoadaptation and Caveolae Biology Lab, Cell and Developmental Biology Area, Centro Nacional de Investigaciones Cardiovasculares (CNIC), Spain
- Center for Systems Biology Dresden, Germany
- Cluster of Excellence Physics of Life, Technische Universität Dresden, Germany
Figures
Figure 1 with 1 supplement
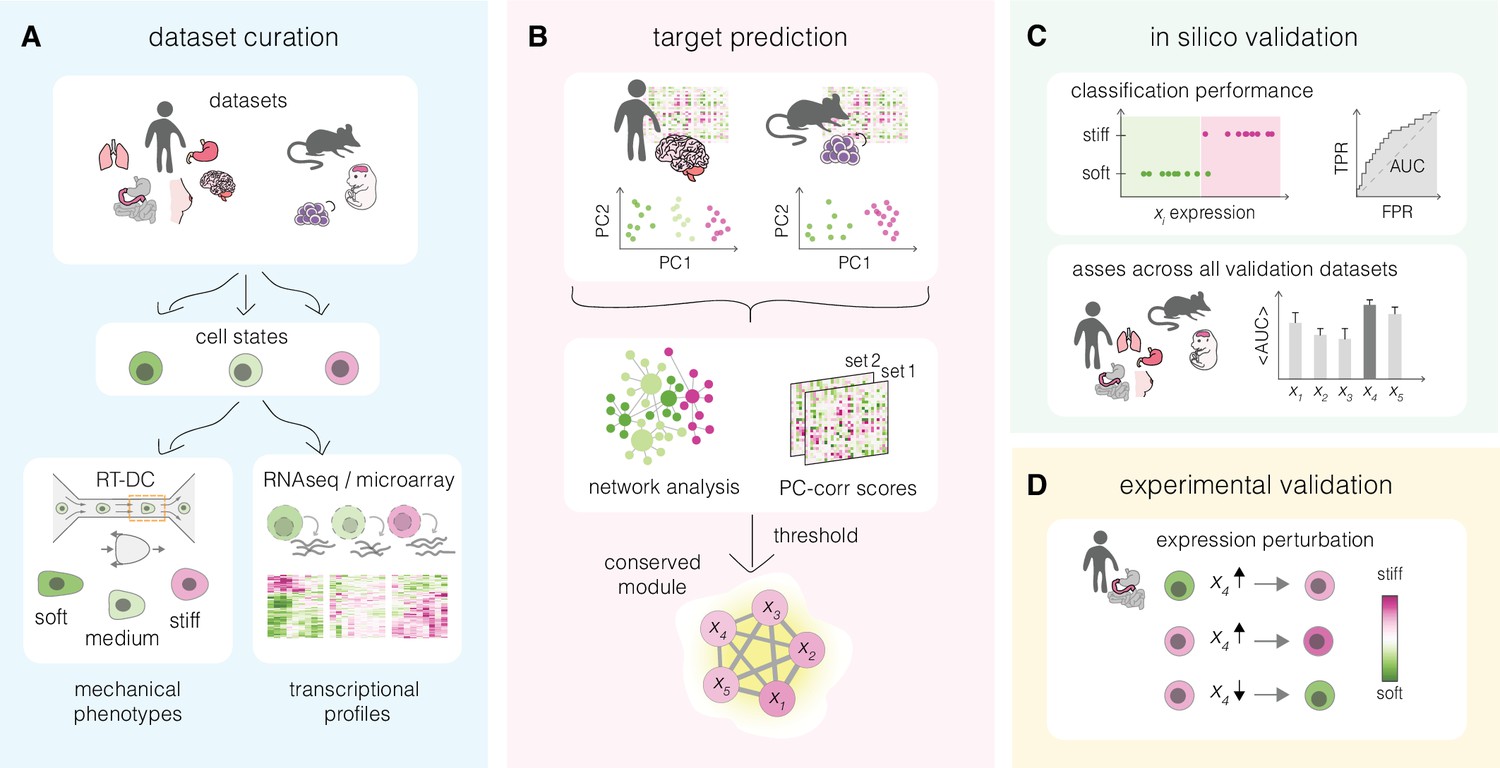
Overview of a mechanomics approach for de novo identification of genes involved in cell mechanics regulation.
(A) Data curation. Datasets originating from different biological systems encompassing cell states with distinct mechanical phenotypes, as characterized by real-time deformability cytometry (RT-DC), and associated transcriptomics profiles are collected. (B) Target prediction. A subset of collected datasets is used to perform machine learning-based network analysis on transcriptomic data and identify conserved module of genes associated with cell mechanics changes. PC – principal component. (C) In silico validation. The classification performance of individual genes from module identified in (B) is evaluated in silico on remaining datasets. TPR – true positive rate, FPR – false positive rate, AUC – area under the curve. (D) Experimental validation. Targets with highest classification performance in silico are verified experimentally in perturbation experiments.
Figure 1—figure supplement 1
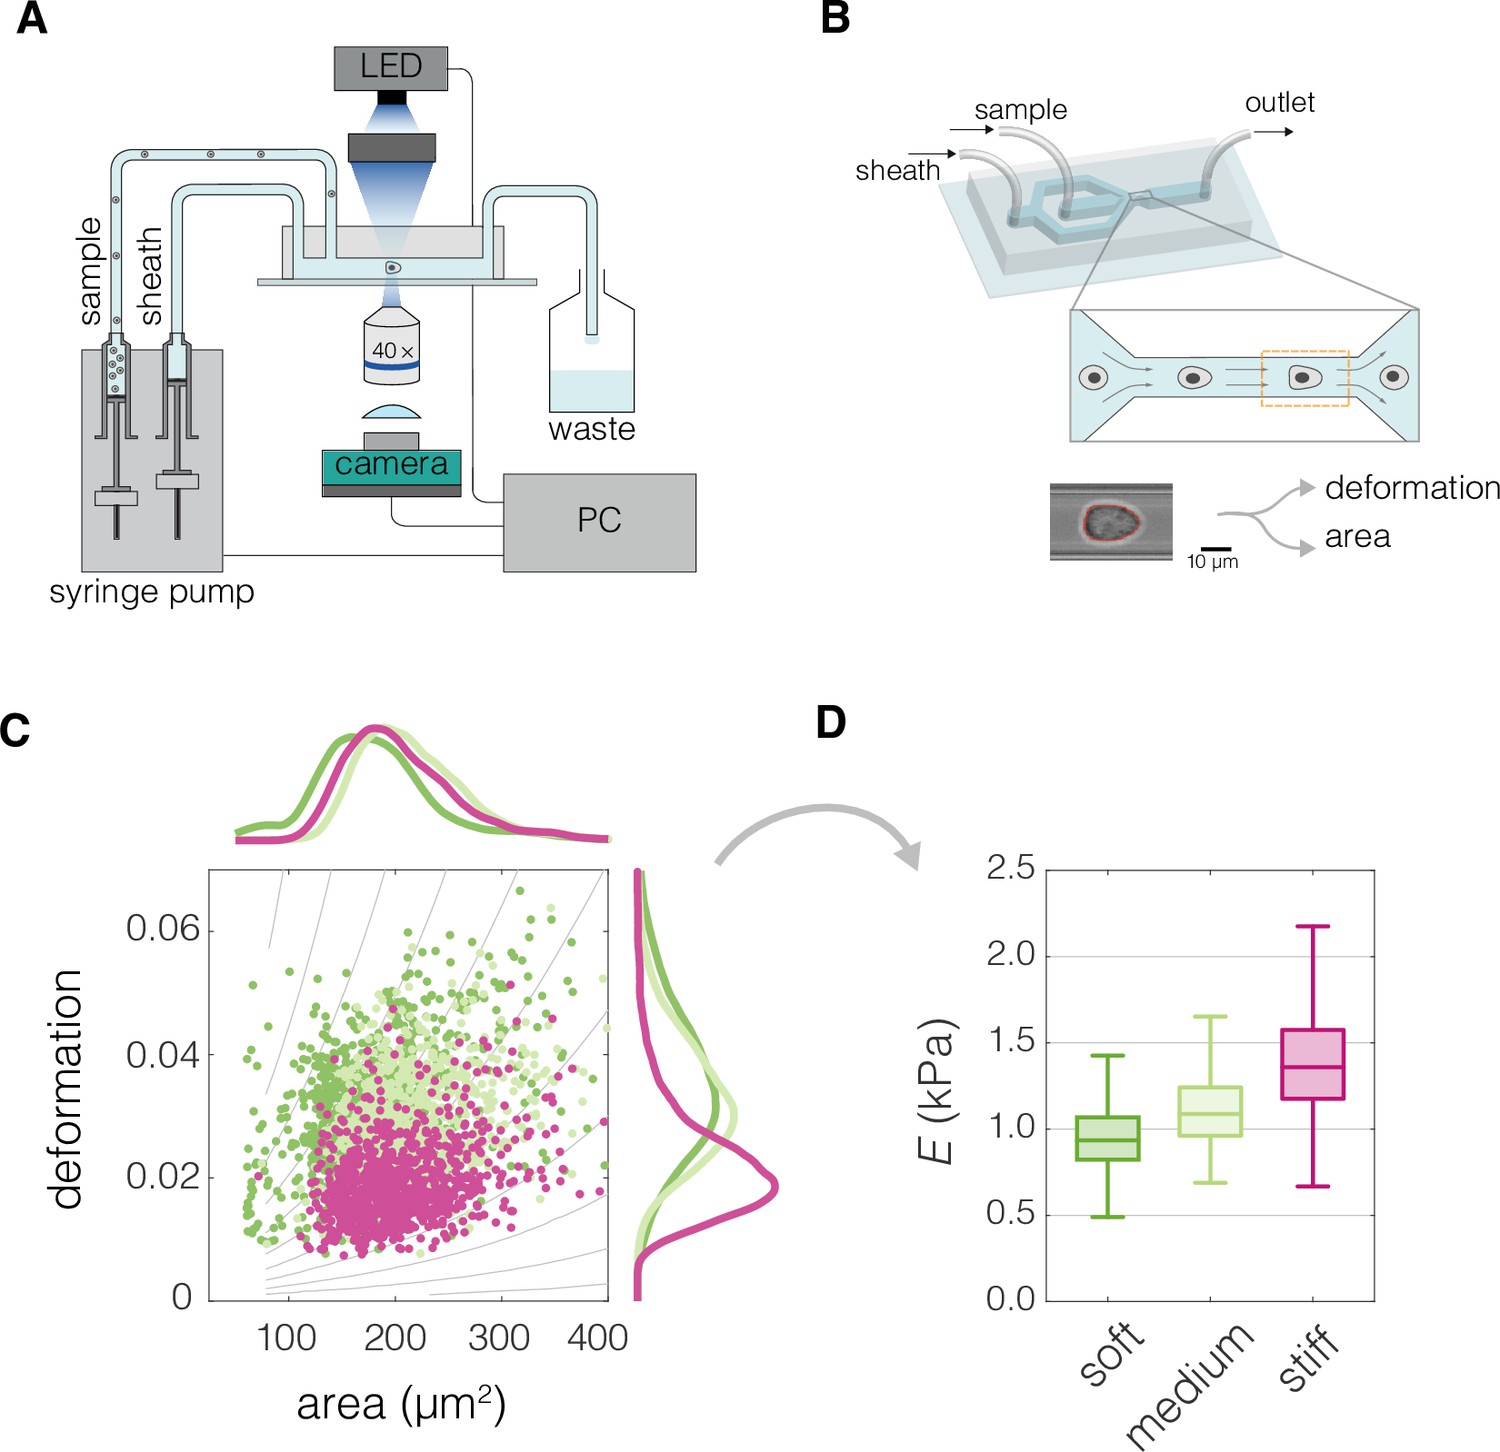
Characterization of mechanical cell properties using real-time deformability cytometry (RT-DC).
(A) Schematic overview of the RT-DC setup. Computer-operated syringe pumps flow the cell-containing sample as well as the sheath fluid into the microfluidic chip. Imaging of the cells deformed in the microfluidic channel is performed at 2000 frames per second using an LED-based stroboscopic illumination and a CMOS camera. (B) 3D illustration of the microfluidic chip used for the RT-DC measurements, close-up depicts the constriction of the channel in which cells are deformed, the imaged region of interest is indicated by an orange dashed line. At the bottom an exemplary image of a cell is shown. A contour is fitted to the cell in real time (marked in red), based on which cell area and deformation are calculated. (C) An exemplary plot of deformation vs area of three different cell populations. The gray isoelasticity lines in the background indicate regions of the same apparent Young’s moduli. (D) Box plot of apparent Young’s modulus, E, estimated based on deformation and area in (C). The cell population with same area but higher deformation has lower E (bright green compared to magenta). For cells with similar deformation, the one of smaller area has lower E (dark green compared to bright green). The exemplary data in (C) and (D) corresponds to exemplary measurements of Wa-hT (dark green), EBC1 (bright green), and A549 (magenta) cell lines. The box plots in (D) spread from 25th to 75th percentiles with a line at the median, whiskers span 1.5 × interquartile range (IQR).
Figure 2 with 1 supplement
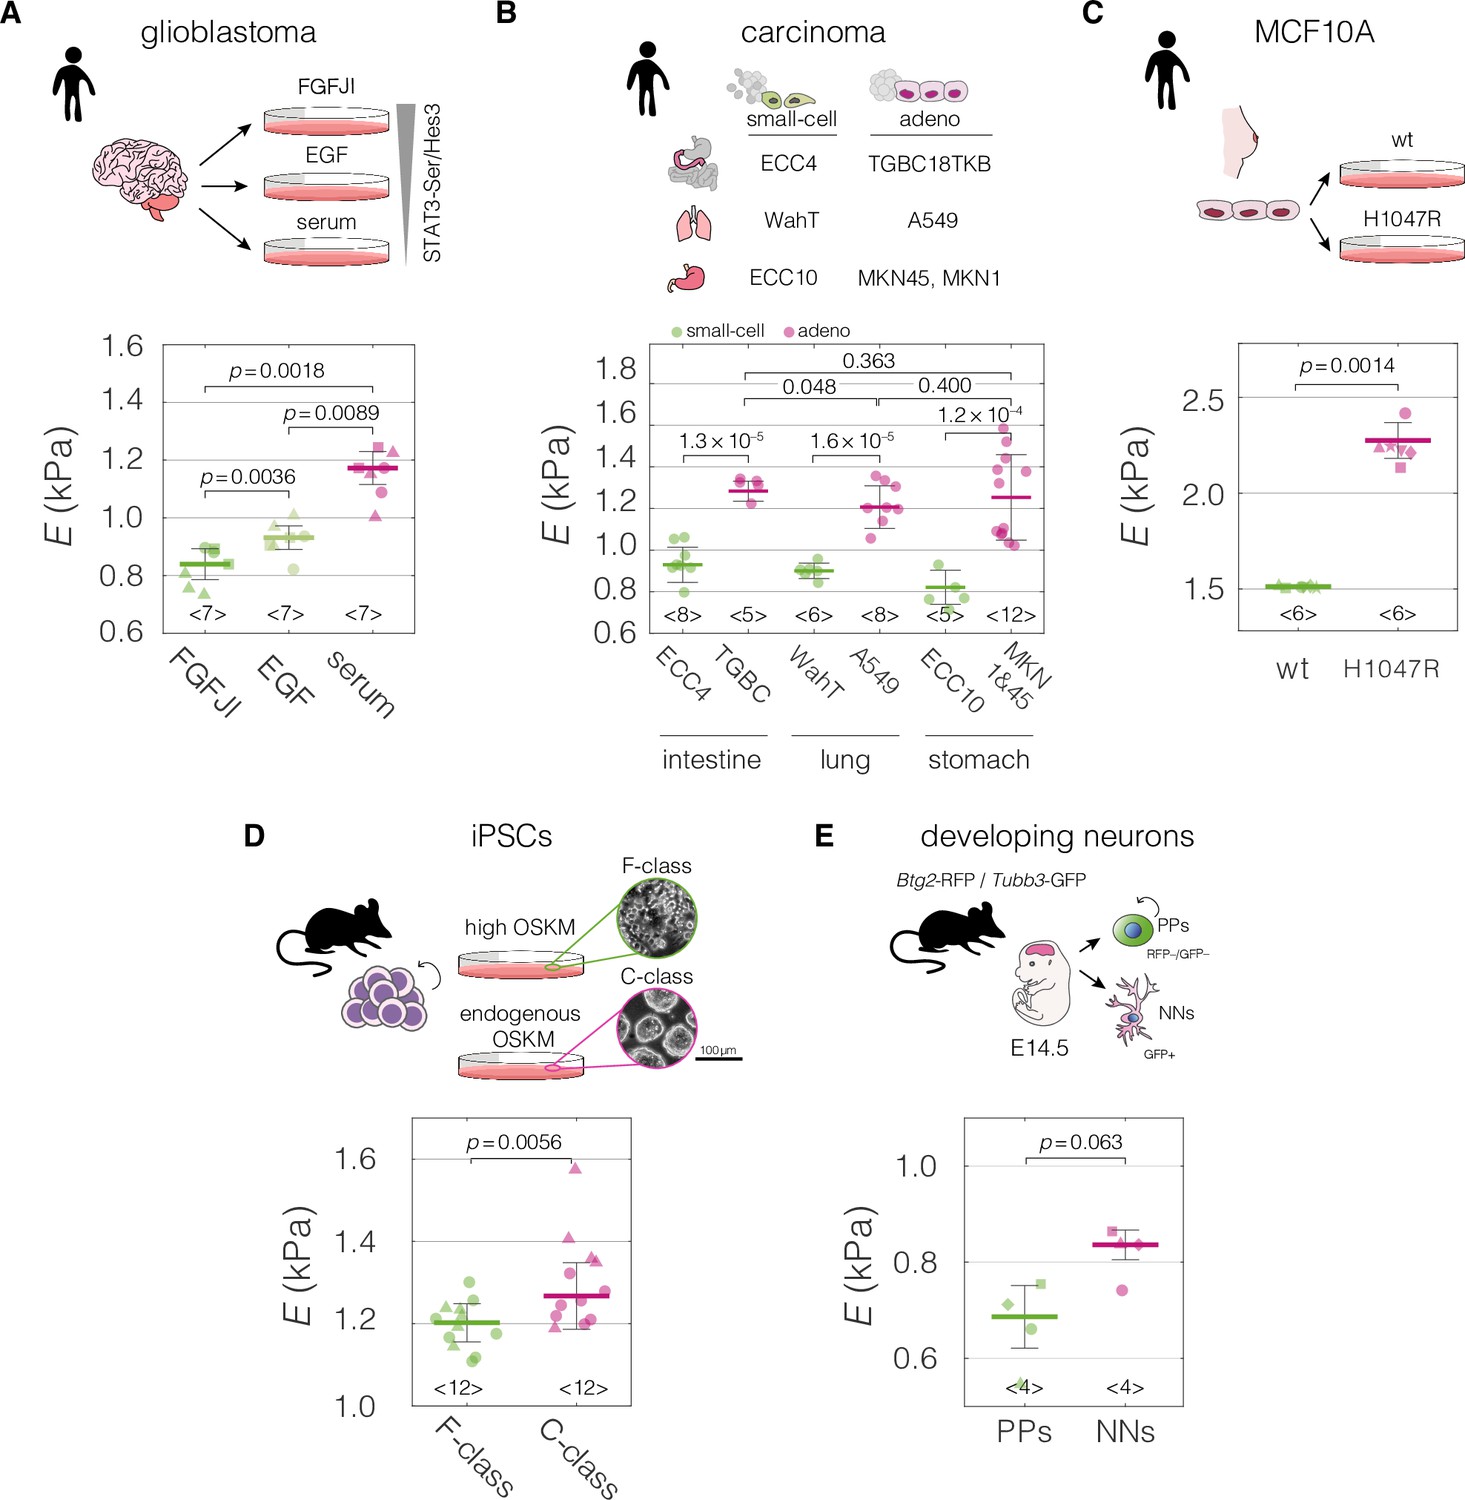
Mechanical properties of divergent cell states in five biological systems.
Schematic overviews of the systems used in our study, alongside with the cell stiffness of individual cell states parametrized by Young’s moduli E. (A) Human patient-derived glioblastoma cells with three distinct signaling states maintained by indicated culture conditions. (B) Human small-cell carcinoma and adenocarcinoma cell lines originating from intestine, lung, and stomach. (C) Human breast epithelium MCF10A cell line bearing single-allele H1047R mutation in the PIK3CA with parental wild type (wt) as a control. (D) Murine F- and C-class induced pluripotent stem cells (iPSCs) cultured in the presence (F-class) or absence (C-class) of doxycycline (dox) activating ectopic expression of OSKM factors (Oct4, Sox2, Klf4, and cMyc). (E) Proliferating progenitors (PPs) and newborn neurons (NNs) isolated from brains of mouse embryos. Horizontal lines delineate medians with mean absolute deviation (MAD) as error, datapoints represent medians of the individual measurement replicates, the number of independent biological replicates is indicated below each box. Statistical analysis was performed using generalized linear mixed effects model. The symbol shapes represent cell lines derived from three different patients (A), matched experimental replicates (C), two different reprogramming series (D), and four different cell isolations (E). Data presented in (A) and (D) were previously published in Poser et al., 2019 and Urbanska et al., 2017, respectively. Cell areas and deformations used for Young’s modulus extraction for all datasets are visualized in Figure 2—figure supplement 1.
-
Figure 2—source data 1
Young’s moduli E for the datasets presented in Figure 2A–E.
- https://cdn.elifesciences.org/articles/87930/elife-87930-fig2-data1-v1.xlsx
Figure 2—figure supplement 1
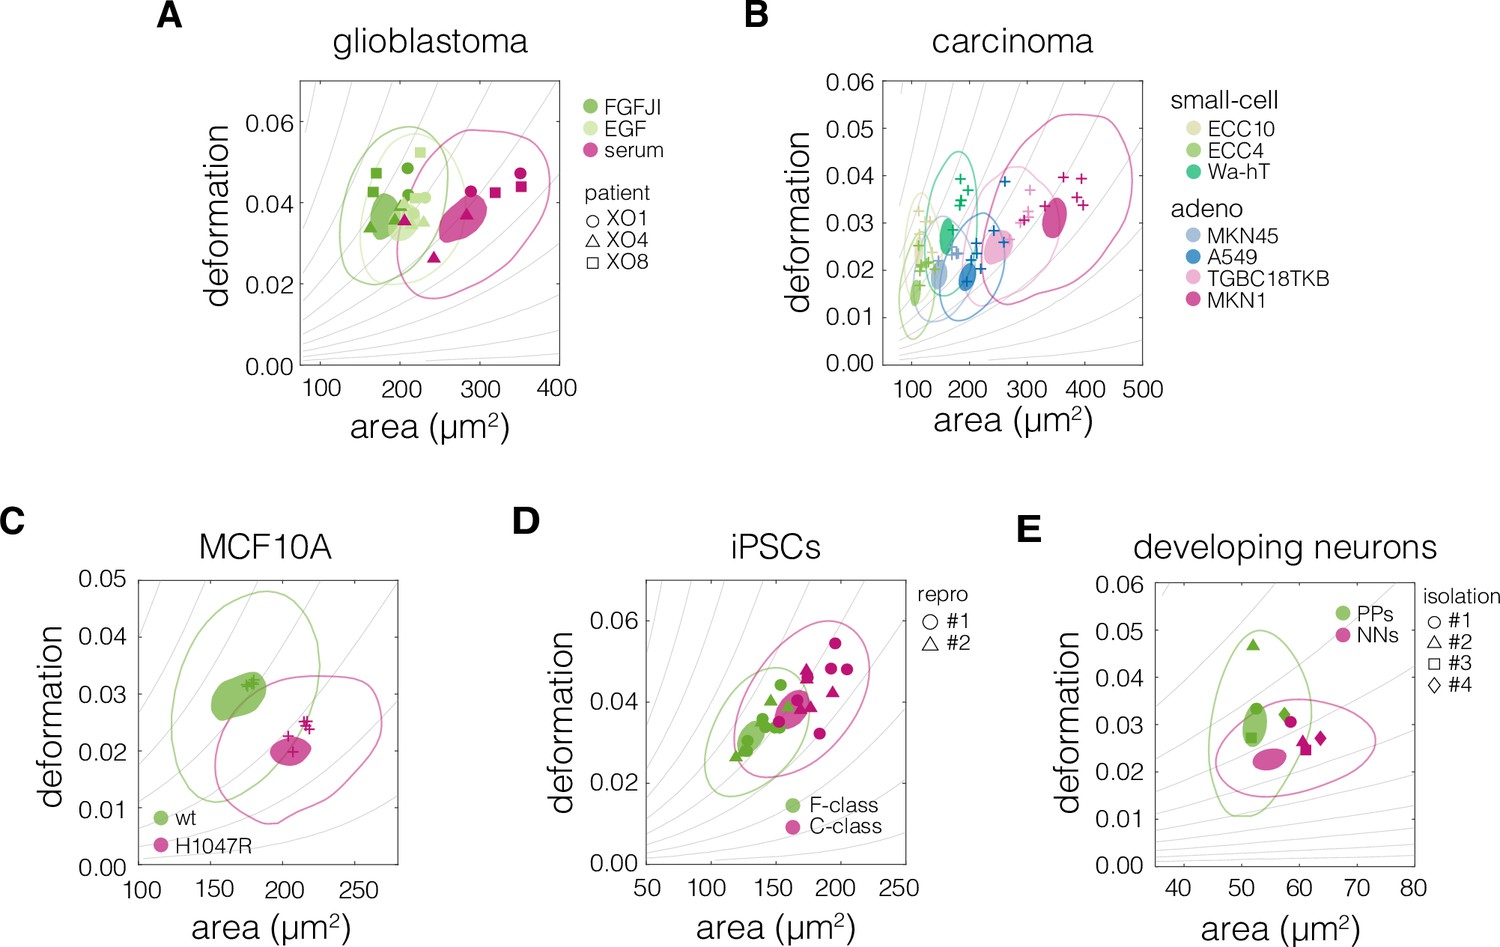
Plots of area vs deformation for different cell states in the characterized systems.
Panels correspond to the following systems: (A) glioblastoma, (B) carcinoma, (C) non-tumorigenic breast epithelia MCF10A, (D) induced pluripotent stem cells (iPSCs), and (E) developing neurons. 95% and 50% density contours of data pooled from all measurements of given cell state are indicated by shaded areas and continuous lines, respectively. Datapoints indicate medians of individual measurements. The symbol shapes represent cell lines derived from three different patients (A), two different reprogramming series (D), and three different cell isolations (E), as indicated in the respective panels. The isoelasticity lines in the background (gray) indicate regions of the same apparent Young’s moduli. PPs – proliferating progenitors, NNs – newborn neurons.
Figure 3 with 1 supplement
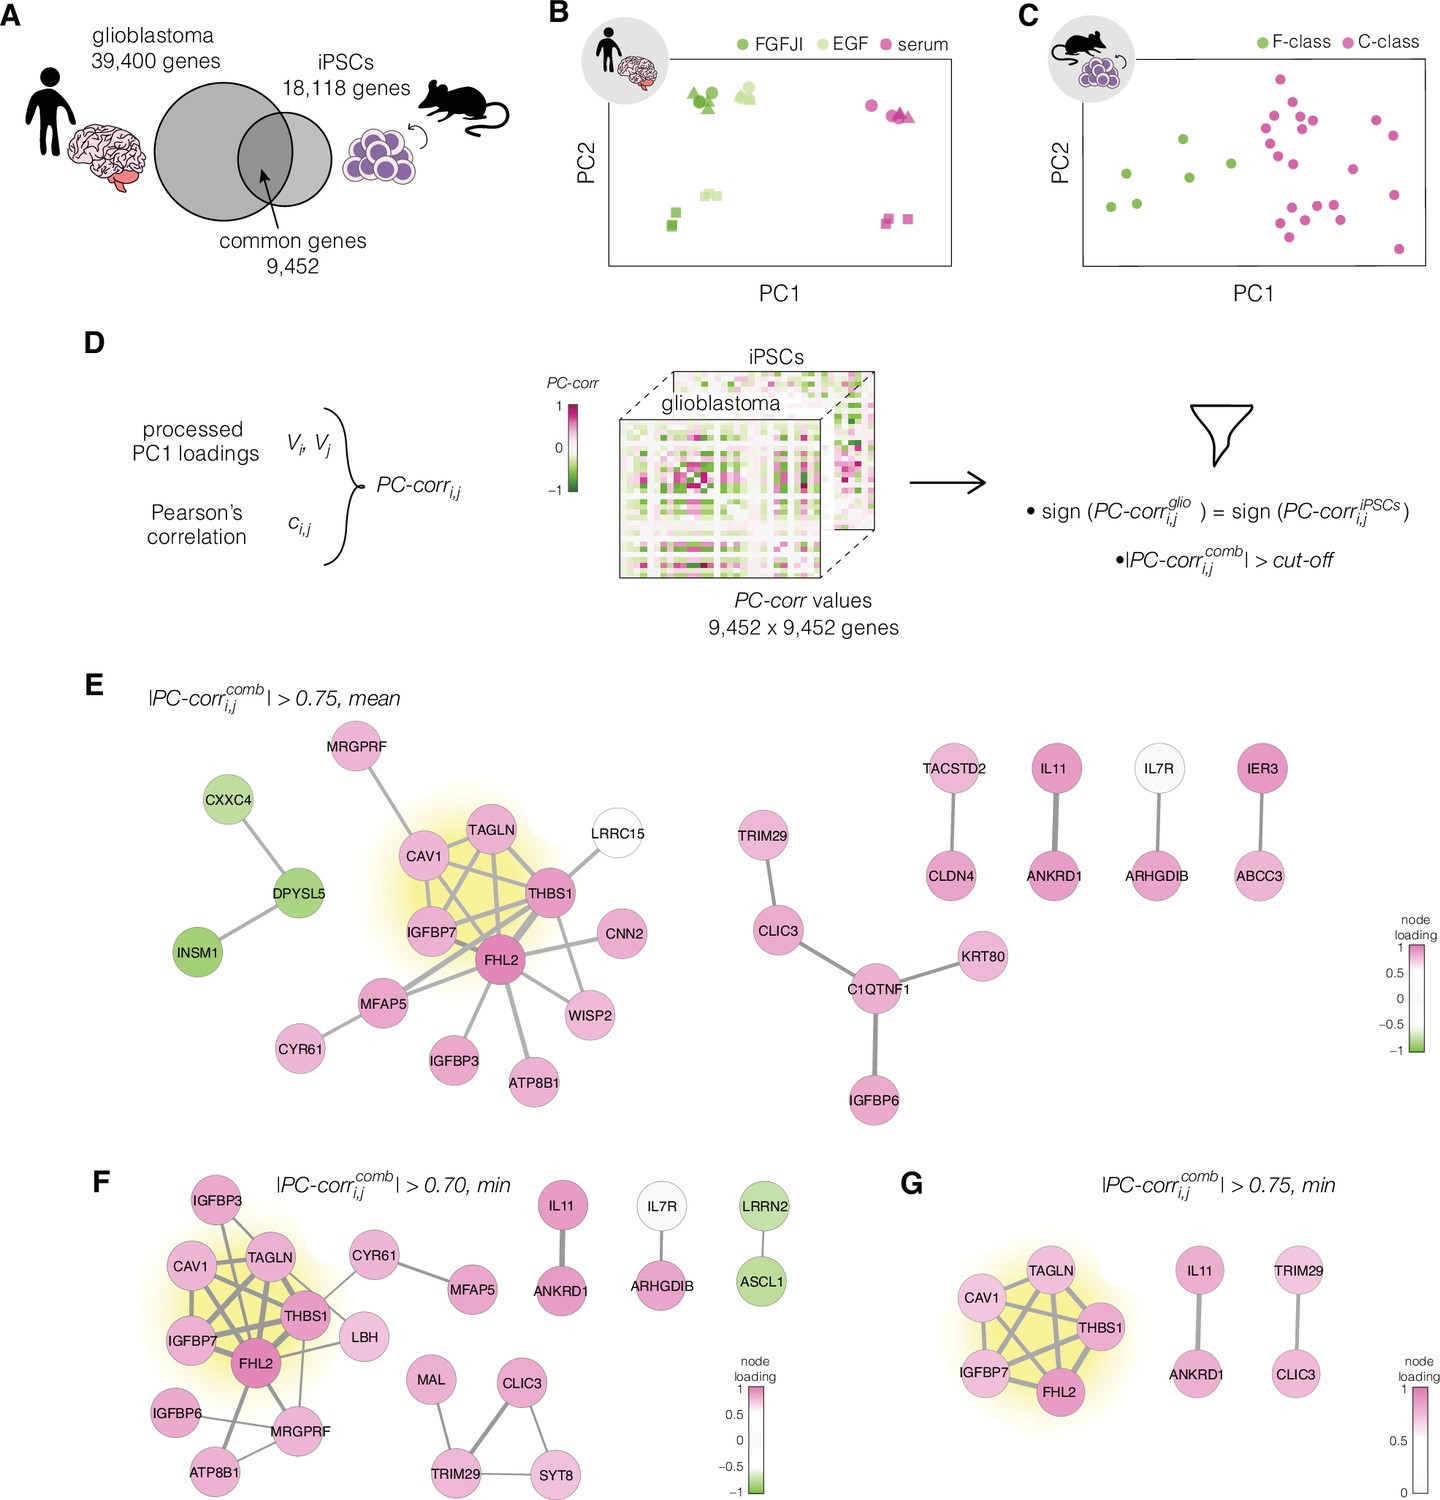
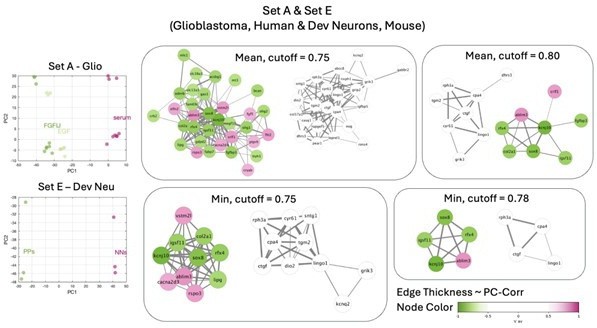
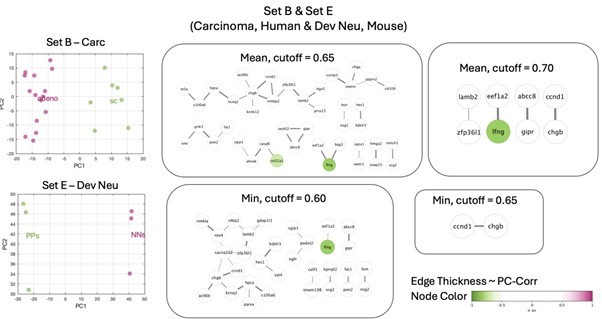
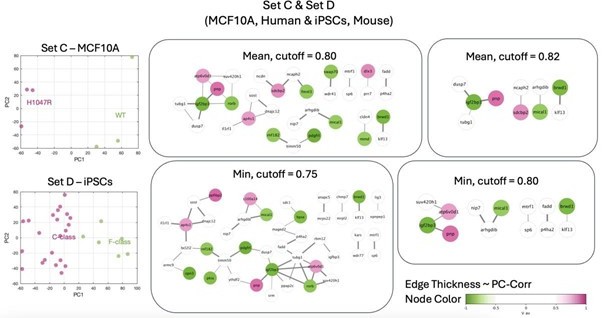
Identification of putative targets involved in cell mechanics regulation.
(A) Glioblastoma and induced pluripotent stem cell (iPSC) transcriptomes used for the target prediction intersect at 9452 genes. (B, C) Principal component analysis (PCA) separation along two first principal components of the mechanically distinct cell states in the glioblastoma (B) and iPSC (C) datasets. The analysis was performed using the gene expression data from the intersection presented in (A). The symbol shapes in (B) represent cell lines derived from three different patients. (D) Schematic representation of PC-corr analysis and the combination of the PC-corr results for two systems. (E–G) Gene networks based on filtering gene pairs by the combined PC-corr score. The presented networks were obtained by setting the cut-off value to 0.75, when using the mean PC-corr approach (E), and to 0.70 (F) and 0.75 (G), when using the minimum value approach. In (E–G), edge thicknesses represent the and the colors of the nodes represent the average processed PC loadings, both listed in Figure 3—source data 2.
-
Figure 3—source data 1
PC1 and PC2 values for individual datapoints in Figure 3B, C.
- https://cdn.elifesciences.org/articles/87930/elife-87930-fig3-data1-v1.xlsx
-
Figure 3—source data 2
Combined PC-corr values calculated as means or minimum value of the two discovery datasets, together with loadings of PC1, used for creating networks presented in Figure 3E–G.
- https://cdn.elifesciences.org/articles/87930/elife-87930-fig3-data2-v1.xlsx
Figure 3—figure supplement 1
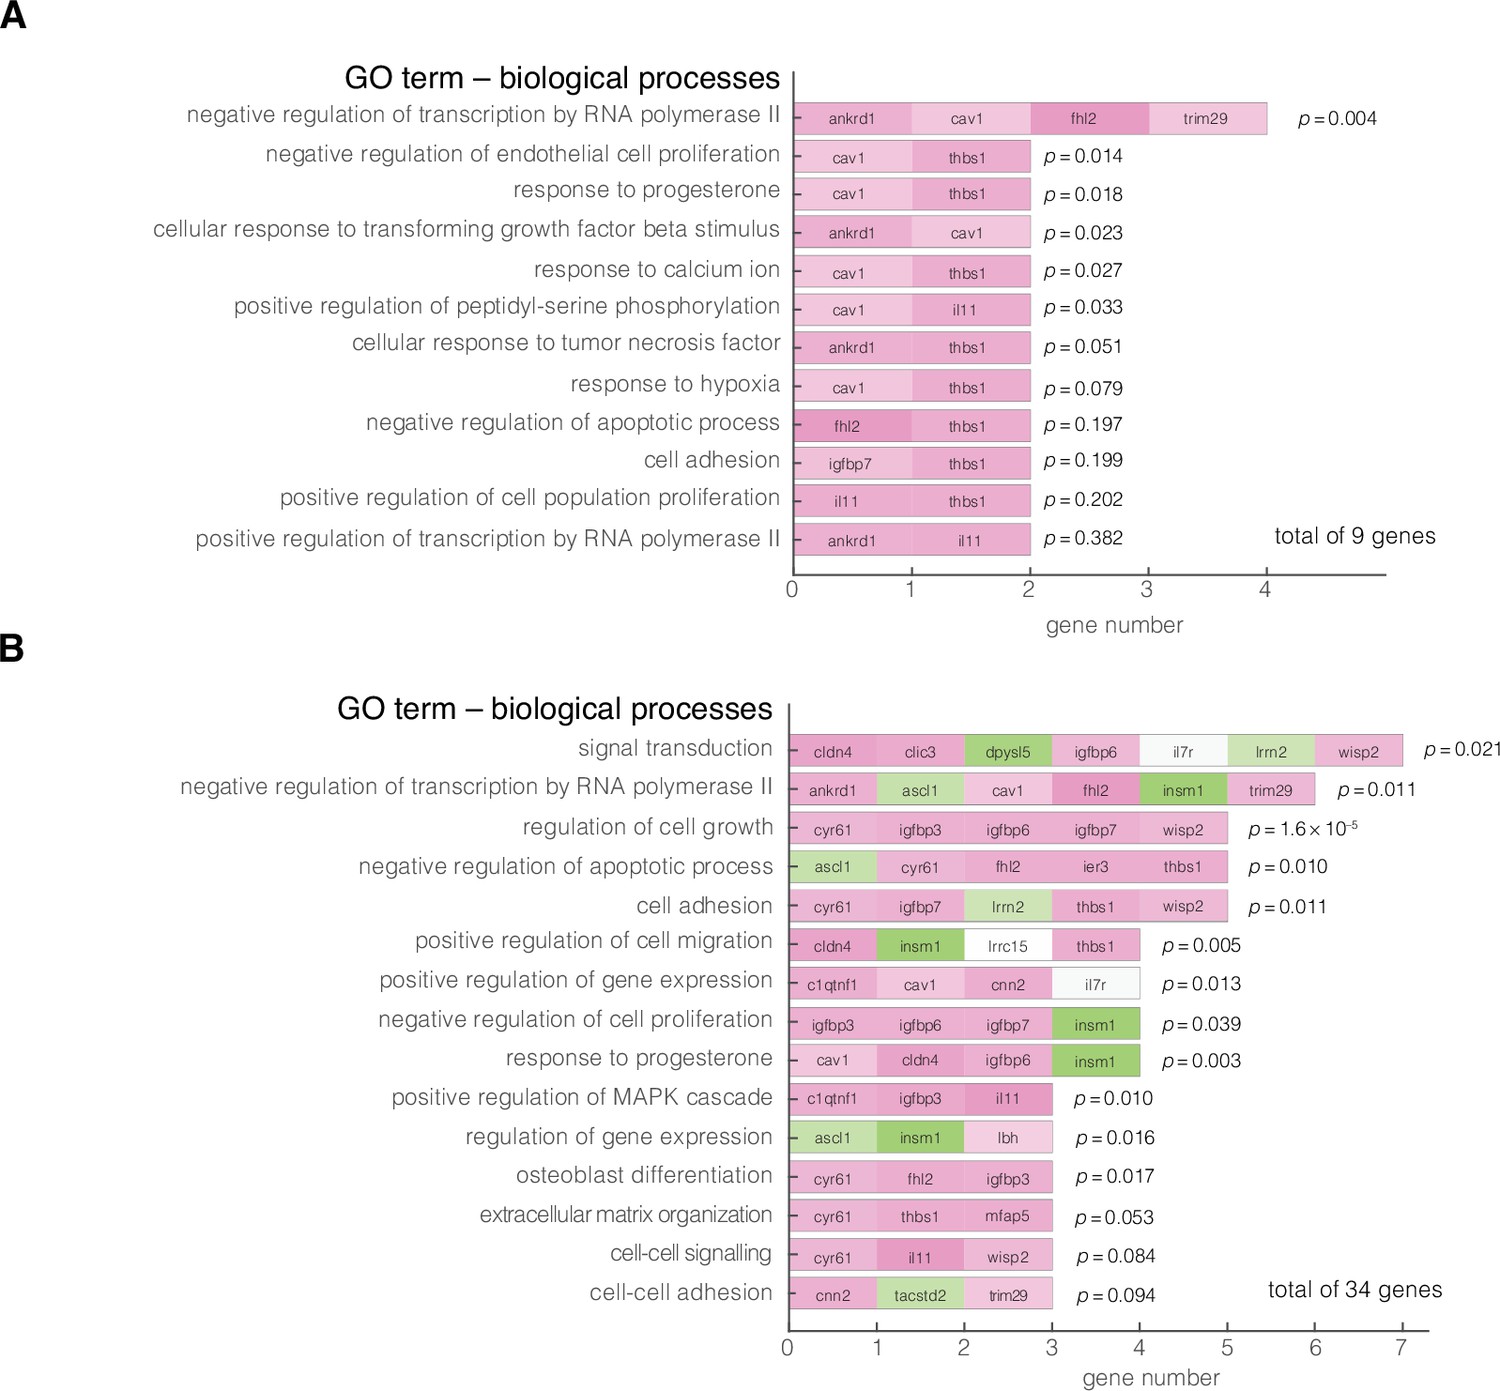
Gene ontology (GO) enrichment analysis of obtained target genes.
Enriched GO terms of biological processes are summarized for: (A) Nine genes corresponding to the results from Figure 3G and (B) 34 genes corresponding to all nodes presented in Figure 3E-G. The analysis was performed using DAVID 6.8 functional annotation tool online, with Homo sapiens as background dataset, ENSMBL gene IDs as input, and focused on direct GO terms for biological processes. Color code of the blocks corresponds to the level of expression in stiff states with green corresponding to low expression and magenta corresponding to high expression. The reported p values are the Fisher’s exact p values obtained using a two-tailed two sample t-test.
Figure 4 with 5 supplements
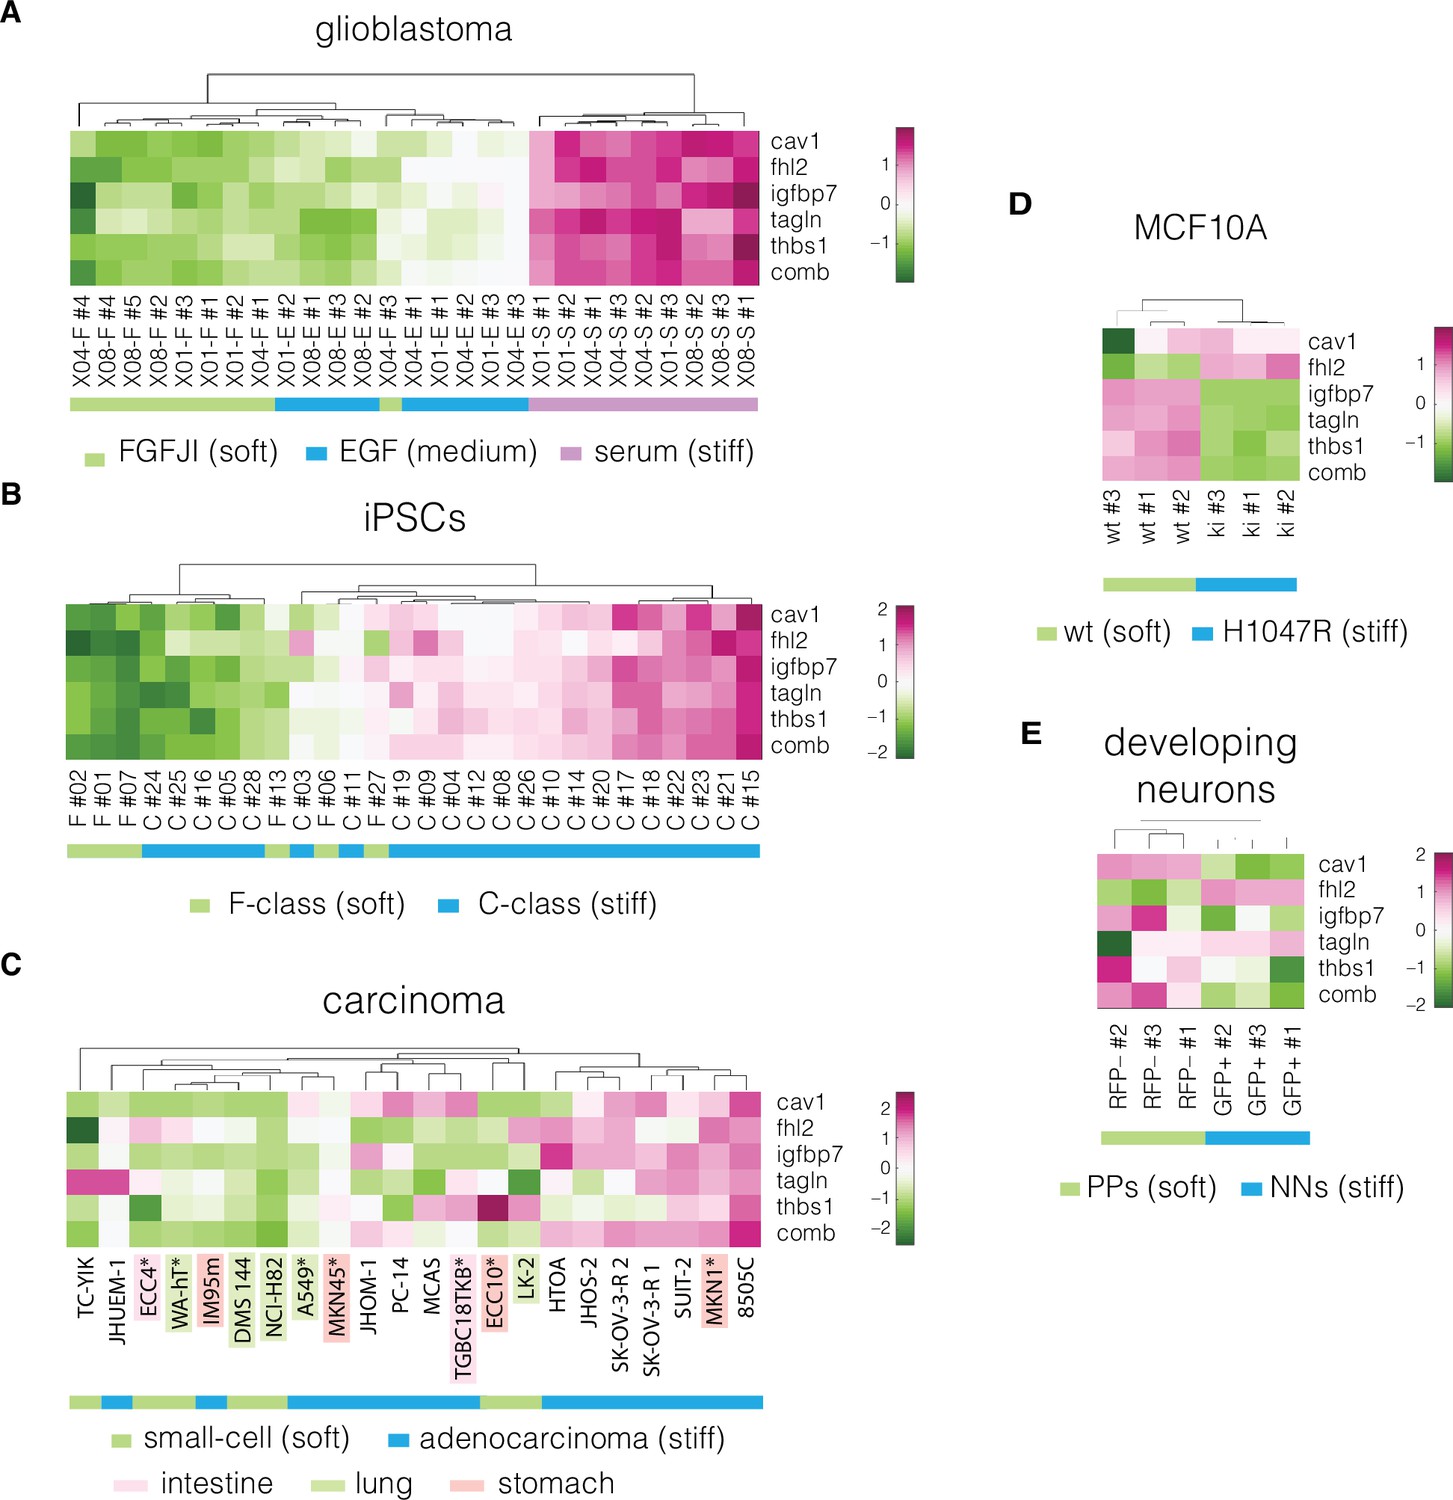
Expression of identified target genes in the prediction and validation datasets.
Panels show unsupervised clustering heatmaps of expression data from transcriptomic datasets corresponding to the following systems: (A) glioblastoma, (B) induced pluripotent stem cells (iPSCs), (C) carcinoma, cell lines from intestine, lung, and stomach used for positive hypothesis I (see Table 3) are highlighted in pink, green, and orange, respectively; *mechanically tested cell lines (here the FANTOM5 dataset is presented as it contains all the cell lines that were tested mechanically in our study, for the remaining carcinoma datasets see Figure 4—figure supplements 1–3), (D) non-tumorigenic breast epithelia (MCF10A), and (E) developing neurons (dev. neurons). Comb – combinatorial marker, wt – wild type, PPs – proliferating progenitors, NNs – newborn neurons. Clustering was performed using clustergram function in MATLAB (R2020a,, MathWorks) on log-normalized expression data (Figure 4—source data 1).
-
Figure 4—source data 1
Expression values of the target genes used for plotting the heatmaps in Figure 4A–E.
- https://cdn.elifesciences.org/articles/87930/elife-87930-fig4-data1-v1.xlsx
Figure 4—figure supplement 1
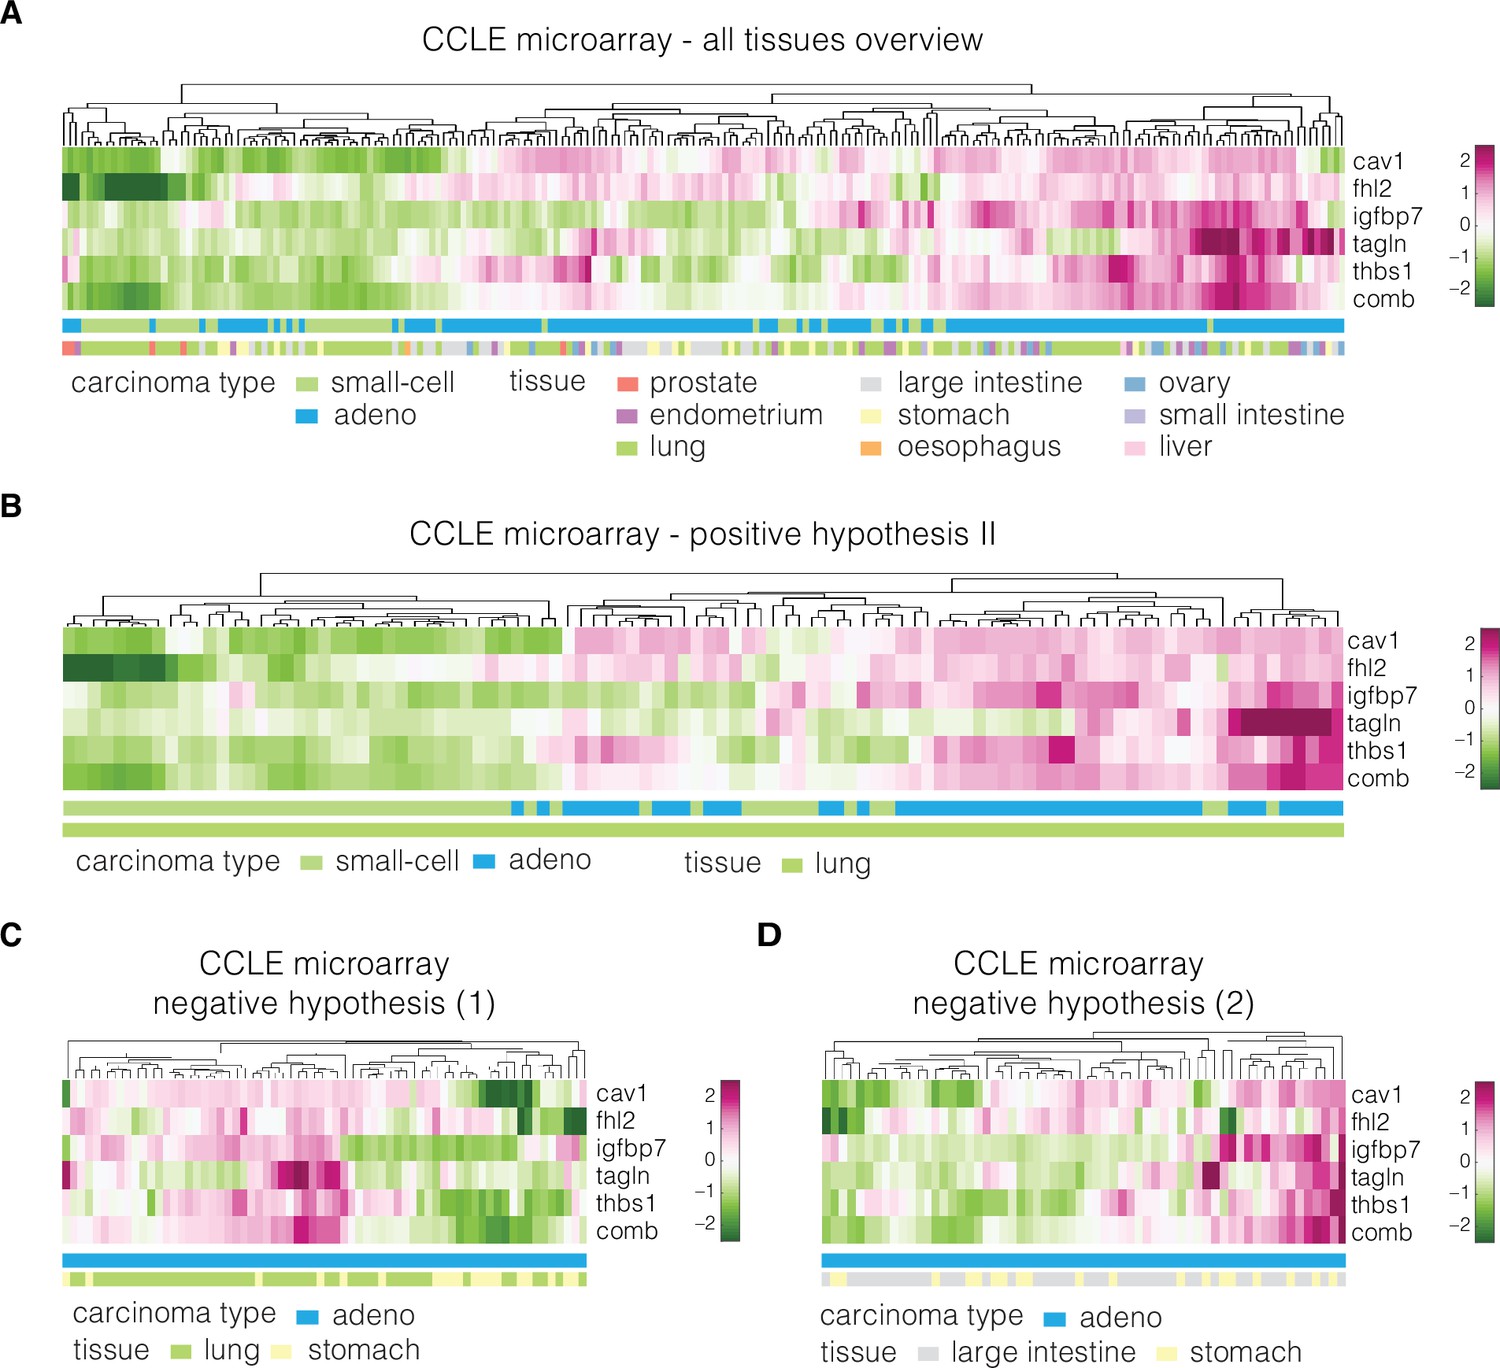
Expression of identified target genes in the CCLE microarray dataset used for validation.
Panels show unsupervised clustering heatmaps of expression data from the CCLE microarray dataset and include: (A) adeno and small-cell carcinoma samples across all tissues present in the dataset, (B) adeno and small-cell carcinoma samples corresponding to lung tissue (used for testing of the positive hypothesis II, see Table 3 in the main text), (C) adenocarcinoma samples corresponding to lung and stomach (used for testing of negative hypothesis, see Table 3 in the main text), and (D) adenocarcinoma samples corresponding to large intestine and stomach (used for testing of the negative hypothesis, see Table 3 in the main text). Clustering was performed using clustergram function in MATLAB (R2020a, MathWorks) on log-normalized expression data. The bars under each heatmap are color-coded for the carcinoma type and tissue of origin (top and bottom bars, respectively) as specified in panel legends. Sample IDs corresponding to each class are listed in Supplementary file 3.
Figure 4—figure supplement 2
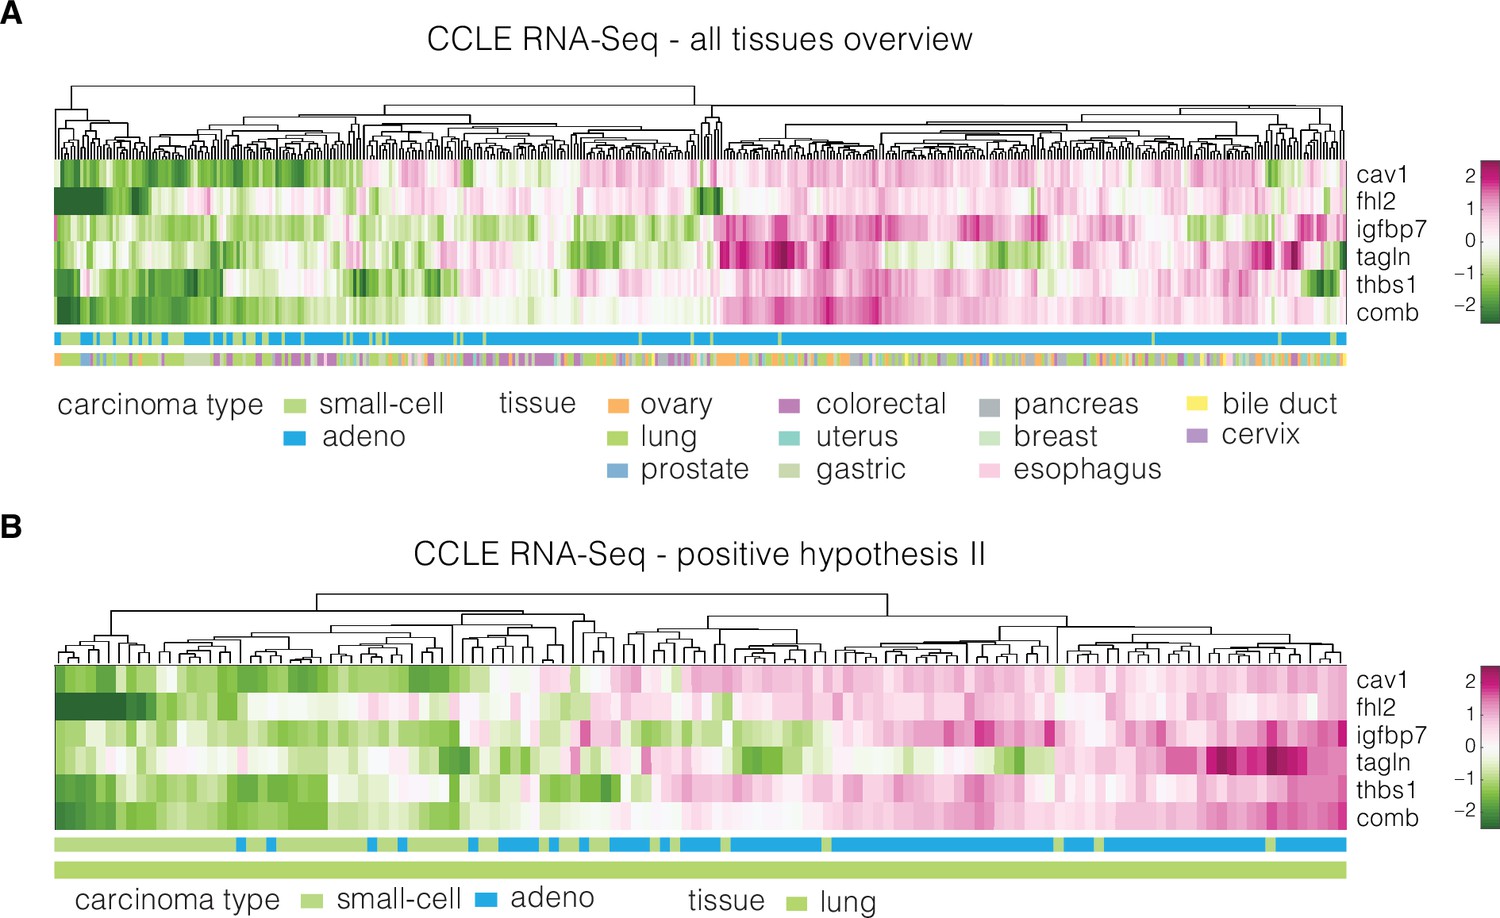
Expression of identified target genes in the CCLE RNA sequencing (RNA-Seq) dataset used for validation.
Panels show unsupervised clustering heatmaps of expression data from the CCLE RNA-Seq dataset and include: (A) adeno and small-cell carcinoma samples across all tissues present in the dataset and (B) adeno and small-cell carcinoma samples corresponding to lung tissue (used for testing of the positive hypothesis II, see Table 3 in the main text). Clustering was performed using clustergram function in MATLAB (R2020a, MathWorks) on log-normalized expression data. The bars under each heatmap are color-coded for the carcinoma type and tissue of origin (top and bottom bars, respectively) as specified in panel legends. Sample IDs corresponding to each class are listed in Supplementary file 3.
Figure 4—figure supplement 3
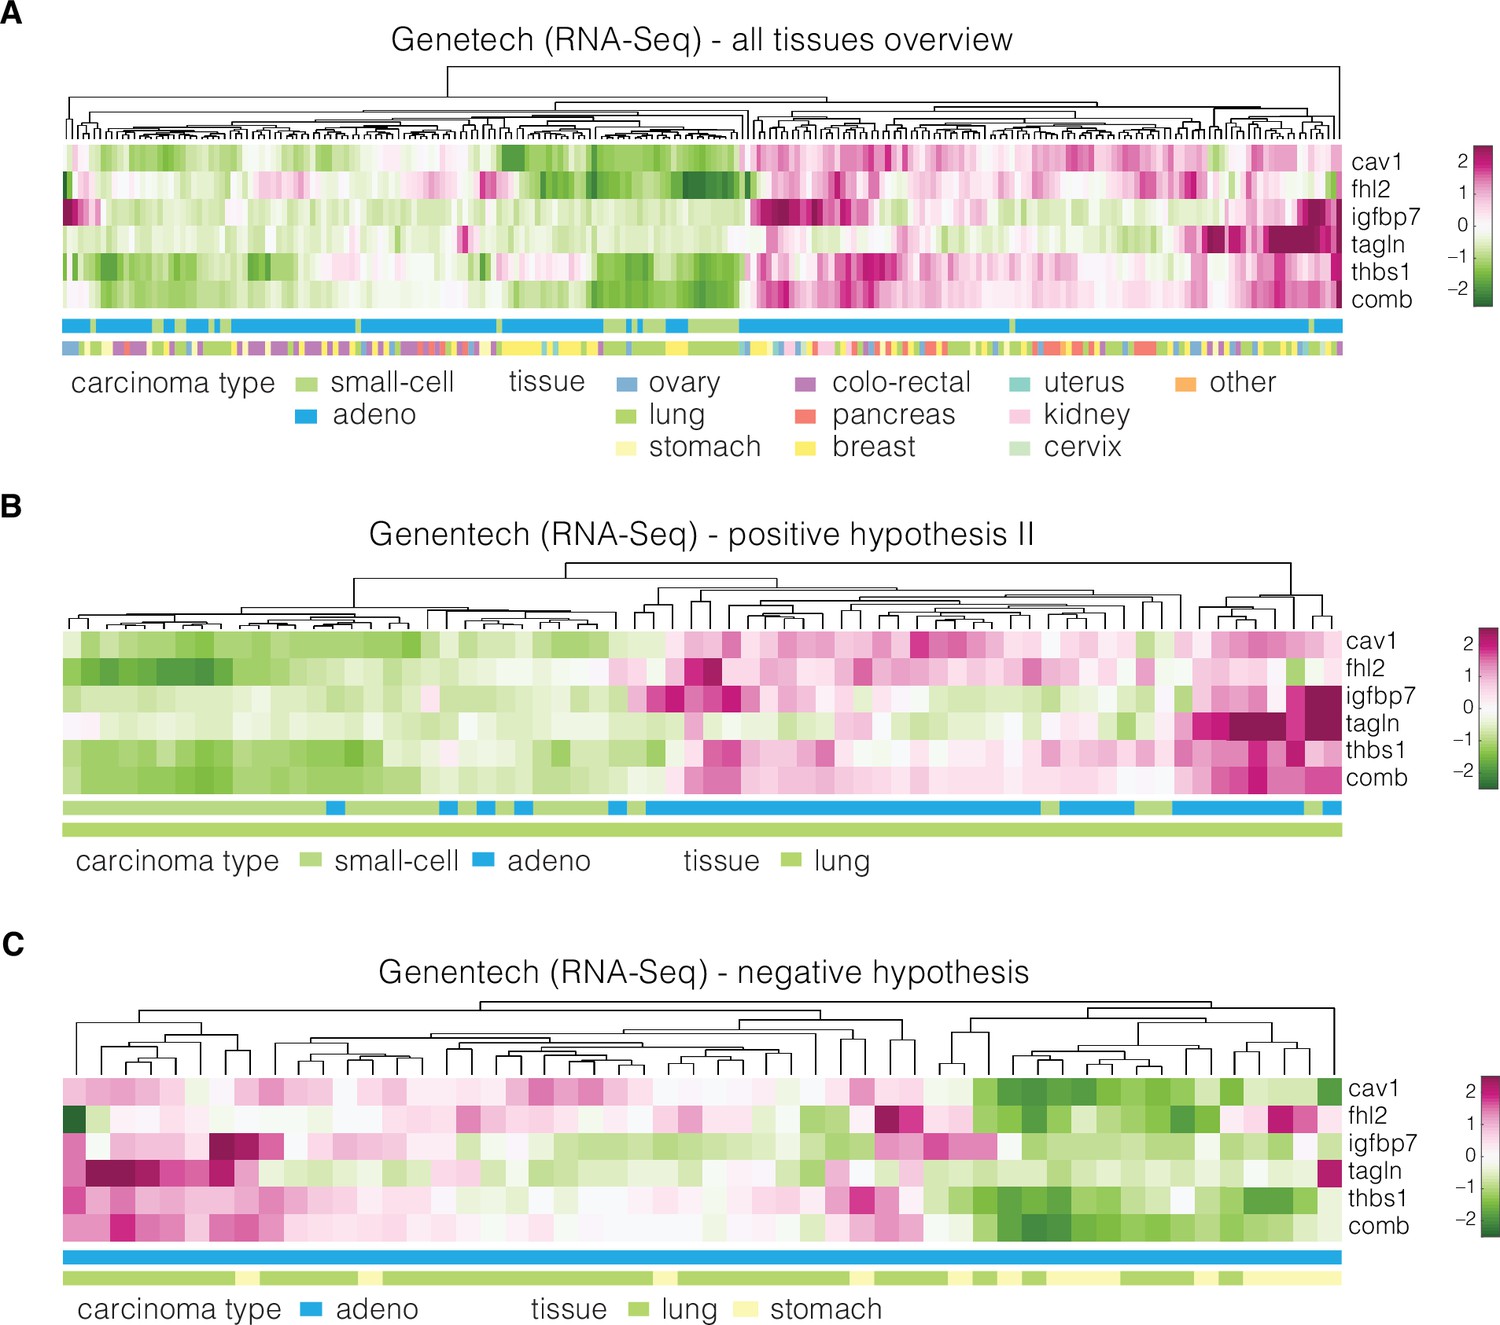
Expression of identified target genes in the Genentech dataset used for validation.
Panels show unsupervised clustering heatmaps of expression data from the Genentech dataset and include: (A) adeno and small-cell carcinoma samples across all tissues present in the dataset, (B) adeno and small-cell carcinoma samples corresponding to lung tissue (used for testing of the positive hypothesis II, see Table 3 in the main text), and (C) adenocarcinoma samples corresponding to lung and stomach (used for testing of the negative hypothesis, see Table 3 in the main text). Clustering was performed using clustergram function in MATLAB (R2020a, MathWorks) on log-normalized expression data. The bars under each heatmap are color-coded for the carcinoma type and tissue of origin (top and bottom bars, respectively) as specified in panel legends. Sample IDs corresponding to each class are listed in Supplementary file 3.
Figure 4—figure supplement 4
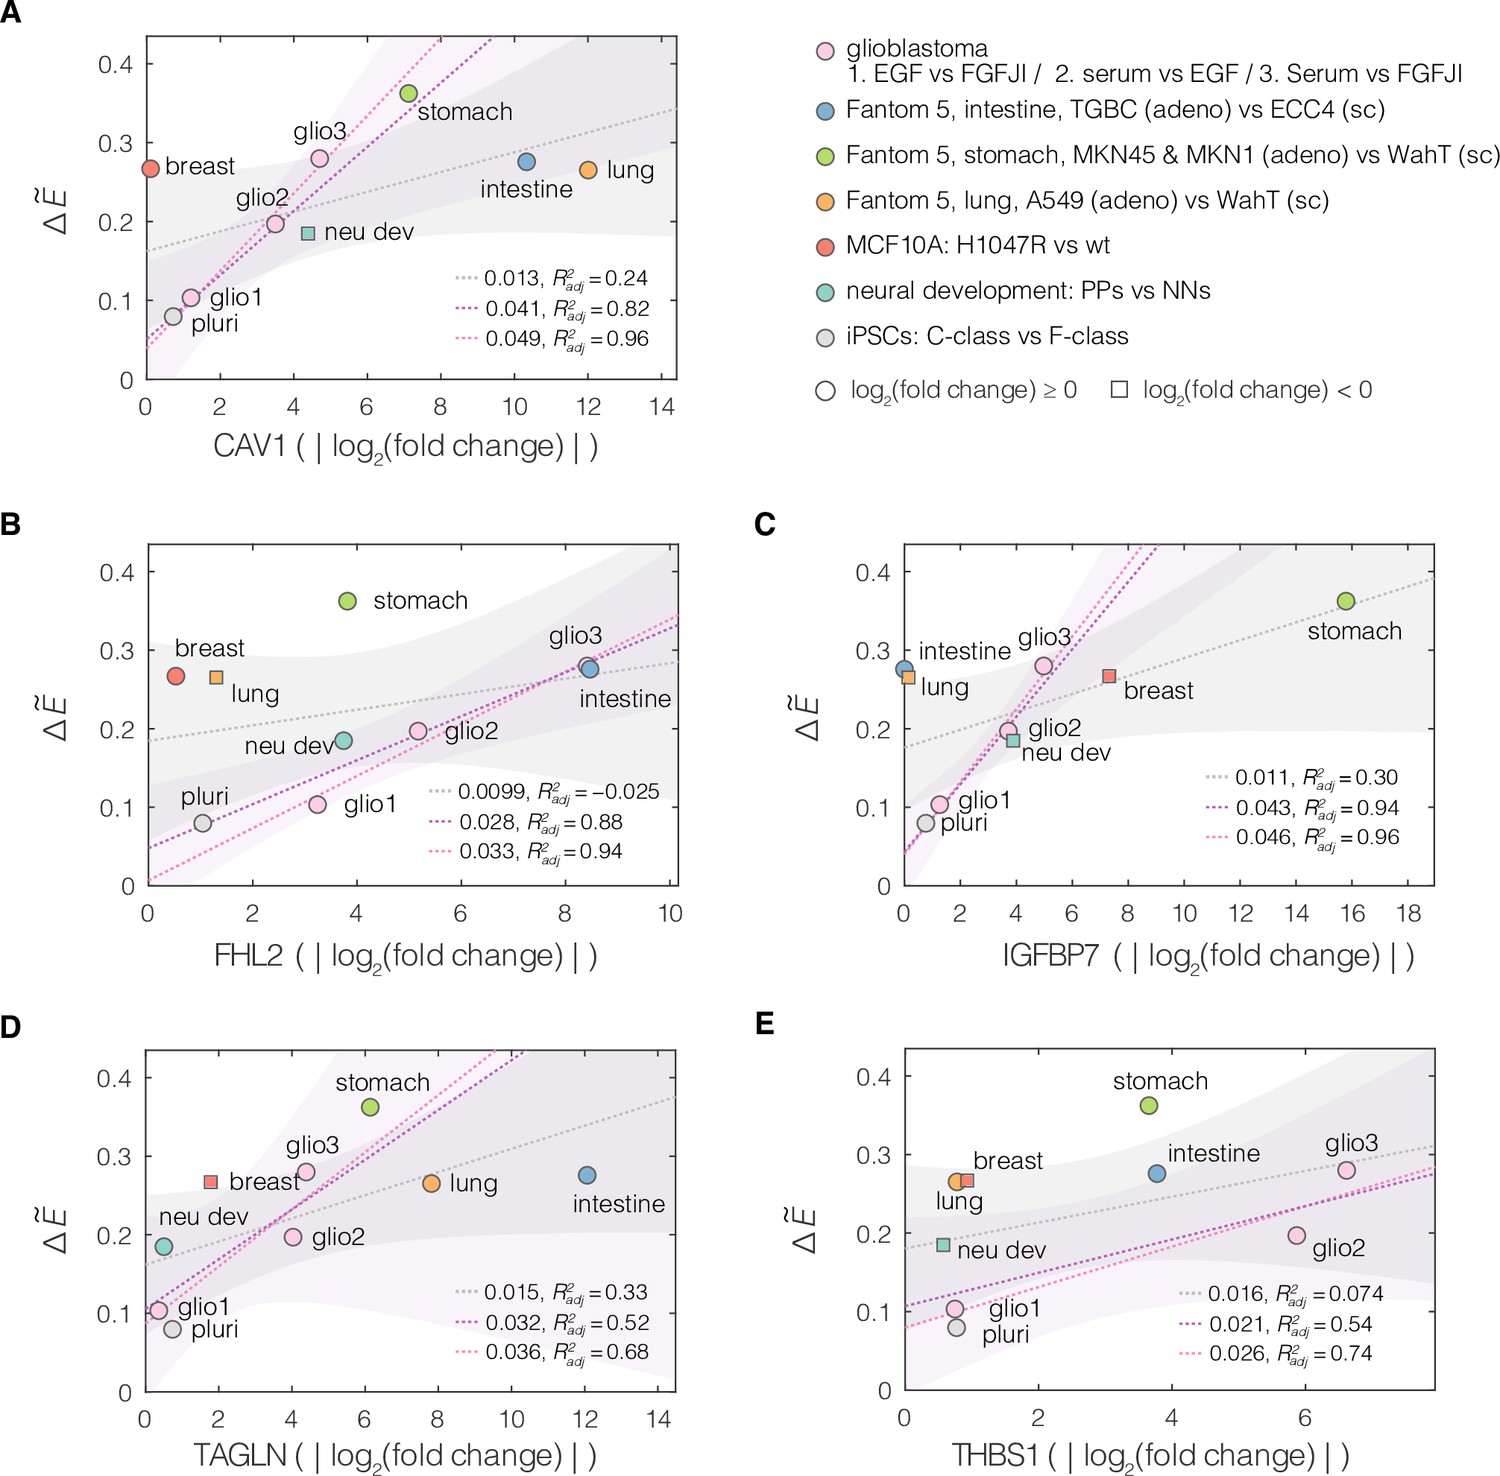
Relation between the magnitude of apparent Young’s modulus change and the absolute change in the expression levels of target genes.
Plots of normalized change in apparent Young’s modulus vs absolute value of change in expression for the target genes from conserved module: (A) CAV1, (B) FHL2, (C) IGFBP7, (D) TAGLN, and (E) THBS1. Every soft–stiff state pair from the respective datasets is presented as an individual point. , where and correspond to the apparent Young’s moduli (mean of all measurements) of the stiff and soft states within the given pairs, respectively. The dotted lines correspond to linear fits to all (gray), similar lineage (glioblastoma, developing neurons, and induced pluripotent stem cell [iPSC]; purple) and glioblastoma only (pink) datapoints. Shaded areas represent 95% confidence intervals (displayed for all and similar lineage fits only). The slope of the respective linear fits and the adjusted R2, are reported in the plots. For the linage-selected data, the fitted slopes become higher and the quality of the fits better (higher ).
Figure 4—figure supplement 5
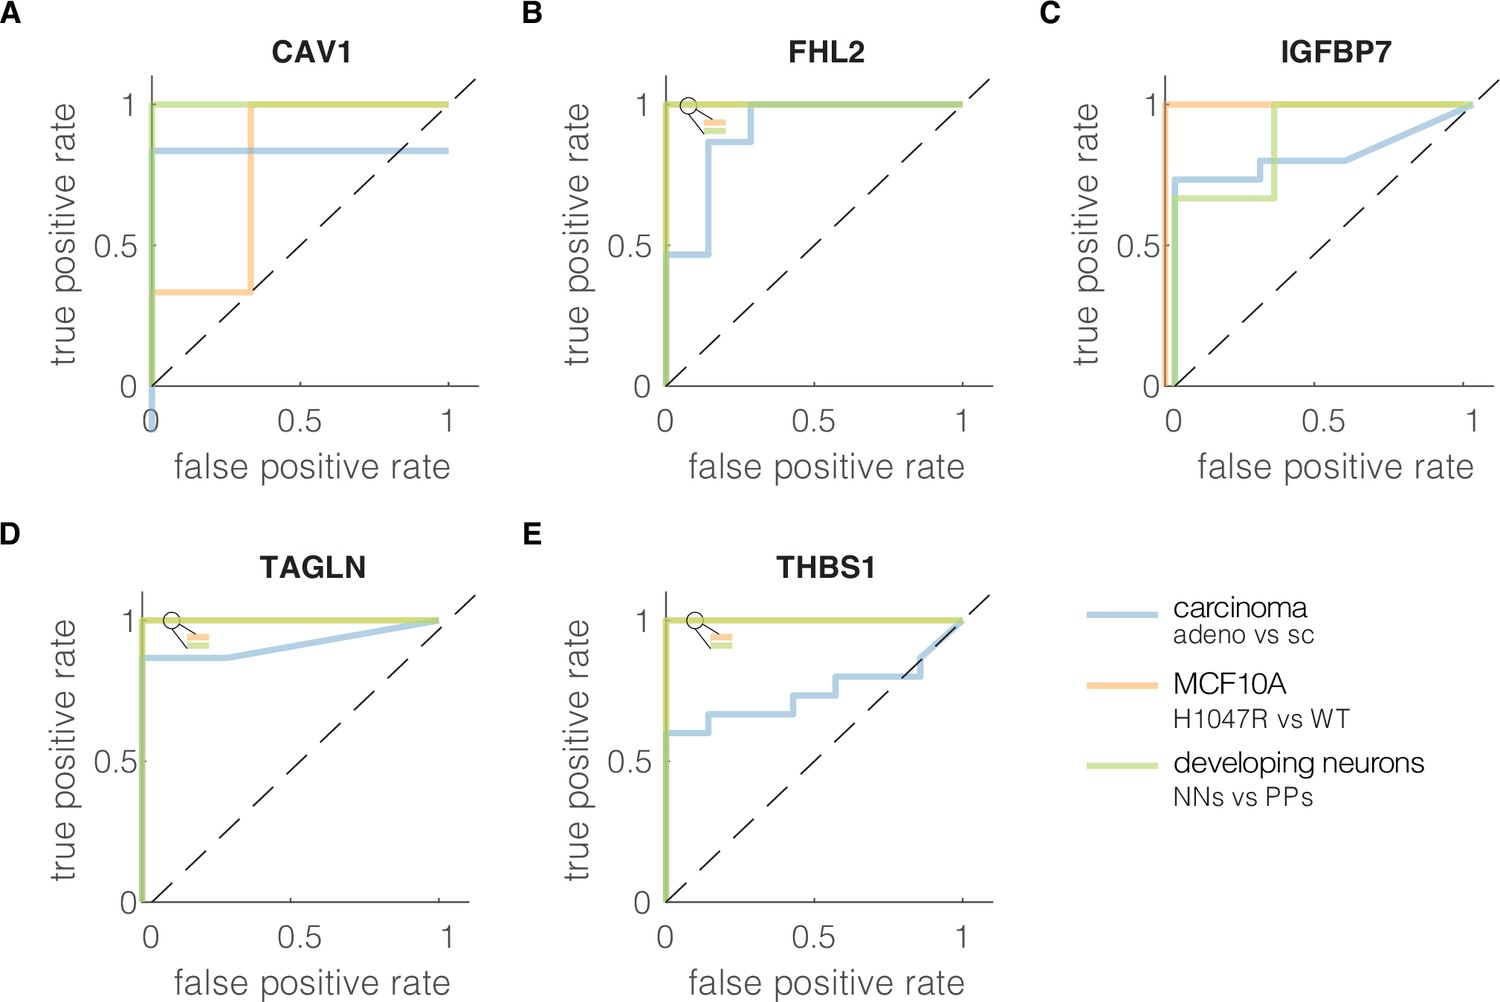
Receiver-operator characteristics (ROC) curves characterizing classification performance of the five genes from the conserved module.
True positive rate was plotted against the false positive rate at different classification thresholds for each soft–stiff phenotype pair from the validation datasets for: (A) CAV1, (B) FHL2, (C) IGFBP7, (D) TAGLN, and (E) THBS1. The insets in the upper left corners of the plot show the colors of all overlying curves with AUC = 1. The ROC curves were constructed using perfcurve function in MATLAB (R2020a,, MathWorks). adeno – adenocarcinoma, sc – small cell carcinoma, WT – wild type, PPs – proliferating progenitors, NNs – newborn neurons.
Figure 5 with 3 supplements
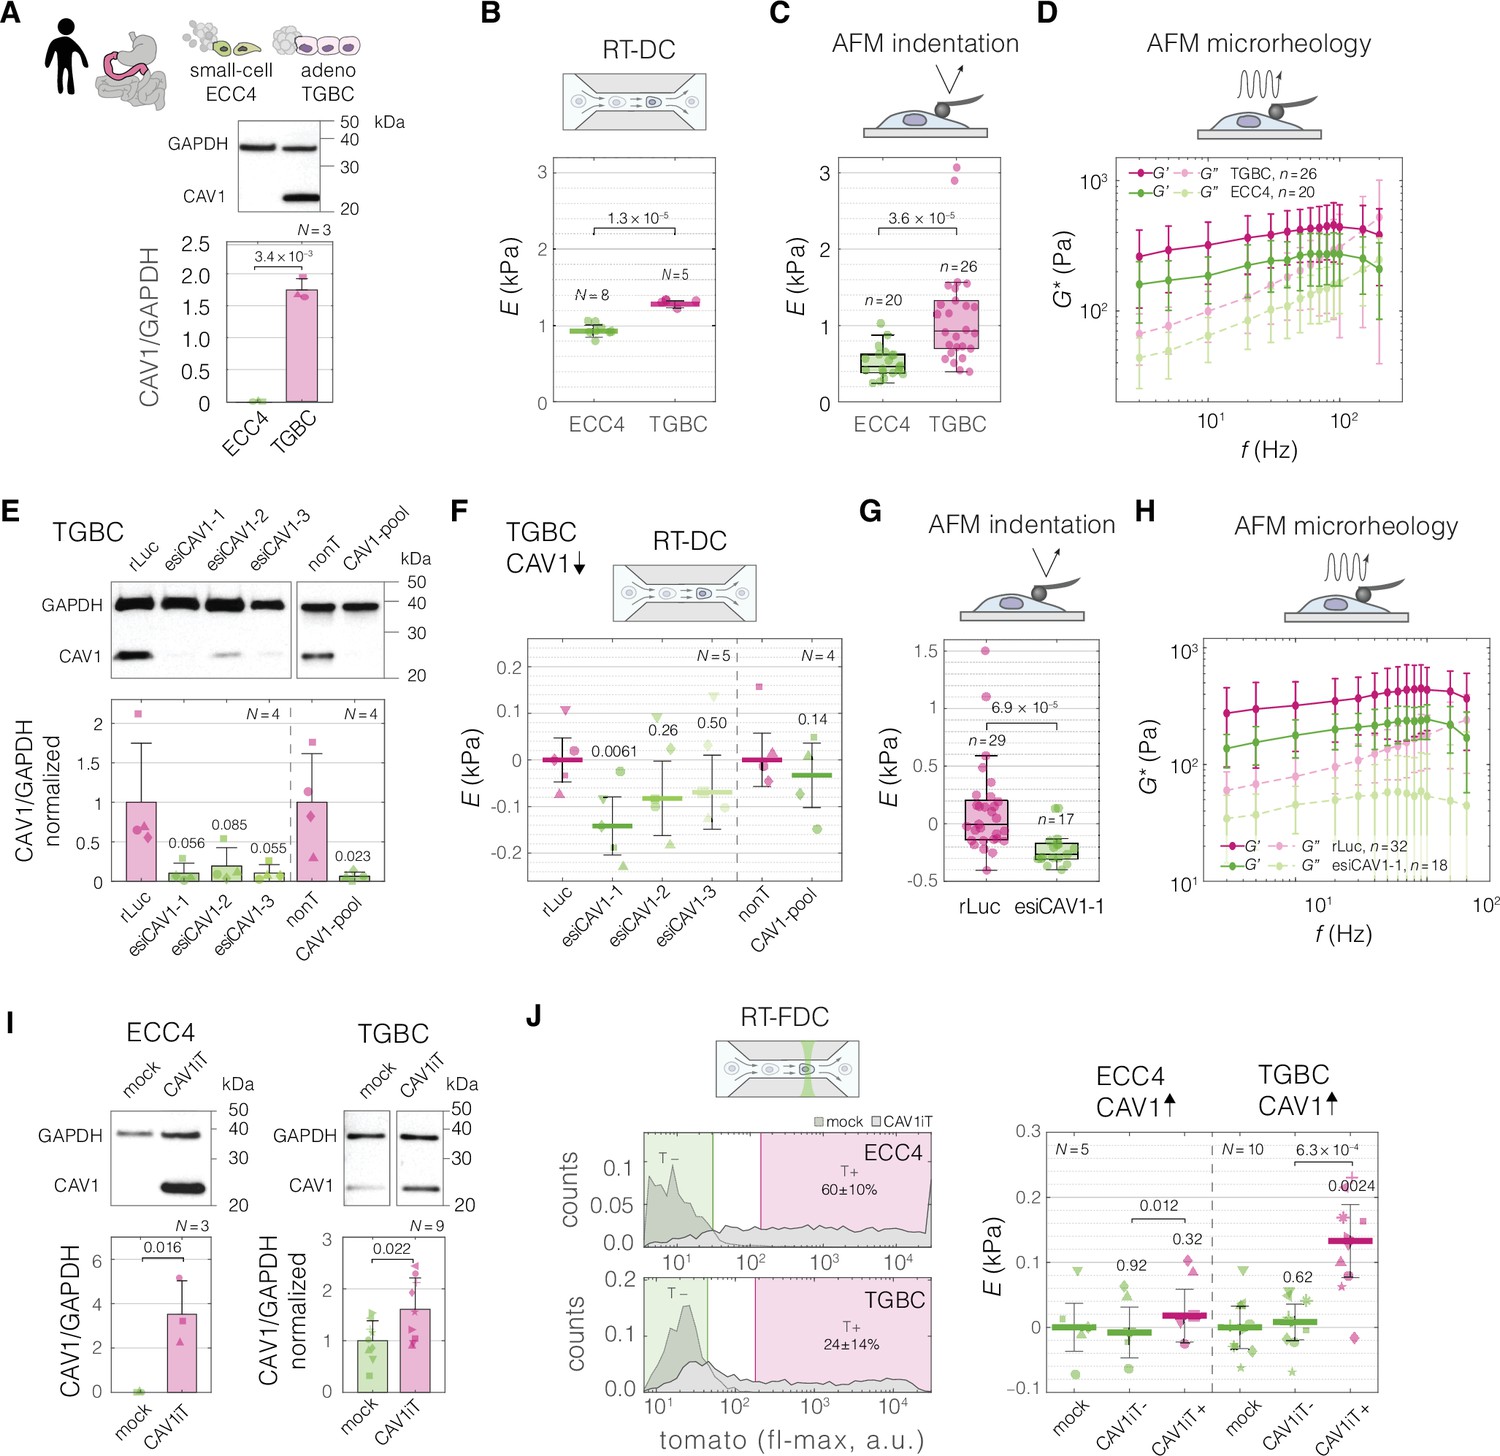
Perturbing levels of CAV1 affects the mechanical phenotype of intestine carcinoma cells.
(A) CAV1 levels in small-cell (ECC4) and adenocarcinoma (TGBC) cell lines from intestine. Mechanical phenotype of ECC4 and TGBC cells measured with real-time deformability cytometry (RT-DC) (B, as in Figure 2B), atomic force microscopy (AFM) indentation (C), and AFM microrheology (D). (E) Protein-level verification of CAV1 knock-down in TGBC cells using two knock-down system: three esiRNA constructs (esiCAV1-1. esiCAV1-1, and esiCAV1-3 with rLuc as a control), and pooled siRNA mixture (CAV1-pool with non-targeting mixture nonT as a control). Mechanical phenotype change of TGBC cells upon CAV1 knock-down as measured by RT-DC (F), AFM indentation (G), and AFM microrheology (H). (I) Protein-level verification of transient CAV1 overexpression in ECC4 and TGBC cells. (J) Mechanical phenotype change of ECC4 and TGBC cells upon CAV1 overexpression as measured by real-time fluorescence and deformability cytometry (RT-FDC). Gating for fluorescence-positive and -negative cells based on dTomato expression in ECC4 (top) and TGBC (bottom) cells (left-hand side). Fluorescence-positive cells correspond to cells expressing CAV1-IRES-dTomato (CAV1iT). For comparison, mock transfection sample is shown in the background (mock). Apparent Young’s modulus changes of ECC4 and TGBC cells upon CAV1 overexpression (right-hand side). CAV1iT− and CAV1T+ are dTomato negative and positive cells, respectively. For protein quantification in (A, E, and I), representative western blots (top) as well as quantification of specified replicate numbers N (bottom) are shown. In (B, F, and J), horizontal lines delineate medians with mean absolute deviation (MAD) as error, datapoints represent medians of N experiment replicates, statistical analysis was performed using generalized linear mixed effects model. In (C) and (G), box plots spread from 25th to 75th percentiles with a line at the median, whiskers span 1.5 × interquartile range (IQR), individual datapoints correspond to values obtained for n individual cells, statistical analysis was performed using two sample two-sided Wilcoxon rank sum test. In (D) and (H), datapoints correspond to means ± standard deviation of all measurements at given oscillation frequencies for n cells. Lines connecting datapoints serve as guides for the eye. E – apparent Young’s modulus, G* – complex shear modulus, ΔE – apparent Young’s modulus change relative to respective control measurements. In (E, F, I, and J), the symbol shapes represent matching experiment replicates.
-
Figure 5—source data 1
CAV1 protein levels presented in Figure 5A, E and I.
- https://cdn.elifesciences.org/articles/87930/elife-87930-fig5-data1-v1.xlsx
-
Figure 5—source data 2
Mechanical measurements conducted in the perturbation experiments on ECC4 and TGBC cell lines using real-time deformability cytometry (RT-DC), atomic force microscopy (AFM) indentation, and AFM oscillatory measurements.
- https://cdn.elifesciences.org/articles/87930/elife-87930-fig5-data2-v1.xlsx
-
Figure 5—source data 3
FL2-max data for the histograms presented in Figure 5J.
- https://cdn.elifesciences.org/articles/87930/elife-87930-fig5-data3-v1.xlsx
-
Figure 5—source data 4
Original membrane scans for all replicates.
- https://cdn.elifesciences.org/articles/87930/elife-87930-fig5-data4-v1.zip
-
Figure 5—source data 5
Overview of all blots with labelled protein size markers and bands.
- https://cdn.elifesciences.org/articles/87930/elife-87930-fig5-data5-v1.zip
Figure 5—figure supplement 1
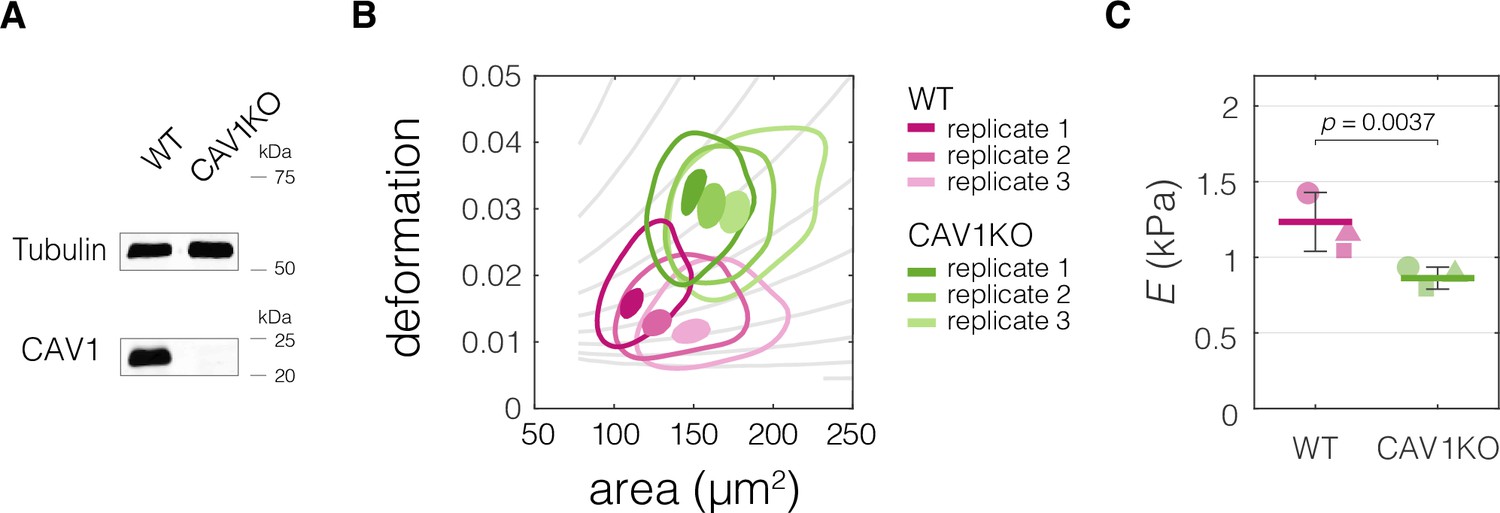
CAV1 knock-out mouse embryonic fibroblasts (CAV1KO) have lower stiffness compared to the wild-type (WT) cells.
(A) Western blot analysis of CAV1 expression levels in CAV1KO compared to WT cells. (B) Plots of area vs deformation for CAV1KO and WT cells characterized with real-time deformability cytometry (RT-DC). Contour plots delineate 95% and 50% density areas (solid lines and filled area, respectively) of data from individual measurement replicates (n = 3). The isoelasticity lines in the background (gray) indicate regions of the same apparent Young’s moduli. (C) Apparent Young’s modulus values estimated for WT and CAV1KO cells using area-deformation data in (B). The symbol shapes represent experimental replicates. Horizontal lines delineate medians with mean absolute deviation (MAD) as error, datapoints represent medians of the individual replicates. Statistical analysis was performed using generalized linear mixed effects model.
-
Figure 5—figure supplement 1—source data 1
Original membrane scans for all replicates.
- https://cdn.elifesciences.org/articles/87930/elife-87930-fig5-figsupp1-data1-v1.zip
-
Figure 5—figure supplement 1—source data 2
Overview of all blots with labelled protein size markers and bands.
- https://cdn.elifesciences.org/articles/87930/elife-87930-fig5-figsupp1-data2-v1.zip
Figure 5—figure supplement 2
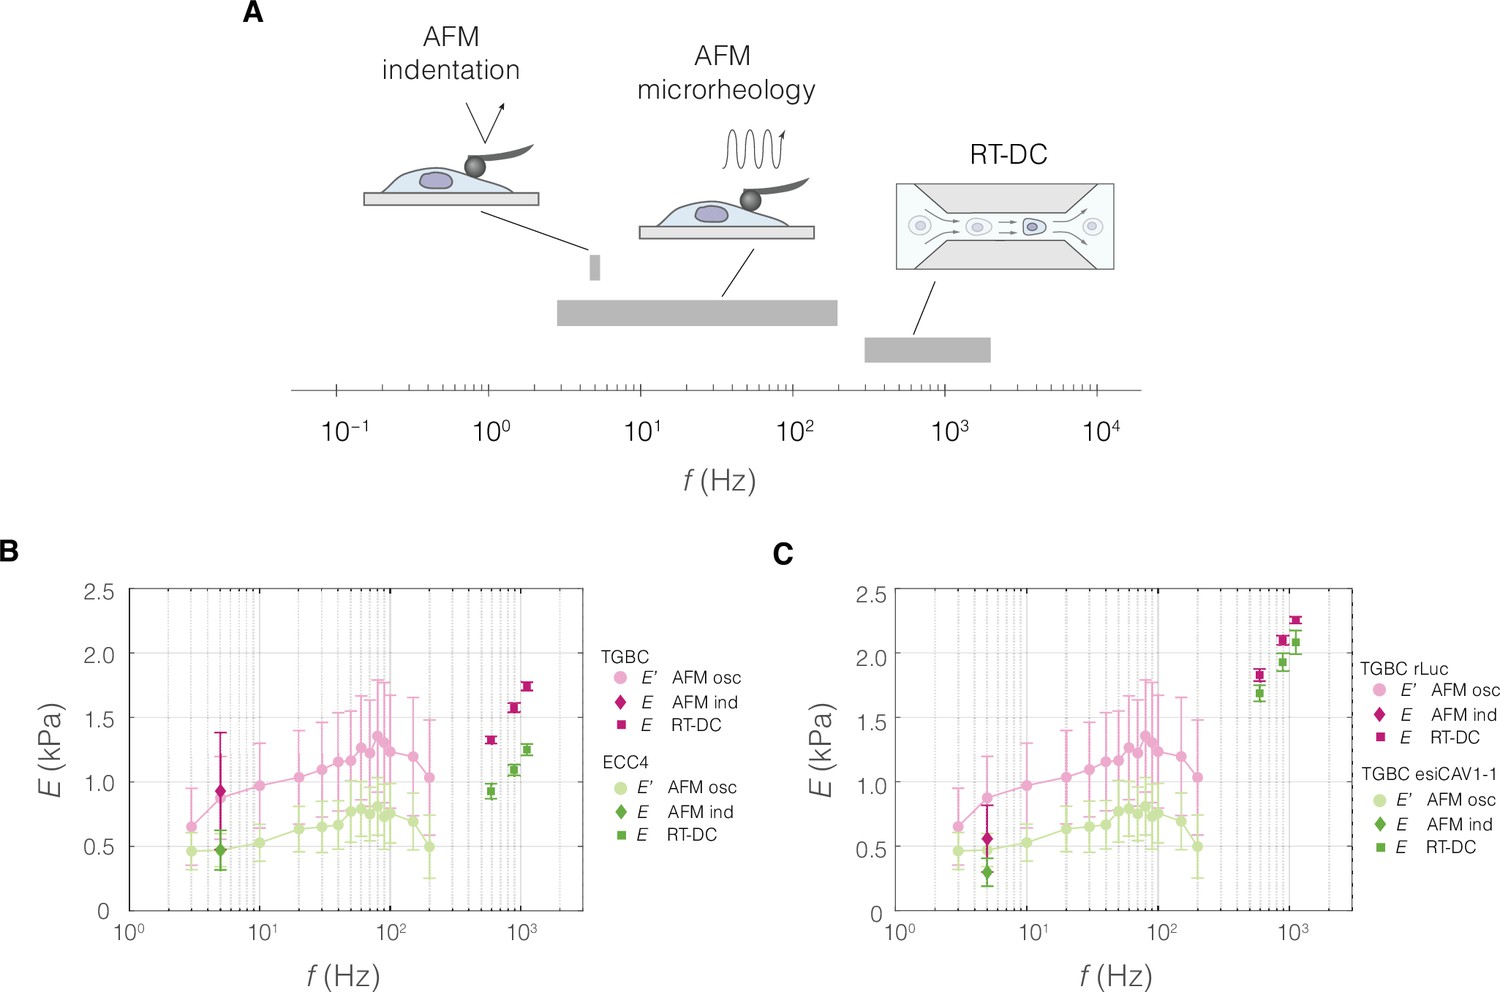
Absolute Young’s modulus values across the probing frequencies characteristic for the three measurement methods.
(A) Graphical representation of measurement frequencies (the inverse of the time within which strain is induced) in the three methods for characterizing mechanical properties used in this study. For real-time deformability cytometry (RT-DC), the frequency at which deformation is induced was deduced based on the time it takes to pass a 300-μm long square channel with an average velocity based on a range of flow rates typically used for 20 and 30 μm channels (see also Table 6 and Supplementary file 1). Apparent Young’s moduli derived from RT-DC as well as atomic force microscopy (AFM) indentation and microrheology measurements plotted against probing frequency for ECC4 and TGBC cell lines (B), and CAV1 knock-down in TGBC cells (C). For RT-DC, datapoints for measurements at 0.16, 0.24, and 0.32 μl s−1 flowrates are included for which the estimated frequencies, based on the time that it takes for the cell to pass through the channel, are equal to 593, 889, and 1119 Hz, respectively. For AFM microrheology, storage Young’s moduli E′ were obtained from storage shear moduli () according to the following equation: , assuming a Poisson’s ratio, , of 0.5. Datapoints correspond to means ± SD of individual cells (AFM microrheology) or medians ± MAD (of individual cells or measurement replicates in the case of AFM and RT-DC, respectively). Data corresponds to Figure 5B–D (B) and Figure 5F, H (C).
Figure 5—figure supplement 3
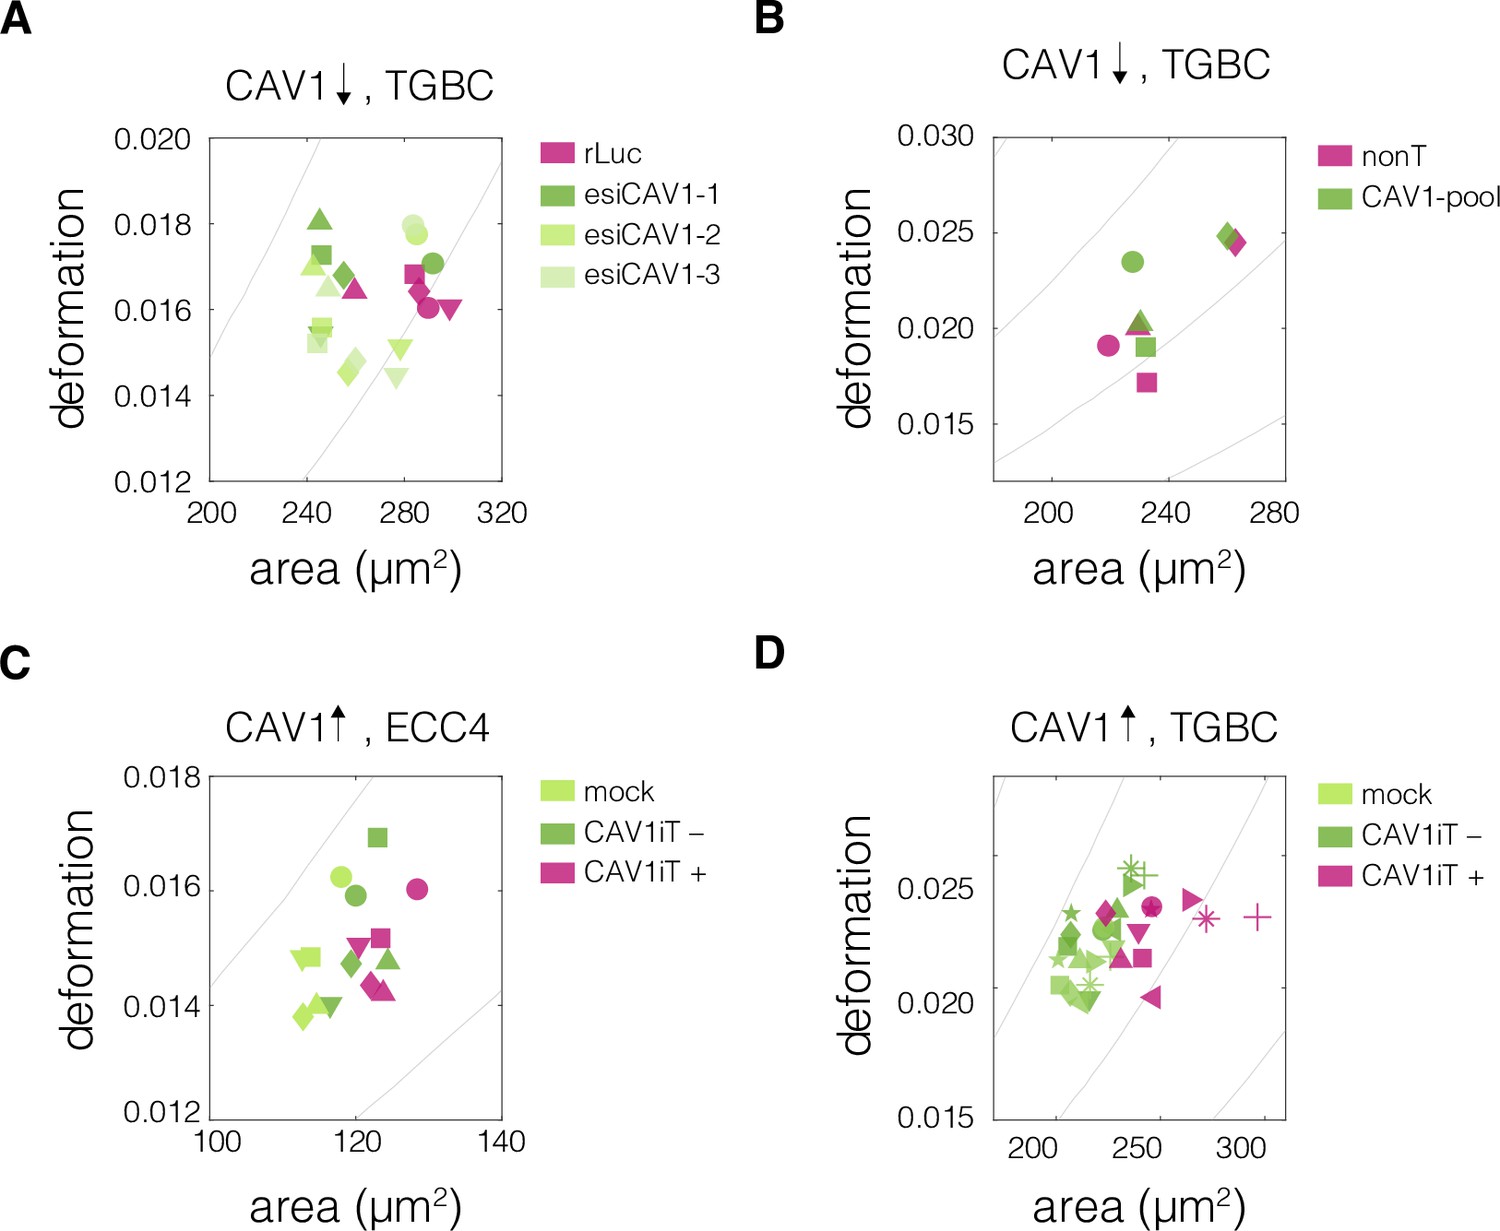
Plots of area vs deformation from real-time deformability cytometry (RT-DC) measurements of cells with perturbed CAV1 levels.
Panels correspond to the following experiments: CAV1 knock-down in TGBC cells using esiRNA (A) and ONTarget siRNA (B), and transient CAV1 overexpression in ECC4 cells (C) and TGBC cells (D). Datapoints indicate medians of individual measurement replicates. The isoelasticity lines in the background (gray) indicate regions of same apparent Young’s moduli. The symbol shapes represent experimental replicates.
Figure 6
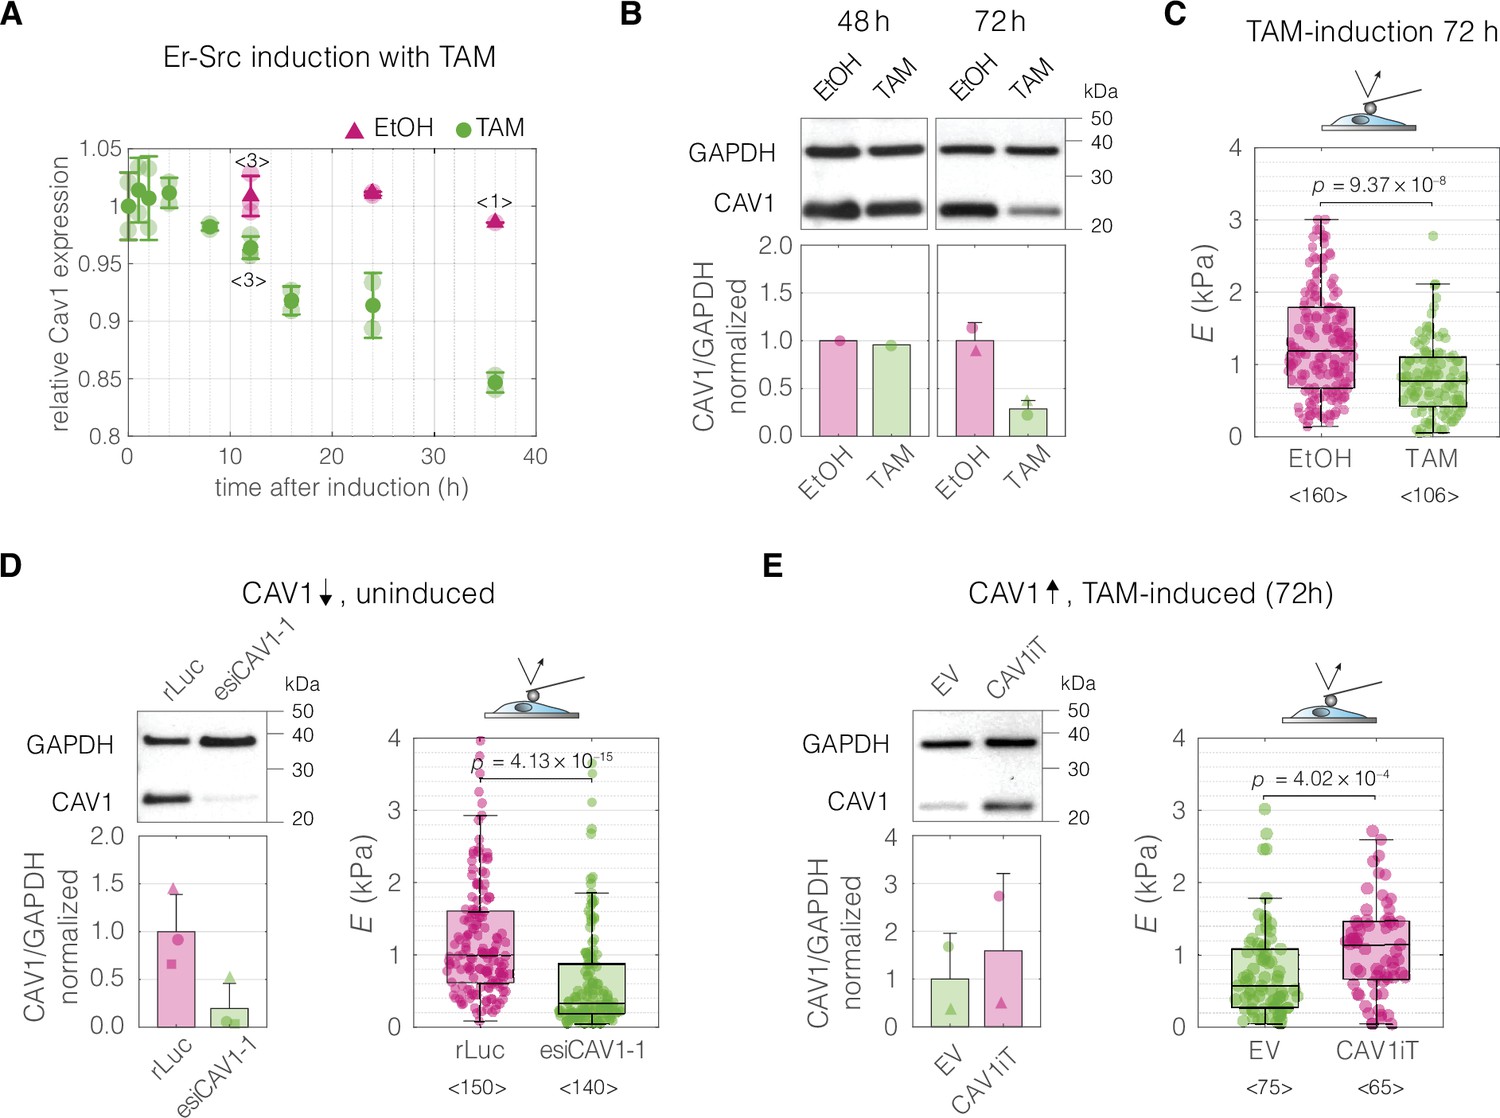
Perturbations of CAV1 levels in MCF10A-ER-Src cells result in cell stiffness changes.
(A) Inducing transformation of MCF10A- ER-Src cells by tamoxifen (TAM) treatment, as opposed to vehicle control (ethanol, EtOH), causes a decrease of CAV1 expression over time, as captured by microarray analysis (GEO accession number: GSE17941, data previously published in Hirsch et al., 2010). Datapoints with error bars represent means ± standard deviation (N = 2, unless indicated otherwise). (B) Western blot analysis shows the decrease of CAV1 at protein level 72 hr post induction. (C) MCF10A-ER-Src cells show decreased apparent Young’s moduli 72 hr post TAM induction. (D) CAV1 knock-down in uninduced MCF10A-ER-Src cells results in lowering of the apparent Young’s modulus. (E) Overexpression of CAV1 in TAM-induced MCF10A-ER-Src cells causes increase in the apparent Young’s modulus and effectively reverts the softening caused by TAM induction (compare to panel C). Box plots in (C–E) spread from 25th to 75th percentiles with a line at the median, whiskers span 1.5 × interquartile range (IQR), individual datapoints correspond to values obtained for individual cells, the number of measured cells per conditions, pooled from N = 3 independent experiments, is indicated below each box. Statistical analysis was performed using a two-sided Wilcoxon rank sum test. In the bar graphs in (B, D, and E), the symbol shapes represent experiment replicates.
-
Figure 6—source data 1
CAV1 expression and protein levels associated with MCF10A-Er-Src perturbation experiments presented in Figure 6A, B, D, and E.
- https://cdn.elifesciences.org/articles/87930/elife-87930-fig6-data1-v1.xlsx
-
Figure 6—source data 2
Young’s moduli E obtained from atomic force microscopy (AFM) indentation measurements for the MCF10A-Er-Src perturbation experiments presented in Figure 6C–E.
- https://cdn.elifesciences.org/articles/87930/elife-87930-fig6-data2-v1.xlsx
-
Figure 6—source data 3
Original membrane scans for all replicates.
- https://cdn.elifesciences.org/articles/87930/elife-87930-fig6-data3-v1.zip
-
Figure 6—source data 4
Overview of all blots with labelled protein size markers and bands.
- https://cdn.elifesciences.org/articles/87930/elife-87930-fig6-data4-v1.zip
Author response image 1
Author response image 2

Author response image 3
Author response image 4
Author response image 5
Author response image 6
Author response image 7
Author response image 8
Author response image 9

Cell volumes for the divergent cell states in the five characterized biological systems.
(A) Glioblastoma. (B) Carcinoma. (C) MCF10A. (D) iPSCs. (E) Developing neurons. Data corresponds to Figure 2. Cell volumes were estimated using Shape-Out 1.0.10 by rotation of the cell contours.
Author response image 10

Cell volumes for CAV1 perturbation experiments.
(A) CAV1 knock down performed in TGBC cells. (B) CAV1 overexpression in ECC4 and TGBC cells. Data corresponds to Figure 5. Cell volumes were estimated using Shape-Out 1.0.10 by rotation of the cell contours.
Author response image 11

Cell volumes for WT and CAV1KO MEFs.
Data corresponds to Figure S9. Cell volumes were estimated using Shape-Out 1.0.10 by rotation of the cell contours.
Author response image 12

Visualisation of interactions between the nodes in the identified module using functional protein association networks tool STRING.
(A) Connections obtained using multiple proteins search and entering the five network nodes. (B) Extended network that includes further genes to increase indirect connectivity. The genes are added automatically by STRING. Online version of STRING v12.0 was used with Homo sapiens as species of interest.
Author response image 13

Co-occurrence of genes from the network module across the evolutionary tree.
Mammals are indicated with the green frame, glires (include mouse), as well as primates (include human) are indicated with yellow frames. The view was generated using online version of STRING 12.0.
Author response image 14

Expression of genes from the identified module across various organ and organ systems in mouse.
The expression matrices for organs (A) and organ systems (B) were generated using Tissue x Gene Matrix tool of Gene eXpression Database (https://www.informatics.jax.org/gxd/, accessed on 22nd September 2024). No pre-selection of stage (age) and assay type (includes RNA and protein-based assays) was applied. The colors in the grid (blues for expression detected and reds for expression not detected) get progressively darker when there are more supporting annotations. The darker colors do not denote higher or lower levels of expression, just more evidence.
Author response image 15
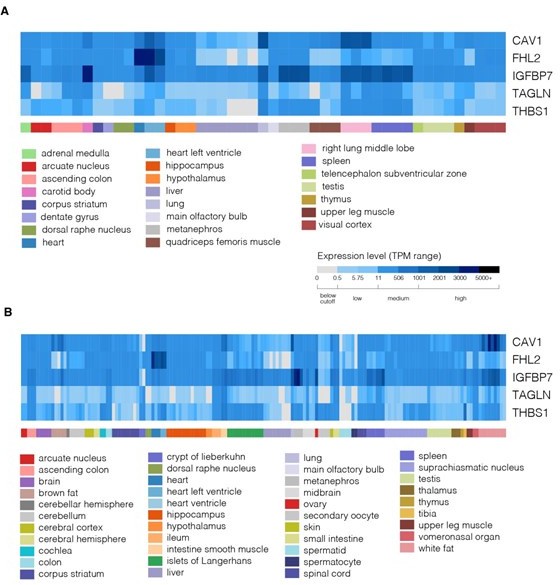
Expression of genes from the identified module across various mouse tissue structures.
The expression matrices for age-selected mouse marked as adult (A) or young individuals (collected ages labelled P42-84 / P w6-w12 / P m1.5-3.0) (B) are presented and were generated using RNASeq Heatmap tool of Gene eXpression Database (https://www.informatics.jax.org/gxd/, accessed on 2nd October 2024).
Author response image 16

Expression of genes from the identified module across various cell types and organs in t-SNE embedding of Tabula Muris dataset.
(A) t-SNE clustering color-coded by organ. (B-F) t-SNE clustering colorcoded for expression of CAV1 (B), IGFBP7 (C), FHL2 (D), TAGLN (E), and THBS1 (F). The plots were generated using FACS-collected cells data through the visualisation tool available at https://tabulamuris.sf.czbiohub.org/ (accessed on 22nd September 2024).
Author response image 17
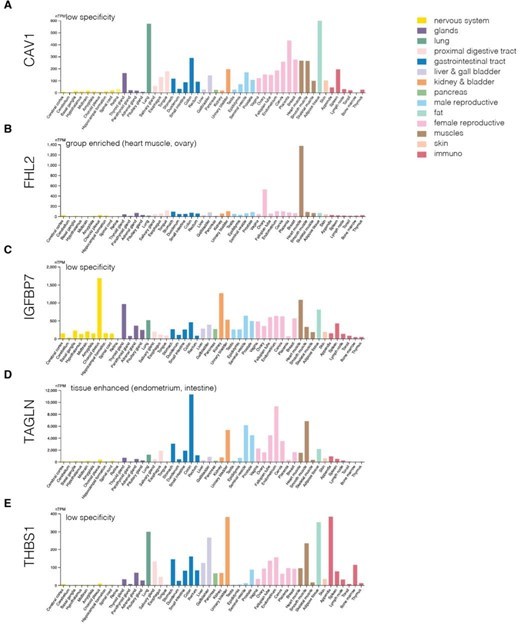
Expression of genes from the identified module at the mRNA level across various human tissues.
(A-E) Expression levels of CAV1 (A), IGFBP7 (B), FHL2 (C), TAGLN (D), and THBS1 (E). The plots were generated using consensus dataset from Human Protein Atlas v23 https://www.proteinatlas.org/ (accessed on 22nd September 2024).
Author response image 18

Protein levels of genes from the identified module across various human tissues.
(A-E) Protein levels of CAV1 (A), IGFBP7 (B), FHL2 (C), TAGLN (D), and THBS1 (E). The plots were generated using Human Protein Atlas v23 https://www.proteinatlas.org/ (accessed on 22nd September 2024).
Author response image 19

The impact of CAV1 knock down on cell counts in TGBC cells.
(A) Absolute cell counts per condition in a 6-well format. Cell counts were performed when harvesting for RT-DC measurements using an automated cell counter (Countess II, Thermo Fisher Scientific). (B) The event rates observed during the RT-DC measurements. The harvested cells are resuspended in a specific volume of measuring buffer standardized per experiment (50-100 μl); thus, the event rates reflect the absolute cell numbers in the respective samples. Horizontal lines delineate medians with mean absolute deviation (MAD) as error, datapoints represent individual measurement replicates, with symbols corresponding to matching measurement days. Statistical analysis was performed using two sample two-sided Wilcoxon rank sum test.
Author response image 20
Author response image 21

Visualization of different axis scaling strategies applied to the five datasets presented in Figure 2 of the manuscript.
Tables
Table 1
Mechano-transcriptomic datasets used in this study.
Pred – prediction, Val – validation, PI/II – positive hypothesis I/II, N – negative hypothesis, CCLE – cancer cell line encyclopedia, HT Seq – high-throughput RNA sequencing, CAGE – cap analysis of gene expression, AFM – atomic force microscopy, adeno – adenocarcinoma, wt – wild type, PP – proliferating progenitors, NNs – newborn neurons.
| General information | Transcriptomic data | Mechanics data | ||||||||
|---|---|---|---|---|---|---|---|---|---|---|
| Source | Dataset name | Used for | Cell states | Accession number | Reference | Method | Unique entries | Total samples used | Method | Reference |
| Human | Glioblastoma | Pred | FGFJI, EGF, serum | GEO: GSE77751 | Poser et al., 2019 | HT seq | 39,400 | 27 | RT-DC | Poser et al., 2019 |
| Carcinoma | Val: PI | small-cell, adeno | DDBJ: DRA000991* | FANTOM5 Forrest et al., 2014 | CAGE | 18,821 | 12 | RT-DC, AFM | this paper | |
| Val: PII & N | GEO: GSE36139† | CCLE microarray Barretina et al., 2012 | Microarray | 18,925 | 162 | |||||
| Val: PII | DepMap: release 21Q4‡ | CCLE RNA-Seq Ghandi et al., 2019 | HT seq | 51,304 | 179 | |||||
| Val: PII & N | GEO: GSE30611 | Genentech Klijn et al., 2015 | HT seq | 25,996 | 82 | |||||
| MCF10A | Val: PI | wt, H1047R | GEO: GSE69822 | Kiselev et al., 2015 | HT seq | 38,508 | 6 | RT-DC | this paper | |
| Mouse | iPSCs | Pred | F-class, C-class | GEO: GSE49940 | Tonge et al., 2014 | Microarray | 18,118 | 28 | RT-DC, AFM | Urbanska et al., 2017 |
| Developing neurons | Val: PI | PPs, NNs | GEO: GSE51606 | Aprea et al., 2013 | HT seq | 21,110 | 9 | RT-DC | this paper | |
-
*
Data for samples of interest was extracted using TET tool from the FANTOM5 website https://fantom.gsc.riken.jp/5/.
-
†
Data was downloaded using the ArrayExpress archive https://www.ebi.ac.uk/arrayexpress/experiments/E-MTAB-2706/.
-
‡
DepMap Public 21Q4 Primary Files, accessed via DepMap portal https://depmap.org/portal/download.
Table 2
List of identified target genes comprising the conserved module.
| Symbol | Gene description | HGNC ID | MGI ID |
|---|---|---|---|
| CAV1 | Caveolin-1 | HGNC:1527 | MGI:102709 |
| FHL2 | Four and a half LIM domains 2 | HGNC:3703 | MGI:1338762 |
| IGFBP7 | Insulin-like growth factor-binding protein 7 | HGNC:5476 | MGI:1352480 |
| TAGLN | Transgelin | HGNC:11553 | MGI:106012 |
| THBS1 | Thrombospondin 1 | HGNC:11785 | MGI:98737 |
Table 3
Overview of the hypotheses and datasets used for validating universality and specificity of obtained markers.
Hypotheses are listed in the column headings. Under every hypothesis, sample groups used for the hypothesis testing are listed. Numbers of samples used in every group are indicated in brackets.
| Positive hypothesis I: markers are discriminative of samples with stiff/soft mechanical phenotype independent of the studied biological system | Positive hypothesis II: markers are discriminative of samples with stiff/soft mechanical phenotype independent of data source | Negative hypothesis: markers are discriminative of samples from different tissue of origin (but with no mechanical difference) |
|---|---|---|
| Carcinoma - FANTOM5 1. small-cell (n = 6) vs adeno (n = 6) (lung, intestine, and stomach) MCF10A 2. wt (n = 3) vs H1047R (n = 3) Developing neurons 3. PPs (n = 3) vs NNs (n = 3) | Carcinoma - CCLE microarray 1. small-cell (n = 51) vs adeno (n = 49) (lung) Carcinoma - CCLE RNA-Seq 2. small-cell (n = 51) vs adeno (n = 77) (lung) Carcinoma - Genentech (RNA-Seq) 3. small-cell (n = 30) vs adeno (n = 38) (lung) | Carcinoma - CCLE microarray 1. lung (n = 49) vs stomach (n = 19)(adeno) 2. large intestine (n = 43) vs stomach (n = 19) (adeno) Carcinoma - Genentech (RNA-Seq) 3. lung (n = 38) vs stomach (n = 14) (adeno) |
Table 4
Validation of identified target genes and the combinatorial marker.
Minimum AUC-ROC (min AUC-ROC) and JVT p values are reporter for the two positive hypotheses and one negative hypothesis for each target genes and the combinatorial marker (comb, highlighted in bold). The specific datasets and comparisons used for testing of each hypothesis are listed in Table 3. The results presented in this table can be reproduced using the code and data available on GitHub as reported in the Materials and methods.
| Measure | CAV1 | FHL2 | IGFBP7 | TAGLN | THBS1 | comb | |
|---|---|---|---|---|---|---|---|
| Positive hypothesis I | min AUC-ROC | 0.78 | 0.89 | 0.67 | 0.78 | 0.56 | 0.97 |
| JVT p value | 0.14 | 0.04 | 0.30 | 0.14 | 0.81 | 0.01 | |
| Positive hypothesis II | min AUC-ROC | 0.89 | 0.88 | 0.73 | 0.56 | 0.86 | 0.92 |
| JVT p value | 0.02 | 0.03 | 0.19 | 0.59 | 0.04 | 0.01 | |
| Negative hypothesis | min AUC-ROC | 0.54 | 0.51 | 0.51 | 0.52 | 0.61 | 0.51 |
| JVT p value | 0.40 | 0.76 | 0.90 | 0.61 | 0.06 | 0.91 |
Table 5
Carcinoma cell lines.
List of all carcinoma cell lines acquired from RIKEN BRC Cell Bank used in this study, together with the catalogue number, tissue of origin, carcinoma type, growth medium specification, and passage number at purchase.
| Cell line | Cat no. | Tissue | Type | Medium (Gibco cat #) | Serum (%) | Passage |
|---|---|---|---|---|---|---|
| ECC4 | RCB: RCB0982; RRID:CVCL_1190 | Intestine | small-cell | RPMI1640 (11875093) | 10 | 7 |
| TGBC18TKB | RCB: RCB1169; RRID:CVCL_3338 | Intestine | adeno | DMEM (11885084) | 5 | 5 |
| WA-hT | RCB: RCB2279; RRID:CVCL_8766 | Lung | small-cell | MEM (11095080) | 10 | 54 |
| A549 | RCB: RCB0098; RRID:CVCL_0023 | Lung | adeno | DMEM (11885084) | 10 | 92 |
| ECC10 | RCB: RCB0983; RRID:CVCL_1188 | Stomach | small-cell | RPMI1640 (11875093) | 10 | 8 |
| MKN45 | RCB: RCB1001; RRID:CVCL_0434 | Stomach | adeno | RPMI1640 (11875093) | 10 | 6 |
| MKN1 | RCB: RCB1003; RRID:CVCL_1415 | Stomach | adeno | RPMI1640 (11875093) | 10 | 6 |
Table 6
Mechanical characterizations of cells from the individual datasets using real-time deformability cytometry (RT-DC) — experimental details.
For each dataset, experimental details of the measuring conditions are listed, including the widths of channel constriction (wchannel), total flow rates (Qtotal), percentages of methylcellulose (MC) in the measurement buffer (buffer % MC), effective viscosity of the measurement buffer in the channel at the flowrate used (ηeff, according to Herold, 2017), as well as gates used for data filtering.
| Measurement conditions | Data filtering | |||||
|---|---|---|---|---|---|---|
| wchannel (μm) | Qtotal (μl s−1) | Buffer % MC | ηeff (mPa s−1) | Area (μm2) | Area ratio | |
| Glioblastoma | 30 | 0.16 | 0.5 | 5.4 | 50–600 | 1.0–1.05 |
| Carcinoma | 30 | 0.16 | 0.5 | 5.4 | 60–600 | 1.0–1.05 |
| MCF10A | 20 | 0.04 | 0.5 | 5.7 | 75–320 | 1.0–1.05 |
| iPSCs | 20 | 0.04 | 0.5 | 5.7 | 50–500 | 1.0–1.05 |
| dev neurons | 20 | 0.04 | 0.5 | 5.7 | 25–300 | 1.0–1.05 |
| MEFs | 30 | 0.16 | 0.5 | 5.4 | 50–500 | 1.0–1.05 |
Table 7
siRNAs used in the knock-down experiments.
Full sequences of esiRNAs (HU-03125-1, HU-03125-2, and HU-03125-3) are included in Supplementary file 5.
| Name | Target | Commercial name | Cat no. | Vendor |
|---|---|---|---|---|
| rLuc | Renilla Luciferase | RLUC | RLUC | Eupheria Biotec |
| esiCAV1-1 | Human caveolin 1 | hCAV1 | HU-03125-1 | Eupheria Biotec |
| esiCAV1-2 | Human caveolin 1 | hCAV1, custom design | HU-03125-2 | Eupheria Biotec |
| esiCAV1-3 | Human caveolin 1 | hCAV1, custom design | HU-03125-3 | Eupheria Biotec |
| nonT | Non-targeting | ON-TARGETplus Non-targeting Pool | D-001810-10-05 | Dharmacon |
| CAV1-pool | Human caveolin 1 | ON-TARGETplus Human CAV1 siRNA, SMARTPool | L-003467-00-0005 | Dharmacon |
Appendix 1—key resources table
| Reagent type (species) or resource | Designation | Source or reference | Identifiers | Additional information |
|---|---|---|---|---|
| Gene (Homo sapiens, Mus musculus) | CAV1 | NA | HGNC:1527; MGI:102709 | Caveolin 1 |
| Gene (H. sapiens, M. musculus) | FHL2 | NA | HGNC:3703; MGI:1338762 | Four and a half LIM domains 2 |
| Gene (H. sapiens, M. musculus) | IGFBP7 | NA | HGNC:5476; MGI:1352480 | Insulin-like growth factor-binding protein 7 |
| Gene (H. sapiens, M. musculus) | TAGLN | NA | HGNC:11553; MGI:106012 | Transgelin |
| Gene (H. sapiens, M. musculus) | THBS1 | NA | HGNC:11785; MGI:98737 | Thrombospondin 1 |
| Antibody | anti-Caveolin-1 (rabbit monoclonal) | Cell Signaling Technology | CST: 3267; RRID:AB_2275453 | WB (1:1000) |
| Antibody | anti-GAPDH (rabbit polyclonal) | Abcam | Abcam: ab9485; RRID:AB_307275 | WB (1:5000) |
| Antibody | anti-rabbit HRP-conjugated (goat polyclonal) | Abcam | Abcam: ab97069; RRID:AB_10679812 | WB (1:4000) |
| Cell line (H. sapiens) | Glioblastoma | Poser et al., 2019 | X01; X04; X08 | Human brain tumor cell lines; maintained in A. Androutsellis-Theotokis Lab (TU Dresden, Germany) |
| Cell line (H. sapiens) | ECC4 | RIKEN BRC Cell Bank | RCB: RCB0982; RRID:CVCL_1190 | Intestine small-cell carcinoma; passage 7; medium: RPMI1640 (#11875093), 10% FBS |
| Cell line (H. sapiens) | TGBC (TGBC18TKB) | RIKEN BRC Cell Bank | RCB: RCB1169; RRID:CVCL_3338 | Intestine adenocarcinoma; passage 5; medium: DMEM (#11885084), 5% FBS |
| Cell line (H. sapiens) | WA-hT | RIKEN BRC Cell Bank | RCB: RCB2279; RRID:CVCL_8766 | Lung small-cell carcinoma; passage 54; medium: MEM (#11095080), 10% FBS |
| Cell line (H. sapiens) | A549 | RIKEN BRC Cell Bank | RCB: RCB0098; RRID:CVCL_0023 | Lung adenocarcinoma; passage 92; medium: DMEM (#11885084), 10% FBS |
| Cell line (H. sapiens) | ECC10 | RIKEN BRC Cell Bank | RCB:RCB0983; RRID:CVCL_1188 | Stomach small-cell carcinoma; passage 8; medium: RPMI1640 (#11875093), 10% FBS |
| Cell line (H. sapiens) | MKN45 | RIKEN BRC Cell Bank | RCB: RCB1001; RRID:CVCL_0434 | Stomach adenocarcinoma; passage 6; medium: RPMI1640 (#11875093), 10% FBS |
| Cell line (H. sapiens) | MKN1 | RIKEN BRC Cell Bank | RCB: RCB1003; RRID:CVCL_1415 | Stomach adenocarcinoma; passage 6; medium: RPMI1640 (#11875093), 10% FBS |
| Cell line (H. sapiens) | MCF10A H1024R; MCF10A WT | Juvin et al., 2013 | MCF10A H1024R; MCF10A WT | Breast epithelial cells bearing single-allele oncogenic mutation of PIK3CA (H1024R); WT – isogenic control; kindly provided by L.R. Stephens (Babraham Institute, UK) |
| Cell line (H. sapiens) | MCF10A-ER-Src | Hirsch et al., 2009 | MCF10A-ER-Src; RRID:CVCL_N805 | Breast epithelial cell model of TAM-inducible cancerous transformation driven by v-Src, a kind gift from K. Struhl (Harvard Medical School, MA, USA) |
| Cell line (M. musculus) | iPSCs (F- and C-class) | Urbanska et al., 2017 | iPSCs (F- and C-class) | Induced pluripotent stem cells derived through reprogramming of murine fetal neural progenitor cells |
| Cell line (M. musculus) | MEFs CAV1KO; MEFs WT | Razani et al., 2001 | MEFs CAV1KO; MEFs WT | Mouse embryonic fibroblasts derived from WT or CAV1KO littermate C57BL/9 mice; cell lines were a kind gift from M.P. Lisanti (University of Salford, Manchester, UK) |
| Biological sample (M. musculus) | Developing neurons (primary cells) | Aprea et al., 2013 | Developing neurons: PP – proliferating progenitors; NNs – newborn neurons | Freshly isolated from double-reporter mouse line Btg2RFP/Tubb3GFP by M. Dori in the Lab of F. Calegari |
| Transfected construct (H. sapiens) | rLuc (esiRNA to rLuc) | Eupheria Biotech | Eupheria Biotech: RLUC | 200 ng per 2 μl RNAiMax in 12wp format |
| Transfected construct (H. sapiens) | esiCAV1-1 (esiRNA to human CAV1, design 1, commercially available) | Eupheria Biotech | Eupheria Biotech: HU-03125-1 | 200 ng per 2 μl RNAiMax in 12wp format; see Supplementary file 5 for sequence details |
| Transfected construct (H. sapiens) | esiCAV1-2 (esiRNA to human CAV1, design 2, custom) | Eupheria Biotech | Eupheria Biotech: HU-03125-2 | 200 ng per 2 μl RNAiMax in 12wp format; see Supplementary file 5 for sequence details |
| Transfected construct (H. sapiens) | esiCAV1-3 (esiRNA to human CAV1, design 3, custom) | Eupheria Biotech | Eupheria Biotech: HU-03125-3 | 200 ng per 2 μl RNAiMax in 12wp format; see Supplementary file 5 for sequence details |
| Transfected construct (H. sapiens) | nonT (ON-TARGETplus Non‑targeting siRNA Pool) | Dharmacon | Dharmacon: D-001810-10-05 | 300 ng per 2 μl RNAiMax in 12wp format |
| Transfected construct (H. sapiens) | CAV1-pool (ON-TARGETplus Human CAV1 siRNA, SMARTPool) | Dharmacon | Dharmacon: L-003467-00-0005 | 300 ng per 2 μl RNAiMax in 12wp format |
| Transfected construct (H. sapiens) | pCGIT-hCAV1 (plasmid, plasmid product referred to as CAV1iT) | this paper | pCGIT-hCAV1 | See ‘Plasmid for CAV1 overexpression’ in Materials and methods; plasmid map available on figshare |
| Chemical compound, drug | RNAiMax reagent | Thermo Fisher Scientific | Thermo Fisher Scientific: 13778030 | For siRNA transfections |
| Chemical compound, drug | Effectene transfection reagent | QIAGEN | QIAGEN: 301425 | For plasmid transfections |
| Chemical compound, drug | Methylcellulose | Alpha Aesar | Cat#: 036718.22 CAS 9004-67-5 | For preparation of viscosity-adjusted RT-DC measurement buffer |
| Software, algorithm | ShapeOut (v 1.0.10) | Müller et al., 2020 | For analysis of RT-DC data, available on GitHub | |
| Software, algorithm | JPK data processing software | JPK Instruments/Bruker | For analysis of AFM experiments | |
| Software, algorithm | PC-Corr network analysis | Ciucci et al., 2017 | Code available on GitHub | |
| Software, algorithm | Cytoscape (v 3.8.0) | Shannon et al., 2003 | RRID:SCR_003032 | https://cytoscape.org/ |
| Software, algorithm | Joint-view trustworthiness (JVT) | this paper; biomedical-cybernetics, 2022 | Code available on GitHub and figshare | |
| Software, algorithm | Fiji, ImageJ | Schindelin et al., 2012 | RRID:SCR_002285 | https://fiji.sc/ |
| Other | PNP-TR-TL | Nanoworld, Switzerland | Nanoworld: PNP-TR-TL | Tip-less AFM cantilevers, nominal spring constant k = 0.08 N m−1 |
| Other | Arrow TL1 | Nanoworld, Switzerland | Nanoworld: Arrow TL1 | Tip-less AFM cantilevers, nominal spring constant k = 0.035–0.045 N m−1 |
| Other | Polystyrene beads, 5 µm diameter | microParticles, Germany | microParticles: PS-R-5.0 | For decorating of the AFM cantilevers |
Author response table 1
Possible two-set combinations of datasets.
For each combination, the number of common genes is indicated. The number on the diagonal represents total number of transcripts in the individual datasets, n corresponds to the number of samples in the respective datasets. * include non-coding genes.
| human | mouse | |||||
|---|---|---|---|---|---|---|
| A. glioblastoma | B. carcinoma | C. MCF10A | D. IPSCs | E. dev neurons | ||
| human | A. glioblastoma | 39400* (n = 27) | 16260 | 31688 | 9452 | 12894 |
| B. carcinoma | 18821 (n = 22) | 16267 | 9410 | 12393 | ||
| C. MCF10A | 38508* (n = 6) | 9598 | 12951 | |||
mouse | D. IPSCs | 18118 (n = 28) | 10338 | |||
| E. dev neurons | 21110 (n = 6) | |||||
Author response table 2
| Short Name | Sample No | Sample Description | Displayed Name (old) | Displayed Name (new) |
|---|---|---|---|---|
| wt_2_0 | GSM1709515 | MCF10a WT_t=0_replicate1condition: no EGF +DMSO | wt #2 | wt #1 |
| wt_3b_0 | GSM1709516 | MCF10a WT_t=0_replicate2condition: no EGF +DMSO | wt #3 | wt #2 |
| wt_4_0 | GSM1709517 | MCF10a WT_t=0_replicate3condition: no EGF +DMSO | wt #4 | wt #3 |
| ki_1_0 | GSM1709554 | MCF10a PIK3CAH1047R_t=0_replicate1condition: no EGF +DMSO | ki#1 | ki#1 |
| ki_2_0 | GSM1709555 | MCF10a PIK3CAH1047R_t=0_replicate2condition: no EGF +DMSO | ki#2 | ki#2 |
| ki_3_0 | GSM1709556 | MCF10a PIK3CAH1047R_t=0_replicate3condition: no EGF +DMSO | ki#3 | ki#3 |
Additional files
-
Supplementary file 1
Operation parameters of the three methods used for characterizing the mechanical properties of cells.
- https://cdn.elifesciences.org/articles/87930/elife-87930-supp1-v1.docx
-
Supplementary file 2
Overview of transcriptomic profiling details for the datasets used in this study.
- https://cdn.elifesciences.org/articles/87930/elife-87930-supp2-v1.xlsx
-
Supplementary file 3
List of sample IDs assigned to the different cell states in the respective transcriptomic datasets.
- https://cdn.elifesciences.org/articles/87930/elife-87930-supp3-v1.xlsx
-
Supplementary file 4
Joint-view trustworthiness (JVT) pseudocode and computational complexity analysis.
- https://cdn.elifesciences.org/articles/87930/elife-87930-supp4-v1.docx
-
Supplementary file 5
Sequences of esiRNAs used for CAV1 knock-down experiments.
- https://cdn.elifesciences.org/articles/87930/elife-87930-supp5-v1.docx
-
MDAR checklist
- https://cdn.elifesciences.org/articles/87930/elife-87930-mdarchecklist1-v1.docx
Download links
A two-part list of links to download the article, or parts of the article, in various formats.
Downloads (link to download the article as PDF)
Open citations (links to open the citations from this article in various online reference manager services)
Cite this article (links to download the citations from this article in formats compatible with various reference manager tools)
De novo identification of universal cell mechanics gene signatures
eLife 12:RP87930.
https://doi.org/10.7554/eLife.87930.3


