Activation of the P2RX7/IL-18 pathway in immune cells attenuates lung fibrosis
- Université Côte d’Azur, CNRS, INSERM, IRCAN, France
- FHU OncoAge, France
- Université Côte d'Azur, CNRS, Institut Pharmacologie Moléculaire et Cellulaire, France
- Université Côte d'Azur, Centre Hospitalier Universitaire de Nice, Pneumology Department, France
- Inserm U995, LIRIC, Université de Lille, CHRU de Lille, Faculté de médecine – Pôle recherche, Place Verdun, France
- Hautes Etudes d’Ingénieur (HEI), JUNIA Hauts-de-France, UCLille, Laboratoire de chimie durable et santé, France
- ‘Al. I. Cuza’ University of Iasi, Faculty of Chemistry, Romania
- Laboratory of Clinical and Experimental Pathology and Biobank, Pasteur Hospital, France
- Hospital-Related Biobank (BB-0033-00025), Pasteur Hospital, France
Figures
Figure 1 with 1 supplement
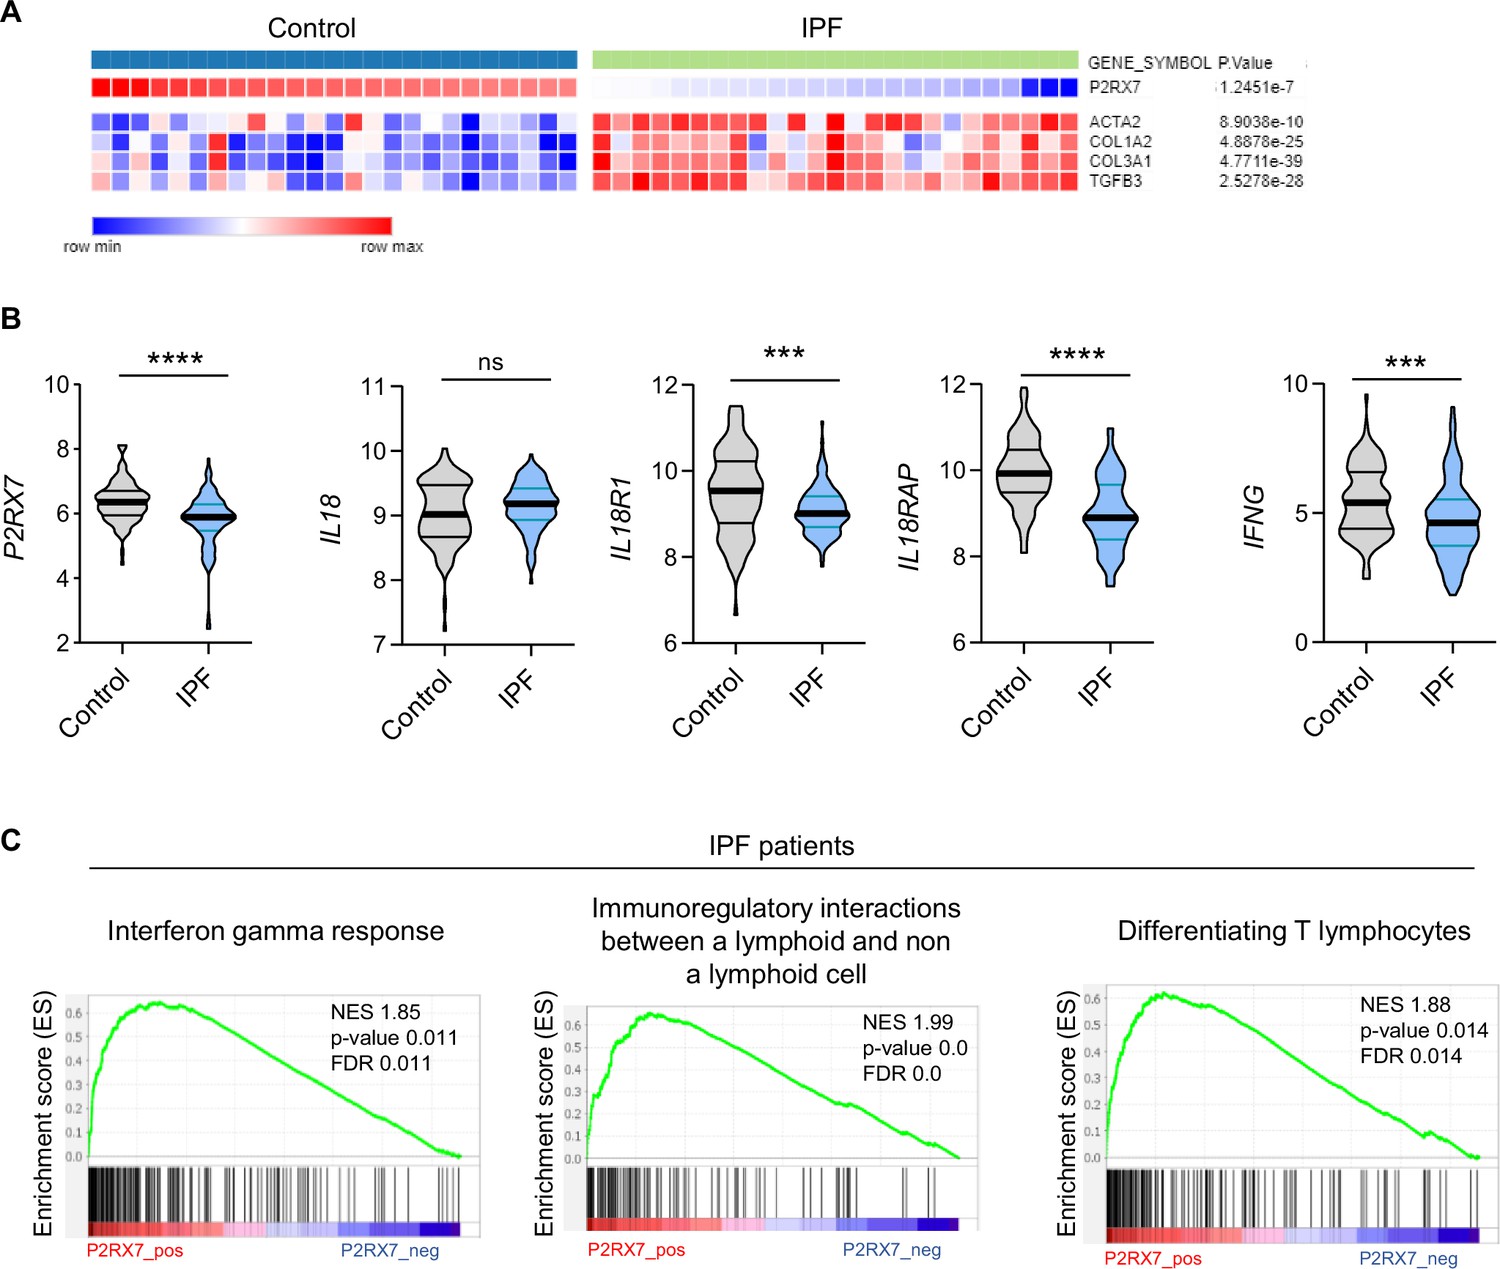
The P2RX7/IL-18/IFN-γ pathway is downregulated in idiopathic pulmonary fibrosis (IPF).
(A) Heatmap of mRNA expression of P2RX7 in control and IPF patients with a cluster of fibrosis-associated genes. Raw p-values are shown (Limma). p-values were determined by Spearman test. (B) mRNA expression of P2RX7, IL18, IL18R1, IL18RAP, and IFNG between control and IPF patients from 213 individuals, corresponding to 91 controls and 122 IPF patients. p-values were determined by two-tailed unpaired t-test or Mann–Whitney t-test. ***p < 0.001, ****p < 0.0001. (C) Gene set enrichment analysis (GSEA) plot associating P2RX7 mRNA levels from IPF patients with three immunological signatures. The green line represents the enrichment score and the black lines the specific signature-associated genes. NES: normalized enrichment score. p-values (bilateral Kolmogorov–Smirnov) and false discovery rate (FDR) are shown.
-
Figure 1—source data 1
Excel file containing output result of mRNA expression for the graph in Figure 1B.
- https://cdn.elifesciences.org/articles/88138/elife-88138-fig1-data1-v1.xlsx
Figure 1—figure supplement 1
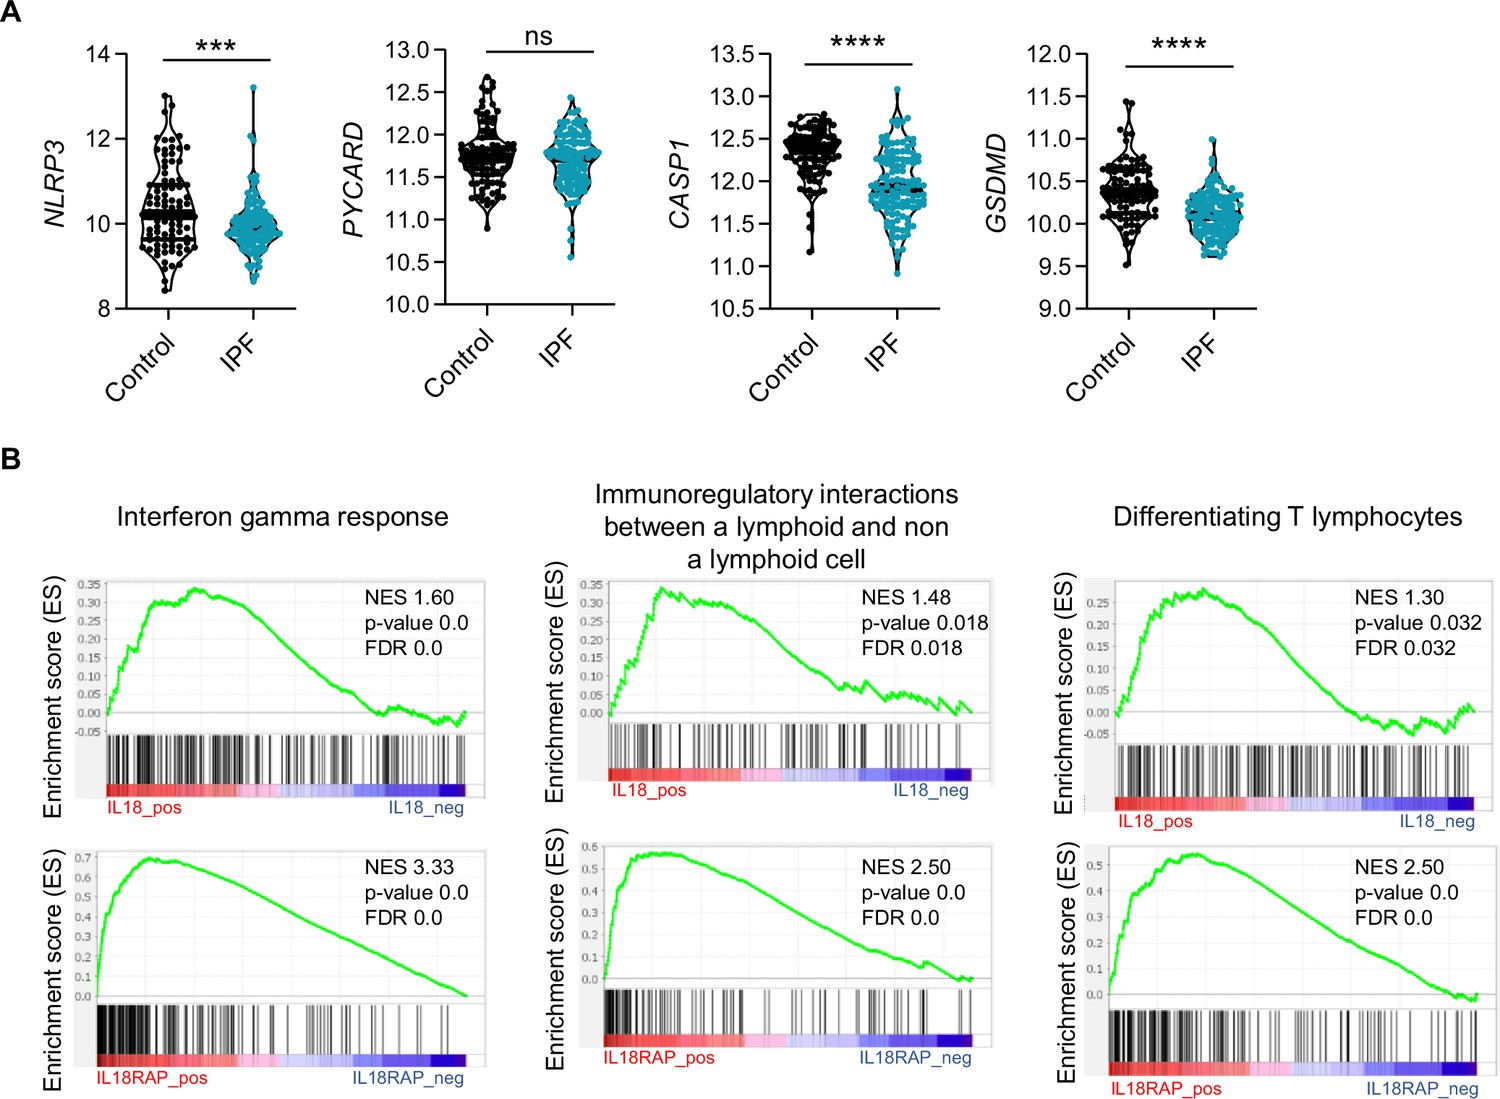
The components of the NLRP3 inflammasome are downregulated in idiopathic pulmonary fibrosis (IPF).
(A) mRNA expression of NLRP3, PYCARD, CASP1, and GSDMD between control and IPF patients from 213 individuals, corresponding to 91 controls and 122 IPF patients. p-values were determined by two-tailed unpaired t-test or Mann–Whitney t-test. ***p < 0.001, ****p < 0.0001. (B) Gene set enrichment analysis (GSEA) plot associating P2RX7 mRNA levels from IPF patients with three immunological signatures. The green line represents the enrichment score and the black lines the specific signature-associated genes. NES: normalized enrichment score. p-values (bilateral Kolmogorov–Smirnov) and false discovery rate (FDR) are shown.
-
Figure 1—figure supplement 1—source data 1
Excel file containing output result of mRNA expression for the graph in Figure 1—figure supplement 1A.
- https://cdn.elifesciences.org/articles/88138/elife-88138-fig1-figsupp1-data1-v1.xlsx
Figure 2 with 1 supplement
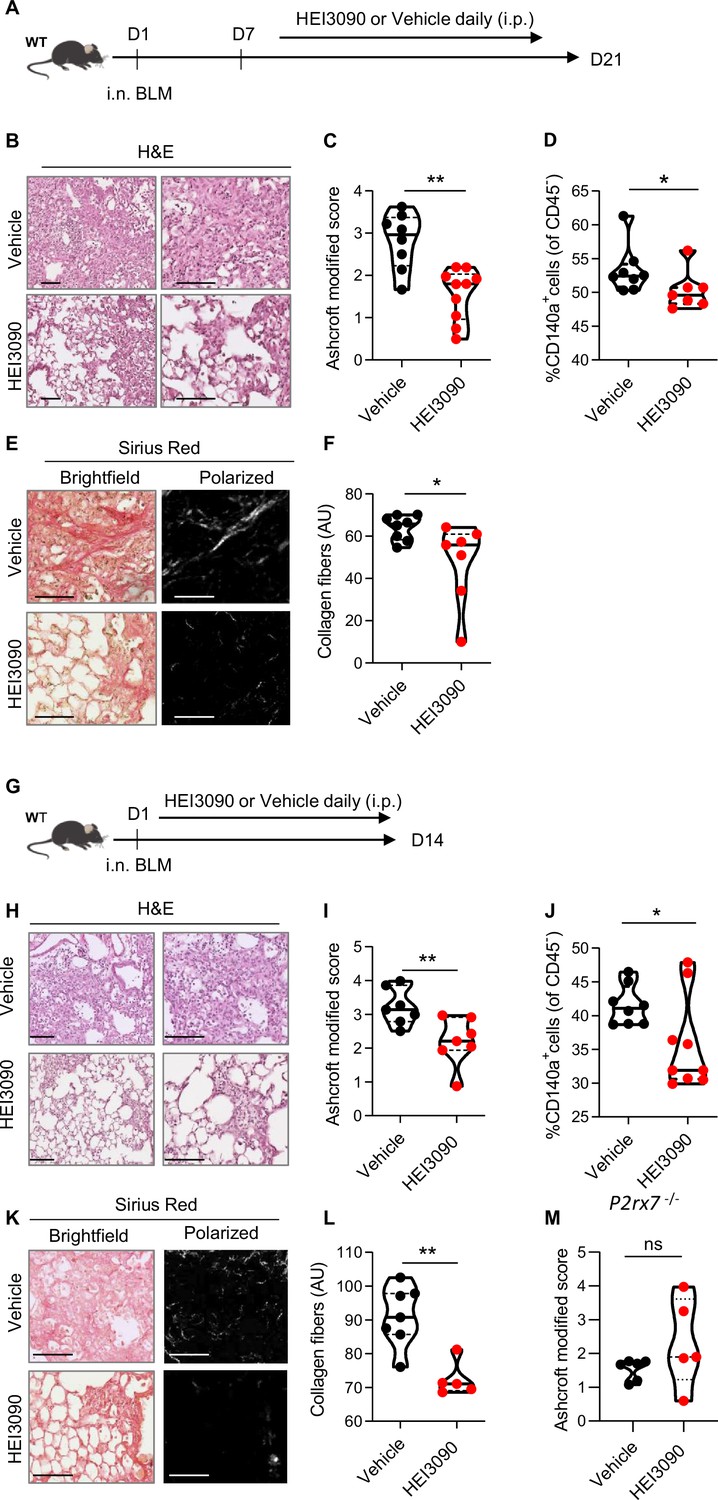
HEI3090 inhibits lung fibrosis progression.
(A) Experimental design. WT mice were given 2.5 U/kg of bleomycin by i.n. route. At the end of the inflammatory phase (D7), 1.5 mg/kg of HEI3090 or vehicle were given daily until day 21. (B) Representative images of lung sections at day 21 after treatment stained with H&E and Sirius Red, scale bar = 100 µm. (C) Fibrosis score assessed by the Ashcroft method. p-values were determined by two-tailed unpaired t-test. (D) Quantification of fibroblasts/myofibroblasts in non-immune cell subset. p-values were determined by two-tailed Mann–Whitney test. (E) Representative images of lung sections at day 21 after treatment stained with Sirius Red, scale bar = 100 µm. (F) Collagen levels in whole lung of mice assessed on Sirius Red-polarized images. p-values were determined by two-tailed unpaired t-test. (G) Experimental design. WT mice were given 2.5 U/kg of bleomycin by i.n. route. 1.5 mg/kg of HEI3090 or vehicle were given daily until day 14. (H) Representative images of lung sections at day 14 after treatment stained with H&E, scale bar = 100 µm. (I) Fibrosis score assessed by the Ashcroft method. p-values were determined by two-tailed unpaired t-test. (J) Quantification of fibroblasts/myofibroblasts in non-immune cell subset. p-values were determined by two-tailed Mann–Whitney test. (K) Representative images of lung sections at day 14 after treatment stained with Sirius Red, scale bar = 100 µm. (L) Collagen levels in whole lung of mice assessed on Sirius Red-polarized images. p-values were determined by two-tailed Mann–Whitney test. (M) P2rx7 KO mice were given 2.5 U/kg of bleomycin by i.n. route. 1.5 mg/kg of HEI3090 or vehicle were given daily until day 14. Fibrosis score assessed by the Ashcroft method is showed. p-values were determined by two-tailed Mann–Whitney test. For all analyses, the violin plot illustrates the distribution of Ashcroft scores across indicated groups. The width of the violin at each point represents the density of data, and the central line indicates the median expression level. Each point represents one biological replicate. *p < 0.05, **p < 0.01. WT: wildtype, BLM: bleomycin, i.p.: intraperitoneal, i.n.: intranasal, H&E: hematoxylin & eosin, AU: arbitrary units.
-
Figure 2—source data 1
Excel file containing output results of fibrosis analysis for the graph in Figure 2C, D, F, I, J, L, M.
- https://cdn.elifesciences.org/articles/88138/elife-88138-fig2-data1-v1.xlsx
Figure 2—figure supplement 1
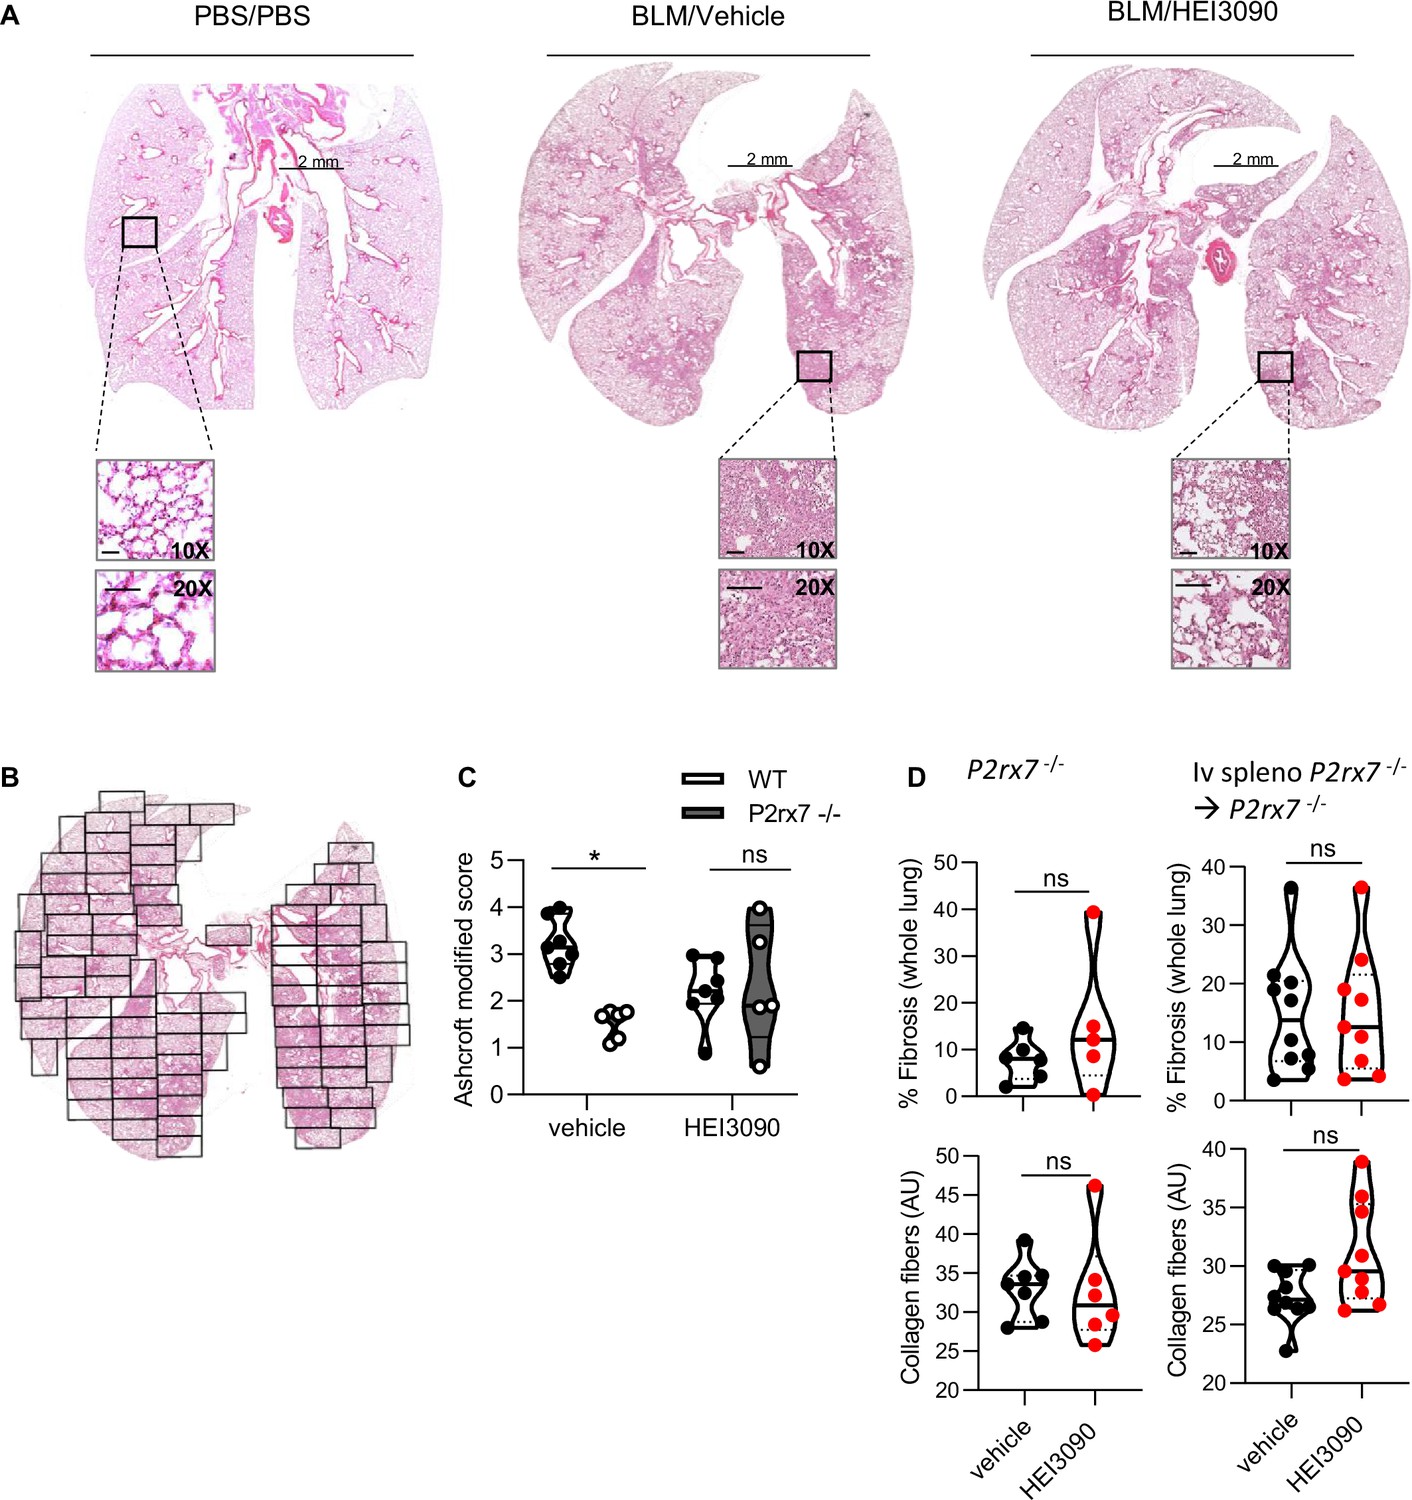
HEI3090 treatment limits lung fibrosis progression.
Wildtype (WT) mice were given phosphate-buffered saline (PBS) or 2.5 U/kg of bleomycin (BLM) by i.n. route. At the end of the inflammatory phase, 1.5 mg/kg of HEI3090 or vehicle were given daily until day 21. (A) Whole lung images at day 21 after treatment stained with H&E, scale bar at 10X and 20X = 100 µm. (B) Whole lungs were divided in their entirety in several fields as shown to evaluate fibrosis severity using the Ashcroft method. The fibrosis score is the mean of all fields. (C) BLM-inhaled WT and P2rx7 KO mice were treated or not with HEI3090. At D14, whole lungs were removed, fixed in formol, and stained with H&E and lung fibrosis was scored. p-values were determined by two-way analysis of variance (ANOVA) with Bonferroni’s multiple comparisons. (D) BLM-treated p2rx7−/− or p2rx7−/− adoptively transferred with p2rx7−/− splenocytes mice received HEI3090 for 14 days started at day 1. Whole lungs were removed, fixed and stained with Sirius Red. The percentage of fibrosis in whole lung (up panel) was quantified concomitantly with the collagen quantification (lower panel) as described in Materials and methods. p-values were determined by two-tailed unpaired t-test. For all figures, the violin plot illustrates the distribution of Ashcroft scores across or collagen fibers intensity of indicated groups. The width of the violin at each point represents the density of data, and the central line indicates the median expression level. Each point represents one biological replicate. *p < 0.05, ns, not significant.
-
Figure 2—figure supplement 1—source data 1
Excel file containing output results of fibrosis analysis for the graph in Figure 2—figure supplement 1C, D.
- https://cdn.elifesciences.org/articles/88138/elife-88138-fig2-figsupp1-data1-v1.xlsx
Figure 3 with 2 supplements
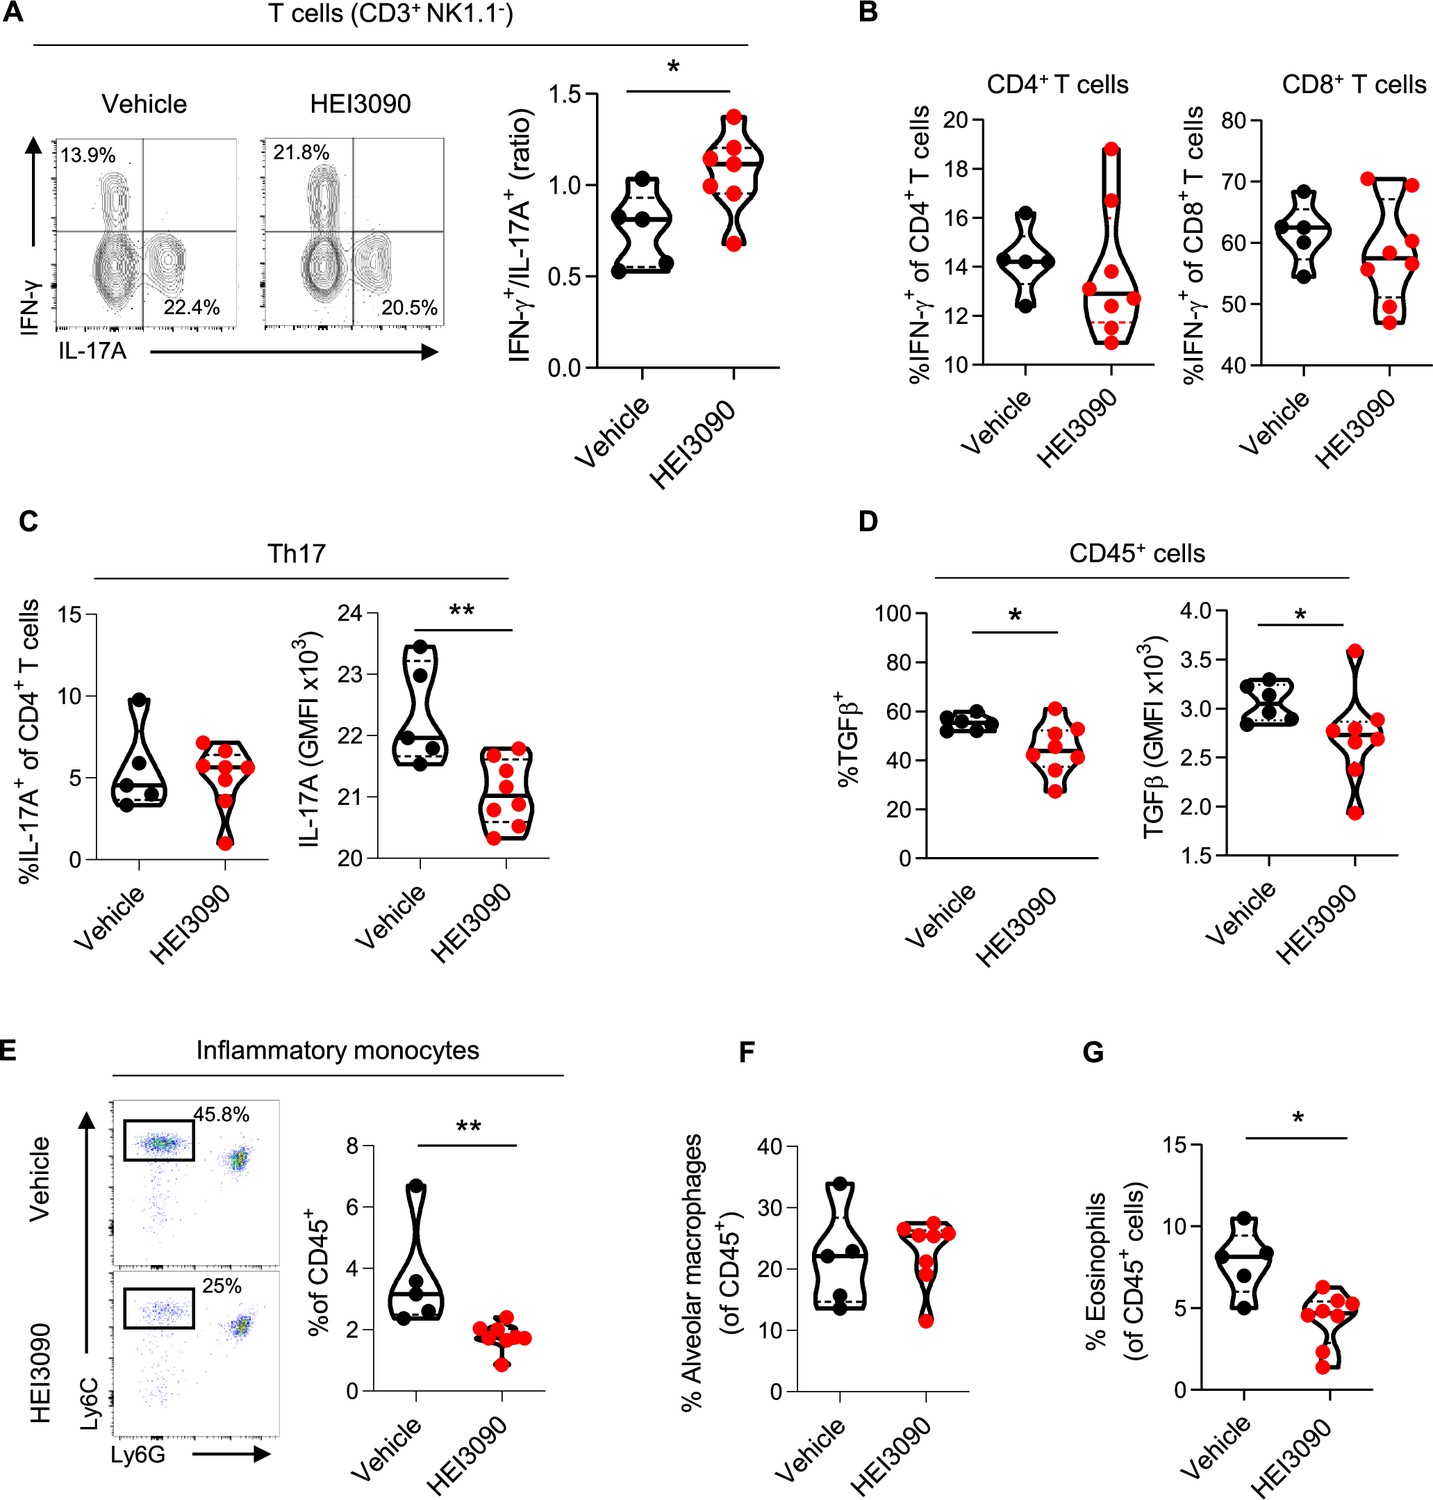
HEI3090 favors an antifibrotic immune signature in the lungs.
Wildtype (WT) mice were given 2.5 U/kg of bleomycin by i.n. route and treated daily i.p. with 1.5 mg/kg of HEI3090 or Vehicle. Lungs were analyzed by flow cytometry at day 14. (A) Contour plot of IFN-γ- and IL-17A-producing T cells (CD3+NK1.1−) (left) and ratio of IFN-γ over IL-17A in T cells (CD3+NK1.1−) (right). p-values were determined by two-tailed Mann–Whitney test. (B) Percentage of IFN-γ-producing CD4+ and CD8+ T cells. p-values were determined by two-tailed Mann–Whitney test. (C) Percentage and GMFI of IL-17A+ cells of CD4+ T cells (CD3+CD4+NK1.1−). p-values were determined by two-tailed Mann–Whitney test. (D) Percentage and GMFI of TGFβ in CD45+ cells. p-values were determined by two-tailed Mann–Whitney test. (E) Dotplot showing lung inflammatory monocytes, gated on lineage−CD11c−CD11b+ cells (left) and percentage of lung inflammatory monocytes (Ly6ChighLy6G−) (right). p-values were determined by two-tailed Mann–Whitney test. (F) Percentage of alveolar macrophages (CD11c+SiglecF+), p-values were determined by two-tailed unpaired t-test and (G) lung eosinophils (CD11b+SiglecF+CD11c−), p-values were determined by two-tailed Mann–Whitney test. (A–G) The violin plot illustrates the distribution of Ashcroft scores across indicated groups. The width of the violin at each point represents the density of data, and the central line indicates the median expression level. Each point represents one biological replicate. *p < 0.05, **p < 0.01. GMFI: geometric mean fluorescence intensity, i.n.: intranasal, i.p.: intraperitoneal.
-
Figure 3—source data 1
Excel file containing output results of FACS analysis for the graph in Figure 3A–D, F, G.
- https://cdn.elifesciences.org/articles/88138/elife-88138-fig3-data1-v1.xlsx
Figure 3—figure supplement 1
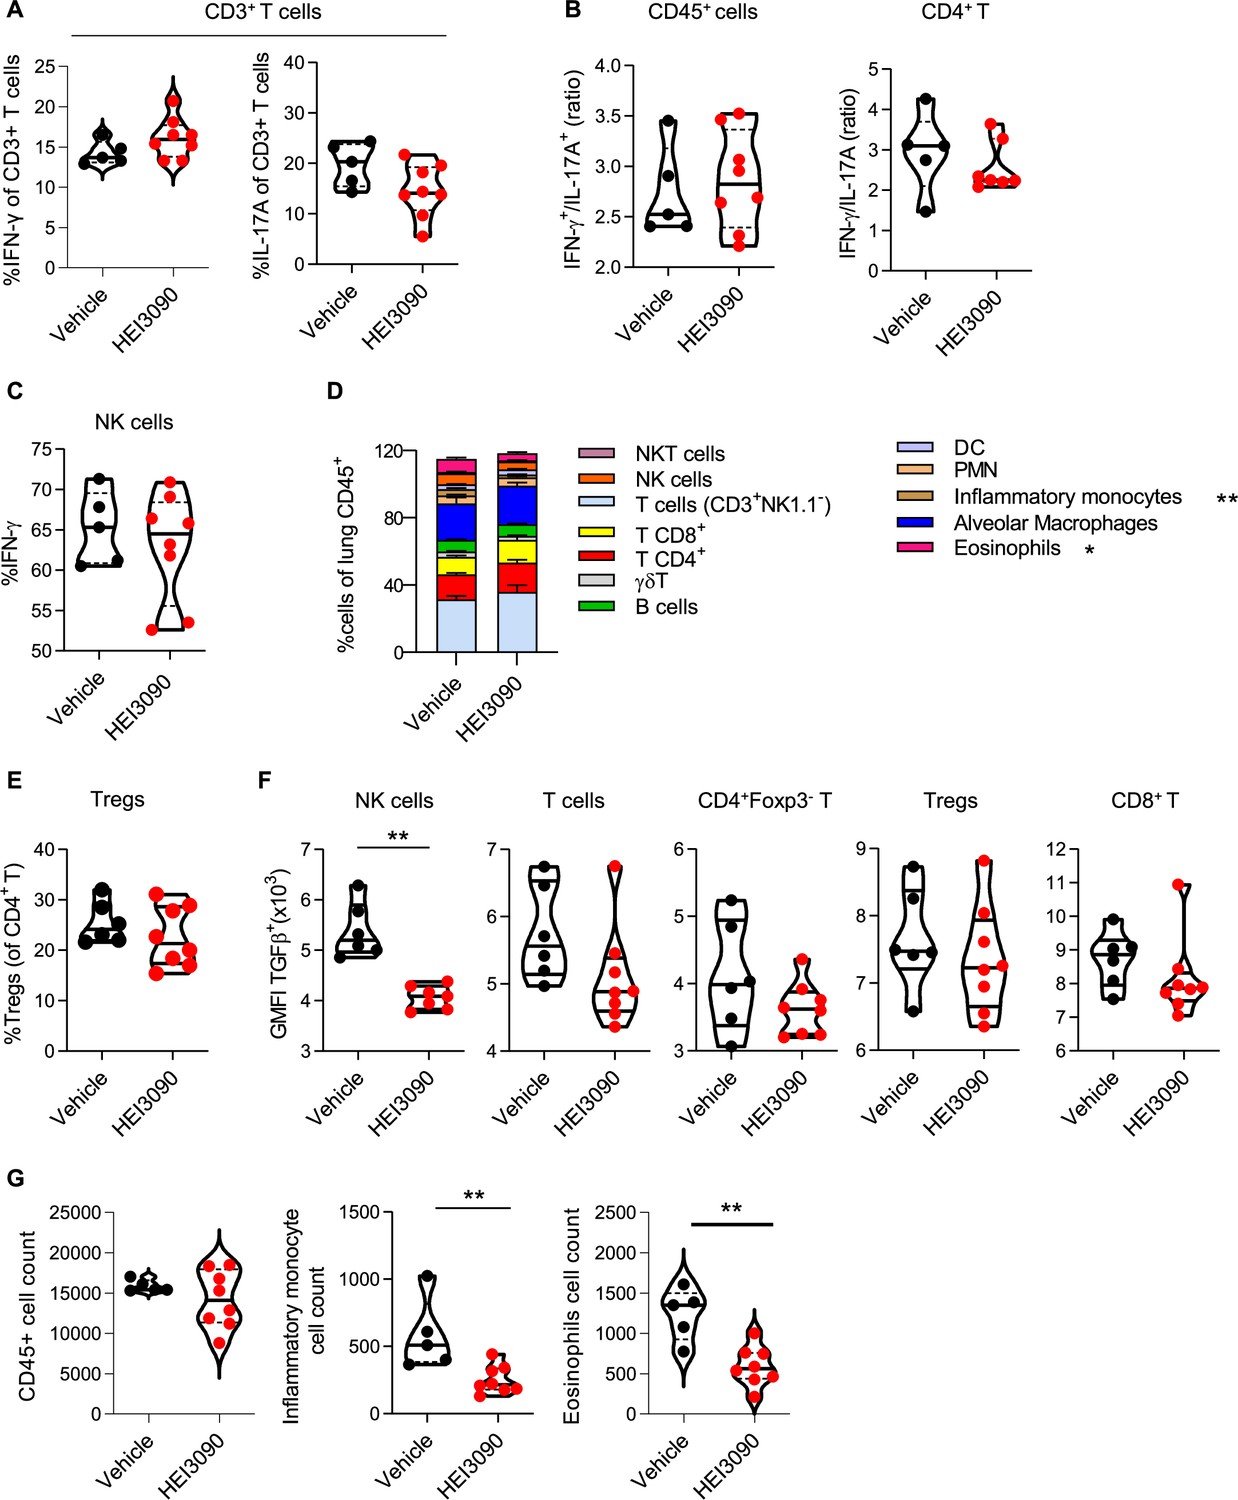
Activation of P2RX7 with HEI3090 reshapes immune infiltration in the lungs.
Wildtype (WT) mice were given 2.5 U/kg at day 1 i.n. and treated for 14 days with 1.5 mg/kg of HEI3090 or Vehicle. At day 14 lungs were analyzed by flow cytometry. (A) Percentage of IFN-γ producing and IL17A of TCD3 cells (CD45+CD3+). p-values were determined by two-tailed unpaired t-test. (B) Ratio of IFN-γ over IL-17A in lung immune cells (CD45+) or CD4+ T cells of WT mice. p-values were determined by two-tailed unpaired t-test. (C) Percentage of IFN-γ-producing NK cells (NK1.1+CD3−). p-values were determined by two-tailed unpaired t-test. (D) Percentage of cells in lungs of mice. p-values were determined by two-way analysis of variance (ANOVA) with Tukey multiple comparisons test. Colored bars (mean + standard error of the mean [SEM]) illustrate indicated cell populations. (E) Percentage of Tregs (CD3+CD4+Foxp3+NK1.1−) of CD4+T cells. p-values were determined by two-tailed unpaired t-test (F) GMFI of TGFβ + NK cells, p-values were determined by two-tailed unpaired t-test (G) CD45+, inflammatory monocytes and eosinophils cell count assessed by flow cytometry. p-values were determined by two-tailed Mann–Whitney test. The violin plot illustrates the distribution of Ashcroft scores across indicated groups. The width of the violin at each point represents the density of data, and the central line indicates the median expression level. Each point represents one biological replicate. *p < 0.05, **p < 0.01. GMFI: geometric mean fluorescence intensity, Tregs: regulatory T cells, NK: natural killer, NKT: natural killer T cells, DC: dendritic cells, PMN: polymorphonuclear cells.
-
Figure 3—figure supplement 1—source data 1
Excel file containing output results of FACS analysis for the graph in Figure 3—figure supplement 1A–G.
Italic values correspond to excluded data due to staining problems.
- https://cdn.elifesciences.org/articles/88138/elife-88138-fig3-figsupp1-data1-v1.xlsx
Figure 3—figure supplement 2
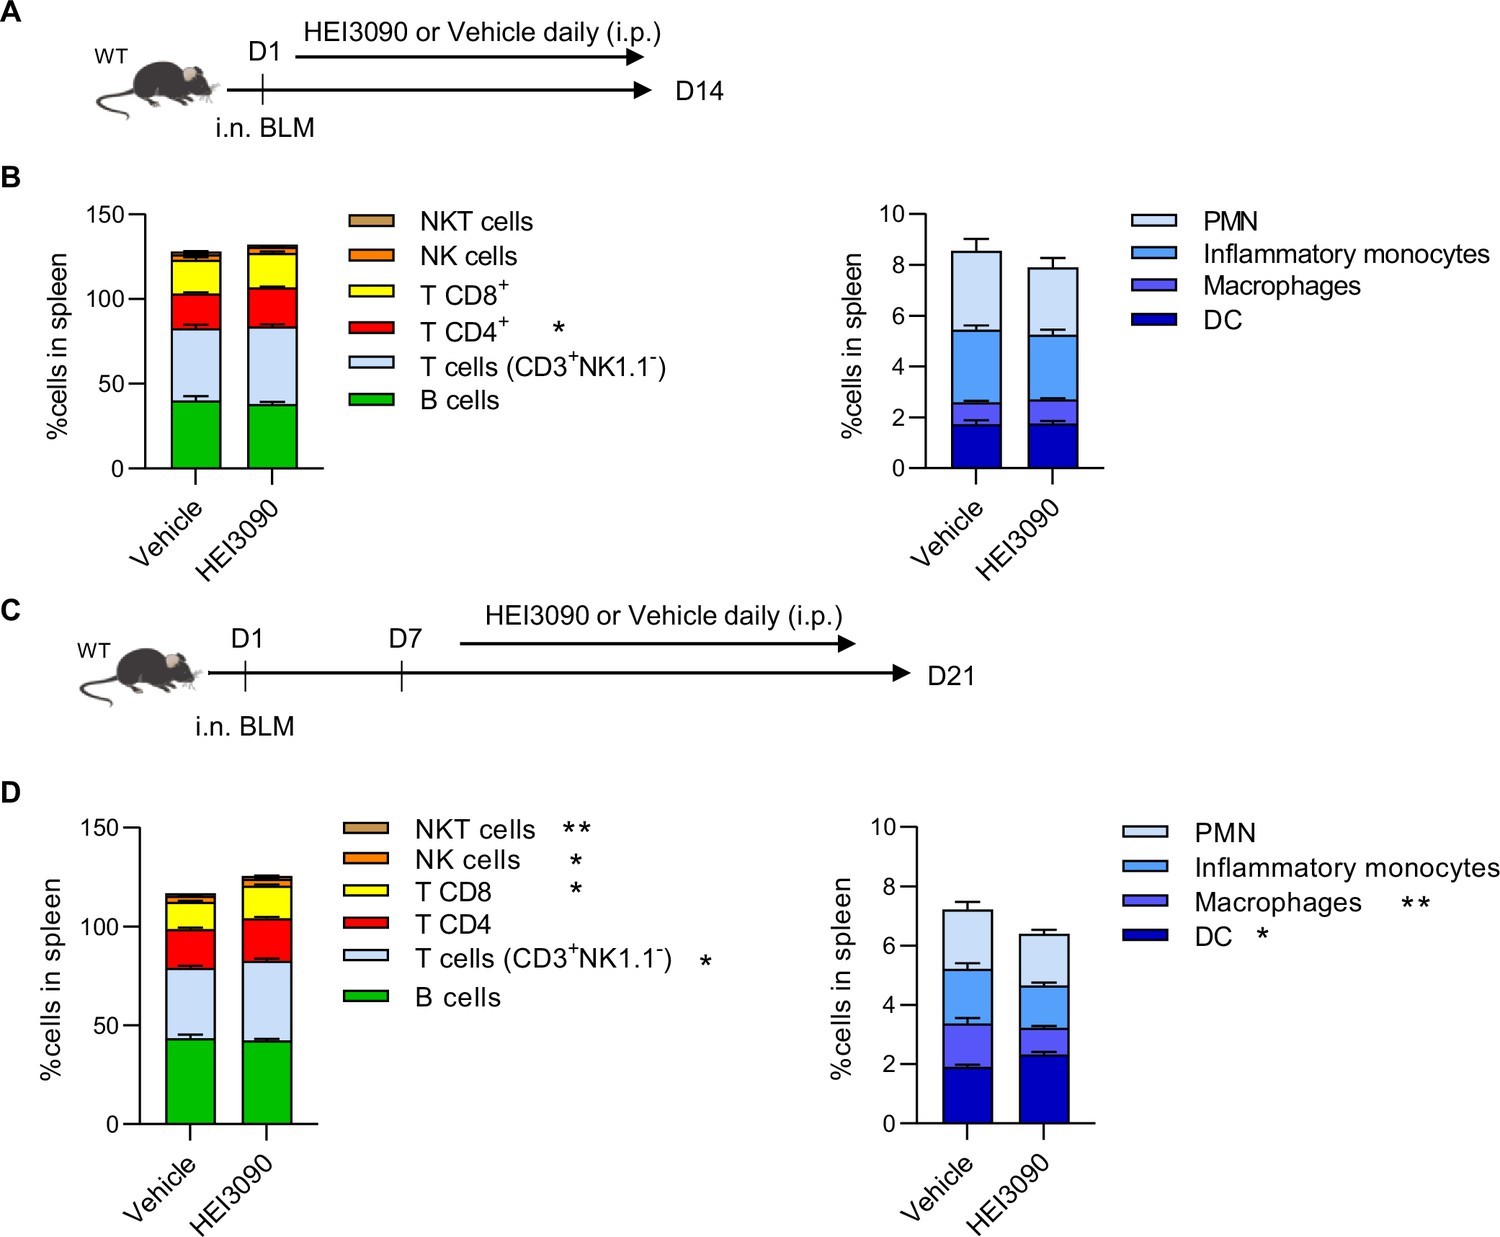
HEI3090 reactivates an immune response.
(A) Experimental design. WT mice were given 2.5 U/kg at day 1 i.n. and treated for 14 days with 1.5 mg/kg of HEI3090 or Vehicle. (B) Percentage of immune cells of CD45+ in spleen assessed by flow cytometry at day 14. Percentage of cells in lungs of mice. p-values were determined by two-way analysis of variance (ANOVA) with Tukey multiple comparisons test. Colored bars (mean + standard error of the mean [SEM]) illustrate indicated cell populations. (C) WT mice were given 2.5 U/kg of bleomycin by i.n. route. 1.5 mg/kg of HEI3090 or vehicle were given daily 7 days after BLM administration until day 21. (D) Percentage of immune cells of CD45+ in spleen assessed by flow cytometry at day 21. Percentage of cells in lungs of mice. p-values were determined two-way ANOVA with Tukey multiple comparisons test. Colored bars (mean + SEM) illustrate indicated cell populations. Vehicle n = 13, HEI3090 n = 14. *p < 0.05, **p < 0.01. WT: wildtype, BLM: bleomycin, i.p.: intraperitoneal, i.n.: intranasal, NK: natural killer, NKT: natural killer T cells, DC: dendritic cells, PMN: polymorphonuclear cells.
-
Figure 3—figure supplement 2—source data 1
Excel file containing output results of FACS analysis for the graph in Figure 3—figure supplement 2B, D.
Italic values correspond to excluded data due to staining problems.
- https://cdn.elifesciences.org/articles/88138/elife-88138-fig3-figsupp2-data1-v1.xlsx
Figure 4 with 3 supplements
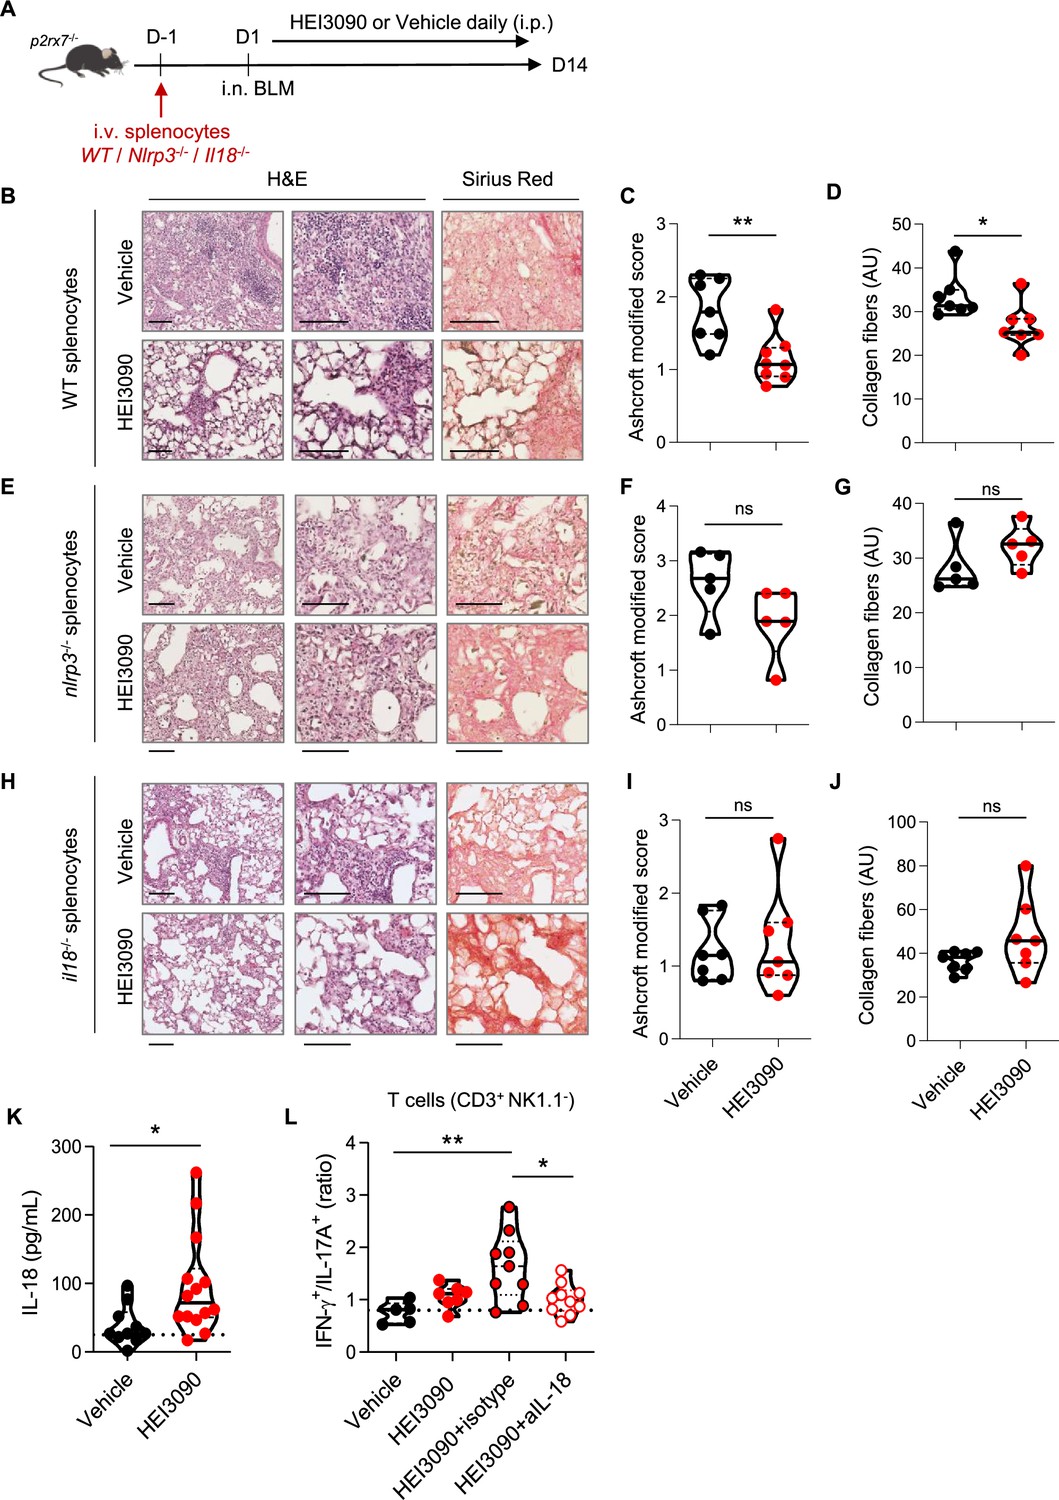
The P2RX7/NLRP3/IL-18 pathway in immune cells is required for HEI3090’s antifibrotic effect.
(A) Experimental design. P2rx7−/− mice were given 3.106 WT, Nlrp3−/−, or Il18−/− splenocytes i.v. 1 day prior to BLM delivery (i.n. 2.5 U/kg). Mice were treated daily i.p. with 1.5 mg/kg HEI3090 or vehicle for 14 days. (B, E, H) Representative images of lung sections at day 14 after treatment stained with H&E and Sirius Red, scale bar = 100 µm. (C, F, I), Fibrosis score assessed by the Ashcroft method and (D, G, J) collagen fiber intensity. (C) WT splenocytes, p-values were determined by two-tailed Mann–Whitney test. (D) WT splenocytes, p-values were determined by two-tailed unpaired t-test. (F, G) Nlrp3−/− splenocytes, p-values were determined by two-tailed Mann–Whitney test. (I, J) Il18−/− splenocytes, p-values were determined by two-tailed Mann–Whitney test. (K) IL-18 levels in sera of WT BLM-induced mice at day 14. p-values were determined by two-tailed unpaired t-test. (L) Ratio of IFN-γ over IL-17A in lung T cells (CD3+NK1.1−) of WT mice neutralized for IL-18 or not (isotype control) every 3 days. p-values were determined by one-way analysis of variance (ANOVA) with Tukey’s multiple comparisons test. For all analyses, the violin plot illustrates the distribution of Ashcroft scores across indicated groups. The width of the violin at each point represents the density of data, and the central line indicates the median expression level. Each point represents one biological replicate. *p < 0.05, **p < 0.01. WT: wildtype, BLM: bleomycin, i.p.: intraperitoneal, i.n.: intranasal, i.v.: intravenous, H&E: hematoxylin & eosin.
-
Figure 4—source data 1
Excel file containing output results of analysis for the graph in Figure 4B, D, F, G, I–L.
- https://cdn.elifesciences.org/articles/88138/elife-88138-fig4-data1-v1.xlsx
Figure 4—figure supplement 1
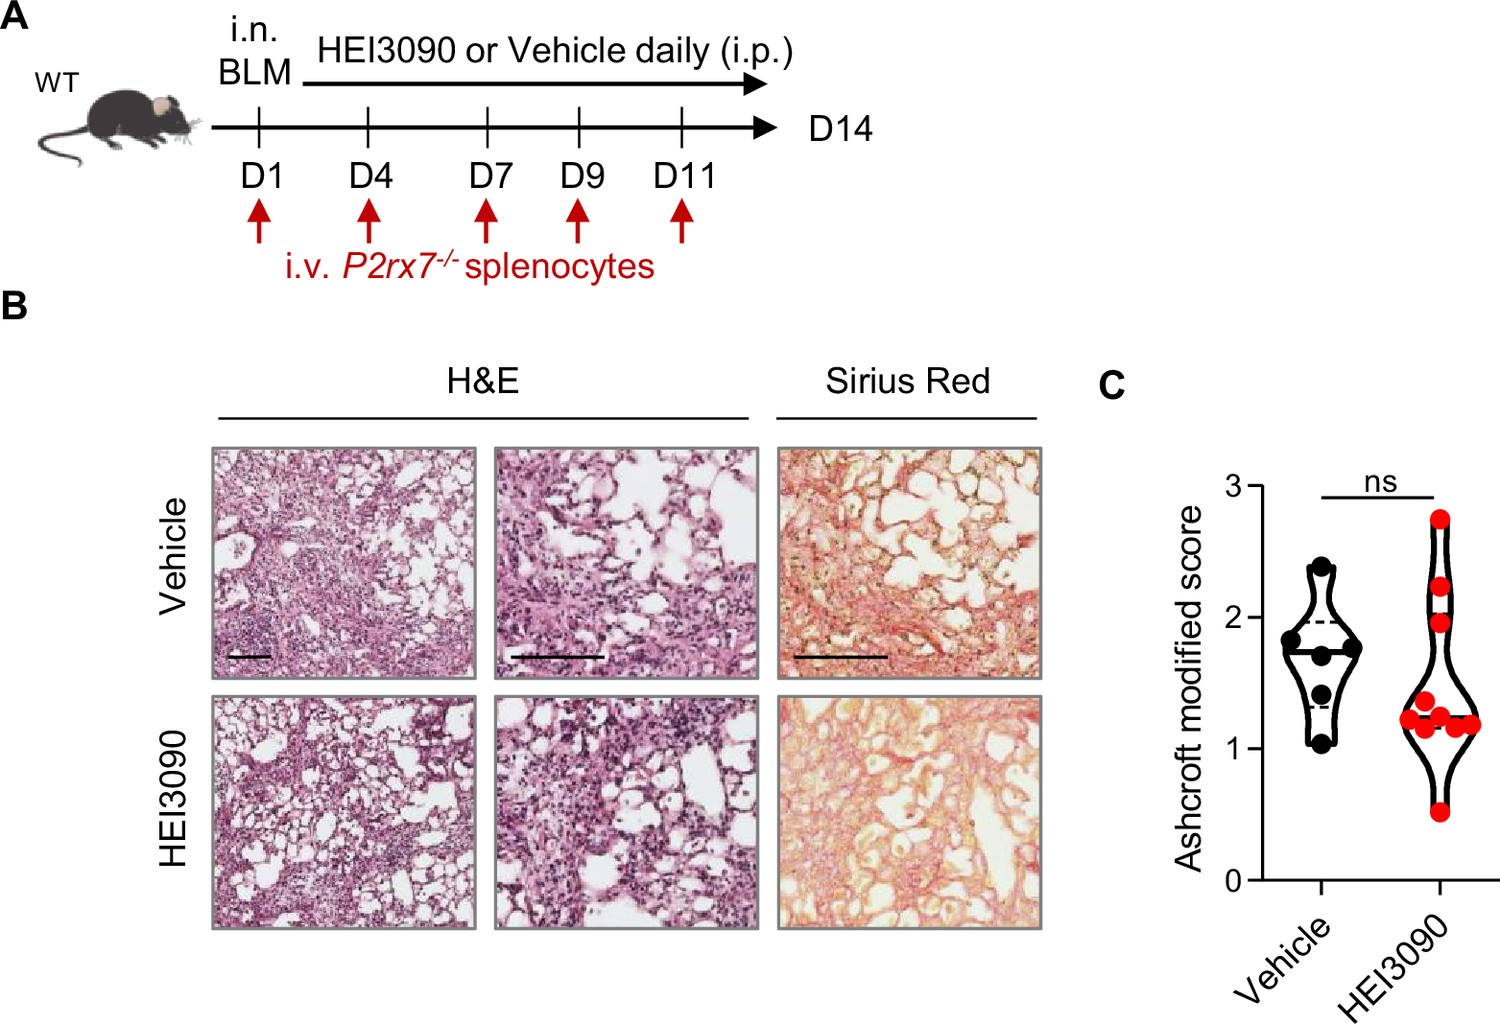
HEI3090 activity requires P2RX7’s expressing immune cells.
(A) Experimental design. Wildtype (WT) mice were given 2.5 U/kg of bleomycin by i.n. route and treated daily i.p. with 1.5 mg/kg of HEI3090 or Vehicle. Mice were given i.v. 3.106 P2rx7−/− splenocytes from male age-matched mice at days 1,4,7,9, and 11. (B) Representative images of lung sections at day 14 after treatment stained with H&E and Sirius Red, scale bar = 100 µm. (C) Fibrosis score assessed by the Ashcroft method. p-values were determined by two-tailed unpaired t-test. The violin plot illustrates the distribution of Ashcroft scores across indicated groups. The width of the violin at each point represents the density of data, and the central line indicates the median expression level. Each point represents one biological replicate. ns, not significant.
-
Figure 4—figure supplement 1—source data 1
Excel file containing output results of Ashcroft score analysis for the graph in Figure 4—figure supplement 1C.
- https://cdn.elifesciences.org/articles/88138/elife-88138-fig4-figsupp1-data1-v1.xlsx
Figure 4—figure supplement 2
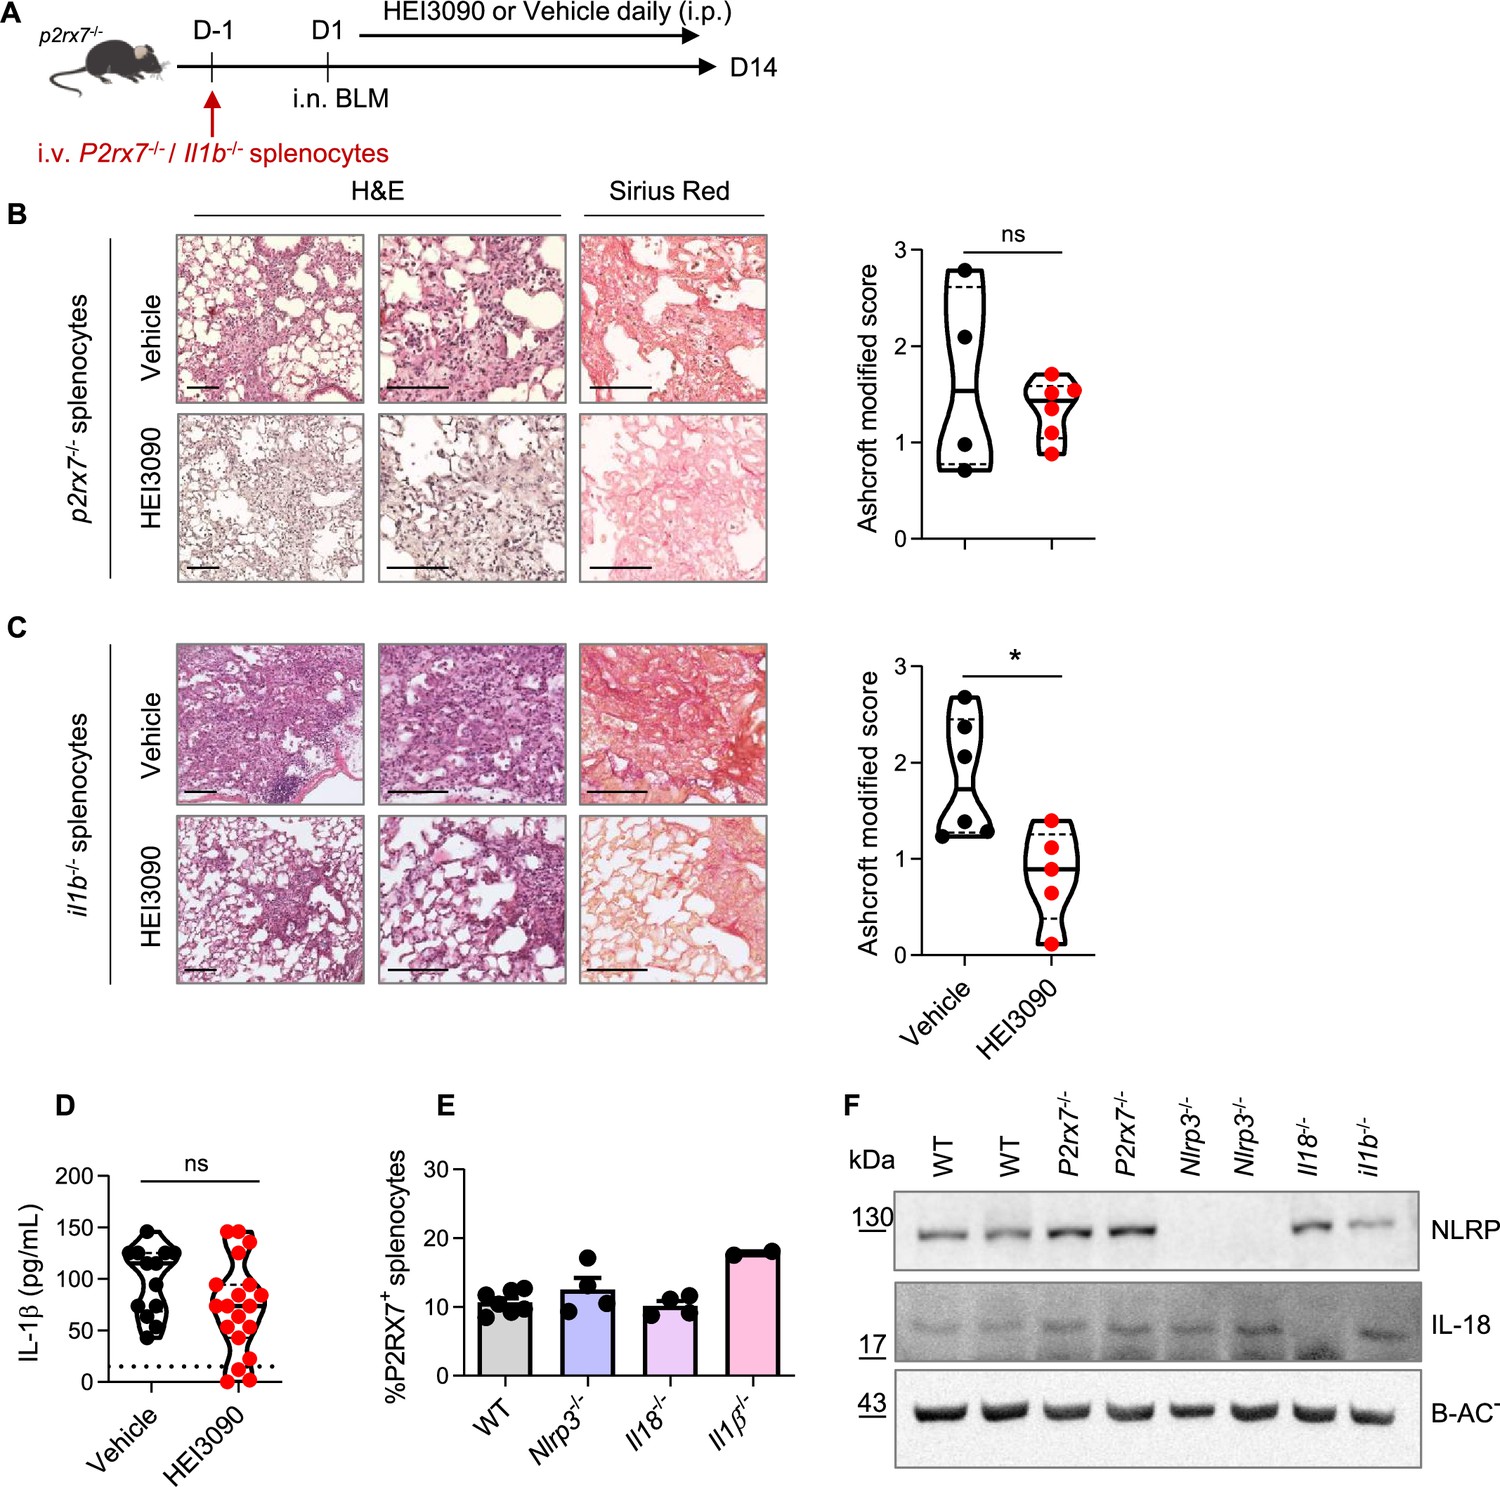
The antifibrotic effect of HEI3090 is independent of IL1B expression.
(A) Experimental design. P2rx7−/− mice were given 3.106 P2rx7−/− or Il1β−/− splenocytes i.v. 1 day prior to BLM delivery (i.n. 2.5 U/kg). Mice were treated daily i.p. with 1.5 mg/kg HEI3090 or vehicle for 14 days. (B) Representative images of lung sections at day 14 after treatment stained with H&E and Sirius Red with P2rx7−/− splenocytes, scale bar = 100 µm (left) and fibrosis score assessed by the Ashcroft method (right). p-values were determined by two-tailed unpaired t-test. (C) Representative images of lung sections at day 14 after treatment stained with H&E and Sirius Red with Il1β−/− splenocytes, bar = 100 µm (left) and fibrosis score assessed by the Ashcroft method (right). p-values were determined by two-tailed unpaired t-test. (D) IL-1β levels in sera of WT mice at day 14 after treatment. p-values were determined by two-tailed unpaired t-test. (E) Percentage of P2RX7+ cells in spleens of WT and various KO mice assessed by flow cytometry. p-values were determined by one-way ANOVO, with Kruskal–Wallis test for multiple comparisons. Bar mean with standard error of the mean (SEM) is showed. (F) NLRP3 and IL-18 expression in spleens of WT and various KO mice assessed by Western blot. The violin plot illustrates the distribution of Ashcroft scores across indicated groups. The width of the violin at each point represents the density of data, and the central line indicates the median expression level. In all figures, each point represents one biological replicate. *p < 0.05. WT: wildtype, BLM: bleomycin, i.p.: intraperitoneal, i.n.: intranasal, i.v.: intravenous, H&E: hematoxylin & eosin, KO: knock-out.
-
Figure 4—figure supplement 2—source data 1
Excel file containing output results analysis for the graph in Figure 4—figure supplement 2B–E.
- https://cdn.elifesciences.org/articles/88138/elife-88138-fig4-figsupp2-data1-v1.xlsx
-
Figure 4—figure supplement 2—source data 2
Original file for the Western blot analysis in Figure 4—figure supplement 2F (anti-ACTB).
- https://cdn.elifesciences.org/articles/88138/elife-88138-fig4-figsupp2-data2-v1.zip
-
Figure 4—figure supplement 2—source data 3
Original file for the Western blot analysis in Figure 4—figure supplement 2F (anti-IL-18).
- https://cdn.elifesciences.org/articles/88138/elife-88138-fig4-figsupp2-data3-v1.zip
-
Figure 4—figure supplement 2—source data 4
Original file for the Western blot analysis in Figure 4—figure supplement 2F (anti-NLRP3).
- https://cdn.elifesciences.org/articles/88138/elife-88138-fig4-figsupp2-data4-v1.zip
-
Figure 4—figure supplement 2—source data 5
PDF containing Figure 4—figure supplement 2F and original scans of the relevant Western blot analysis (anti-NLRP3, anti-IL-18, and anti-ACTB) with highlighted bands and sample labels.
- https://cdn.elifesciences.org/articles/88138/elife-88138-fig4-figsupp2-data5-v1.pdf
Figure 4—figure supplement 3

The genetic background does not impact lung fibrosis at steady step levels.
P2rx7−/− mice were given 3.106 wildtype (WT), Nlrp3−/−, Il18−/− , or Il1b−/− splenocytes i.v. 1 day prior to bleomycin (BLM) delivery (i.n. 2.5 U/kg). P2rx7−/− mice or P2rx7−/− mice adoptively transferred with splenocytes from indicated genetic background were treated daily i.p. with 1.5 mg/kg HEI3090 or vehicle for 14 days. Fibrosis score assessed by the Ashcroft method. p-values were analyzed on all treated and non-treated groups by one-way analysis of variance (ANOVA), with Kruskal–Wallis test for multiple comparisons. The violin plot illustrates the distribution of Ashcroft scores across indicated experimental groups. The width of the violin at each point represents the density of data, and the central line indicates the median expression level. Each point represents one biological replicate. ns, not significant.
-
Figure 4—figure supplement 3—source data 1
Excel file containing output results of Ashcroft score analysis for the graph in Figure 4—figure supplement 3.
- https://cdn.elifesciences.org/articles/88138/elife-88138-fig4-figsupp3-data1-v1.xlsx
Author response image 1

Supplemental Figure 7 : The genetic background does not impact lung fibrosis at steady step levels.
p2rx7-/- mice were given 3.106 WT, nlrp3-/ , i118-/ or illb -l- splenocytes i_v_ one day prior to BLM delivery (i_n_ 2.5 LJ/kg)_ p2rx7-/- mice or p2rx7-/- mice adoptively transferred with splenocytes from indicated genetic background were treated daily i.p_ with mg/kg HE13090 or vehicle for 14 days. Fibrosis score assessed by the Ashcroft method. P-values were analyzed on all treated and non treated groups by one-way ANOVA, with Kruskal-Wallis test for multiple comparisons. The violin plot illustrates the distribution of Ashcroft scores across indicated experimental groups. The width of the violin at each point represents the density of data, and the central line indicates the median expression level. Each point represents one biological replicate. ns, not significant
Tables
Key resources table
| Reagent type (species) or resource | Designation | Source or reference | Identifiers | Additional information |
|---|---|---|---|---|
| Strain, strain background (Mus musculus) | C57BL/6 OlaHsD | Envigo | WT mouse, male | |
| Strain, strain background (Mus musculus) | P2rx7−/− | Jackson Laboratory | B6.129P2-P2rx7tm1Gab/J | Transgenic mouse, male |
| Antibody | anti-CD16/CD32 (Mouse monoclonal) | BD Bioscience | Clone 2.4G2, #553142 | FACS (1/100) |
| Antibody | anti-CD3A (Mouse monoclonal) | BD Bioscience | Clone 145-2611 #551163 | FACS (1/100) PerCP-Cy5.5 |
| Antibody | Anti NK1.1 (Mouse monoclonal) | BD Bioscience | Clone PK136 #562864 | FACS (1/100) PE-CF594 |
| Antibody | CD11c (Mouse monoclonal) | BD Bioscience | Clone HL3 #558079 | FACS (1/100) PE-Cy7 |
| Antibody | Ly6G (Mouse monoclonal) | BD Bioscience | Clone 1A8 #561236 | FACS (1/100) AF700 |
| Antibody | Ly6C (Mouse monoclonal) | BD Bioscience | Clone AL-21 #560594 | FACS (1/100) V450 |
| Antibody | SiglecF (Mouse monoclonal) | BD Bioscience | Clone E50-2440 #740388 | FACS (1/50) BV605 |
| Antibody | CD4 (Mouse monoclonal) | BD Bioscience | Clone RM4-5 #563726 | FACS (1/100) BV711 |
| Antibody | CD8α (Mouse monoclonal) | BD Bioscience | Clone 53-6.7 #100741 | FACS (1/100) BV650 |
| Antibody | CD45.2 (Mouse monoclonal) | BD Bioscience | Clone 104 #563686 | FACS (1/100) BV786 |
| Antibody | CD45 (Mouse monoclonal) | BD Bioscience | Clone 30-F11 #564279 | FACS (1/100) BUV395 |
| Antibody | γδ TCR (Mouse monoclonal) | BD Bioscience | Clone GL3 #553178 | FACS (1/100) PE |
| Antibody | IFN-γ (Mouse monoclonal) | BD Bioscience | Clone XMG1.2 #554413 | FACS (1/100) APC |
| Antibody | IL-17A (Mouse monoclonal) | BD Bioscience | Clone TC11-18H10 #561718 | FACS (1/100) AF700 |
| Antibody | I-A/I-E (Mouse monoclonal) | Biolegend | Clone M5/114.15.2 #107651 | FACS (1/100) APCfire750 |
| Antibody | CD64 (Mouse monoclonal) | Biolegend | Clone X54-5/7.1 #139303 | FACS (1/20) PE |
| Antibody | P2RX7 (Mouse monoclonal) | Biolegend | Clone 1F11 #148706 | FACS (1/8) PE |
| Antibody | CD140a (Mouse monoclonal) | Biolegend | Clone APA5 #135905 | FACS (1/100) PE |
| Antibody | CD11b (Mouse monoclonal) | eBiosciences | Clone M1/70 #17-0112-82 | FACS (1/400) APC |
| Antibody | Foxp3 (Mouse monoclonal) | eBiosciences | Clone FJK16S #12-5773-82 | FACS (1/100) PE |
| Antibody | NLRP3 (Mouse monoclonal) | Adipogen | Clone Cryo-2 # AG-20B-0014 | WB (1/1000) |
| Antibody | ACTIN BETA (Mouse monoclonal) | Bio-Rad | #VMA00048 | WB (1/60000) |
| Antibody | IL-18 (Rabbit Polyclonal) | Biovision | #5180R-100 | WB (1/250) |
| Antibody | IL-18 (Mouse monoclonal) | BioXcell | Clone YIGIF74-1G7 #BE0237 | Neutralizing antibody (200 uµg per injection) |
| Commercial assay | Mouse IL-1 beta/IL-1F2 | R&D | #DY401 | ELISA |
| Commercial assay | Mouse IL-18 | MBL | #7625 | ELISA |
| Software | Prism8 | https://www.graphpad.com RRID:SCR_002797 | ||
| Software | FlowJo v10 | https://www.flowjo.com RRID:SCR_008520 | ||
| Software | ImageJ 2.1.0 | https://imageJ.net/ImageJ RRID:SCE_002285 | ||
| Chemical compound | Bleomycin Sulfate | Sigma-Aldrich | #B5507 | (2.5 U/kg) |
| Chemical compound | Ketamine | VIRBAC | Anesthesia (25 mg/kg) | |
| Chemical compound | Xylasine | Dechra | Sedaxylan | Anesthesia (2.5 mg/k) |
| Chemical compound | Phorbol 12- myristate 13-acetate | Sigma-Aldrich | # P1585 | 50 ng/ml |
| Chemical compound | Ionomycin | Sigma-Aldrich | # IO634 | 0.5 µg/ml |
| Commercial kit | Golgi Plug | BD Biosciences | # 555028 | 1 µl/ml |
| Commercial kit | Cytofix/Cytoperm | BD Biosciences | # 554722 | |
| Commercial kit | ACK lysis buffer | Gibco | A1049201 | |
| Other | Live Dead | Invitrogen | # L23102 | Use to stain dead cells |
| Commercial kit | Lung dissociation kit | Miltenyi Biotech | #130-095-927 | |
| Commercial kit | Spleen dissociation kit | Miltenyi Biotech | #130-095-928 | |
| Other | HEI3090 | PAM of P2RX7, Douguet et al., 2021 | ||
| Other | H&E staining | Abcam | #ab245880 | Used for histology |
| Other | Picro Sirius Red | Abcam | # ab150681 | Used for histology |
Additional files
Download links
A two-part list of links to download the article, or parts of the article, in various formats.
Downloads (link to download the article as PDF)
Open citations (links to open the citations from this article in various online reference manager services)
Cite this article (links to download the citations from this article in formats compatible with various reference manager tools)
Activation of the P2RX7/IL-18 pathway in immune cells attenuates lung fibrosis
eLife 12:RP88138.
https://doi.org/10.7554/eLife.88138.4


