Comparative interactome analysis of α-arrestin families in human and Drosophila
- Department of Life Science, College of Natural Sciences, Hanyang University, Republic of Korea
- Hanyang Institute of Advanced BioConvergence, Hanyang University, Republic of Korea
- Department of Biochemistry, University of Washington, United States
- Department of Molecular Medicine, Cell and Matrix Research Institute, School of Medicine, Kyungpook National University, Republic of Korea
- Bio-BigData Center, Hanyang Institute for Bioscience and Biotechnology, Hanyang University, Republic of Korea
- Department of Pathology, College of Medicine, Hanyang University, Republic of Korea
- Hanyang Biomedical Research Institute, Hanyang University, Republic of Korea
Figures
Figure 1 with 3 supplements
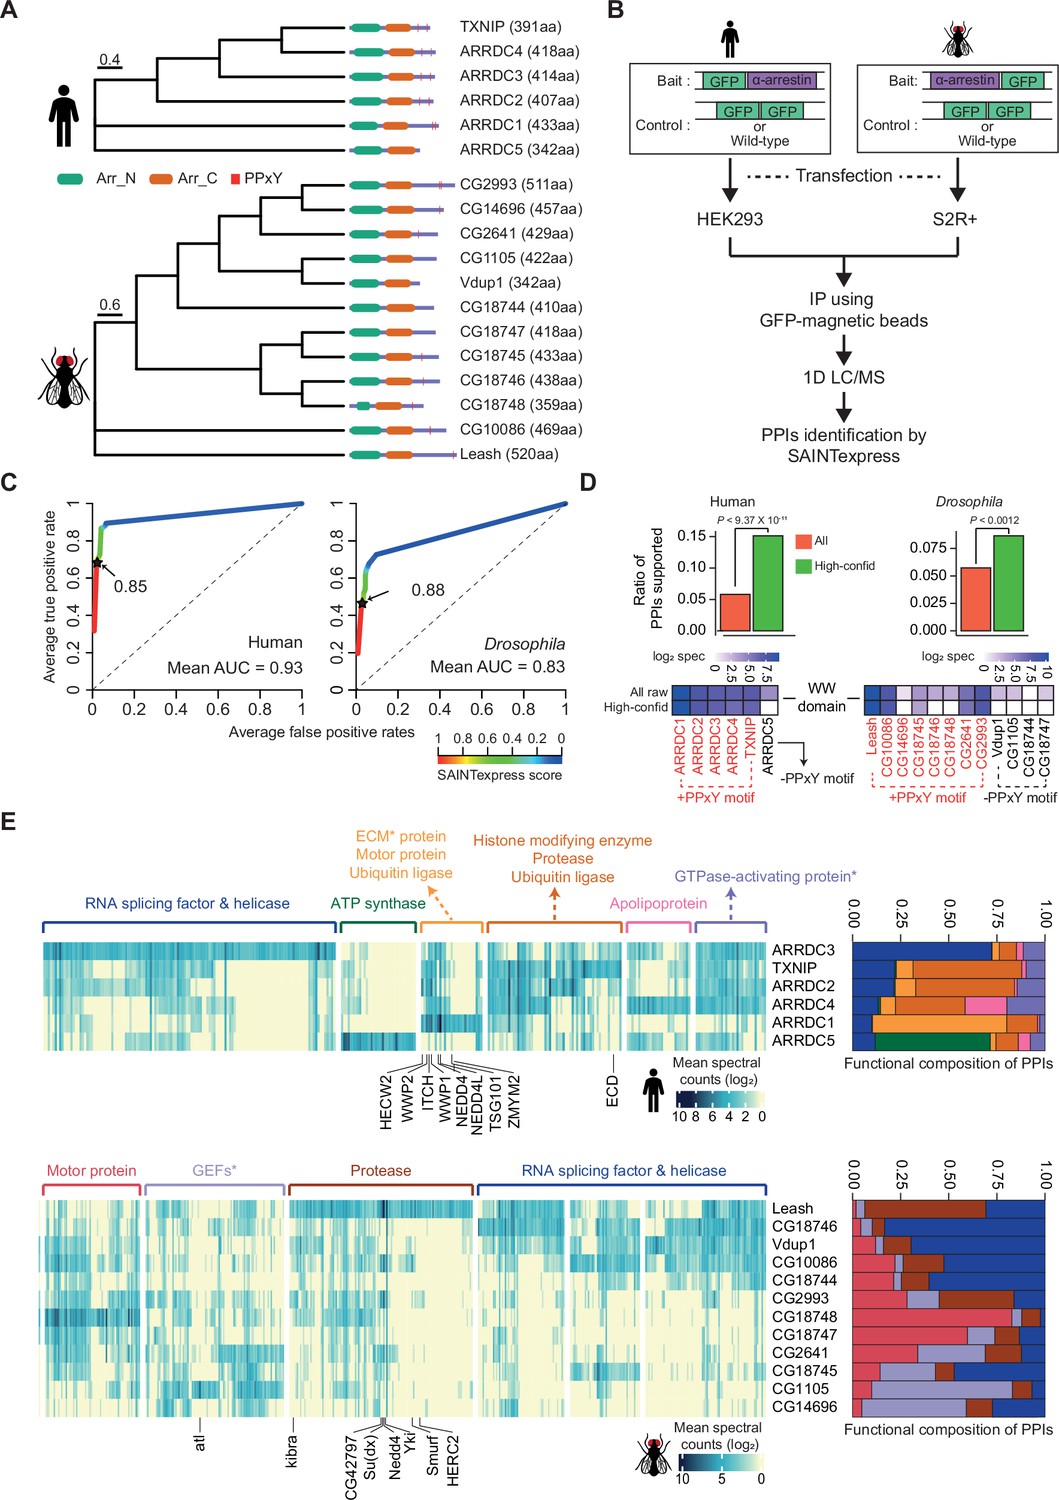
Identification of high-confidence α-arrestin protein–protein interactions (PPIs).
(A) Phylogenetic tree of α-arrestins from human (6, top) and Drosophila (12, bottom) based on protein sequences. The numbers in parentheses indicate the length of each protein. aa, amino acids; Arr_N: Arrestin N domain; Arr_C: Arrestin C domain; PPxY: PPxY motif. (B) Shown is a schematic flow of affinity purification/mass spectrometry (AP/MS) experiments and computational analysis. (C) Receiver operating characteristic (ROC) curves of Significance Analysis of INTeractome express (SAINTexpress) scores along with mean area under the curve (AUC) values. The arrows point to the cutoff scores used in subsequent studies in human (left) and Drosophila (right). (D) Top: the fraction of ‘high-confid’ (high-confidence) and raw (unfiltered) PPIs that are supported by known affinities between short-linear motifs and protein domains in human (left) and Drosophila (right). One-sided, Fisher’s exact test was performed to test the significance. Bottom: the sum of log2 spectral counts (‘log2 spec’) of proteins with WW domains that were reported to interact with each α-arrestin in the high-confidence or raw PPI sets are depicted as heatmap. (E) The α-arrestins and their interactomes were hierarchically clustered based on the log2 mean spectral counts and summarized for human (top) and Drosophila (bottom) in the heatmaps. The functionally enriched protein class in the clustered interactomes are indicated on the top. Proteins that were reported to interact with α-arrestins in literatures and databases are selectively labeled on the bottom. On the right, the functional composition of the clustered α-arrestin interactomes is summarized as the sum of log2 mean spectral counts, which are colored to correspond with the labels on the left.
-
Figure 1—source data 1
Raw spectral count tables.
- https://cdn.elifesciences.org/articles/88328/elife-88328-fig1-data1-v1.zip
Figure 1—figure supplement 1
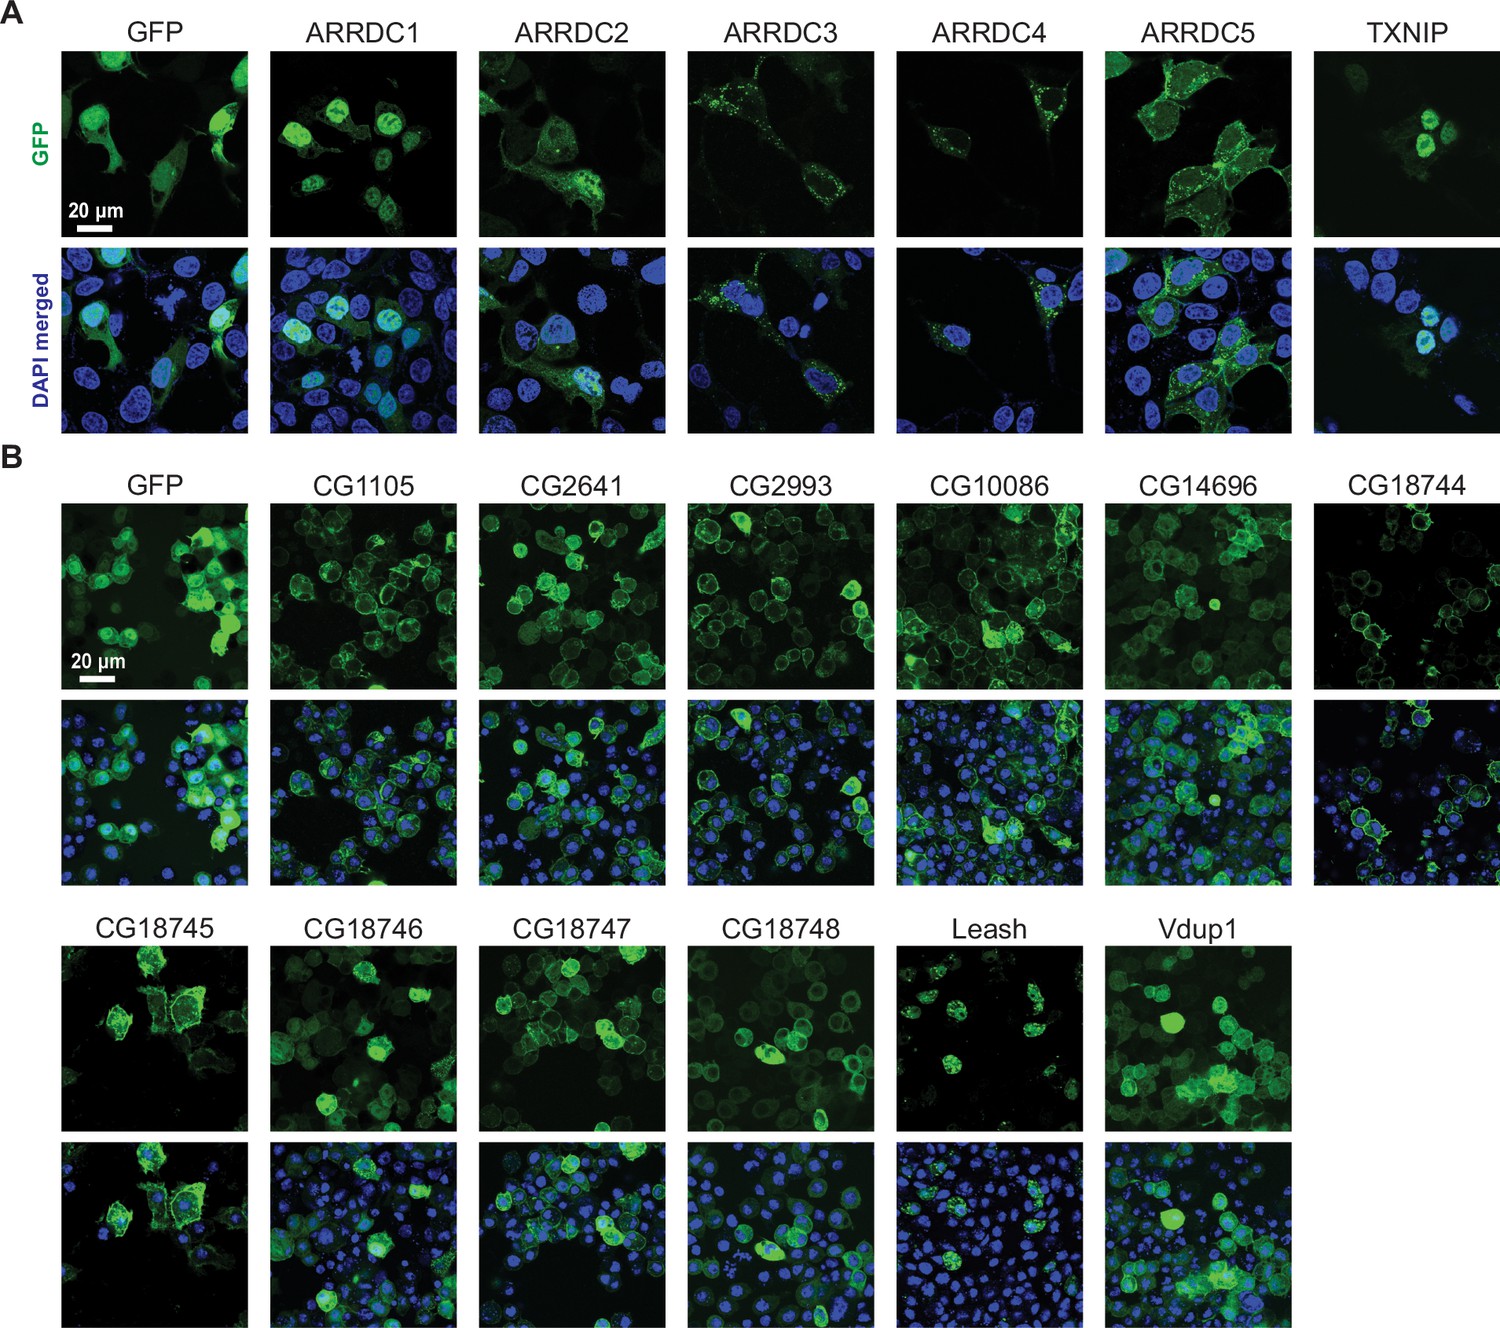
Fluorescence images showing HEK293 and S2R+ cells stably expressing GFP-tagged α-arrestins.
Representative images of HEK293 (A) and S2R+ cells (B) stably expressing GFP-tagged α-arrestins (scale bars = 20 μm).
Figure 1—figure supplement 2
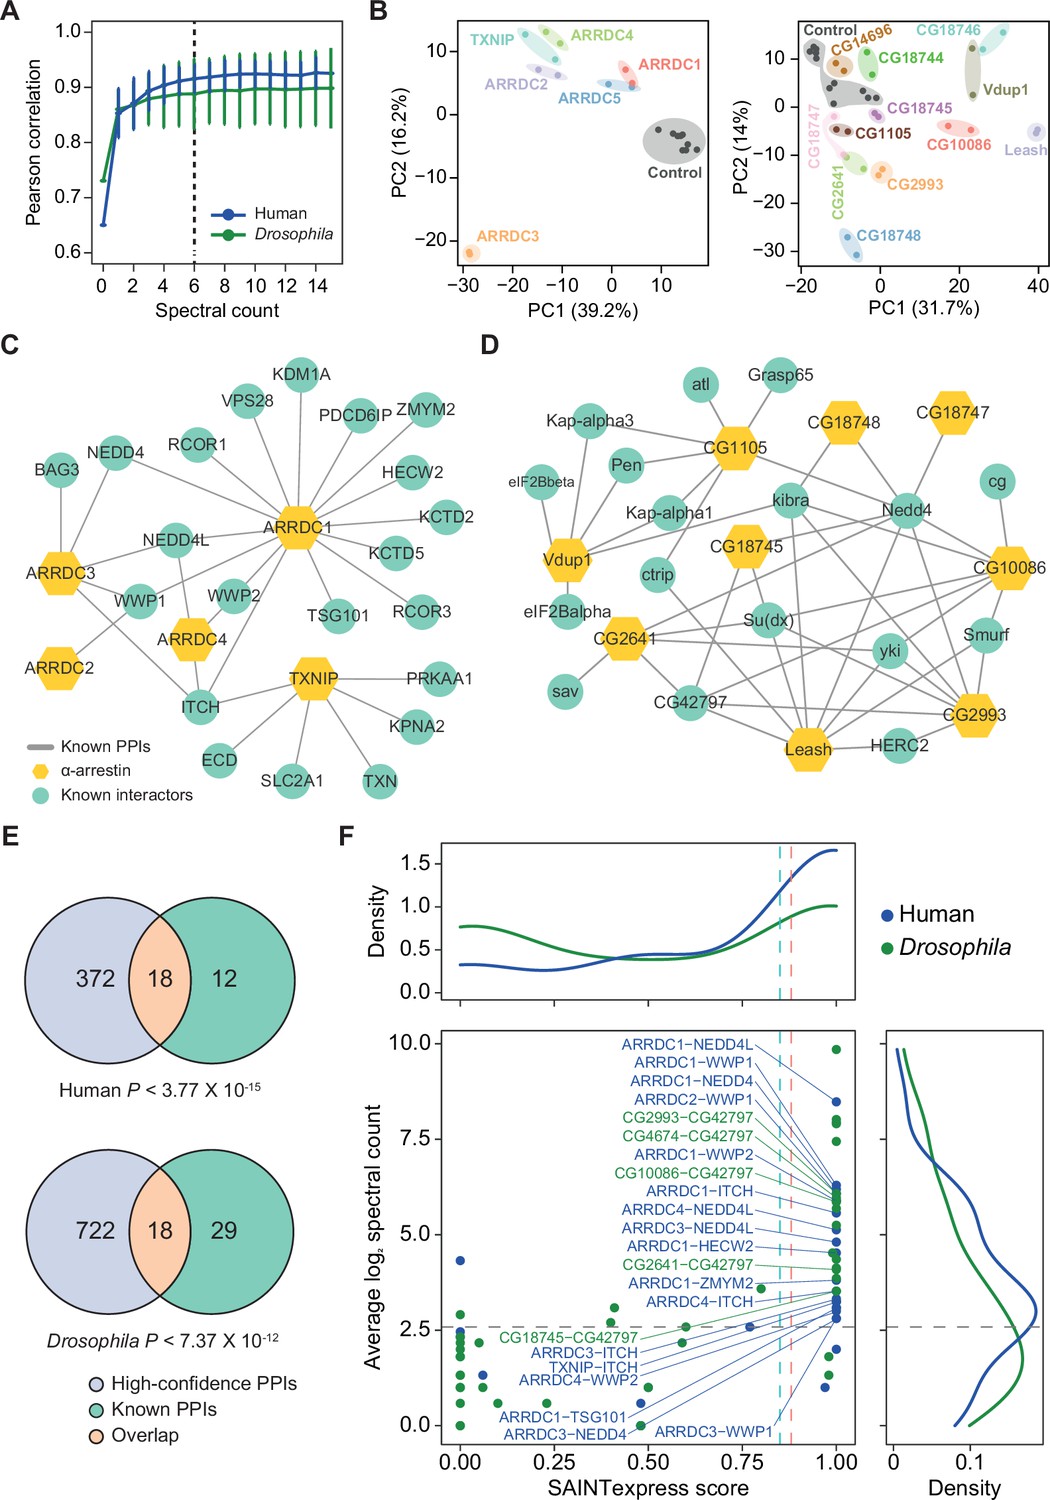
Affinity purification/mass spectrometry (AP/MS) data offer high reproducibility and expand the protein–protein interactions (PPIs) associated with α-arrestins while also reaffirming known interactions.
(A) Average Pearson correlation coefficients of log2 spectral counts between replicates of AP/MS of each α-arrestin at varying cutoffs are shown (mean ± SD). The cutoff used in this study, 6, is shown as a dashed line. (B) Principal component analysis (PCA) plots based on log2 spectral counts of high-confidence PPIs for human (left) and Drosophila (right) are shown. (C, D) PPI network of α-arrestins that were previously reported and utilized as the positive PPI sets (Supplementary file 2A and C) for human (C) and Drosophila (D). (E) Venn diagram showing the intersection of the high-confidence PPIs and positive PPI sets associated with α-arrestins for human (top, Supplementary file 2A) and Drosophila (bottom, Supplementary file 2C). p-Values were determined via the hypergeometric test. (F) Distribution of Significance Analysis of INTeractome express (SAINTexpress) scores and average spectral counts (log2) of the positive PPIs (Supplementary file 2A and C) are shown and density plots for each axis are also plotted. The positive PPIs that are also included in the high-confidence PPIs are selectively labeled.
Figure 1—figure supplement 3
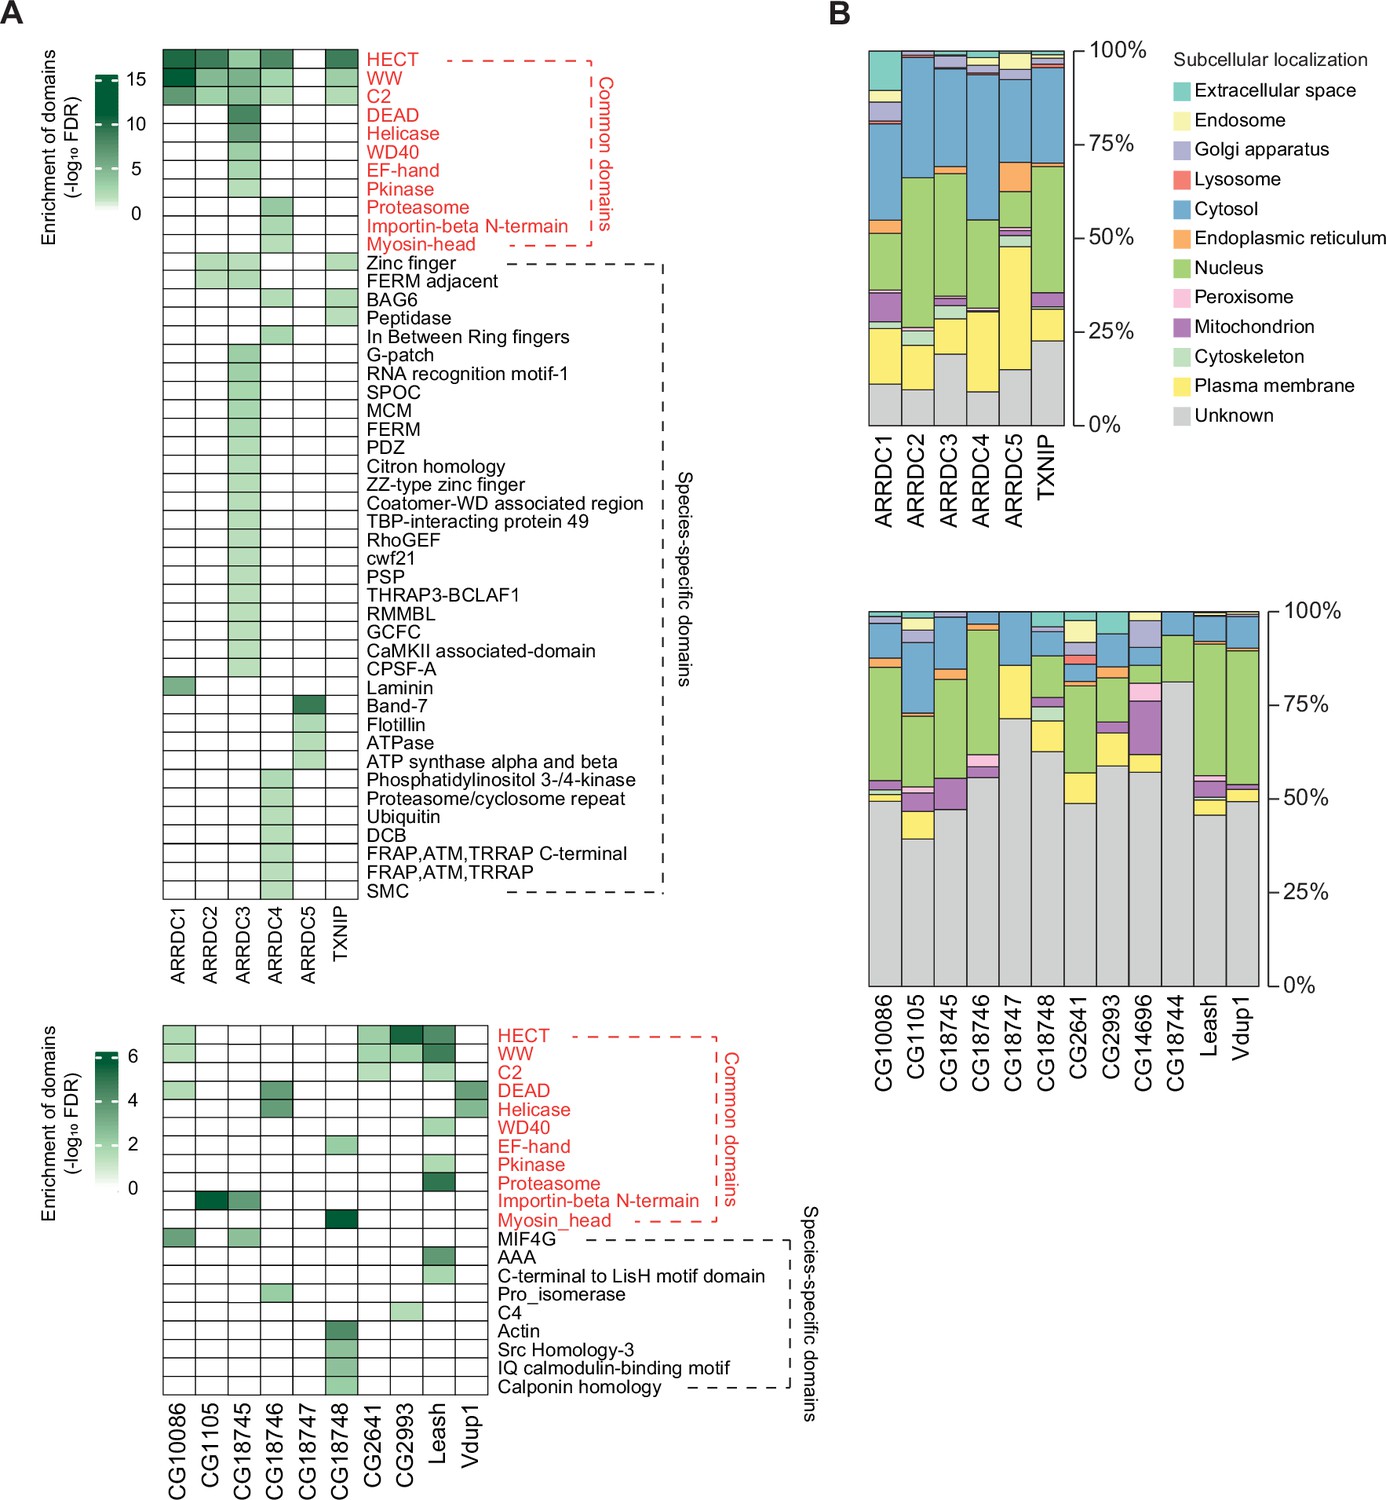
Protein domains and subcellular localization of α-arrestin interactomes.
(A) Protein domains enriched in the interactome of each α-arrestin for human (top) and Drosophila (bottom) are shown. The significance of the enrichment test (-log10 FDR) is indicated in shades of green, as depicted in the legend. SPOC, spen paralogue and orthologue C-terminal; MCM, minichromosome maintenance protein complex; FDRM, F for 4.1 protein, E for ezrin, R for radixin and M for moesin; TBP, TATA-binding protein; GEF, guanine nucleotide exchange factor; THRAP3, thyroid hormone receptor-associated protein 3; BCLAF1, Bcl-2-associated transcription factor1; RMMBL, RNA metabolizing metallo beta lactamase; CaMKII, C-terminus of the Calcium/calmodulin dependent protein kinases II; CPSF, cleavage and polyadenylation specificity factor; DCB, dimerization and cyclophilin-binding domain; FRAP, FKBP12-rapamycin complex-associated protein; ATM, ataxia telangiectasia mutant; THRAP, transformation/transcription domain associated proteins; MIF4G, middle domain of eukaryotic initiation factor 4G; AAA, ATPase family associated with various cellular activities; C4, C-terminal tandem repeated domain in type 4 procollagen; SMC, structural maintenance of chromosomes. (B) Subcellular localizations of the interactome of each α-arrestin for human (top) and Drosophila (bottom).
Figure 2 with 1 supplement
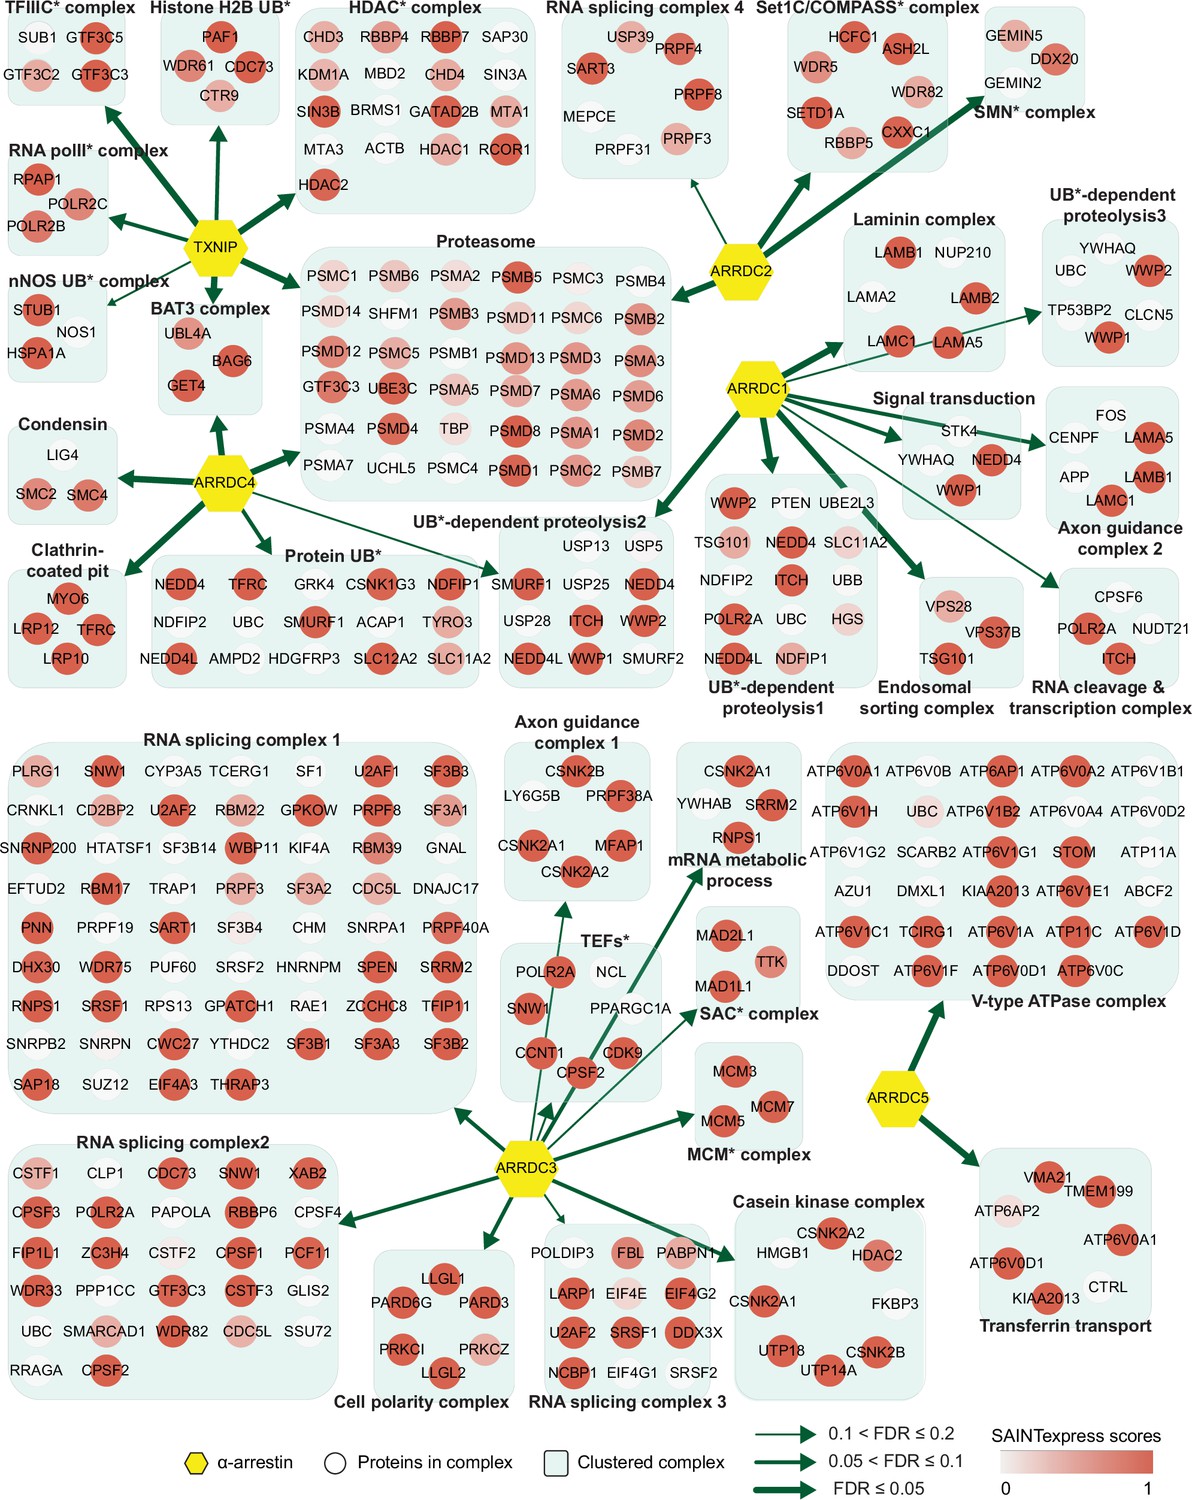
Network of α-arrestins and their associated protein complexes in human.
Network of α-arrestins and the functional protein complexes that significantly interact with them in human. α-Arrestins are colored yellow and prey proteins in protein complexes are colored according to the Significance Analysis of INTeractome express (SAINTexpress) scores (averaged if the protein interacts with multiple α-arrestins). The thickness of the green arrows indicates the strength of the interaction between α-arrestins and the indicated protein complexes, wdhich was estimated with false discovery rate (FDR) of complex association scores (see ‘Materials and methods’). UB, ubiquitination; HDAC, histone deacetylase; COMPASS, complex proteins associated with Set1; SMN, survivor of motor neurons; TFIIIC, transcription factor III C; RNA polII, RNA polymerase II; MCM, minichromosome maintenance protein complex.
Figure 2—figure supplement 1
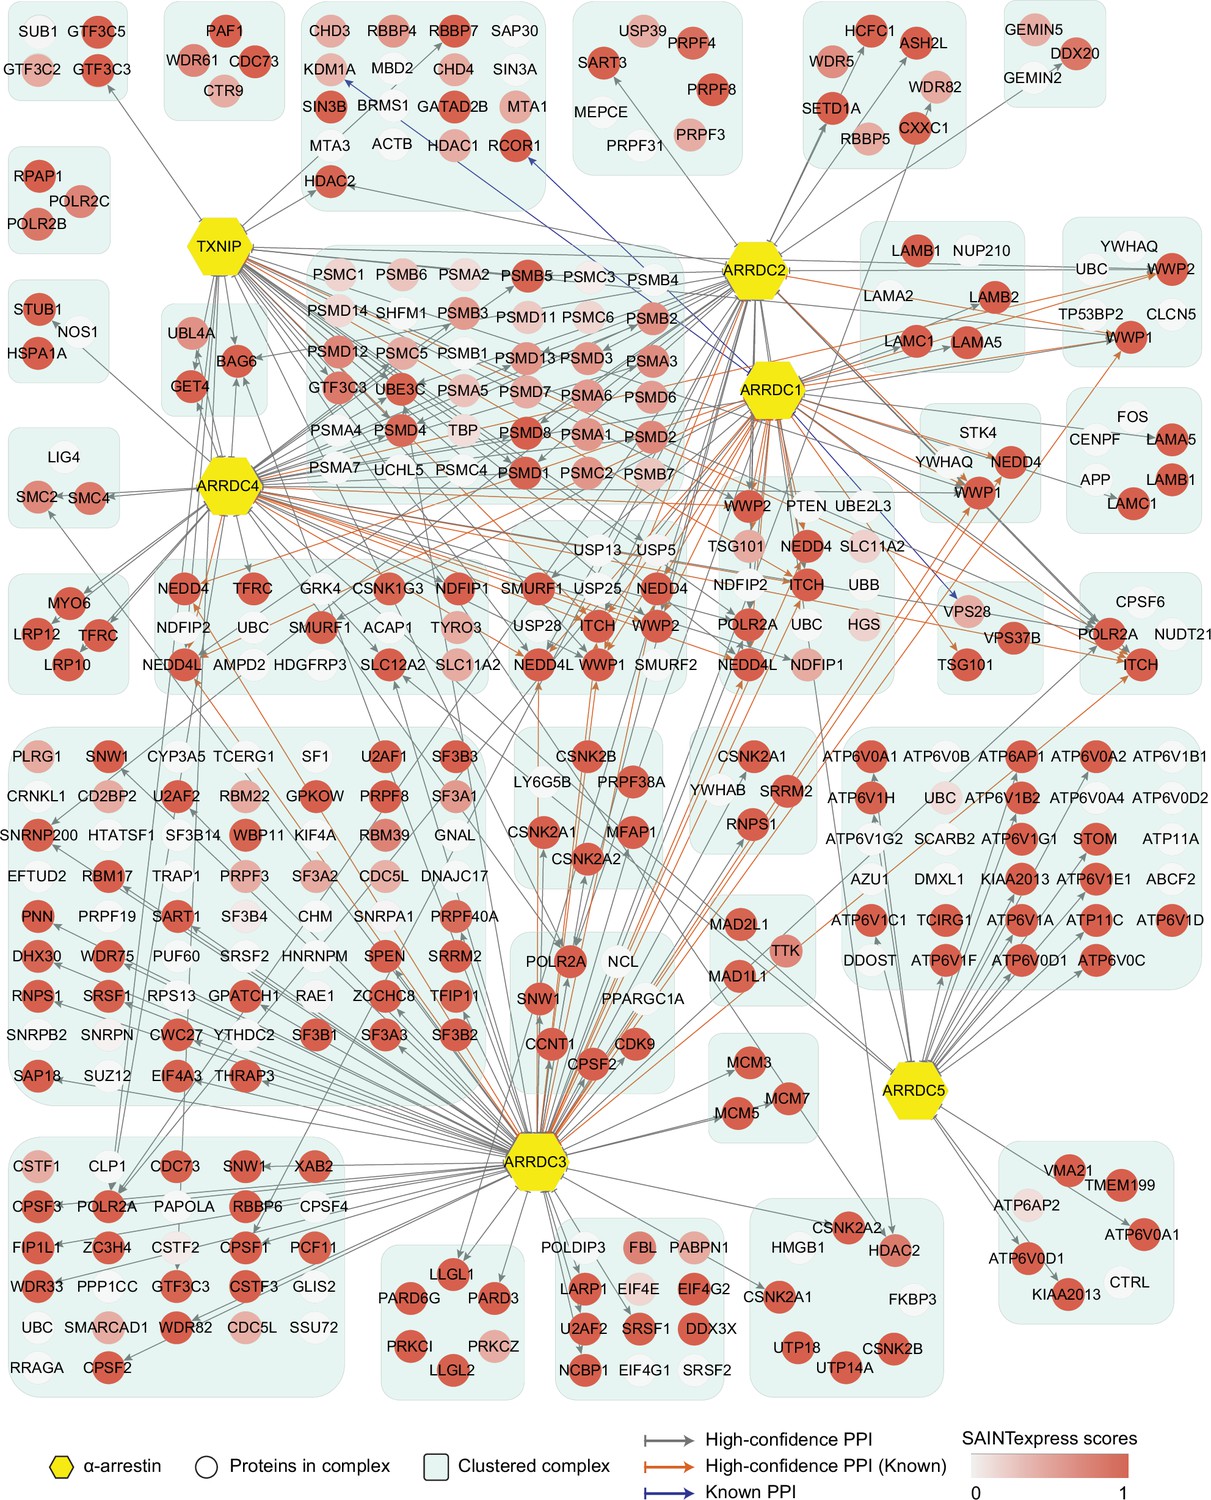
Network of high-confidence protein–protein interactions (PPIs) between α-arrestins and individual proteins of its associated protein complexes in human.
In addition to interaction between α-arrestins and protein complexes in Figure 2, PPIs between α-arrestins and individual components of its associated protein complexes are depicted for human. ‘High-confidence PPI (Known)’ refers to previously reported interactions (Supplementary file 2A and C) that are also present in the high-confidence PPIs, while ‘Known PPI’ pertains to those previously reported but absent from our collection.
Figure 3 with 1 supplement
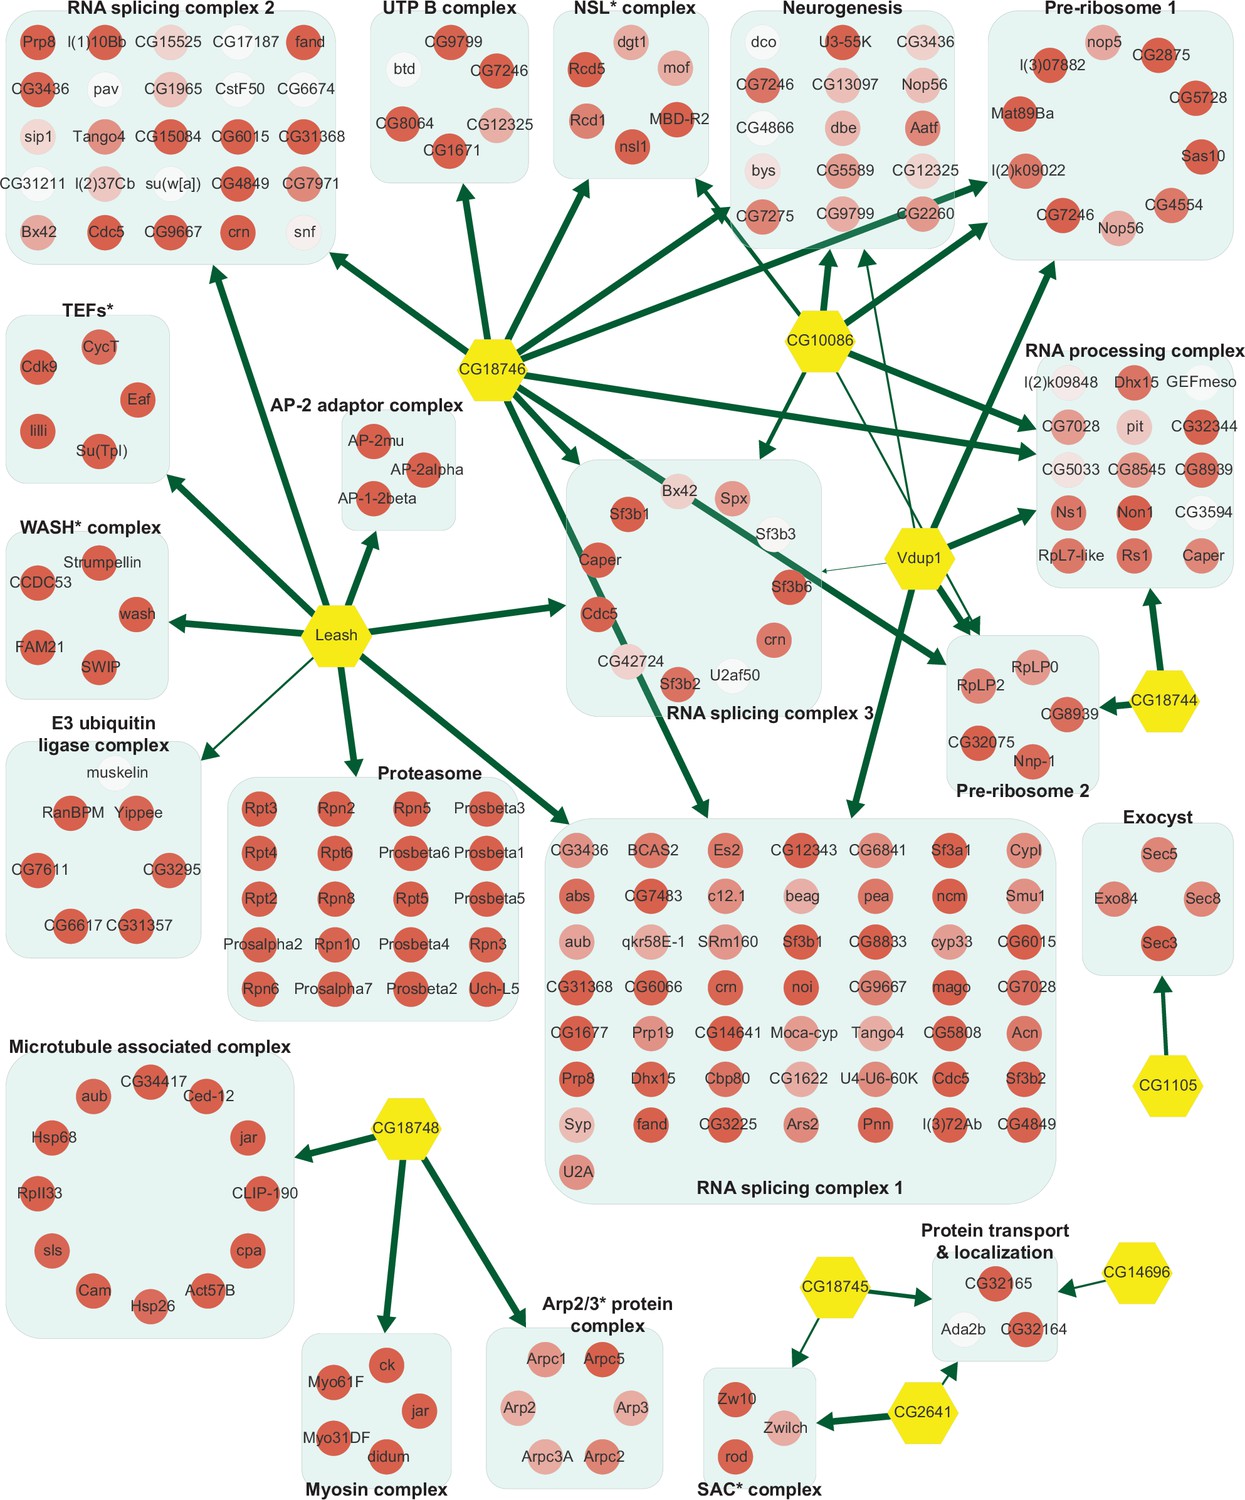
Network of α-arrestins and their associated protein complexes in Drosophila.
Network of α-arrestins and the functional protein complexes that significantly interact with them in Drosophila, depicted in a manner analogous to Figure 2. SAC, spindle assembly checkpoint; NSL, non-specific lethal; WASH, Wiskott–Aldrich syndrome protein and scar homolog; Arp2/3, actin-related protein 2/3; TEF, transcription elongation factor.
Figure 3—figure supplement 1
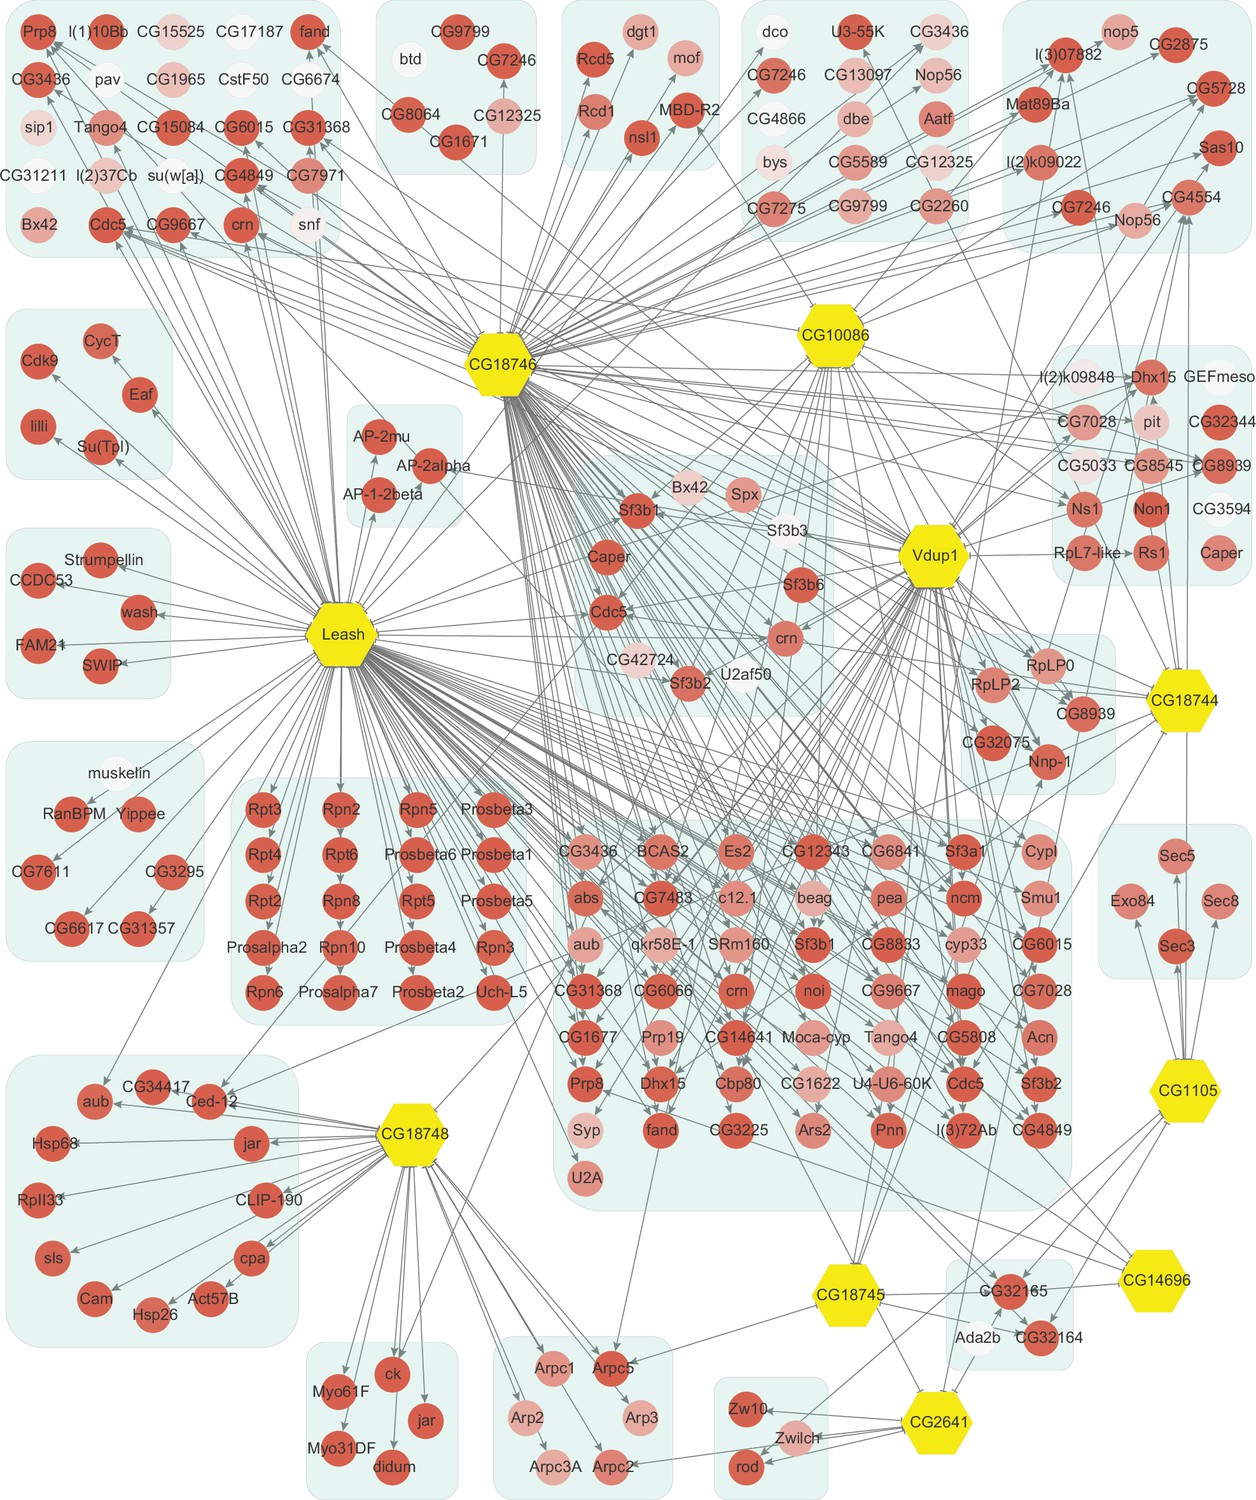
Network of high-confidence protein–protein interactions (PPIs) between α-arrestins and individual proteins of its associated protein complexes in Drosophila.
In addition to interaction between α-arrestins and protein complexes in Figure 3, PPIs between α-arrestins and individual components of its associated protein complexes are depicted for Drosophila, depicted in a manner analogous to Figure 2—figure supplement 1.
Figure 4 with 1 supplement
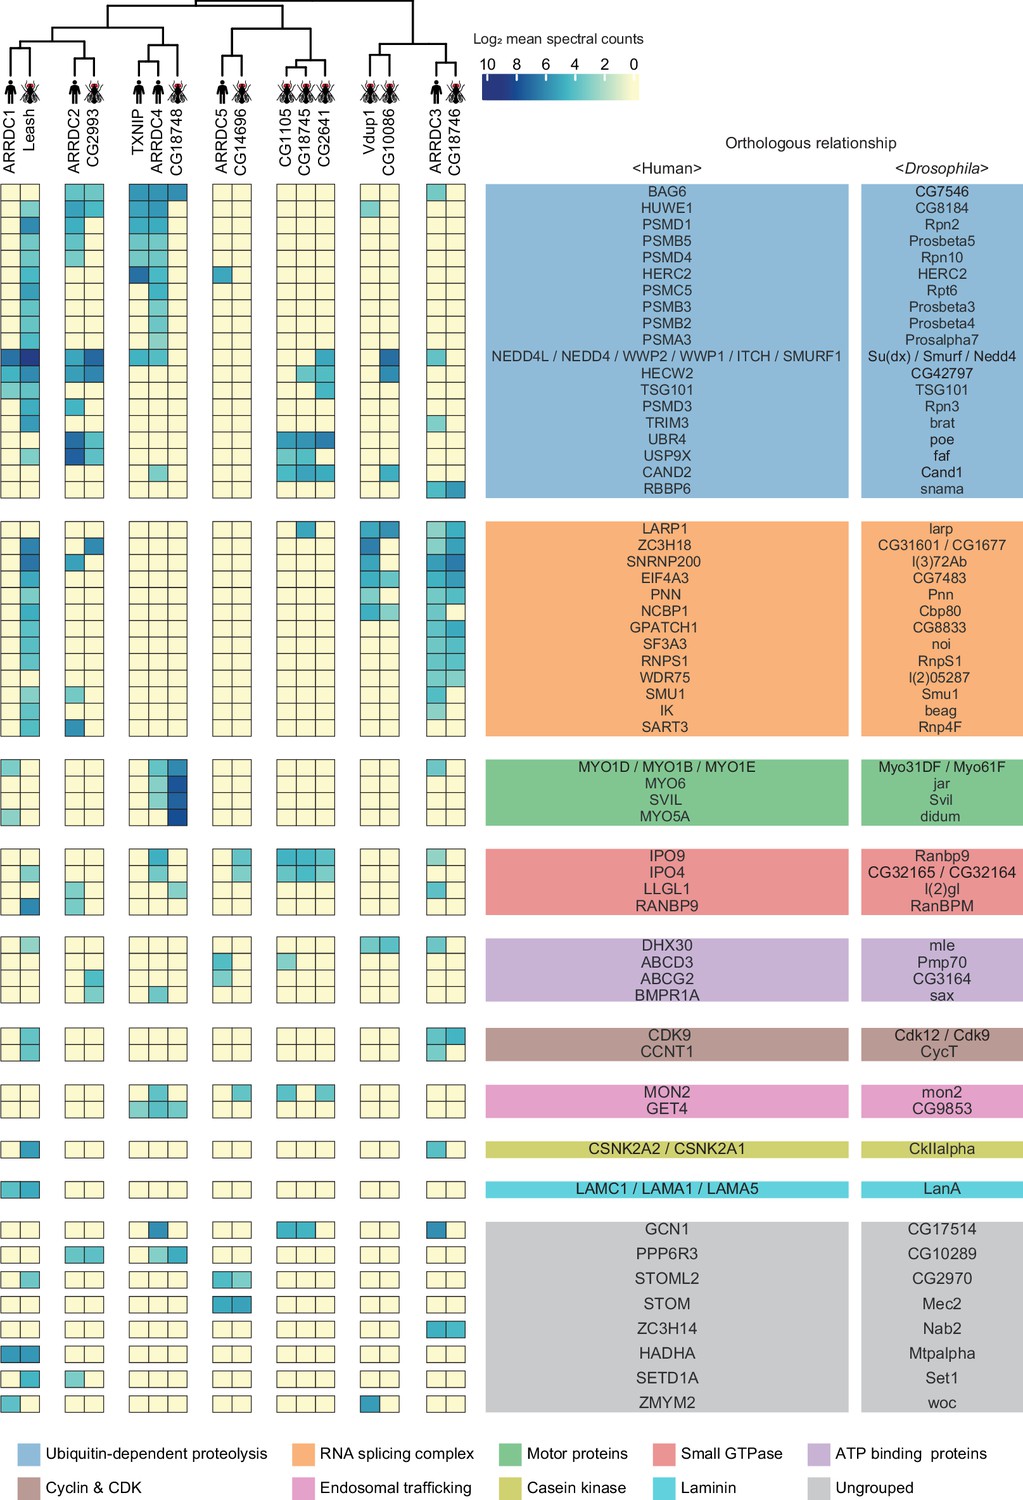
A substantial fraction of α-arrestin-protein–protein interactions (PPIs) are conserved across species.
Human and Drosophila α-arrestins and their orthologous interactomes are hierarchically clustered based on log2-transformed mean spectral counts. They are then manually grouped based on their shared biological functions and assigned distinct colors. The names of orthologous proteins that interact with α-arrestins are displayed on the right side of the heatmap.
Figure 4—figure supplement 1
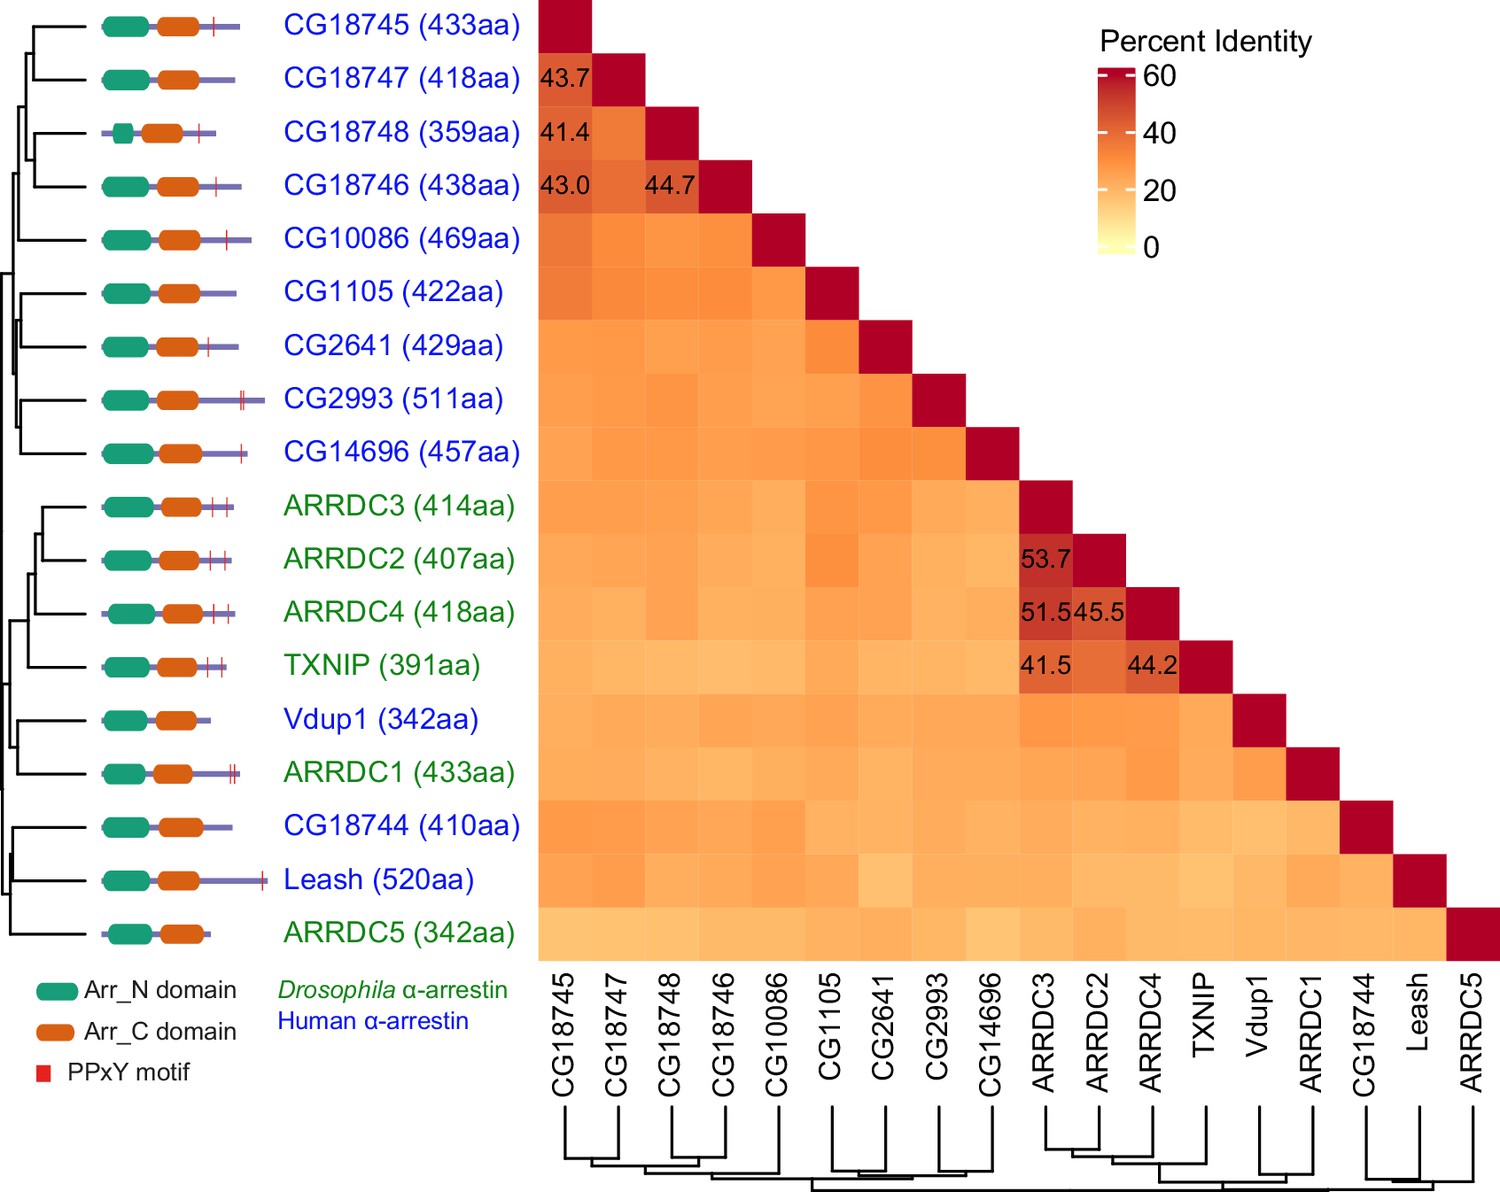
Protein sequence homology of α-arrestins from human and Drosophila.
Heatmap illustrates percent identity of protein sequences of α-arrestins from human and Drosophila.
Figure 5 with 2 supplements
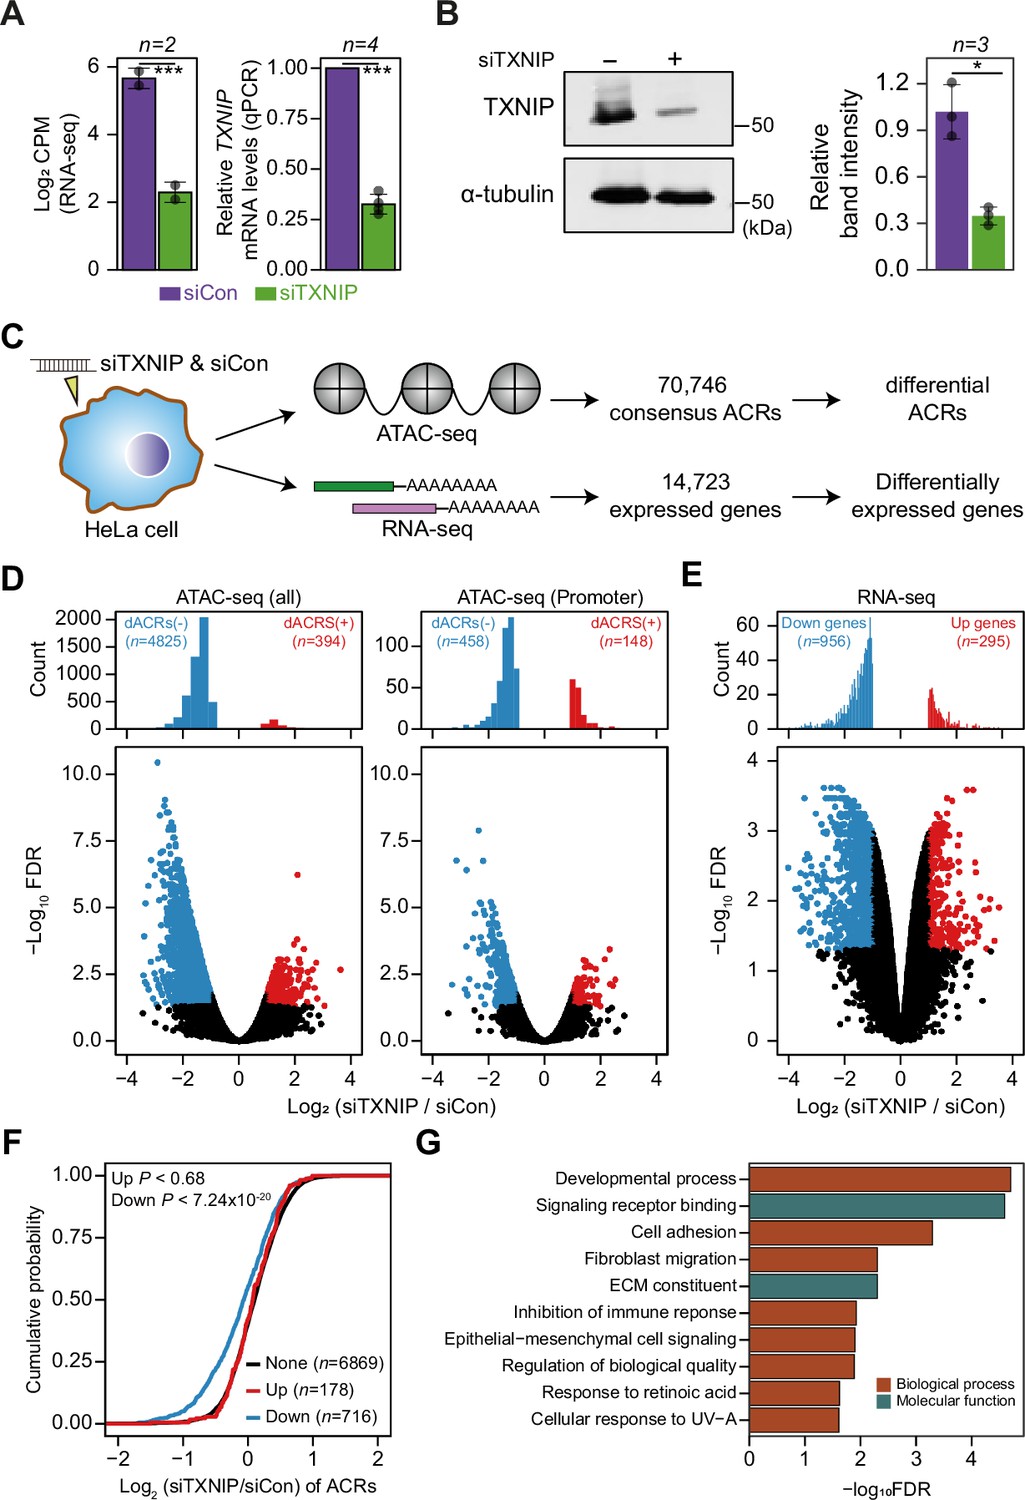
TXNIP knockdown induces a global decrease in chromatin accessibility and gene expression.
(A, B) HeLa cells were treated with either siRNA against TXNIP (siTXNIP) or negative control (siCon) for 48 hr and analyzed of changes in the mRNA (A) and protein levels (B) of TXNIP. Gray dots depict actual values of each experiment and bar plots indicate mean ± SD. ***False discovery rate (FDR) < 0.001 (see ‘Materials and methods’) for RNA-seq. *p<0.05, ***p<0.001 (two-sided paired Student‘s t-test) for RT-qPCR and western blots. (A) Expression levels of RNAs were quantified by RNA-seq (left, log2 counts per million mapped reads [CPM], see ‘Materials and methods’) and RT-qPCR. (B) Protein levels were first visualized by western blot analysis of lysates from HeLa cells and band intensities of three independent experiments were quantified using imageJ software (right). (C) A schematic workflow for detecting differentially accessible chromatin regions (dACRs) and differentially expressed genes (DEGs) using ATAC- and RNA-seq analyses, respectively. (D) Volcano plots of differential chromatin accessibility for all accessible chromatin regions (ACRs) (left) and those associated with promoters (right). (E) Volcano plots of differential gene expression. (D, E) Blue dots denote ‘dACRs(-)’ of significantly decreased chromatin accessibility (D) and ‘Down’ genes of significantly downregulated genes (E) in siTXNIP-treated cells compared to control (FDR ≤ 0.05, log2(siTXNIP/siCon) ≤–1); red dots denote ‘dACRs(+)’ of significantly increased chromatin accessibility (D) and ‘Up’ genes of significantly upregulated genes (E) in siTXNIP-treated cells compared to control (FDR ≤ 0.05, log2(siTXNIP/siCon) ≥ 1). Black dots denote data points with no significant changes. (F) Changes in chromatin accessibility of ACRs located in the promoter region of genes were plotted as cumulative distribution functions (CDFs). Genes were categorized into three groups based on changes in RNA levels (‘Up’, ‘Down’ as in E and ‘None’ indicating genes with –0.5 ≤log2(siTXNIP/siCon) ≤ 0.5). The number of genes in each group are shown in parentheses, and p-values in the left upper corner were calculated by one-sided Kolmogorov–Smirnov (KS) test. (G) Top 10 GO terms (biological process and molecular function) enriched in genes that exhibited decreased chromatin accessibility at their promoter and decreased RNA expression upon TXNIP knockdown (Supplementary file 11).
Figure 5—figure supplement 1
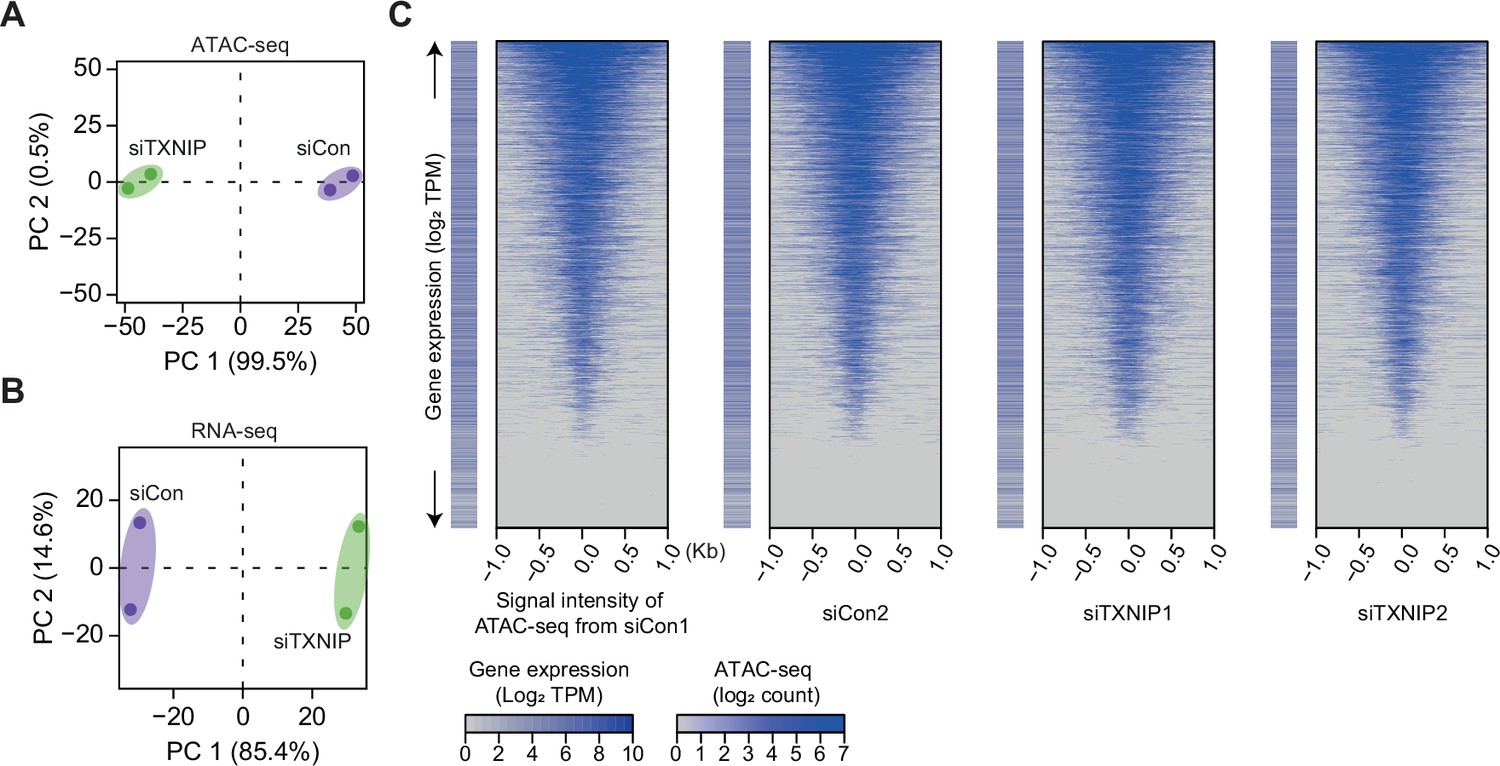
High-throughput sequencing data are highly reproducible, and ATAC-seq reads exhibit a typical pattern of strong enrichment around transcription start sites (TSSs) of expressed genes.
(A, B) Principal component analysis (PCA) plots of ATAC- (A) and RNA-seq (B) results based on batch-corrected log2 counts and counts per million mapped reads (CPM), respectively. Numbers in parentheses are percentages of explained variance for the corresponding principal components (PCs). (C) Heatmaps of ATAC-seq read counts (read counts have been transformed into a log2 function and corrected for batch effects) in regions surrounding TSSs along with log2 transcript per million mapped reads (TPM, see ‘Materials and methods’) for genes having the corresponding TSS are plotted for each sample.
Figure 5—figure supplement 2
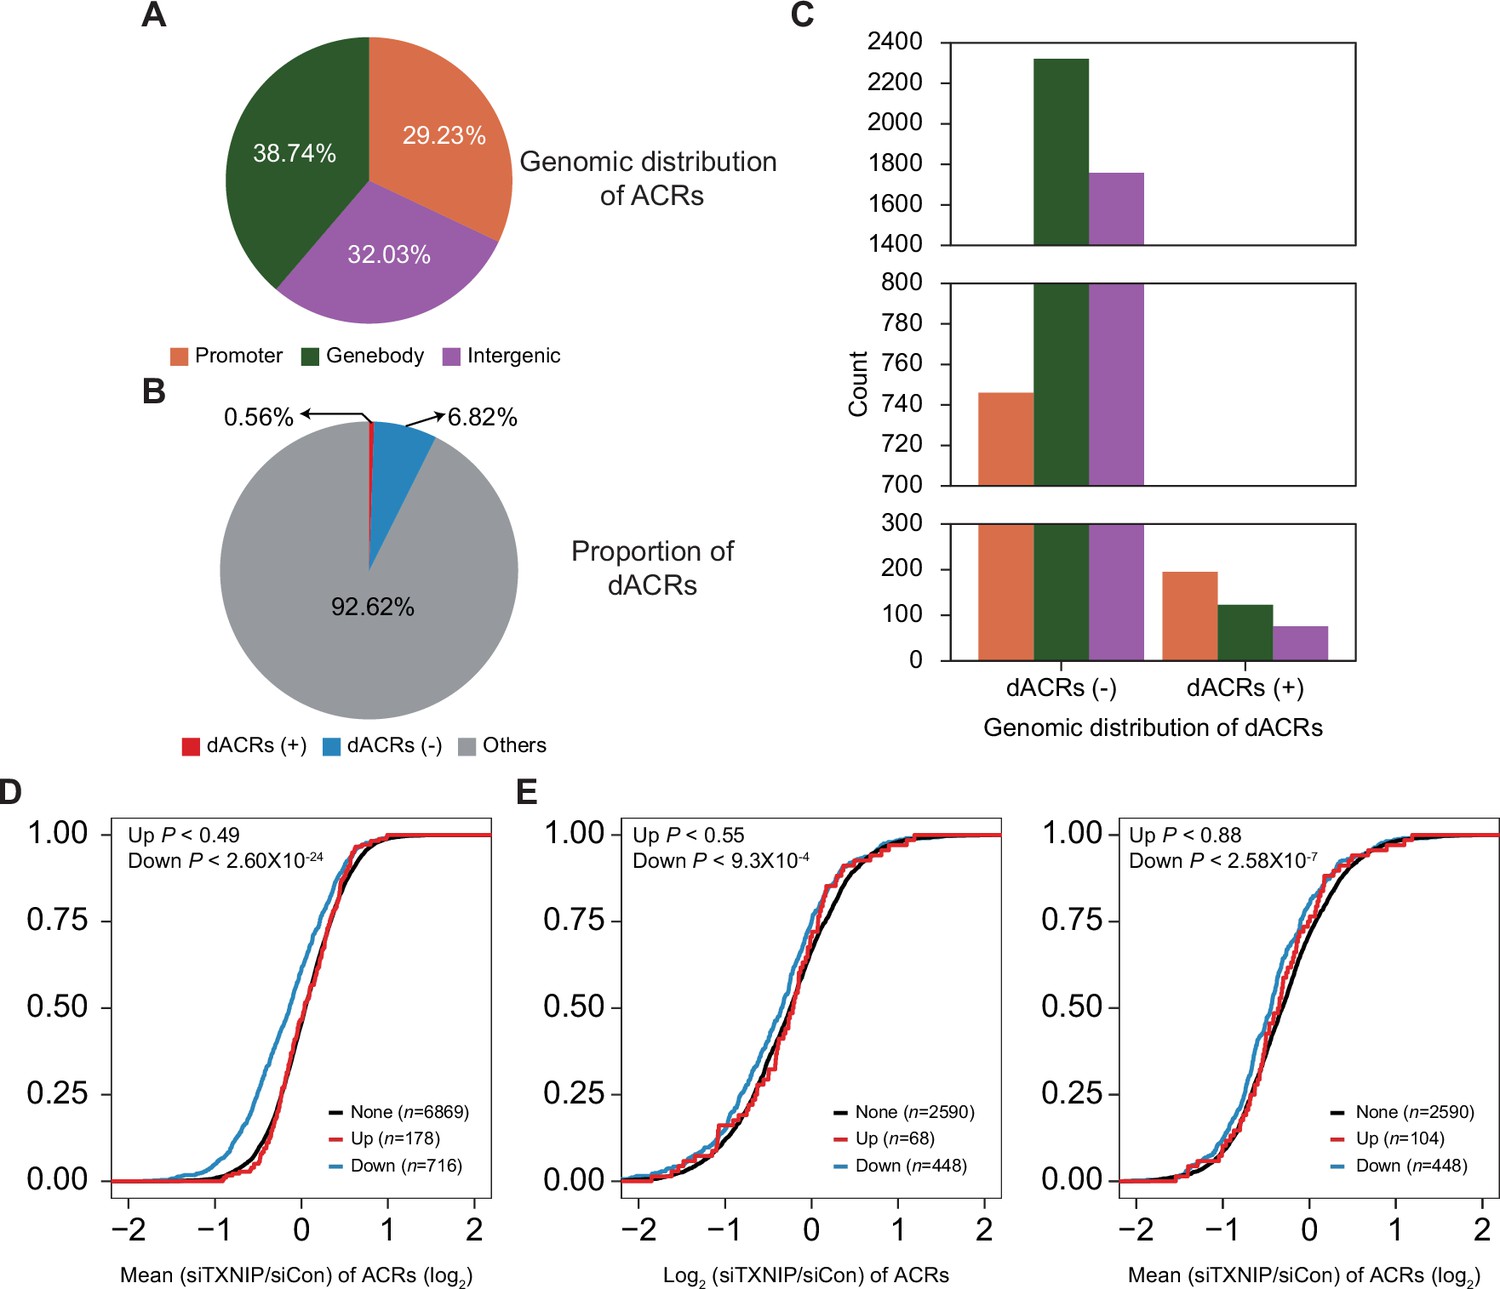
Genomic locations of accessible chromatin regions (ACRs) and association between chromatin accessibility and transcriptional activity.
(A) Genomic locations of 70,746 consensus ACRs identified from ATAC-seq analysis. (B) Composition of dACRs(-), dACRs(+), and other ACRs (‘others’, not significantly changed) under the TXNIP knockdown condition compared to the control. (C) Genomic locations of 4825 dACRs(-) and 394 dACRs(+) are depicted. Colors in the bar plot have the same symbolism as in (A). (D) Cumulative distribution function (CDF) of mean changes in accessibility of all ACRs located in gene promoters. The genes were categorized into three groups (‘None’, ‘Down’, and ‘Up’) as explained in Figure 5F. p-Values on the left upper corner were calculated using the one-sided Kolmogorov–Smirnov (KS) test, which compares ‘Up’ or ‘Down’ groups to the ‘None’ group. (E) CDF of changes in accessibility of ACRs located in gene bodies. Changes in accessibility of ACRs whose intensity is highest among all ACRs located in gene bodies are depicted on the left, and mean changes in accessibility of all ACRs located in gene bodies are depicted on the right. p-Values on the upper-left corners are calculated in the same manner as in (D).
Figure 6 with 1 supplement
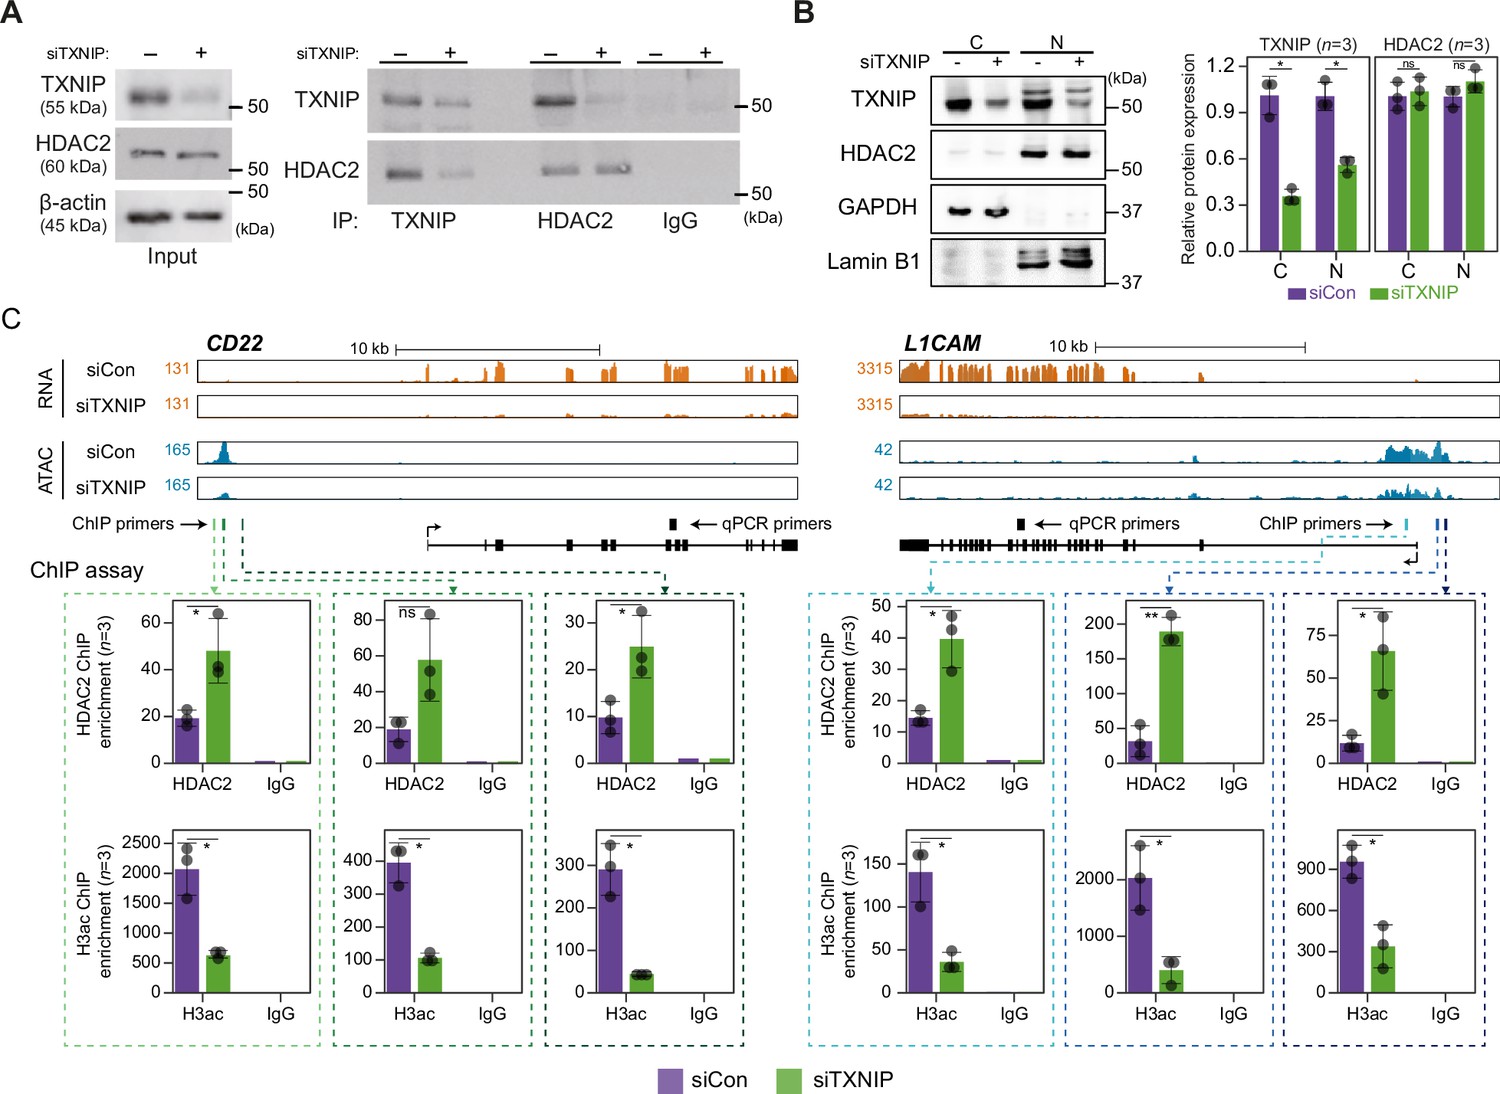
TXNIP directly represses the recruitment of HDAC2 to target loci.
(A) Co-immunoprecipitation (Co-IP) assay showing the interaction between TXNIP and HDAC2 proteins. Lysates from HeLa cells that had been treated with either siCon or siTXNIP for 48 hr were subjected to IP and immunoblotting with antibodies recognizing TXNIP and HDAC2. IgG was used as the negative control. (B) Nuclear and cytoplasmic fractions of HeLa cells were analyzed with western blots following transfection with siCon or siTXNIP for 48 hr (left). Lamin B1 and GAPDH were used as nuclear and cytoplasmic markers, respectively. Western blot results from three independent experiments for TXNIP and HDAC2 were quantified and presented as in Figure 5B. C, cytoplasm; N, nucleus. (C) Genomic regions showing RNA expression and chromatin accessibility at CD22 and L1CAM gene loci (top). Through the ChIP-qPCR analysis, the fold enrichment of HDAC2 and histone H3 acetylation (H3ac) at the CD22 and L1CAM promoter regions in HeLa cells treated with either siCon or siTXNIP for 48 hr were quantified (bottom). Data are presented as the mean ± SD (n = 3, biological replicates). Gray dots depict actual values of each experiment. *p<0.05, **p<0.01, ns: not significant (two-sided paired Student’s t-test).
Figure 6—figure supplement 1
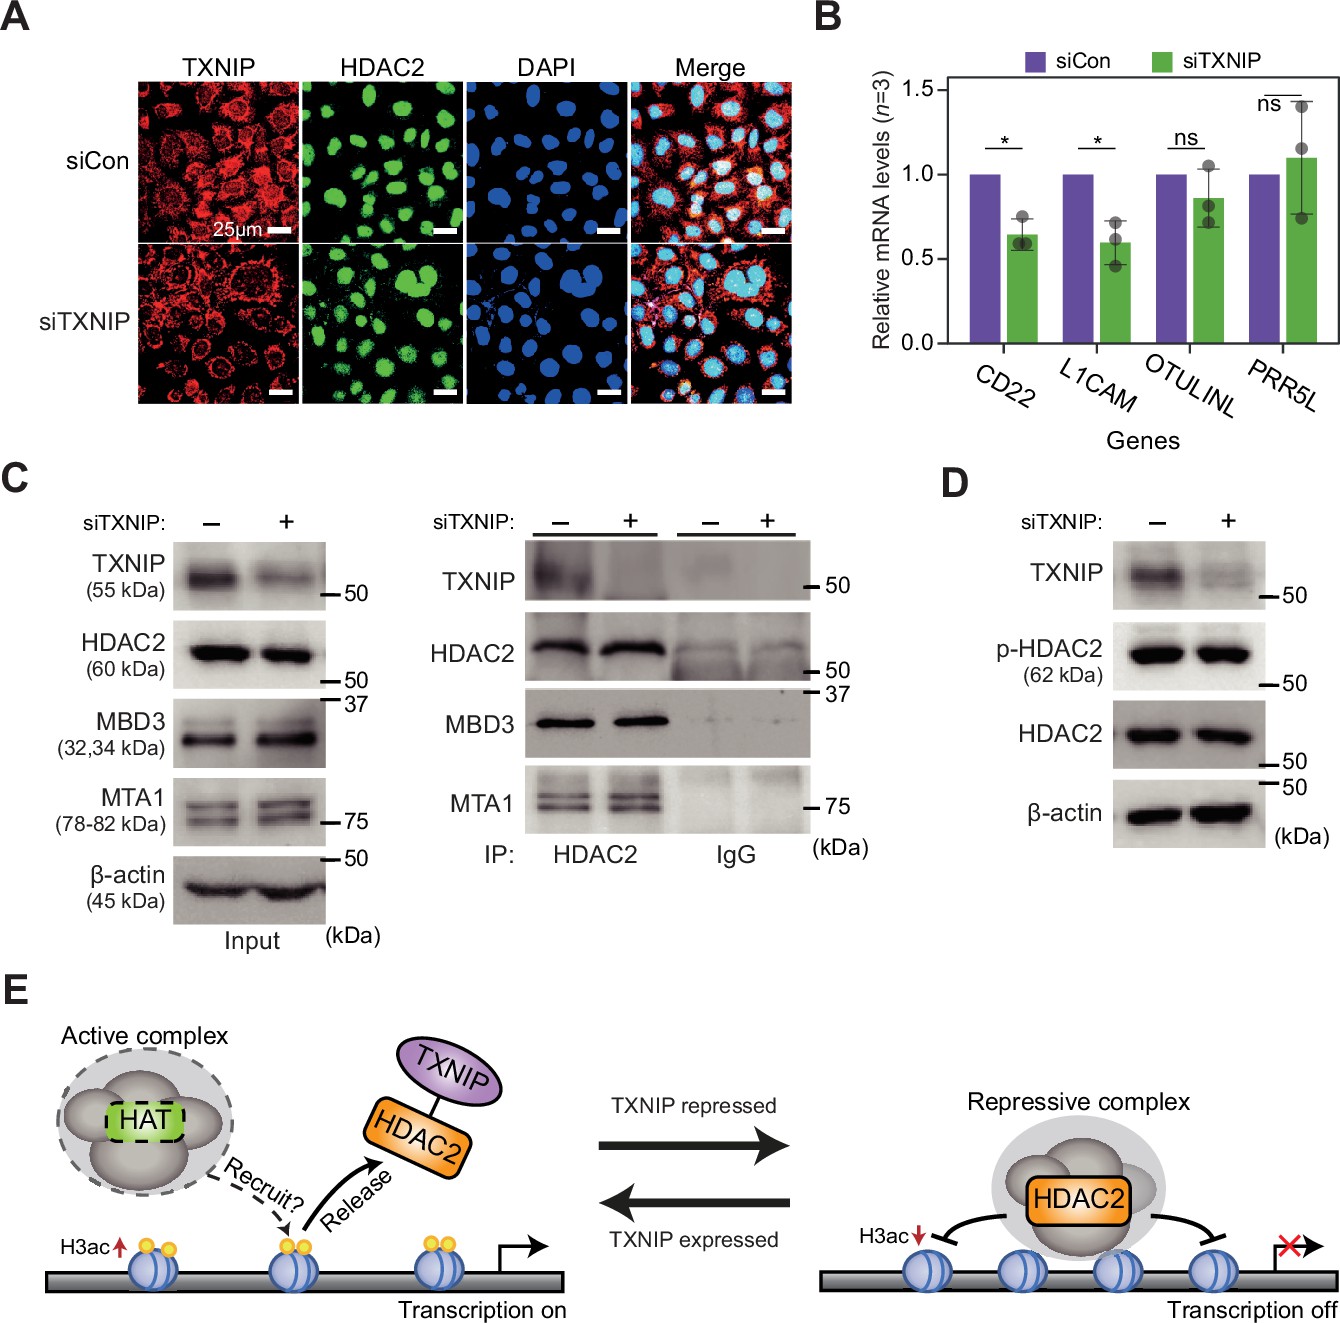
TXNIP might play role in transcriptional regulation independent of known factors.
(A) Representative immunofluorescence images of TXNIP and HDAC2 after HeLa cells were transfected with either siCon or siTXNIP for 48 hr (magnification ×600); TXNIP (red), HDAC2 (green), and DAPI (blue) (scale bars = 25 μm). (B) RT-qPCR results of four target genes whose RNA expression and chromatin accessibility in their promoters, quantified using high-throughput sequencing data, were observed to be strongly repressed in HeLa cell. Data are presented as the mean ± SD, n = 3. Gray dots depict actual values of each experiment. *p<0.05, ns: not significant (two-sided paired Student’s t-test). (C) Co-immunoprecipitation (Co-IP) assay showing interaction of HDAC2 with TXNIP, MBD3, and MTA1 proteins. Lysates from HeLa cells were treated with either control siRNA (siCon) or TXNIP siRNA (siTXNIP) for 48 hr and subjected to immunoprecipitation and immunoblotting with the indicated antibodies. (D) Immunoblot analysis shows changes in the expression levels of phosphorylated HDAC2 (p-HDAC2) and HDAC2 protein in TXNIP knockdown HeLa cells. (C-D) β-Actin was used as loading control. (E) A proposal model for the transcriptional regulation of target genes by interaction between TXNIP and HDAC2.
Figure 7

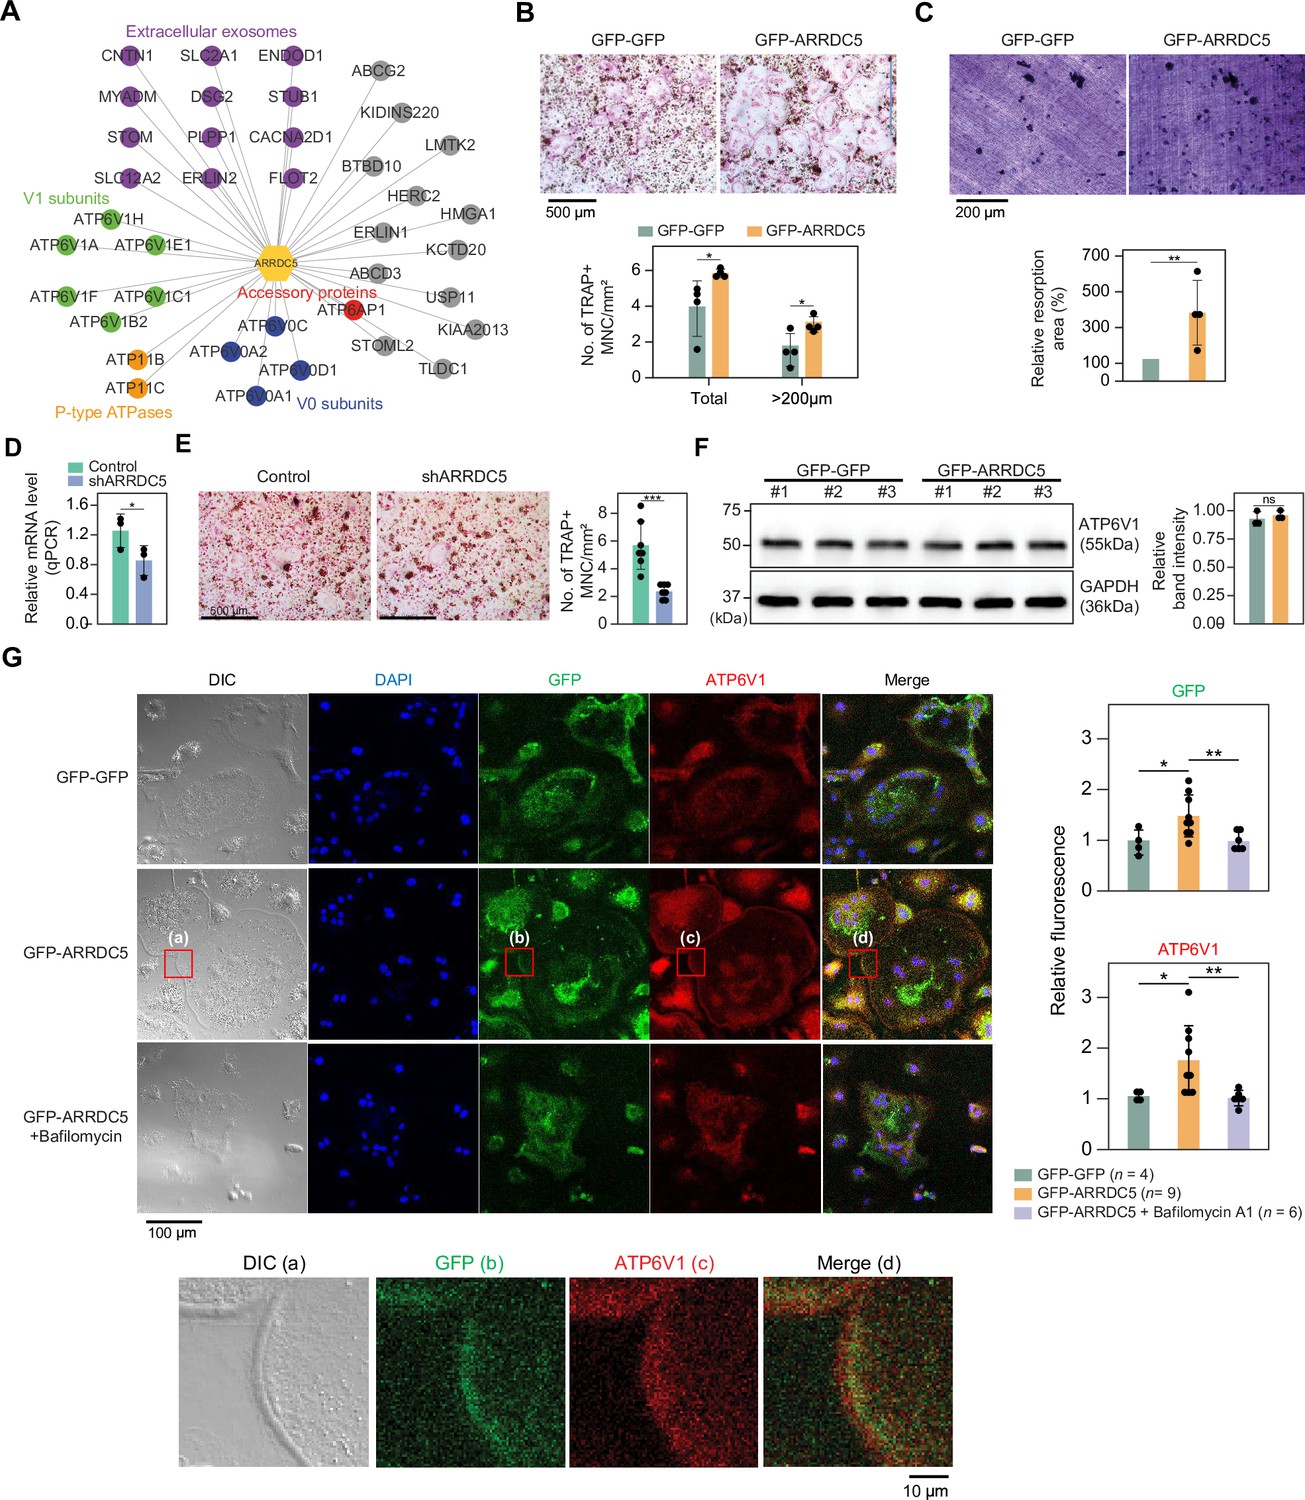
Interaction of ARRDC5 with the V-type ATPases in osteoclasts.
(A) The human ARRDC5-centric protein–protein interactions (PPI) network. V-type and P-type ATPases, their related components, and extracellular exosomes are labeled and colored. Other interacting proteins are indicated with gray circles. (B) TRAP staining of osteoclasts. Cell differentiation was visualized with TRAP staining of GFP-GFP or GFP-ARRDC5-overexpressing osteoclasts (scale bar = 500 μm). TRAP-positive multinucleated cells (TRAP + MNC) were quantified as the total number of cells and the number of cells whose diameters were greater than 200 μm. *p<0.05. Data are presented as the mean ± SD, n=4. (C) Resorption pit formation on dentin slices. Cell activity was determined by measuring the level of resorption pit formation in GFP-GFP or GFP-ARRDC5-overexpressing osteoclasts (scale bar = 200 μm). Resorption pits were quantified as the percentage of resorbed bone area per the total dentin disc area using ImageJ software. The resorption area is relative to that in dentin discs seeded with GFP-GFP-overexpressing osteoclasts, which was set to 100%. The colors of the bar plots are same as in (B). **p<0.01. Data are presented as the mean ± SD, n = 4. (D) Relative mRNA levels of ARRDC5 in non-target control (Control) or shARRDC5-expressing osteoclasts (shARRDC5) measured by qPCR. *p<0.05 (Student’s t-test, one-sided). Data are presented as the mean ± SD, n=3. (E) TRAP staining of osteoclasts. Cell differentiation was visualized with TRAP staining of ‘Control’ or ‘shARRDC5’-expressing osteoclasts (scale bar = 500 μm, left). TRAP-positive multinucleated cells (TRAP + MNC) were quantified as the total number of cells (right). Colors of the bar plots are same as in (D). ***p<0.001 (Student’s t-test). Data are presented as the mean ± SD, n=7. (F) The protein level of ATP6V1 in GFP-GFP or GFP-ARRDC5-overexpressing osteoclasts. The numbers represent independent samples for western blot analysis (left) and band intensities of three independent experiments were quantified (right). Colors of the bar plots are same as in (B) and (C). ns, not significant. Data are presented as the mean ± SD, n=3. (G) Localization of ARRDC5 and V-type ATPase V1 domain subunit (ATP6V1) in osteoclasts. ATP6V1 was visualized with immunofluorescence (red), GFP-GFP and GFP-ARRDC5 were visualized with GFP fluorescence (green), and nuclei were visualized with DAPI (blue). Representative fluorescence images are shown (scale bar = 100 μm). The region of interest, marked by the red boxes, was high-magnified and presented below (scale bar = 10 μm). The integrated density of fluorescence was quantified using ImageJ software and expressed as relative fluorescence (right). The integrated density of fluorescence in GFP-GFP osteoclasts was established as the reference value, which was set to 1. *p<0.05, **p<0.01 (Student’s t-test). Data are presented as the mean ± SD with the number of data indicated in the figure.
Figure 8
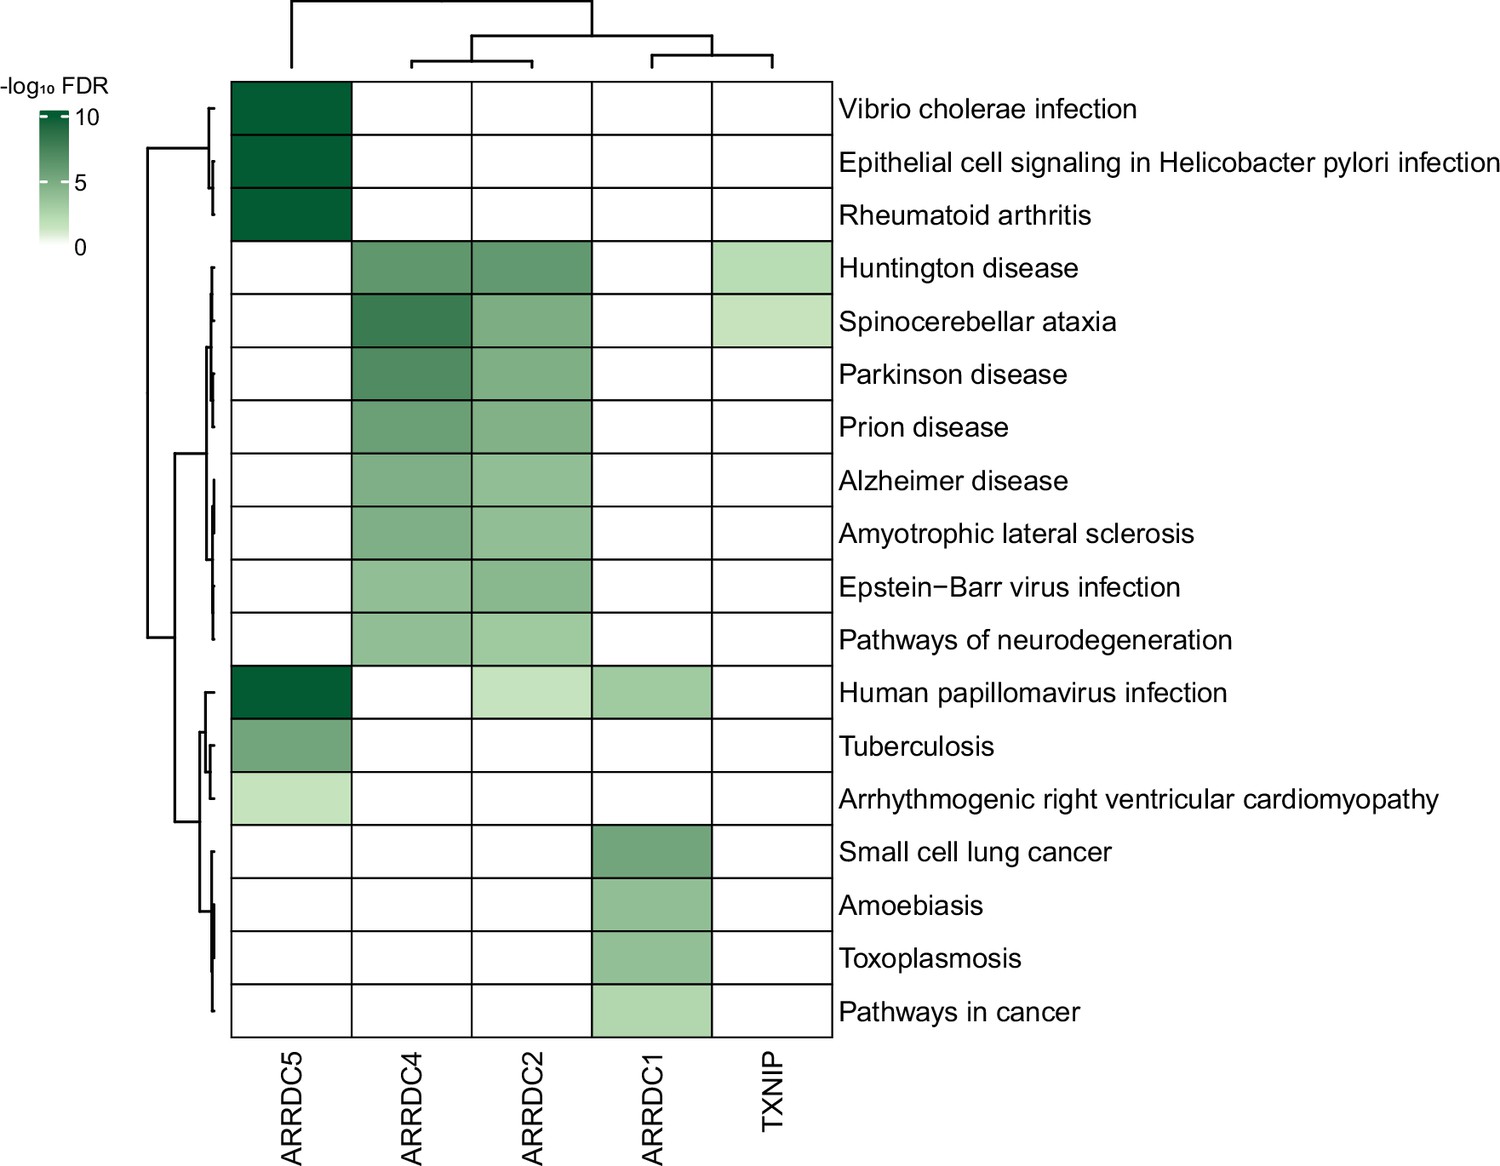
Association between α-arrestin interactomes and human diseases.
Heatmap depicts disease pathways from the Kyoto Encyclopedia of Genes and Genomes (KEGG) that are enriched in interactome of each α-arrestin. The significance of the enrichment was tested by enrichR (Kuleshov et al., 2016) and indicated as -log10 FDR. Only the disease pathways that are significantly enriched (FDR < 0.05) are colored. FDR, false discovery rate.
Author response image 1
Tables
Key resources table
| Reagent type (species) or resource | Designation | Source or reference | Identifiers | Additional information |
|---|---|---|---|---|
| Strain, strain background (Mus musculus) | Bone marrow-derived macrophages (BMMs) | KOATECH (Gyeonggi-do, South Korea) | KOATECH:C5BL/6 | |
| Genetic reagent (M. musculus) | Arrdc5 shRNA | This paper | pLKO.1-puro-CMV-tGFP vector (SHC003; Sigma Aldrich) containing target sequence 5’-CCACACCTTTGAACTTCCATTT-3’ | |
| Cell line (Homo sapiens) | HeLa | American Type Culture Collection (ATCC) | ATCC:CCL-2 | |
| Cell line (H. sapiens) | HEK293 | American Type Culture Collection (ATCC) | ATCC:CRL-1573 | |
| Cell line (H. sapiens) | HEK293T | American Type Culture Collection (ATCC) | ATCC:CRL-3216 | |
| Cell line (Drosophila melanogaster) | S2R+ | Drosophila Genomics Resource Center (DGRC) | DGRC:Stock number 150 | |
| Antibody | TXNIP (D5F3E) Rabbit mAb | Cell Signaling Technology | Cell signaling:14715 | |
| Antibody | HDAC2 (D6S5P) Rabbit mAb | Cell Signaling Technology | Cell signaling:57156 | |
| Antibody | Histone H3ac (pan-acetyl) antibody (pAb) 100 µl | Active Motif | Active Motif:39139 | |
| Antibody | normal rabbit IgG | Santa Cruz Biotechnology | Santa Cruz:sc-2027 | |
| Antibody | Rabbit TrueBlot: Anti-Rabbit IgG HRP | RockLand | RockLand:18-8816-31 | |
| Antibody | Monoclonal Anti-ATP6V1A, (C-terminal) antibody produced in mouse, clone 4 F5, purified immunoglobulin, buffered aqueous solution | Sigma Aldrich | Sigma Aldrich:SAB1402125-100UG | |
| Antibody | Goat anti-Mouse IgM (Heavy chain) Cross-Adsorbed Secondary Antibody, Alexa Fluor 594 | Invitrogen | Invitrogen:A-21044 | |
| Antibody | Rabbit Anti-Mouse IgG H&L (HRP) | Abcam | Abcam:ab6728 | |
| Antibody | Goat Anti-Rabbit IgG H&L (HRP) | Abcam | Abcam:ab6721 | |
| Antibody | α-Tubulin (DM1A) Mouse mAb | Cell Signaling Technology | Cell Signaling:3873 | |
| Antibody | Fluorescein (FITC) AffiniPure Donkey Anti-Rabbit IgG (H+L) | Jackson ImmunoResearch Laboratories | Jackson ImmunoResearch:711-095-152 | |
| Antibody | Cy3 AffiniPure Donkey Anti-Rabbit IgG (H+L) | Jackson ImmunoResearch Laboratories | Jackson ImmunoResearch:711-165-152 | |
| Antibody | HDAC2 Antibody | Cell Signaling Technology | Cell Signaling:2540 | |
| Antibody | GAPDH (D16H11) XP Rabbit mAb | Cell Signaling Technology | Cell Signaling:5174 | |
| Antibody | Lamin B1 (D9V6H) Rabbit mAb | Cell Signaling Technology | Cell Signaling:13435 | |
| Antibody | Phospho-HDAC2 (Ser394) (E8O2Z) Rabbit mAb | Cell Signaling Technology | Cell Signaling:69238 | |
| Antibody | MTA1 (D40D1) XP Rabbit mAb | Cell Signaling Technology | Cell Signaling:5647 | |
| Antibody | MBD3 (N87) Antibody | Cell Signaling Technology | Cell Signaling:14540 | |
| Antibody | ATP6V1B2 (D2F9R) Rabbit mAb | Cell Signaling Technology | Cell Signaling:14617 | |
| Antibody | Anti-rabbit IgG, HRP-linked Antibody | Cell Signaling Technology | Cell Signaling:7074 S | |
| Antibody | Anti-mouse IgG, HRP-linked Antibody | Cell Signaling Technology | Cell Signaling:7076 S | |
| Antibody | GAPDH (G-9) | Santa Cruz Biotechnology | Santa Cruz:sc-365062 | |
| Recombinant DNA reagent | pCR8/GW/TOPO TA cloning kit | Thermo Fisher Scientific | Thermo Fisher:K250020 | |
| Recombinant DNA reagent | pMK33-Gateway-GFP destination vector | Kwon et al., 2013 | pMK33 | |
| Recombinant DNA reagent | pHAGE-GFP-Gateway destination vector | Other | Gift from Dr. Chanhee Kang at Seoul National University | |
| Recombinant DNA reagent | PEIPro DNA transfection reagent | VWR international | VWR:115010 | |
| Recombinant DNA reagent | Gateway LR Clonase II enzyme mix | Thermo Fisher Scientific | Thermo Fisher:11791020 | |
| Sequence-based reagent | α-tubulin RT-qPCR primers | This paper | "Forward:CTGGACCGCATCTCTGTGTACT;Reverse:GCCAAAAGGACCTGAGCGAACA" | |
| Sequence-based reagent | TXNIP RT-qPCR primers | This paper | "Forward:GCTCCTCCCTGCTATATGGAT;Reverse:AGTATAAGTCGGTGGTGGCAT" | |
| Sequence-based reagent | CD22 RT-qPCR primers | This paper | "Forward:GCGCAGCTTGTAATAGTTGGTGC;Reverse:CACATTGGAGGCTGACCGAGTT" | |
| Sequence-based reagent | L1CAM RT-qPCR primers | This paper | "Forward:TCGCCCTATGTCCACTACACCT;Reverse:ATCCACAGGGTTCTTCTCTGGG" | |
| Sequence-based reagent | OTULINL RT-qPCR primers | This paper | "Forward:GTGTGGAGGCAGAGGTTGAT;Reverse:ATGCCGCCAAAATAGCTCCT" | |
| Sequence-based reagent | PRR5L RT-qPCR primers | This paper | "Forward:GCGGCTGTTGAAGAGTGAAC;Reverse:AGCCAGAACCTCAATGCGAT" | |
| Sequence-based reagent | SDC3 RT-qPCR primers | This paper | "Forward:CTCCTGGACAATGCCATCGACT;Reverse:TGAGCAGTGTGACCAAGAAGGC" | |
| Sequence-based reagent | GAPDH1 RT-qPCR primers | This paper | "Forward:ATCACCATCTTCCAGGAGCGA;Reverse:CCTTCTCCATGGTGGTGAAGAC" | |
| Sequence-based reagent | CD22 ChIP-qPCR primers | This paper | "Forward#1:CGCTGGAGAAGTGAGTTCGG;Reverse#1:TCCCTGCCTCCACTGATAGC", "Forward#2:GACGCTGAGATGAGGGTTGG;Reverse#2:TGACTCAGGAGGTTGGCAGA", "Forward#3:TCCCCACTCTTCTCGCTCTC;Reverse#3:ATTTGCGAGGTTGAGGTTGTC" | |
| Sequence-based reagent | L1CAM ChIP-qPCR primers | This paper | "Forward#1:CAGCTCAGTGCCTCATGGAA;Reverse#1:GAGACTGCTTCCAGAGTGGG", "Forward#2:GGAATGCTTCACTGGGCAAC;Reverse#2:GGGGTAAGAATTCCGGAGCC", "Forward#3:CGTGTCTGAGAAAGGAAGCCA;Reverse#3:CGGCTTATCCCGATCTACCC" | |
| Sequence-based reagent | TXNIP siRNA | Bioneer (Dajeon, South Korea) | "Sense: 5’-GUCAGUCACUCUCAGCCAUdTdT–3';Anti-sense: 5'-AUGGCUGAGAGUGACUGACdTdT-3'" | |
| Sequence-based reagent | AccuTarget Negative control siRNA | Bioneer (Dajeon, South Korea) | ||
| Peptide, recombinant protein | Recombinant Human M-CSF | PeproTech | PeproTech:300–25 | |
| Peptide, recombinant protein | Recombinant Mouse TRANCE/RANK L/TNFSF11 | R&D Systems | R&D Systems:462-TEC | |
| Peptide, recombinant protein | Bafilomycin A1 | Sigma Aldrich | Sigma Aldrich:19–148 | |
| Commercial assay or kit | Pierce BCA Protein Assay Kit | Thermo Fisher Scientific | Thermo Fisher:23225 | |
| Commercial assay or kit | The ChIP-IT High Sensitivity (HS) Kit | Active Motif | Active Motif:53040 | |
| Commercial assay or kit | Effectene Transfection Reagent | Qiagen | Qiagen:301425 | |
| Commercial assay or kit | NE-PER Nuclear and Cytoplasmic Extraction Reagents | Thermo Fisher Scientific | Thermo Fisher:78833 | |
| Commercial assay or kit | Lipofectamine RNAiMAX | Invitrogen | Invitrogen:13778075 | |
| Commercial assay or kit | CRISPR & MISSION Lentiviral Packaging Mix | Sigma Aldrich | Sigma Aldrich:SHP002 | |
| Commercial assay or kit | TRAP Staining Kit | Cosmo Bio Co., LTD | Cosmo Bio:PMC-AK04F-COS | |
| Commercial assay or kit | dentin discs | Immunodiagnostic Systems (IDS) | IDS:AE-8050 | |
| Commercial assay or kit | ReverTra Ace qPCR RT Kit | Toyobo | Toyobo:FSQ-101 | |
| Commercial assay or kit | GoScript Reverse Transcriptase | Promega | Promega:A5001 | |
| Commercial assay or kit | TruSeq Stranded mRNA Sample Prep Kit | Illumina | Illumina:RS-122–2101 | |
| Commercial assay or kit | SuperScript II reverse transcriptase | Invitrogen | Invitrogen:18064014 | |
| Commercial assay or kit | Illumina Tagment DNA TDE1 Enzyme and Buffer Kits | Illumina | Illumina:20034197 | |
| Commercial assay or kit | Nextera DNA Flex kit | Illumina | Illumina#20018704 | |
| Commercial assay or kit | MinElute PCR purification Kit | Qiagen | Qiagen#28004 | |
| Commercial assay or kit | Mycoplasma PCR Detection Kit | abm | abm#G238 | |
| Commercial assay or kit | e-Myco plus Mycoplasma PCR Detecting Kit | iNtRON Biotechnology | iNtRON#25237 | |
| Chemical compound, drug | Histopaque | Sigma Aldrich | Sigma Aldrich:1077 | |
| Software, algorithm | SAINTexpress | Teo et al., 2014 | Version 3.6.1 | |
| Software, algorithm | COMPLEAT | Vinayagam et al., 2013 | ||
| Software, algorithm | DAVID | Huang et al., 2009a; Huang et al., 2009b | ||
| Software, algorithm | DIOPT | Hu et al., 2011 | Version 7.1 | |
| Software, algorithm | Cytoscape | Shannon et al., 2003 | Version 3.5.1 and 3.8.2 | |
| Software, algorithm | ENCODE ATAC-seq pipeline | Jin-Wook et al., 2018 | Version 1.9.2 | |
| Software, algorithm | FastQC | Andrews, 2010 | Version 0.11.8 | |
| Software, algorithm | Sickle | Joshi and Fass, 2011 | Version 1.33 | |
| Software, algorithm | STAR | Dobin et al., 2013 | Version 2.5.3a | |
| Software, algorithm | RSEM | Li and Dewey, 2011 | Version 1.3.1 | |
| Software, algorithm | Comet search engine | Eng et al., 2013 | ||
| Software, algorithm | T-COFFEE | Notredame et al., 2000 | ||
| Software, algorithm | RAxML | Stamatakis, 2014 | Version 8.2.11 | |
| Software, algorithm | g:Profiler | Raudvere et al., 2019 | ||
| Software, algorithm | REVIGO | http://revigo.irb.hr/ | RRID:SCR_005825 | |
| Software, algorithm | Python | https://www.python.org/ | RRID:SCR_008394 | Version 2.7.14 and 3.6.12 |
| Software, algorithm | R | https://www.r-project.org/ | RRID:SCR_001905 | Version 4.0.2 |
Additional files
-
Supplementary file 1
List of α-arrestins from human and Drosophila.
Information about α-arrestin proteins from human (A) and Drosophila (B).
- https://cdn.elifesciences.org/articles/88328/elife-88328-supp1-v1.xlsx
-
Supplementary file 2
Evaluation sets of α-arrestins protein–protein interactions (PPIs).
Positive and negative PPIs of α-arrestins for human (A, B) and Drosophila (C, D), respectively.
- https://cdn.elifesciences.org/articles/88328/elife-88328-supp2-v1.xlsx
-
Supplementary file 3
Summary tables of Significance Analysis of INTeractome express (SAINTexpress) results.
Summary tables of SAINTexpress results for human (A) and Drosophila (B).
- https://cdn.elifesciences.org/articles/88328/elife-88328-supp3-v1.xlsx
-
Supplementary file 4
Protein domains and short-linear motifs in the α-arrestin interactomes.
Summary of protein domains and short-linear motifs annotated in the interactome of each α-arrestin for human (A, B) and Drosophila (D, E). Annotated interactions between the short-linear motifs in α-arrestins and protein domains in the interactomes from the ELM database are also summarized for human (C) and Drosophila (F).
- https://cdn.elifesciences.org/articles/88328/elife-88328-supp4-v1.xlsx
-
Supplementary file 5
Enriched Pfam domains in the α-arrestin interactomes.
Results of enrichment test of Pfam domains in the interactome of each α-arrestin for human (A) and Drosophila (B).
- https://cdn.elifesciences.org/articles/88328/elife-88328-supp5-v1.xlsx
-
Supplementary file 6
Subcellular localizations of α-arrestin interactomes.
Summary tables of subcellular localizations of α-arrestins interactomes for human (A) and Drosophila (B).
- https://cdn.elifesciences.org/articles/88328/elife-88328-supp6-v1.xlsx
-
Supplementary file 7
Summary of protein complexes and cellular components associated with α-arrestins.
Results of the protein complex enrichment analysis tool (COMPLEAT) and enrichment test of cellular component GO terms for human (A, B) and Drosophila (C, D).
- https://cdn.elifesciences.org/articles/88328/elife-88328-supp7-v1.xlsx
-
Supplementary file 8
Orthologous relationship of α-arrestin interactomes between human and Drosophila.
Predictions of orthologs for α-arrestins and their interacting proteins between human and Drosophila using DIOPT (A, B). Results of enrichment test of GO terms (biological process, molecular functions, and BP, MF, and KEGG pathway) in the identified orthologs are also summarized for human (C) and Drosophila (D).
- https://cdn.elifesciences.org/articles/88328/elife-88328-supp8-v1.xlsx
-
Supplementary file 9
Summary of ATAC- and RNA-seq read counts before and after processing.
For ATAC-seq, the number of properly paired reads, filtered/deduplicated reads, and identified narrow peaks is summarized. For RNA-seq, the number of filtered and alignable reads is summarized. *Filtered/dedup reads, filtered/deduplicated reads.
- https://cdn.elifesciences.org/articles/88328/elife-88328-supp9-v1.xlsx
-
Supplementary file 10
Differential accessibility of accessible chromatin regions (ACRs) and gene expression.
Summary of differential accessibility of ACRs (A) and gene expression (B) between control and TXNIP-depleted condition in HeLa cells.
- https://cdn.elifesciences.org/articles/88328/elife-88328-supp10-v1.xlsx
-
Supplementary file 11
Summary of ATAC-seq peaks located in promoters and gene expression level.
(A) Profiles of ATAC-seq peaks located in promoters of genes. Changes in peak intensities and gene expression levels are also summarized. (B) List of genes that exhibited decreased chromatin accessibility at their promoter and decreased RNA expression upon TXNIP knockdown.
- https://cdn.elifesciences.org/articles/88328/elife-88328-supp11-v1.xlsx
-
Supplementary file 12
Authentication of cell lines and mouse-derived bone marrow-derived macrophages (BMMs).
The STR analysis report for the HeLa cell line and mycoplasma test results for all cell lines utilized in this study are provided as distinct files. Additionally, the genetic and health monitoring report for the C5BL/6 mouse strain from KOATECH is included.
- https://cdn.elifesciences.org/articles/88328/elife-88328-supp12-v1.zip
-
MDAR checklist
- https://cdn.elifesciences.org/articles/88328/elife-88328-mdarchecklist1-v1.docx
Download links
A two-part list of links to download the article, or parts of the article, in various formats.
Downloads (link to download the article as PDF)
Open citations (links to open the citations from this article in various online reference manager services)
Cite this article (links to download the citations from this article in formats compatible with various reference manager tools)
Comparative interactome analysis of α-arrestin families in human and Drosophila
eLife 12:RP88328.
https://doi.org/10.7554/eLife.88328.4


