Structural basis of EHEP-mediated offense against phlorotannin-induced defense from brown algae to protect akuBGL activity
- Faculty of Advanced Life Science, Hokkaido University, Japan
- Graduate School of Bioscience and Bioindustry, Tokushima University, Japan
Figures
Figure 1 with 1 supplement
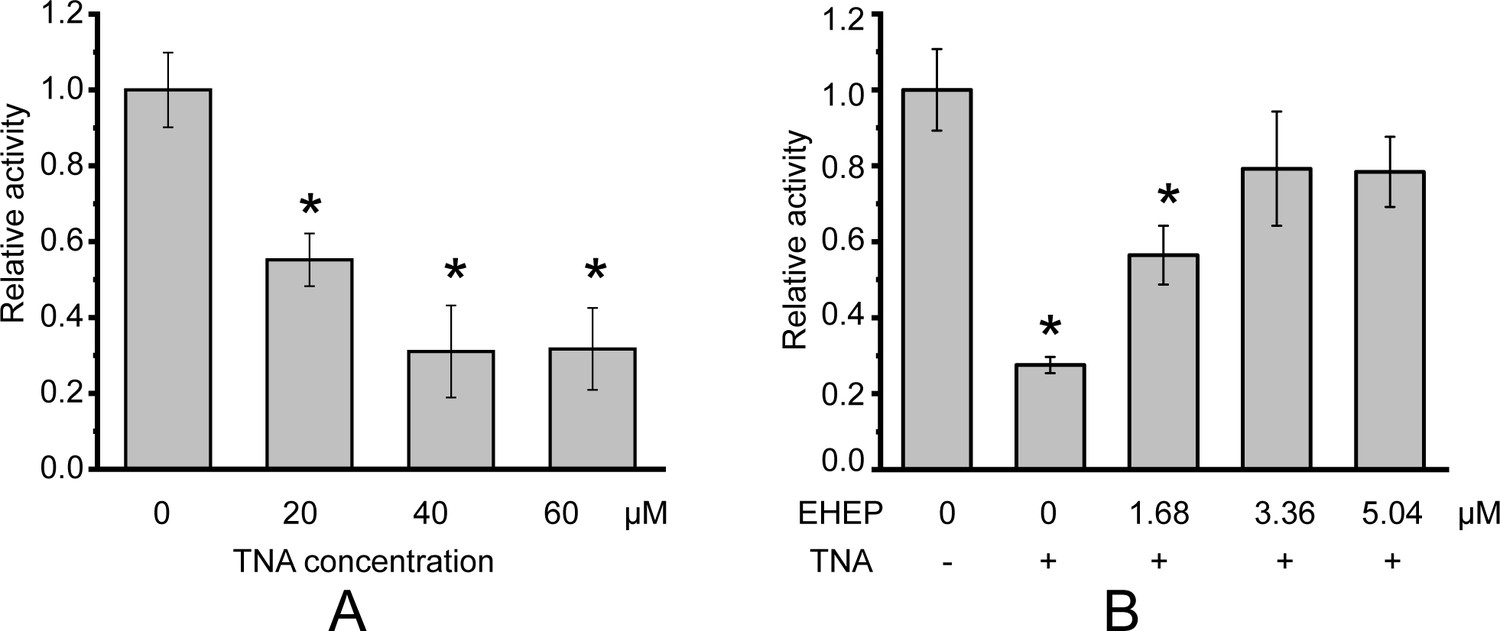
Galactoside hydrolytic activity of akuBGL toward 2.5 mM ortho-nitrophenyl-β-galactoside.
Activity (%) is shown as the fold increase relative to akuBGL without the addition of tannic acid (TNA) or Eisenia hydrolysis-enhancing protein (EHEP). (A) The hydrolytic activity of akuBGL (0.049 μM) with TNA at different concentrations. (B) The hydrolytic activity of akuBGL (0.049 μM) with 40 μM TNA and EHEP at different concentrations. The average and standard deviation of the relative activity were estimated from three independent replicates (N = 3). Asterisks in the top of error bars indicated significant (p<0.005) differences by t-test in comparison with 0 μM TNA (A) or 0 μM EHEP and no TNA (B).
Figure 1—figure supplement 1
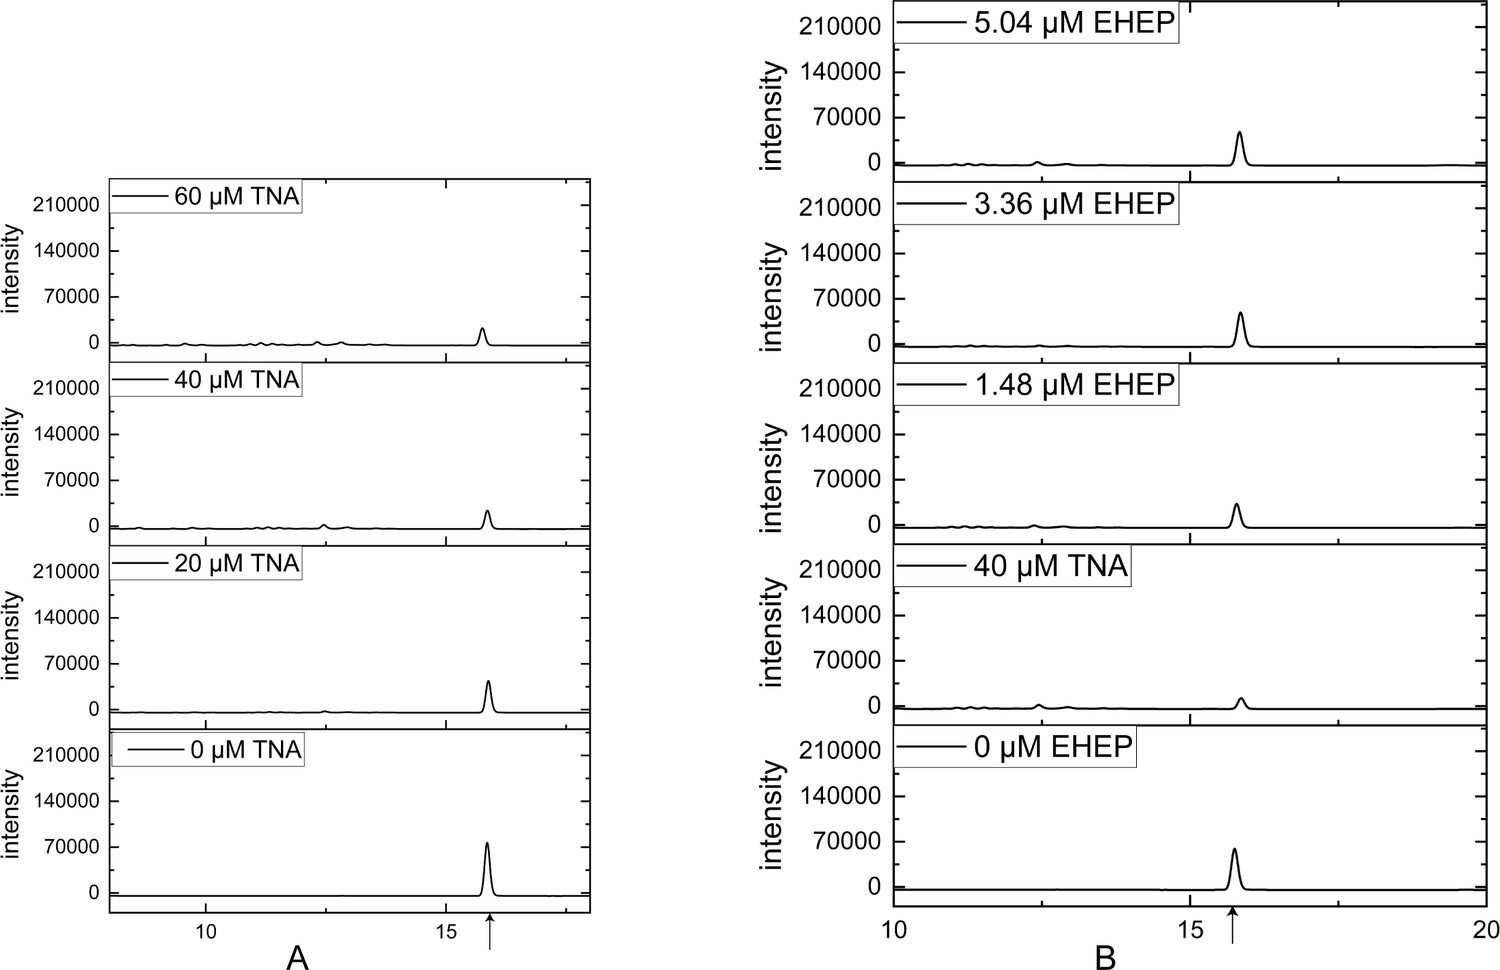
High-performance liquid chromatography (HPLC) profiles of akuBGL activity toward ortho-nitrophenyl-β-galactoside.
(A) Tannic acid (TNA) inhibition akuBGL by increasing the concentration of TNA with 0.049 μM akuBGL and 2.5 mM ortho-nitrophenyl-β-galactoside. (B) Eisenia hydrolysis-enhancing protein (EHEP) protects akuBGL from TNA inhibition by increasing the concentration of EHEP. The product peak was marked by a black arrow.
Figure 2 with 1 supplement
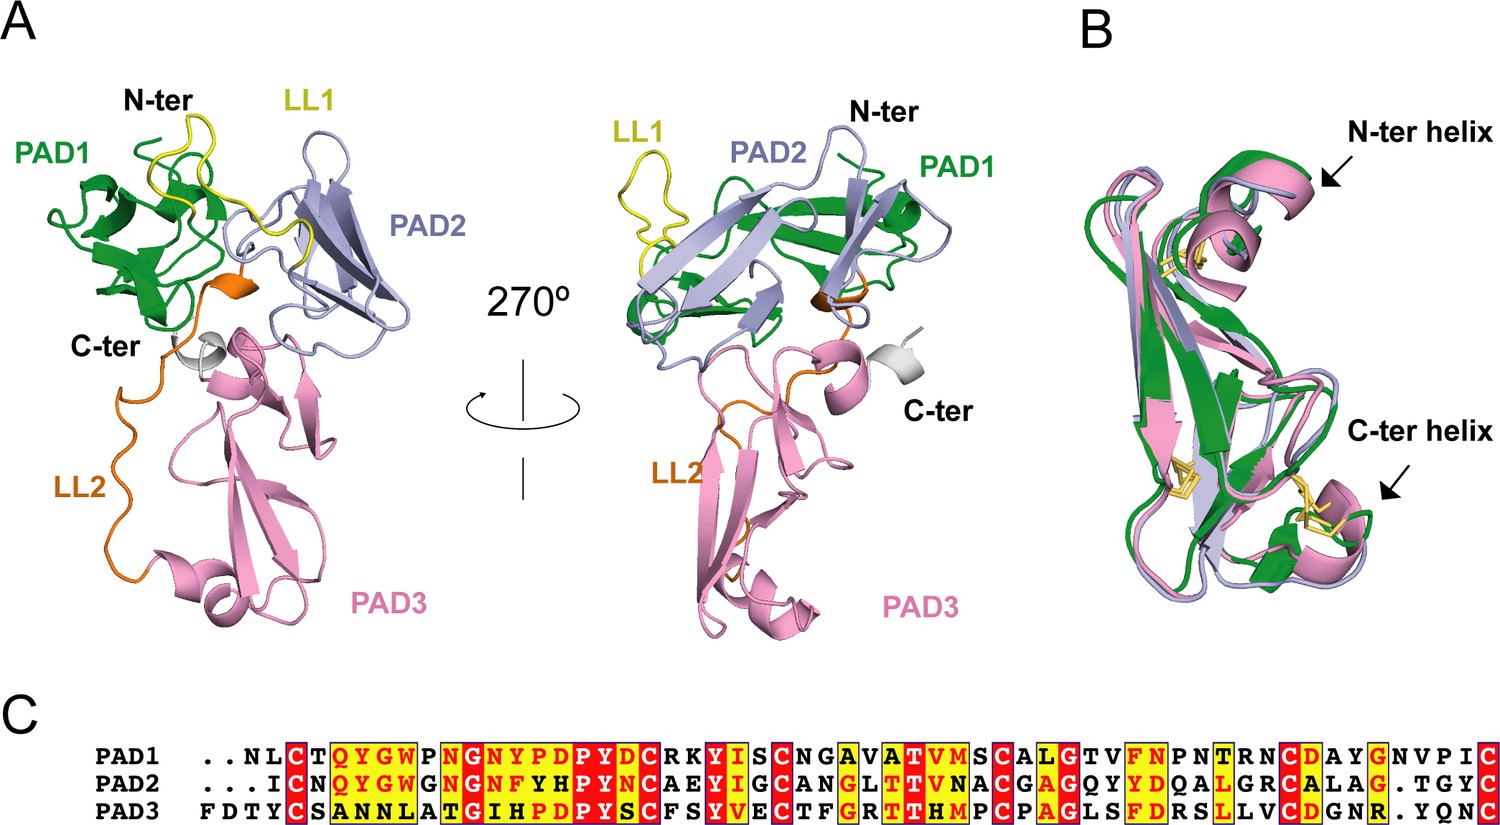
Eisenia hydrolysis-enhancing protein (EHEP) structure.
(A) Cartoon representation of EHEP. The three peritrophin-A domains (PADs) are colored green, light blue, and pink, respectively. Linker long loop1 (LL1) and loop2 (LL2) are colored yellow and blue. (B) Structural superposition of the three PAD domains of EHEP. The three domains are colored as in (A). The disulfide bonds are shown as yellow sticks. (C) Sequence alignment of three PAD domains. Alignment was performed by CLUSTALW and displayed with ESPript3.
Figure 2—figure supplement 1
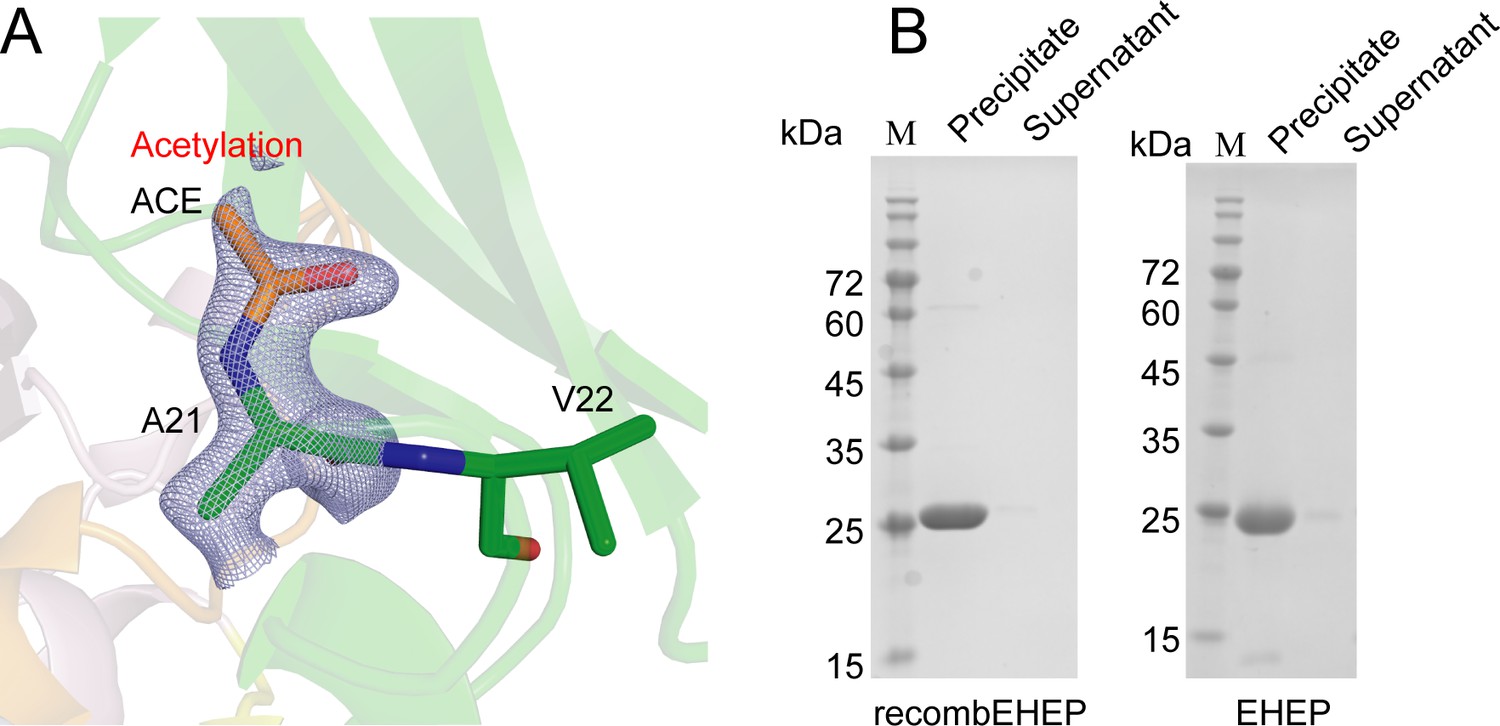
Acetylation modification of Eisenia hydrolysis-enhancing protein (EHEP).
(A) Acetylation modification on the N-terminal residue A21. The structure is shown as sticks with an omitted map of the acetylation of A21 at a 3.3 σ level (blue-white). (B) Tannic acid (TNA)-binding activity of recomEHEP and EHEP. Sodium dodecyl sulfate–polyacrylamide gel electrophoresis (SDS–PAGE) was run using a mixture of recomEHEP/EHEP and TNA.
-
Figure 2—figure supplement 1—source data 1
recomEHEP and Eisenia hydrolysis-enhancing protein (EHEP) activity.
- https://cdn.elifesciences.org/articles/88939/elife-88939-fig2-figsupp1-data1-v1.zip
Figure 3 with 1 supplement
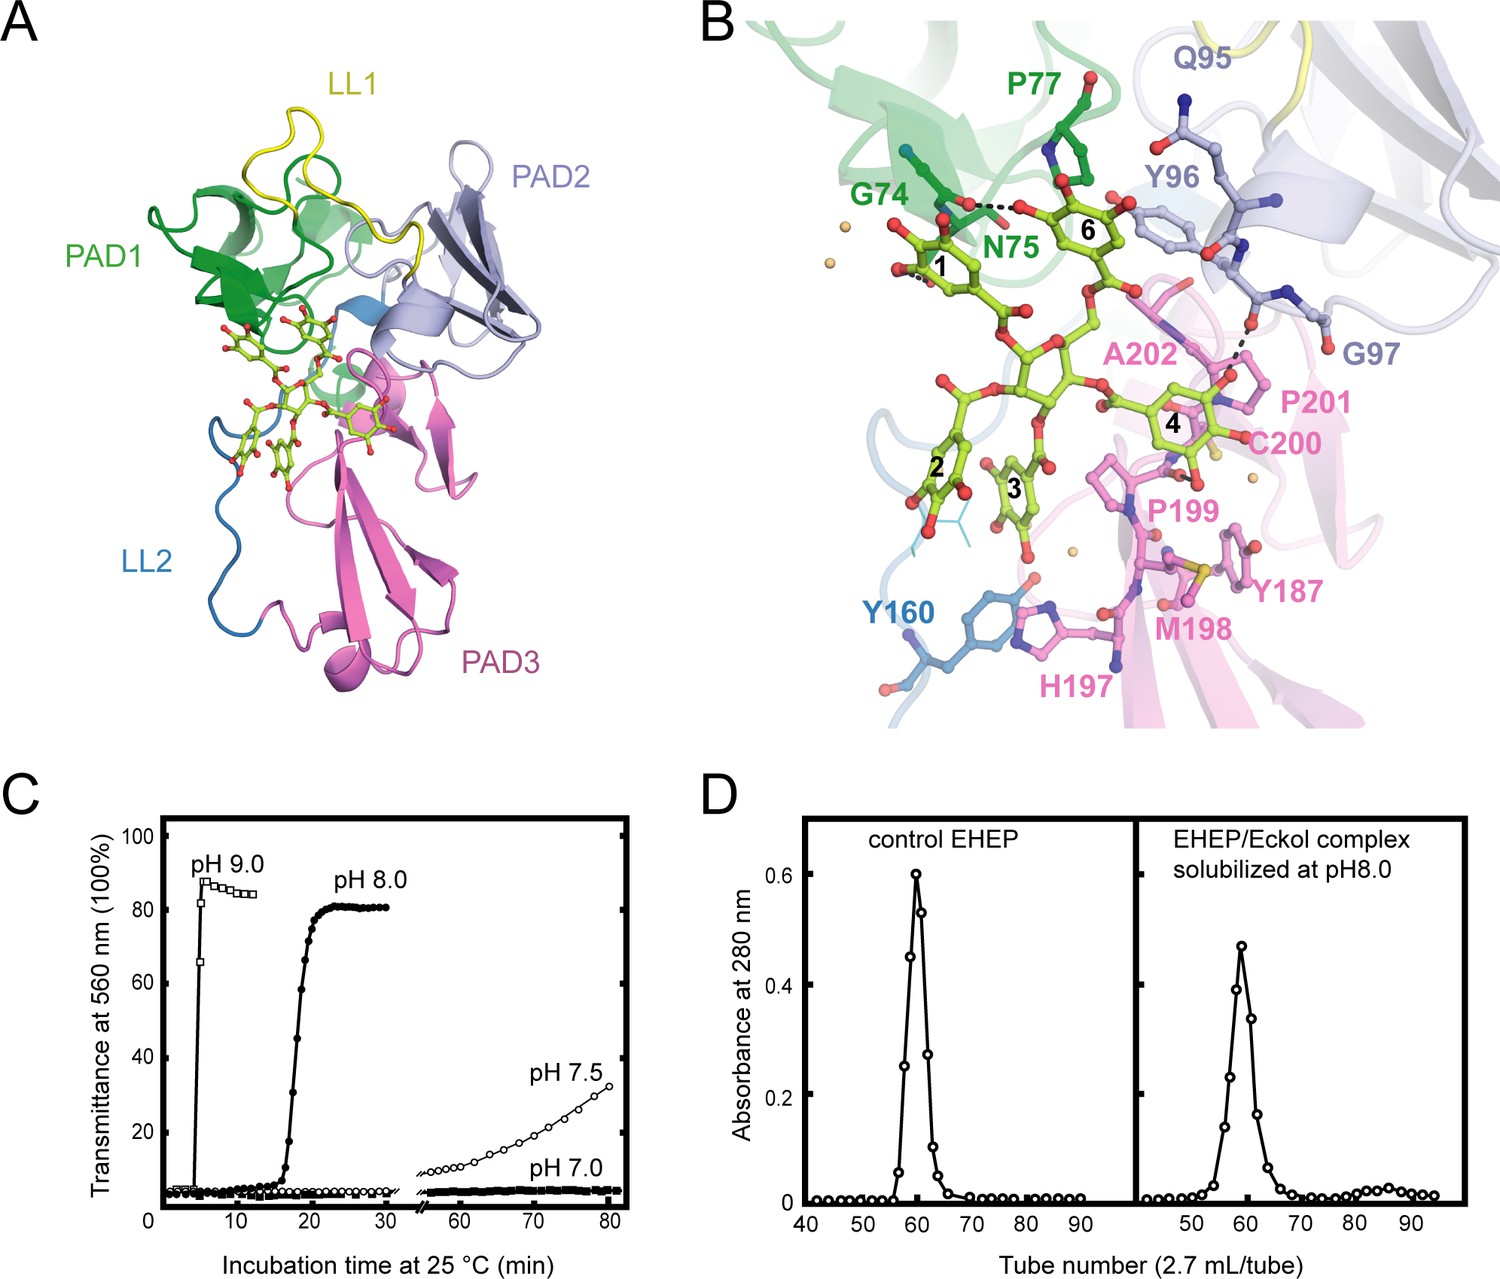
Structure of Eisenia hydrolysis-enhancing protein (EHEP)–tannic acid (TNA).
(A) The overall structure of EHEP–TNA. (A) The overall structure of EHEP–TNA. EHEP and TNA are shown by the cartoon and stick model, respectively. EHEP is colored as in Figure 1. The C and O atoms of TNA are colored lemon and red, respectively. (B) Interaction of TNA (ball-stick in the same color as (A)) with EHEP (cartoon in the same color as (A)) in EHEP–TNA structure. The residues of EHEP in contact are labeled and shown by a ball-stick with N, O, and S atoms in blue, red, and brown, respectively. The C and O atoms of TNA are colored the same as (A), lemon, and red, respectively. Dashed lines show hydrogen bonds. The water molecules stabilizing TNA were shown as light orange spheres. (C) Effect of pH on resolubilization of an EHEP–eckol precipitate. Buffers with pH 9.0, 8.0, 7.5, and 7.0 are presented as hollow square, solid circle, hollow circle, and solid square, respectively. (D) The EHEP–eckol precipitate was dissolved in 50 mM Tris–HCl (pH 8.0) and analyzed using a gel filtration column of Sephacryl S-100.
Figure 3—figure supplement 1
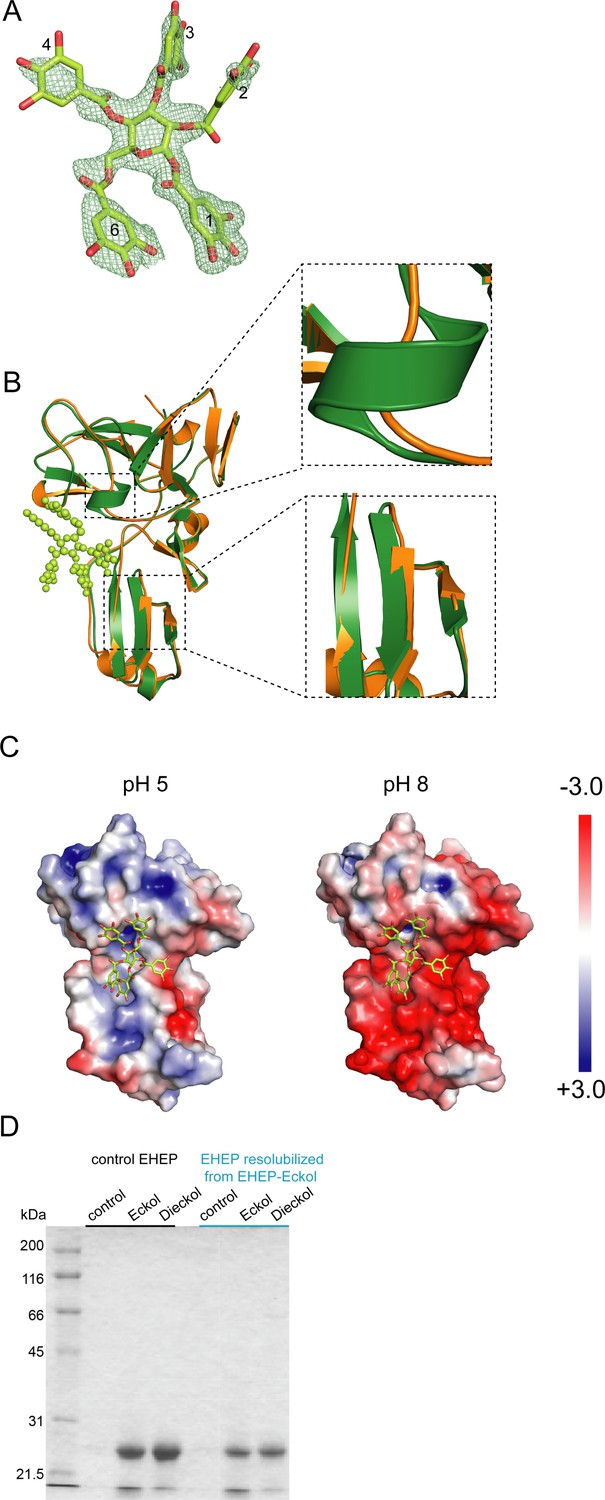
Eisenia hydrolysis-enhancing protein (EHEP)–tannic acid (TNA) structure and structural comparisons.
(A) TNA structure (stick model) in EHEP–TNA with an omitted map countered at the 2.0 σ level. The O and C atoms are colored red and lemon, respectively. (B) Structure superposition of apo EHEP (green) with EHEP–TNA (orange). The conformational changes are marked by black dotted boxes and zoomed on the right. (C) Electrostatic potential of the EHEP surface in the EHEP–TNA complex at different pH values, which were calculated using the APBS-PDB2PQR software suite. (D) Activity of the resolubilized EHEP. The EHEP–eckol precipitate was resolubilized in Tris–HCl (pH 8.0) buffer, and then the supernatant was purified using a Sephacryl S-100 HR column (2.0 × 110 cm) to measure eckol-/dieckol-binding activity.
-
Figure 3—figure supplement 1—source data 1
Resolubilized Eisenia hydrolysis-enhancing protein (EHEP) activity.
- https://cdn.elifesciences.org/articles/88939/elife-88939-fig3-figsupp1-data1-v1.zip
Figure 4 with 3 supplements
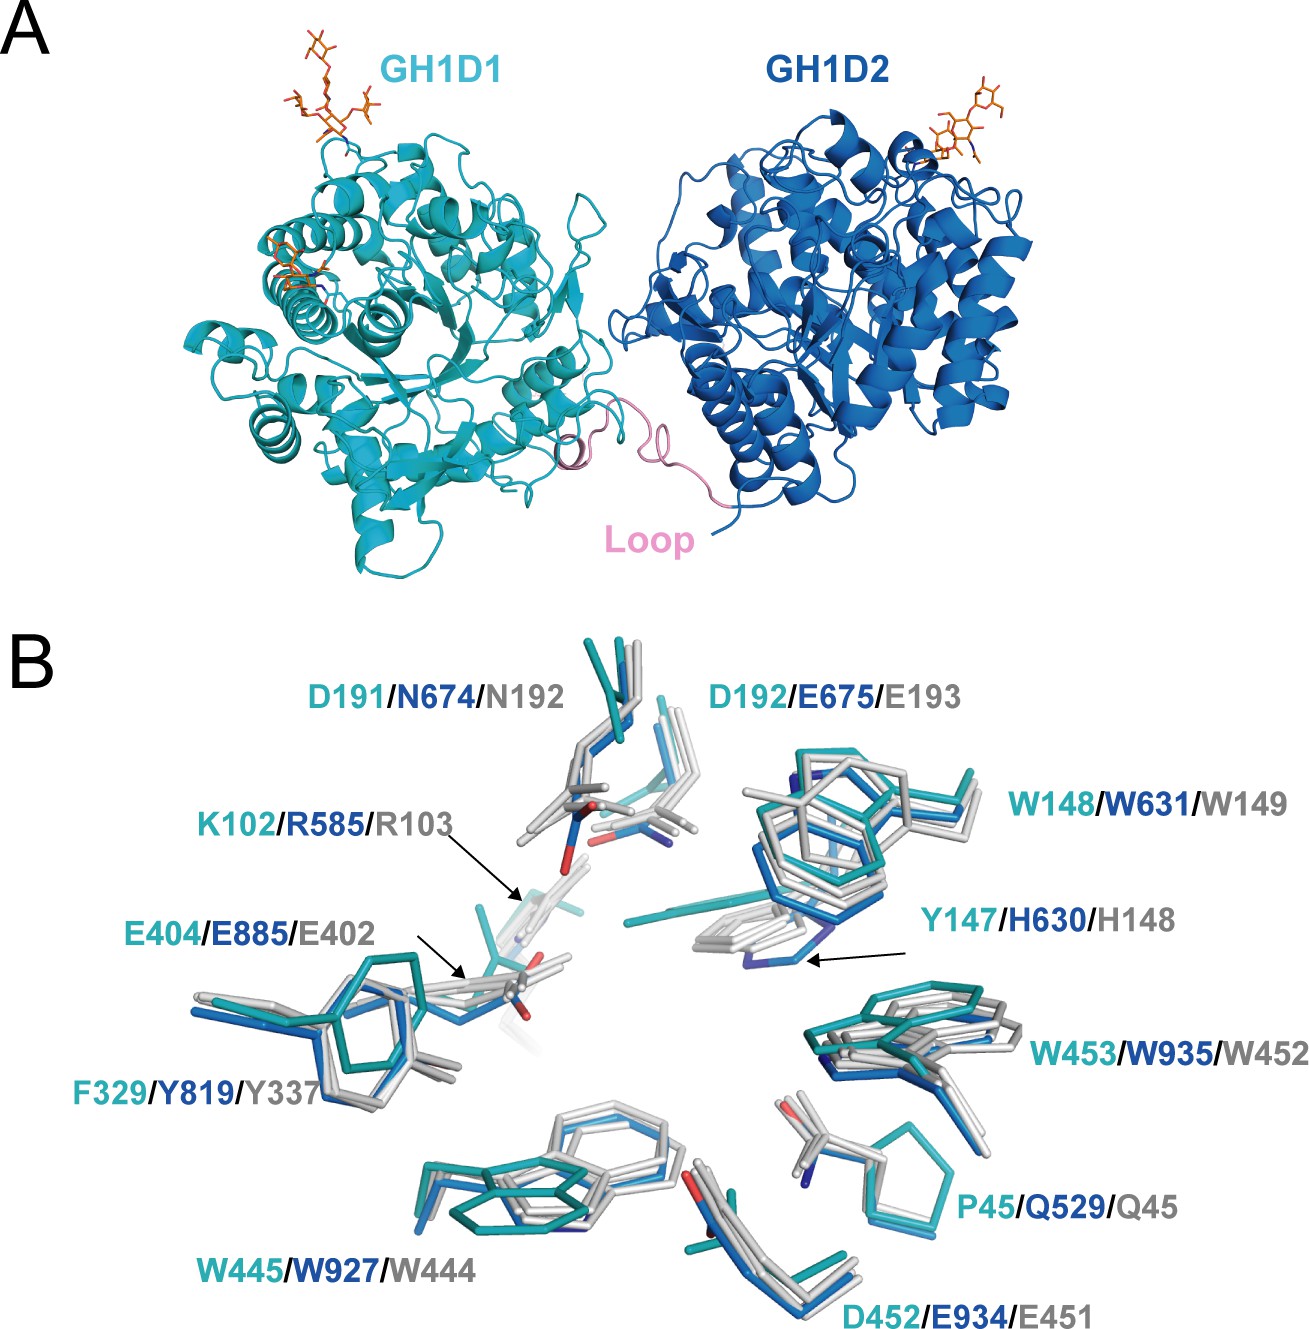
Structure of akuBGL.
(A) Overall structure. The GH1D1 (light blue) and GH1D2 (cyan) domains are linked by a long loop (linker loop) colored in pink. The N-linked glycans were shown in the orange stick. (B) Residues superposition of the glycone-binding site (GBS) and catalysis-related residue (CR) site of the domains GH1D1 (cyan), GH1D2 (light blue) with β-glucosidase structures from termite Neotermes koshunensis (NkBGL, gray PDB ID 3VIH) (Jeng et al., 2012), β-glucosidase from rice (OsBGL, gray, PDB ID 2RGL) (Chuenchor et al., 2008), and β-glucosidase from Bacillus circulans sp. Alkalophilus (gray, PDB ID 1QOX) (Hakulinen et al., 2000). Only the residue numbers of GH1D1 (cyan), GH1D2 (light blue), and NkBGL (gray) are shown for clarity.
Figure 4—figure supplement 1
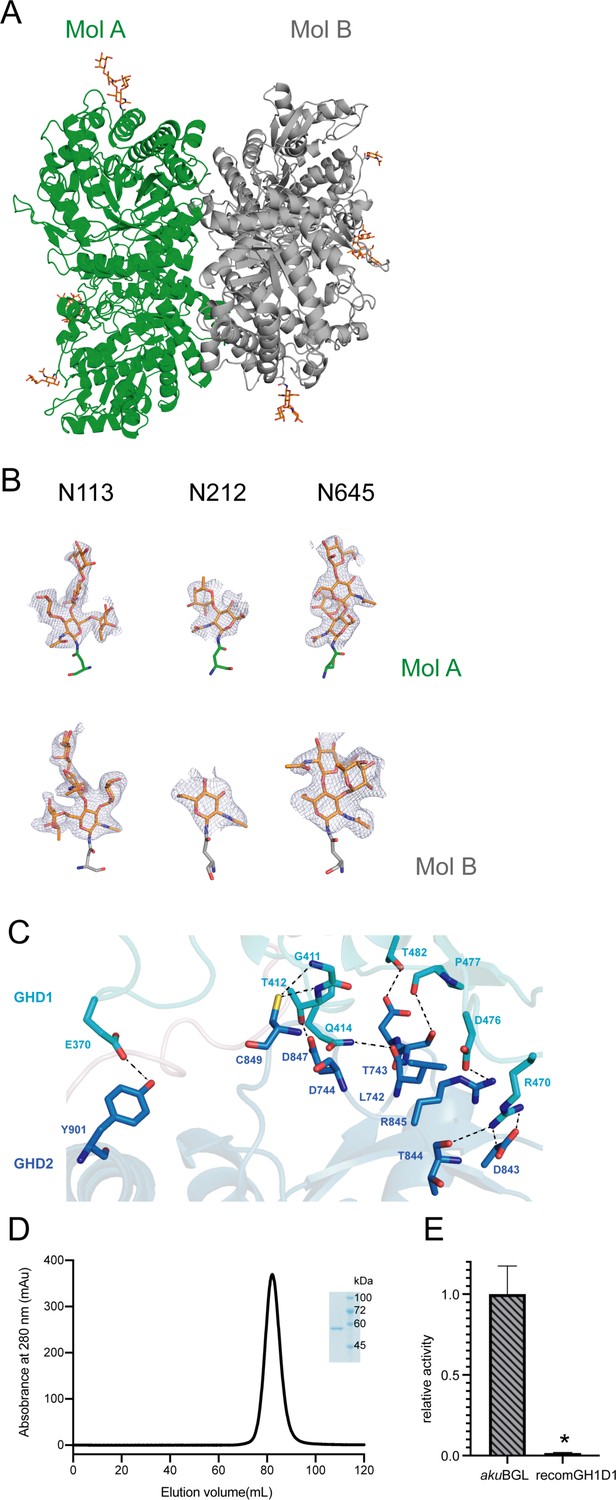
akuBGL structure.
(A) Two akuBGL molecules in the asymmetric unit, colored green and gray, respectively. The glycosylation sites are shown as orange sticks, with O and N atoms in red and blue, respectively. (B) The glycosylation chains with omitted density maps are countered at the 2.0 σ level. (C) The interface between the GH1D1 (cyan) and GH1D2 (blue). The key interactions between the two domains are shown as black dashed lines. (D) Size-exclusion chromatogram of the purified GH1D1 domain. The inset shows the sodium dodecyl sulfate–polyacrylamide gel electrophoresis (SDS–PAGE) analysis of the GH1D1 domain. (E) Galactoside hydrolytic activity of the recomGH1D1 toward ortho-nitrophenyl-β-galactoside. The average and standard deviation of the relative activity were estimated from three independent replicates (N = 3). Asterisks in the top of error bars indicated significant (p<0.001) differences by t-test in comparison with akuBGL.
-
Figure 4—figure supplement 1—source data 1
Sodium dodecyl sulfate–polyacrylamide gel electrophoresis (SDS–PAGE) of recomGH1D1.
- https://cdn.elifesciences.org/articles/88939/elife-88939-fig4-figsupp1-data1-v1.zip
Figure 4—figure supplement 2
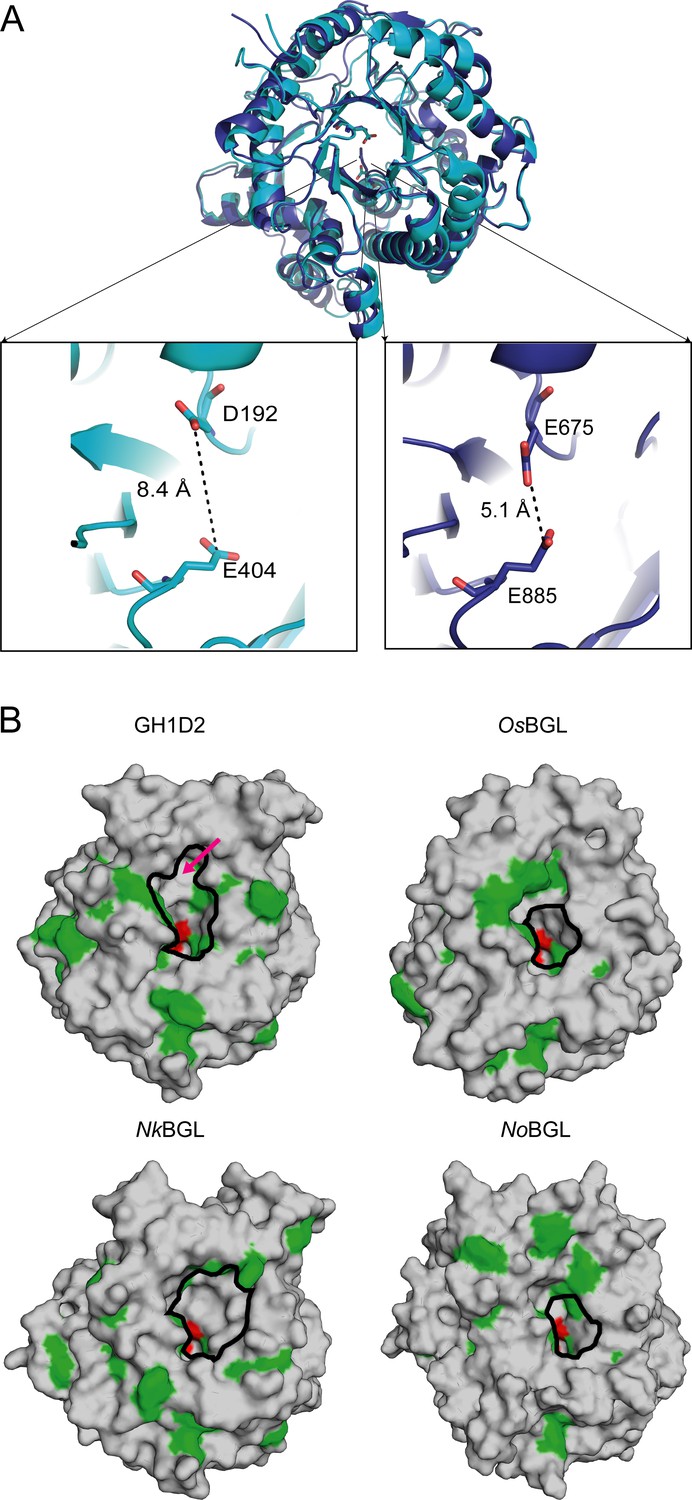
Structural comparison of BGLs.
(A) Structure superposition of GH1D1(cyan) and GH1D2 (blue). The enlarged picture shows the distance of conceivable catalytic residues in GH1D1 and GH1D2. (B) Surface representations of GH1D2, NkBGL (PDB ID 3VIH) (Jeng et al., 2012), OsBGL (PDB ID 2RGL) (Chuenchor et al., 2008), and NoBGL (PDB ID 5YJ7) (Dong et al., 2021) with the aromatic and catalytic residues colored green and red, respectively. The red arrow indicates the location of the auxiliary site of GH1D2. The active pockets are highlighted by a black circle on each surface.
Figure 4—figure supplement 3
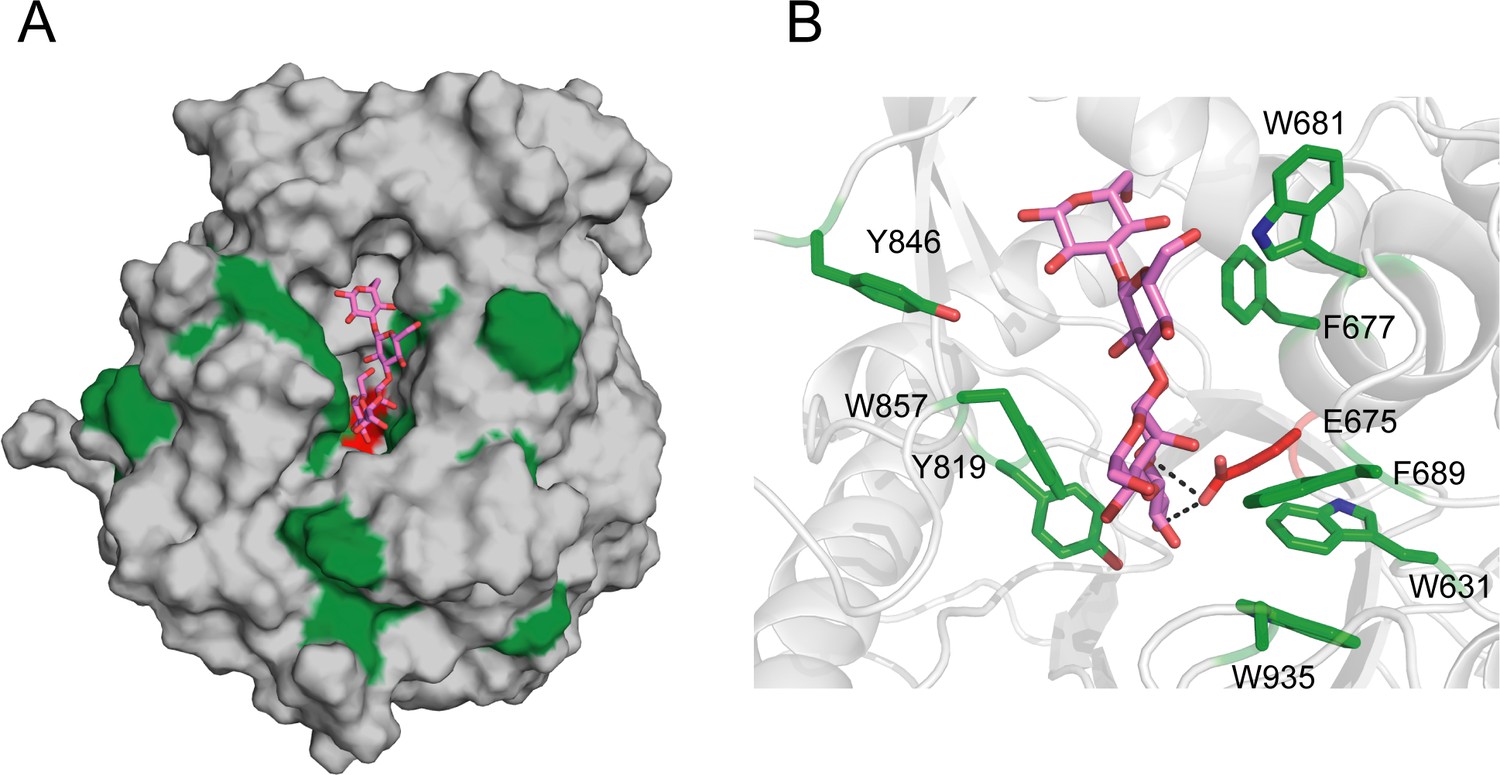
The model of GH1D2 docking with the substrate laminaritetraose.
(A) Overall model of GH1D2-laminaritetraose. GH1D2 is shown as a grey surface representation and laminaritetraose as marine sticks. The aromatic and catalytic residues of GH1D2 are colored green and red, respectively. (B) The closeup review of interaction between laminatrtetraose and GH1D2 with key residues showing in sticks.
Figure 5 with 1 supplement
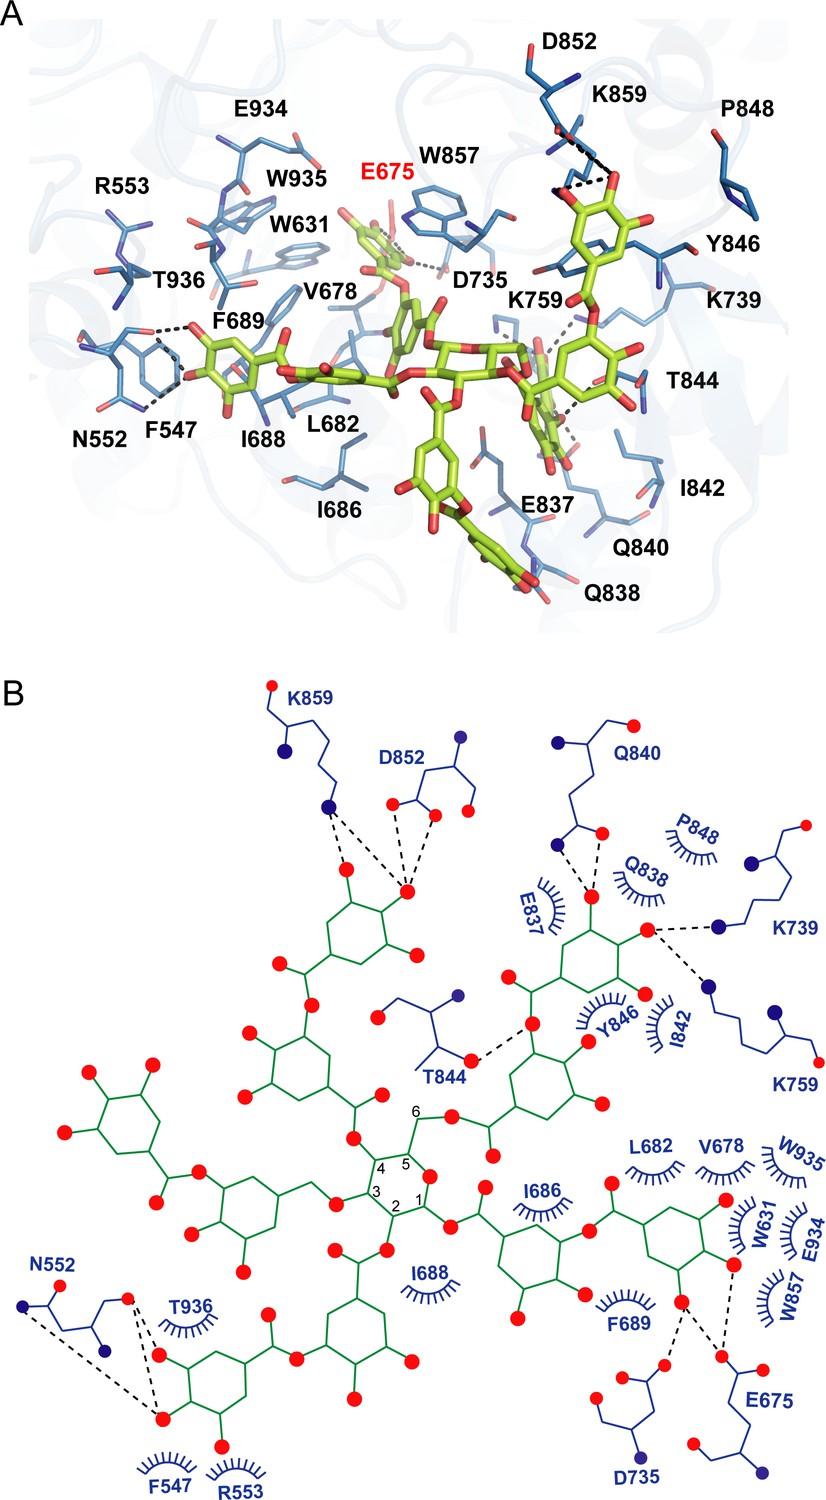
Docking model of akuBGL with tannic acid (TNA).
(A) Detailed interaction between akuBGL and TNA in the docking model. TNA is shown in the green stick model. The hydrogen bonds are shown as dashed lines. (B) A 2D diagram of the interaction between akuBGL and TNA shown in (A). The hydrogen bonds are shown as dashed lines, and the hydrophobic contacts as circular arcs.
Figure 5—figure supplement 1
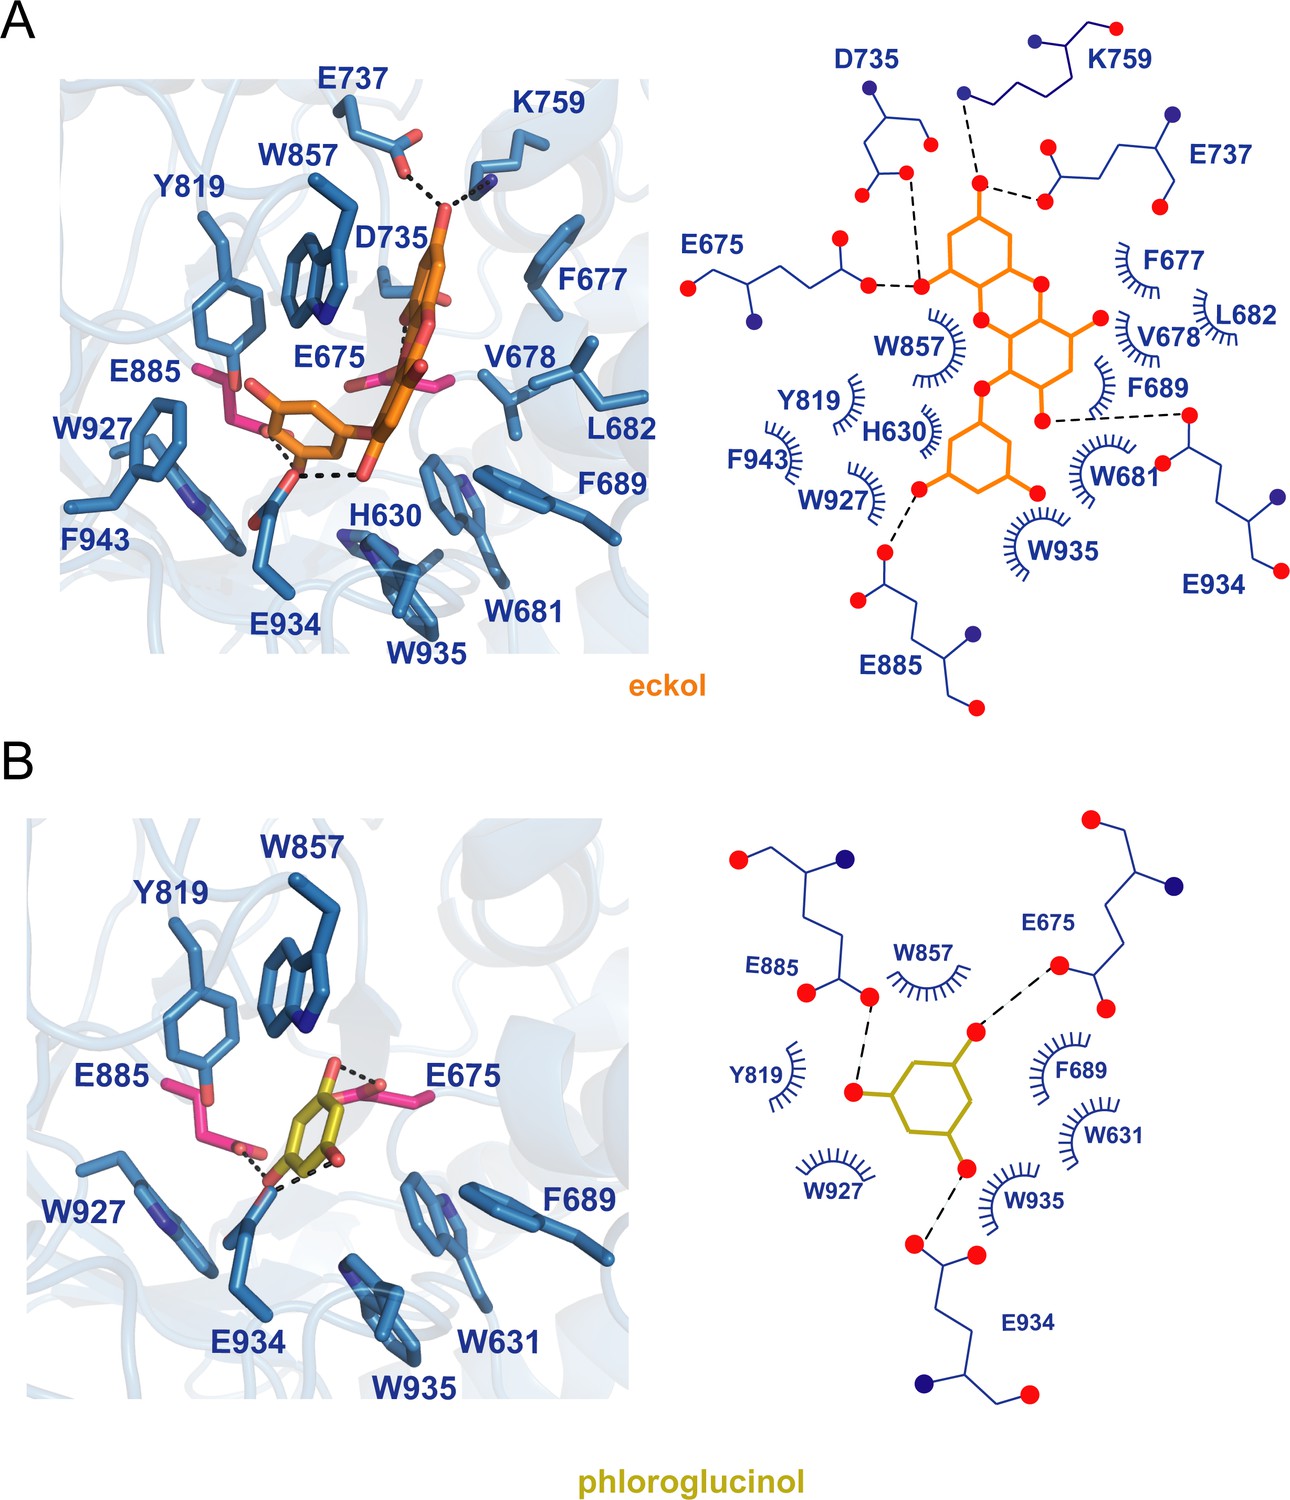
The models of GH1D2 docking.
(A) With eckol, and (B) With phloroglucinol. The left panel shows the 3D structures, and the right panel shows the 2D diagrams. The C, N, and O atoms of residues are colored light blue, dark blue, and red, respectively. The C atoms of eckol and phloroglucinol are shown in orange and yellow, respectively.
Figure 6
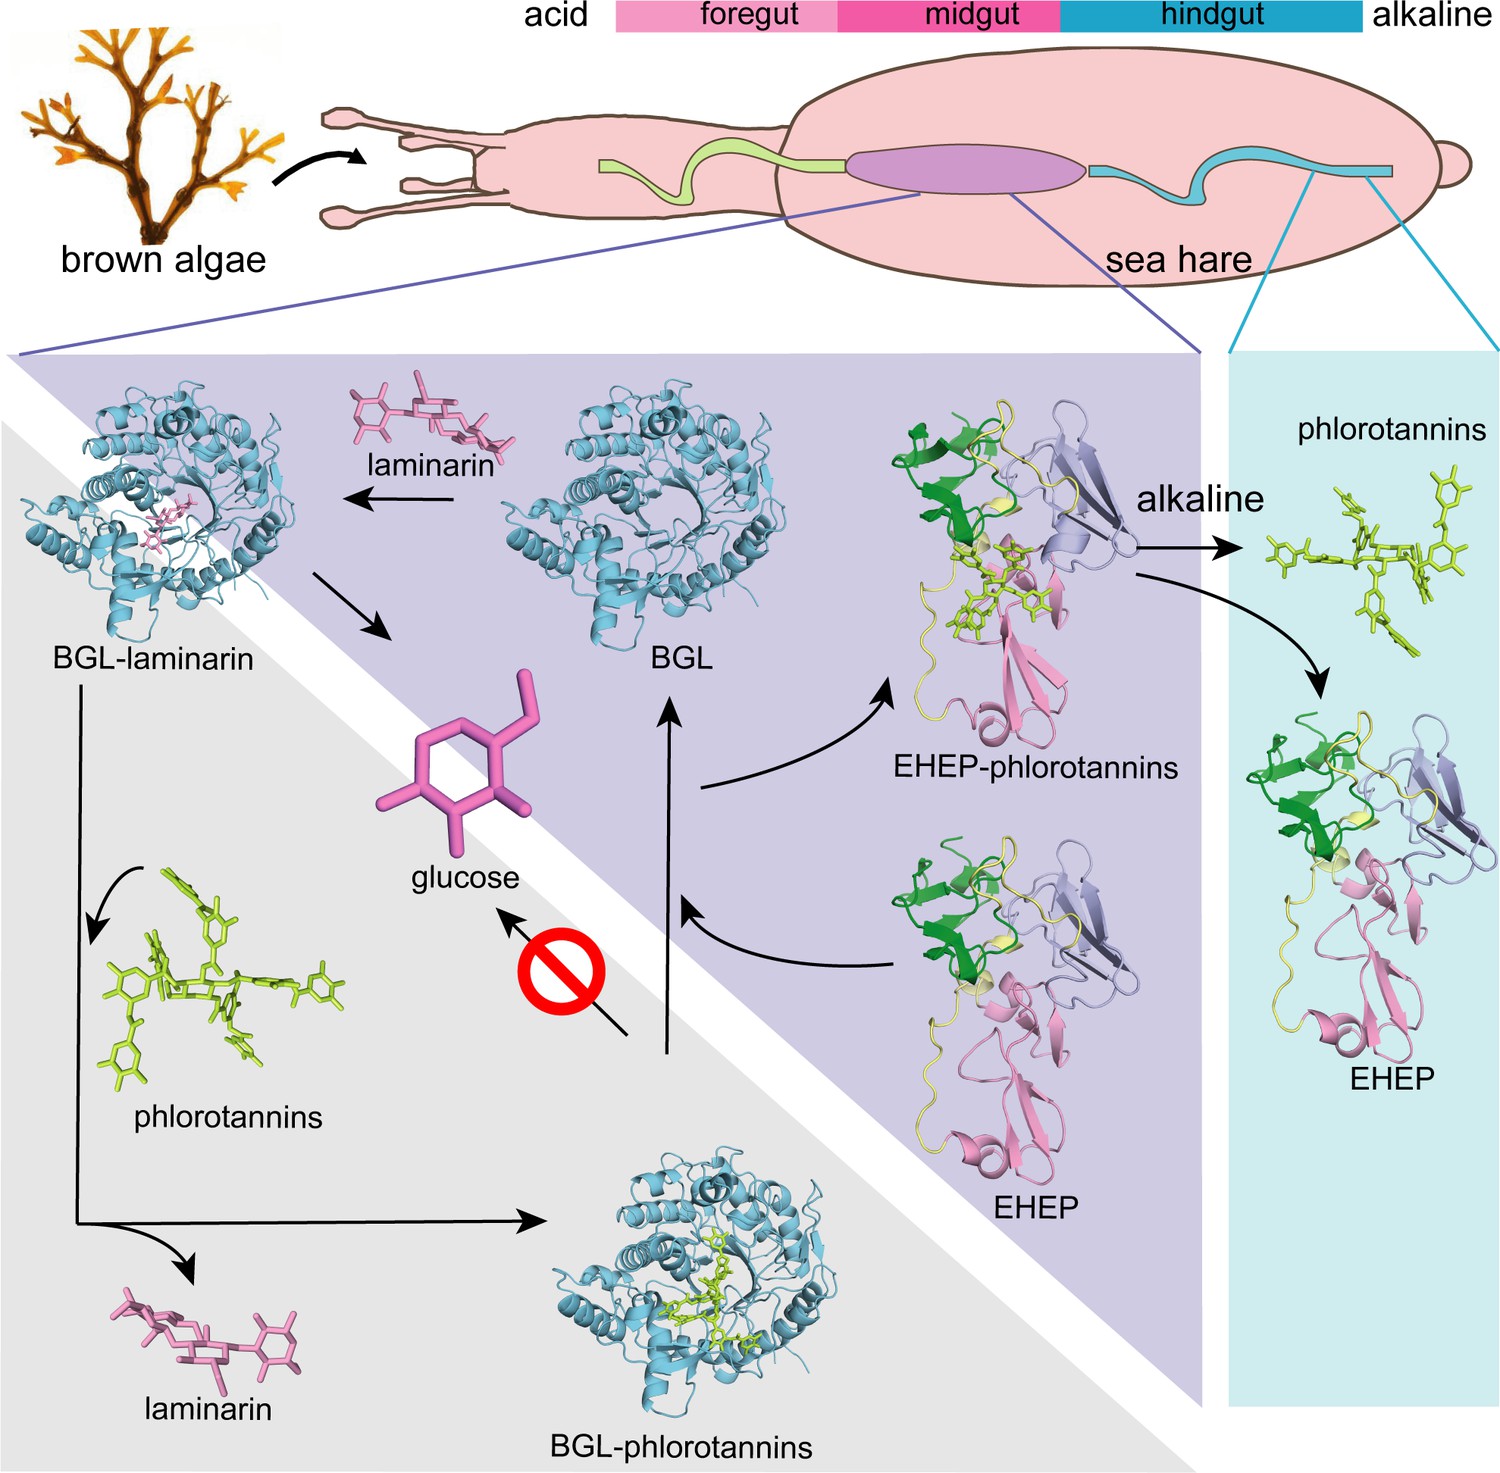
Proposed molecular mechanisms.
Proposed molecular mechanisms of tannic acid (TNA) inhibition of akuBGL activity and Eisenia hydrolysis-enhancing protein’s (EHEP) protective effects of akuBGL in akuBGL–phlorotannin/laminarin–EHEP system (light purple triangle). The digestive tract of A.kurodai consists of foregut (blue), midgut (purple), and hindgut (blue) (top). The bar chart above depicts the pH of the digestive tract, with pink denoting acid and blue denoting alkalinity.
Tables
Table 1
X-ray data collection and structure-refinement statistics.
| EHEP1 | EHEP2 | EHEP–TNA | akuBGL | |
|---|---|---|---|---|
| Data collection | ||||
| Beamline | PF BL17A | Spring 8 BL-41XU | PF BL17A | PF BL1A |
| Wavelength (Å) | 0.9800 | 1.0000 | 0.9800 | 1.0000 |
| Resolution range (Å) | 46.56–1.15 (1.20–1.15) | 47.02–1.4 (1.45–1.4) | 46.84–1.9 (1.97–1.9) | 49.65–2.7 (2.80–2.7) |
| Space group | P212121 | P212121 | P212121 | P62 |
| Unit-cell parameters a, b, c (Å) | 42.2, 65.3, 66.5 | 40.6, 65.6, 67.5 | 42.5, 65.4, 67.2 | 191.7, 191.7, 112.6 |
| Completeness (%) | 93.4 (75.8) | 99.30 (97.98) | 99.9 (99.7) | 99.9 (99.1) |
| Redundancy | 6.6 (6.1) | 6.4 (5.8) | 6.4 (6.4) | 10.7 (10.9) |
| Average I/σ(I) | 19.28 (1.97) | 14.34 (3.41) | 15.39 (1.83) | 10.69 (2.57) |
| Rmeas(%)* | 7.3 (90.5) | 8.6 73.7 (55.3) | 8.9 (89.4) | 19.4 (83.0) |
| CC1/2 (%) | 99.9 (70.4) | 99.8 (86.2) | 99.9 (73.7) | 99.5 (84.2) |
| Molecules/asymmetric unit | 1 | 1 | 1 | 2 |
| Refinement | ||||
| Rwork†/Rfree‡ (%) | 18.19/18.91 | 16.57/18.39 | 19.87/23.54 | 18.39/21.98 |
| No. of atoms | 1955 | 1861 | 1732 | 15,595 |
| No. of residues | 1600 | 1573 | 1580 | 15,256 |
| No. of water molecules | 343 | 273 | 87 | 96 |
| No. of ligands | 12 | 15 | 67 | 243 |
| RMSD from ideality | ||||
| Bond length (Å) | 0.005 | 0.006 | 0.008 | 0.004 |
| Bond angle (°) | 0.84 | 0.84 | 0.91 | 0.65 |
| Ramachandran plot (%) | ||||
| Favored | 99.02 | 98.54 | 98.52 | 96.16 |
| Allowed | 0.98 | 1.46 | 1.48 | 3.74 |
| Outliers | 0.00 | 0.00 | 0.00 | 0.11 |
| PDB accession code | 8IN3 | 8IN4 | 8IN6 | 8IN1 |
-
The highest resolution shell is shown in parentheses.
-
*
Rmeas = Σhkl{N(hkl)/[N(hkl) − 1]}1/2 Σi|Ii(hkl) − <I(hkl)> |/ΣhklΣi|Ii(hkl), where Ii(hkl) is the ith observation of the intensity of reflection hkl and 〈I(hkl)〉 is the mean over n observations.
-
†
Rwork = Σhkl||Fobs(hkl)| − |Fcalc(hkl)||/Σhkl|Fobs(hkl)|.
-
‡
Rfree was calculated with an approximate 5% fraction of randomly selected reflections evaluated from refinement.
Additional files
-
Supplementary file 1
Primers used in this study.
- https://cdn.elifesciences.org/articles/88939/elife-88939-supp1-v1.docx
-
MDAR checklist
- https://cdn.elifesciences.org/articles/88939/elife-88939-mdarchecklist1-v1.pdf
Download links
A two-part list of links to download the article, or parts of the article, in various formats.
Downloads (link to download the article as PDF)
Open citations (links to open the citations from this article in various online reference manager services)
Cite this article (links to download the citations from this article in formats compatible with various reference manager tools)
Structural basis of EHEP-mediated offense against phlorotannin-induced defense from brown algae to protect akuBGL activity
eLife 12:RP88939.
https://doi.org/10.7554/eLife.88939.3


