Molecular dissection of PI3Kβ synergistic activation by receptor tyrosine kinases, GβGγ, and Rho-family GTPases
- Department of Chemistry and Biochemistry, Institute of Molecular Biology, University of Oregon, United States
Figures
Figure 1 with 2 supplements
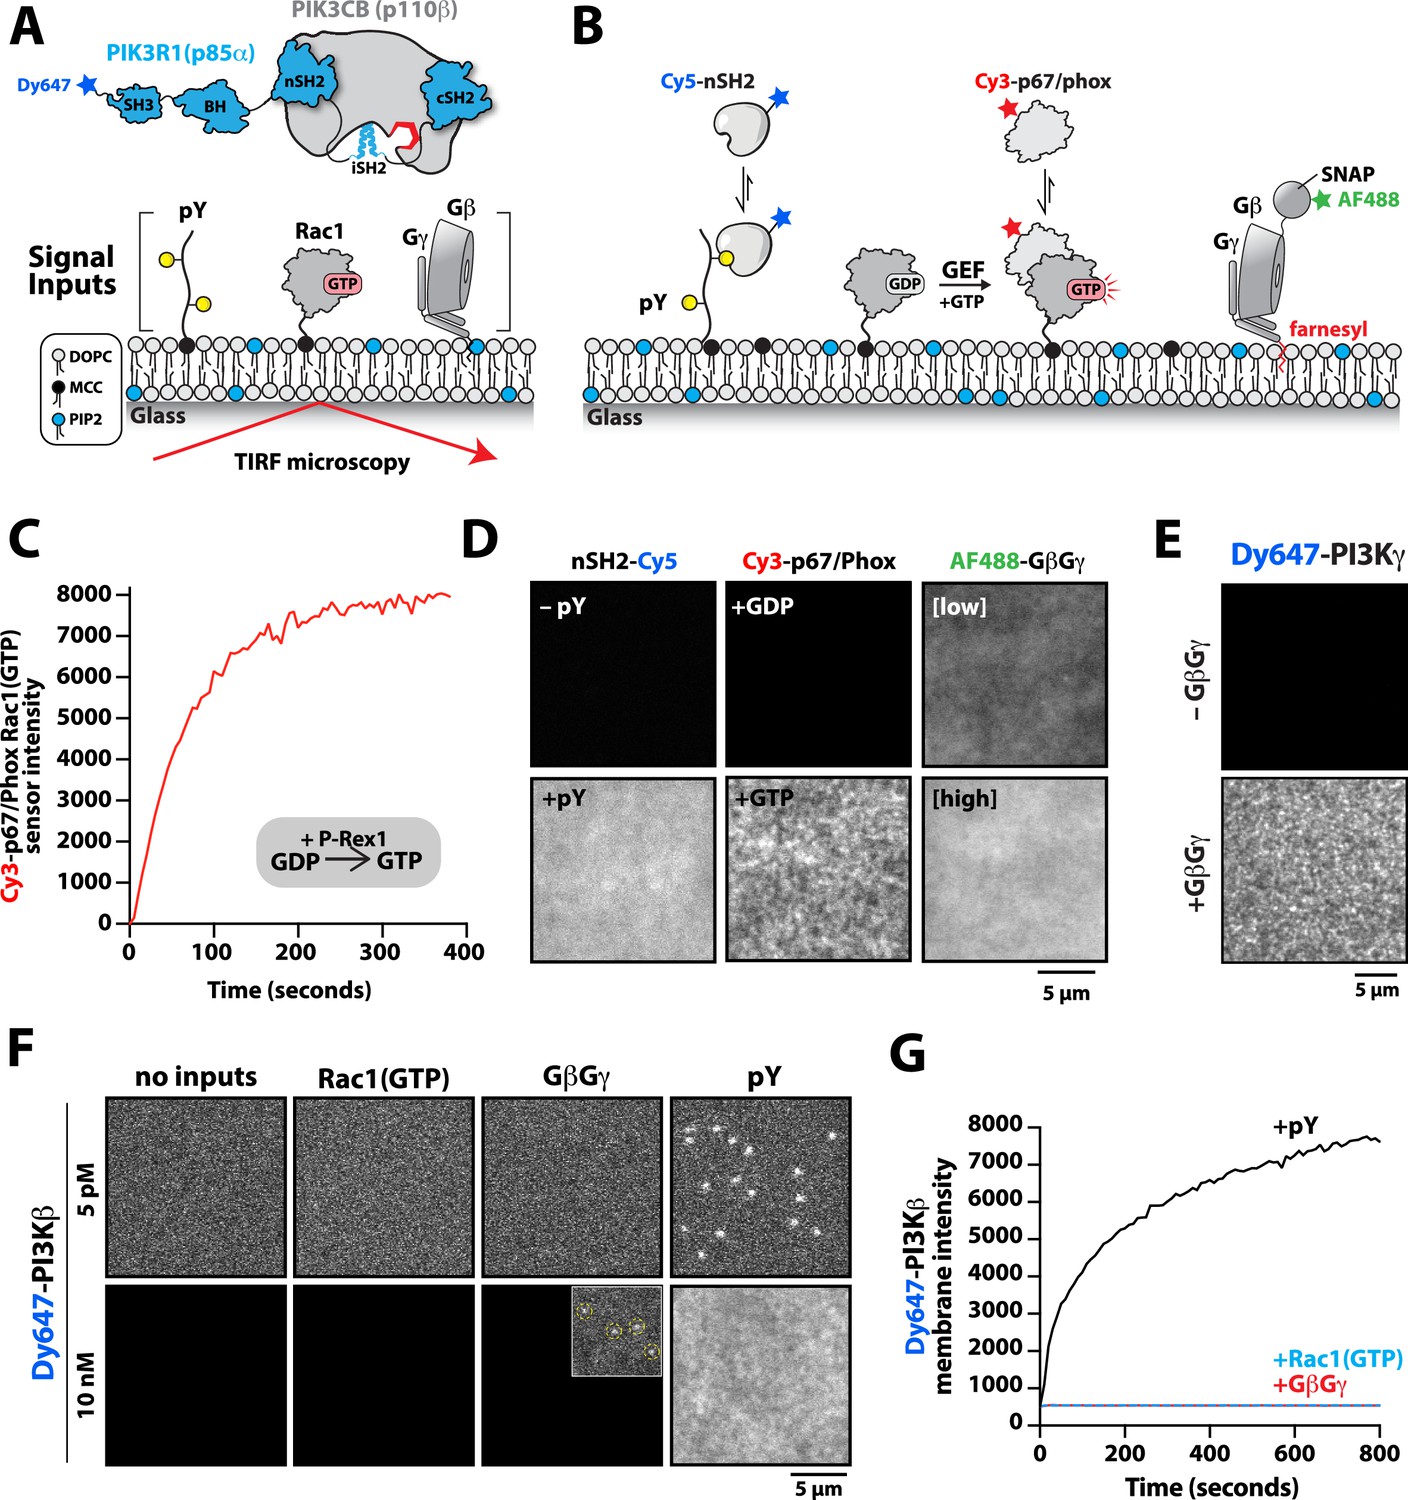
Phosphoinositide 3-kinase beta (PI3Kβ) prioritizes membrane interactions with receptor tyrosine kinase (RTK)-derived phosphorylated (pY) peptides over Rac1(GTP) and G-protein complexes (GβGγ).
(A) Cartoon schematic showing membrane-tethered signaling inputs (i.e. pY, Rac1(GTP), and GβGγ) attached to a supported lipid bilayer and visualized by TIRF-M. Heterodimeric Dy647-PI3Kβ (p110β-p85α) in solution can dynamically associate with membrane-bound proteins. (B) Cartoon schematic showing method for visualizing membrane-tethered signaling inputs. (C) Kinetics of Rac1 nucleotide exchange measured in the presence of 20 nM Rac1(GTP) sensor (Cy3-p67/phox) and 50 nM P-Rex1 (DH-PH domain). (D) Visualization of membrane conjugated RTK derived pY peptide (~6000 /µm2), Rac1(GTP) (~4000 /µm2), and GβGγ (~4800 /µm2) by TIRF-M. Representative TIRF-M images showing the membrane localization of 20 nM nSH2-Cy3 in the absence and presence of membranes conjugated with a solution concentration of 10 µM pY peptide. Representative images showing the membrane localization of 20 nM Cy3-p67/phox Rac1(GTP) sensor before (GDP) and after (GTP) the addition of the guanine nucleotide exchange factor, P-Rex1. Equilibrium localization of 50 nM (low) or 200 nM (high) farnesyl GβGγ-SNAP-AF488. (E) Representative TIRF-M images showing the equilibrium membrane localization of 10 nM Dy647-PI3Kγ measured in the absence and presence of membranes equilibrated with 200 nM farnesyl GβGγ. (F) Representative TIRF-M images showing the equilibrium membrane localization of 5 pM and 10 nM Dy647-PI3Kβ measured in the presence of membranes containing either pY, Rac1(GTP), or GβGγ. The inset image (+GβGγ) shows low-frequency single molecule binding events detected in the presence of 10 nM Dy647-PI3Kβ. Note that the contrast of the inset image was scaled differently to show the rare Dy647-PI3Kβ membrane binding events. (G) Bulk membrane absorption kinetics for 10 nM Dy647-PI3Kβ measured on membranes containing eitherpY, Rac1(GTP), or GβGγ. Membrane composition: 96% DOPC, 2% PI(4,5)P2, 2% MCC-PE.
-
Figure 1—source data 1
Related to Figure 1C.
- https://cdn.elifesciences.org/articles/88991/elife-88991-fig1-data1-v1.xlsx
-
Figure 1—source data 2
Related to .Figure 1G.
- https://cdn.elifesciences.org/articles/88991/elife-88991-fig1-data2-v1.xlsx
Figure 1—figure supplement 1

Characterization of Alexa488-SNAP-GβGγ localization on supported lipid bilayers.
(A) Cartoon showing the structural organization of the farnesylatedGβGγ complex inserted into a supported lipid bilayer. The complex was labeled using Alexa488-SNAP surface dye, which we conjugated to the SNAP-tag fused to the N-terminus of the Gβ subunit. (B) Representative TIRF-M images showing the localization of Alexa488-SNAP-GβGγ on supported lipid bilayer. The ImageJ TrackMate single molecule tracking plugin was used to identify and track Alexa488-SNAP-GβGγ molecules.(C) Step size distribution showing single molecule displacements of n=1128 Alexa488-SNAP-GβGγ particles (n=23,083 steps, D=1.79 µm2/s).(D) Bulk membrane absorption kinetics of 200 nMfarnesyl GβGγ (10% Alexa 488-SNAP-GβGγ). (C–D) Membrane composition: 98% DOPC, 2% PI(4,5)P2.
-
Figure 1—figure supplement 1—source data 1
Related to Figure 1—figure supplement 1B.
- https://cdn.elifesciences.org/articles/88991/elife-88991-fig1-figsupp1-data1-v1.xlsx
-
Figure 1—figure supplement 1—source data 2
Related to Figure 1—figure supplement 1C.
- https://cdn.elifesciences.org/articles/88991/elife-88991-fig1-figsupp1-data2-v1.xlsx
Figure 1—figure supplement 2

Characterization of Dy647-PI3Kβ membrane association with individual signaling inputs.
(A–C) Kinetic traces showing the bulk membrane localization of 10 nM Dy647-PI3Kβ measured of supported lipid bilayers (SLBs) with either (A) phosphorylated (pY), (B) Rac1(GTP), or (C) G-protein complexes (GβGγ) tethered to the membrane. The following concentrations of protein were used for membrane coupling or passive membrane absorption: (A) 10 µM pY, (B) 30 µM Rac1(GTP), or (C) 200 nMGβGγ.(A–C) Membrane lipid composition: 91% DOPC, 5% DOPS, 2% PI(4,5)P2, 2% MCC-PE (blue line); 76% DOPC, 20% DOPS, 2% PI(4,5)P2, 2% MCC-PE (red line). Note that the coupling efficiency of pY is generally reduced by high concentrations of anionic lipids, presumably due to electrostatic repulsion. (D–F) Single molecule dwell time distributions measured in the presence of (D) 10 nM Dy647-PI3Kβ+lipids (τ1=71 ± 1 ms, τ2=319 ± 123 ms, α=0.89, n=1821 particles) (E) 10 nM Dy647-PI3Kβ+200 nM GβGγ (τ1=63 ± 1 ms, τ2=602 ± 39 ms, α=0.94, n=5992 particles), or (F) 10 nM Dy647-PI3Kβ GβGγ mutant (K532D/K533D)+200 nM GβGγ (τ1=60 ± 3 ms, τ2=494 ± 49 ms, α=0.87, n=2157 particles). Data plotted as log10(1–CDF) (cumulative distribution frequency). Dwell time statistics represent the average of n=2 technical replicates. Alpha(α) represents the fraction of particles characterized by the time constant (τ1). Only particles tracked for at least two frames (44 ms) were included in the distributions. Note that a 2000-fold higher concentration of Dy647-PI3Kβ is needed to observe single molecule binding events under these conditions compared to membrane containing membrane-anchored pY peptide. (D–F) Membrane composition: 78% DOPC, 20% DOPS, 2% PI(4,5)P2.
-
Figure 1—figure supplement 2—source data 1
Related to Figure 1—figure supplement 2A.
- https://cdn.elifesciences.org/articles/88991/elife-88991-fig1-figsupp2-data1-v1.xlsx
-
Figure 1—figure supplement 2—source data 2
Related to .Figure 1—figure supplement 2B.
- https://cdn.elifesciences.org/articles/88991/elife-88991-fig1-figsupp2-data2-v1.xlsx
-
Figure 1—figure supplement 2—source data 3
Related to Figure 1—figure supplement 2C.
- https://cdn.elifesciences.org/articles/88991/elife-88991-fig1-figsupp2-data3-v1.xlsx
-
Figure 1—figure supplement 2—source data 4
Related to .Figure 1—figure supplement 2D.
- https://cdn.elifesciences.org/articles/88991/elife-88991-fig1-figsupp2-data4-v1.xlsx
-
Figure 1—figure supplement 2—source data 5
Related to .Figure 1—figure supplement 2E.
- https://cdn.elifesciences.org/articles/88991/elife-88991-fig1-figsupp2-data5-v1.xlsx
-
Figure 1—figure supplement 2—source data 6
Related to .Figure 1—figure supplement 2F.
- https://cdn.elifesciences.org/articles/88991/elife-88991-fig1-figsupp2-data6-v1.xlsx
Figure 2
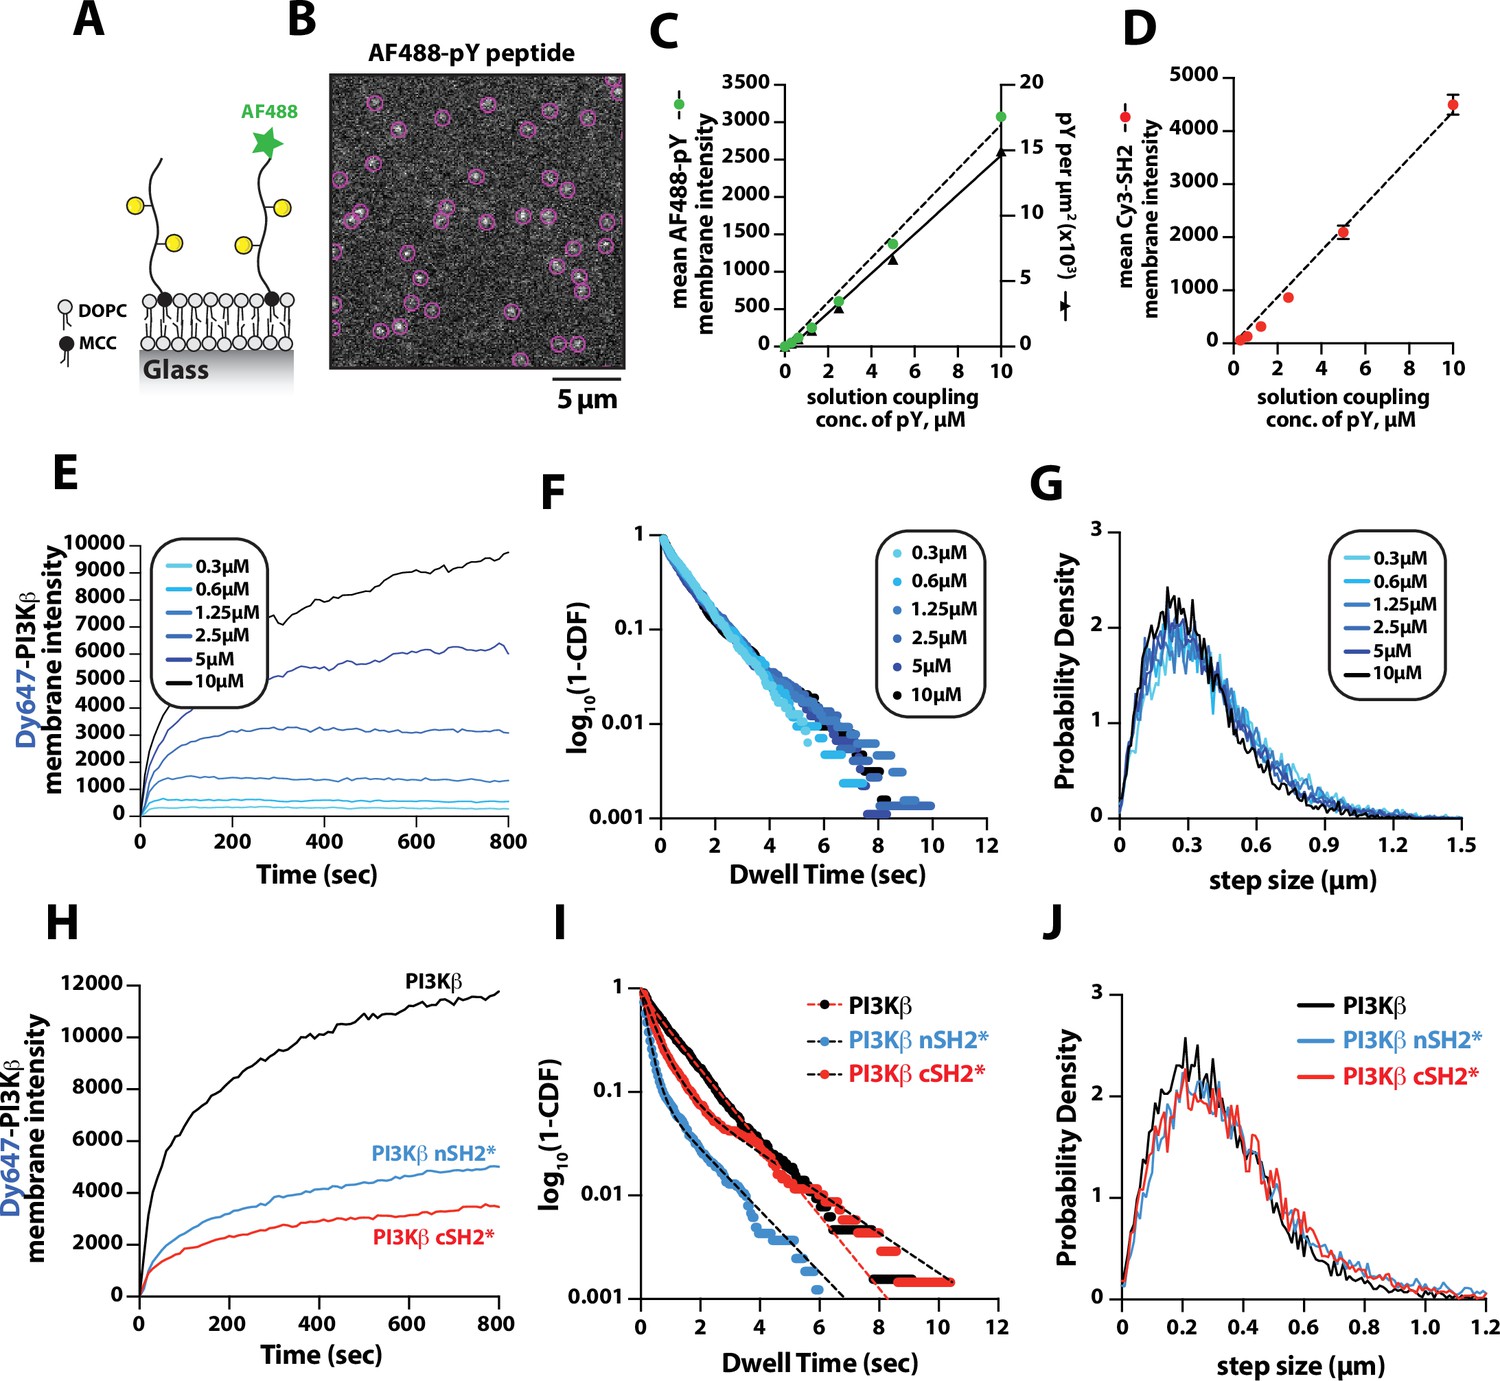
Density-dependent membrane binding behavior of Dy647-PI3Kβ measured in the presence of receptor tyrosine kinase (RTK)-derived phosphorylated (pY) peptides.
(A) Cartoon schematic showing conjugation of pY peptides (+/- Alexa488 label) using thiol-reactive maleimide lipids (MCC-PE). (B) Representative image showing the single molecule localization of Alexa488-pY. Particle detection (purple circles) was used to quantify the number of pY peptides per µm2. (C) Relationship between the total pY solution concentration (x-axis) used for covalent conjugation, the bulk membrane intensity of covalently attached Alexa488-pY (left y-axis), and the final surface density of pY peptides per µm2 (right y-axis). (D) Relationship between the total pY solution conjugation concentration and bulk membrane intensity of measured in the presence of 50 nM nSH2-Cy3. (E–G) Membrane localization dynamics of Dy647-PI3Kβ measured on supported lipid bilayers (SLBs) containing a range of pY surface densities (250–15,000 pY/µm2, based on Figure 1C). (E) Bulk membrane localization of 10 nM Dy647-PI3Kβ as a function of pY density. (F) Single molecule dwell time distributions measured in the presence of 5 pM Dy647-PI3Kβ. Data plotted as log10(1–CDF) (cumulative distribution frequency). (G) Step size distributions showing Dy647-PI3Kβ single molecule displacements from >500 particles (>10,000 steps) per pY surface density. (H–J) Membrane localization dynamics of Dy647-PI3Kβ nSH2* (R358A) and cSH2* (R649A) mutants measured on SLBs containing ~15,000 pY/µm2 (10 µM conjugation concentration). (H) Bulk membrane absorption kinetics of 10 nM Dy647-PI3Kβ (WT, nSH2*, and cSH2*). (I) Single molecule dwell time distributions measured in the presence of 5 pM Dy647-PI3Kβ (WT, nSH2*, and cSH2*). Data plotted as log10(1–CDF) (cumulative distribution frequency). (J) Step size distributions showing single molecule displacements of >500 particles (>10,000 steps) in the presence of 5 pM Dy647-PI3Kβ (WT, nSH2*, and cSH2*). Membrane composition: 96% DOPC, 2% PI(4,5)P2, 2% MCC-PE.
-
Figure 2—source data 1
Related to .Figure 2C.
- https://cdn.elifesciences.org/articles/88991/elife-88991-fig2-data1-v1.xlsx
-
Figure 2—source data 2
Related to .Figure 2D.
- https://cdn.elifesciences.org/articles/88991/elife-88991-fig2-data2-v1.xlsx
-
Figure 2—source data 3
Related to .Figure 2E.
- https://cdn.elifesciences.org/articles/88991/elife-88991-fig2-data3-v1.xlsx
-
Figure 2—source data 4
Related to .Figure 2F.
- https://cdn.elifesciences.org/articles/88991/elife-88991-fig2-data4-v1.xlsx
-
Figure 2—source data 5
Related to .Figure 2G.
- https://cdn.elifesciences.org/articles/88991/elife-88991-fig2-data5-v1.xlsx
-
Figure 2—source data 6
Related to .Figure 2H.
- https://cdn.elifesciences.org/articles/88991/elife-88991-fig2-data6-v1.xlsx
-
Figure 2—source data 7
Related to .Figure 2I.
- https://cdn.elifesciences.org/articles/88991/elife-88991-fig2-data7-v1.xlsx
-
Figure 2—source data 8
Related to .Figure 2J.
- https://cdn.elifesciences.org/articles/88991/elife-88991-fig2-data8-v1.xlsx
Figure 3 with 2 supplements
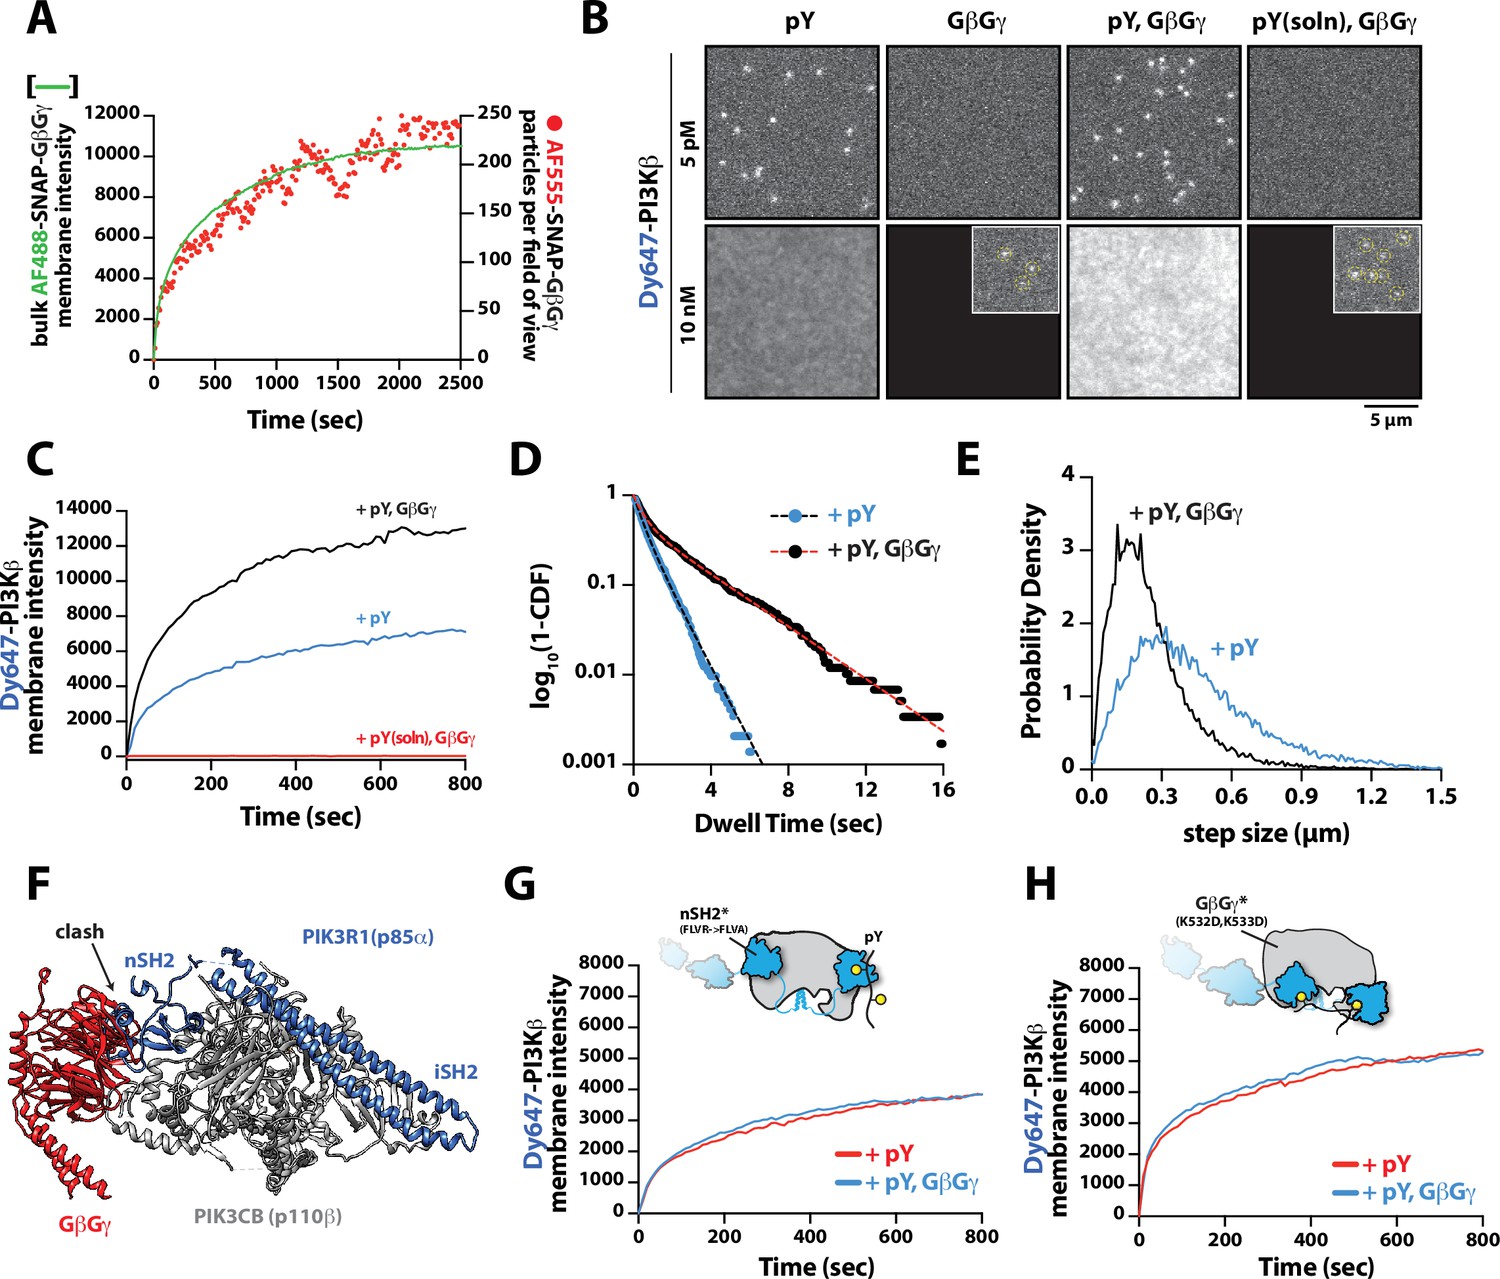
Mechanism controlling synergistic Dy647-PI3Kβ membrane binding by phosphorylated (pY) and G-protein complexes (GβGγ).
(A) Kinetic trace showing the membrane absorption of 200 nM AF488-SNAP-GβGγ containing 0.0025% AF555-SNAP-GβGγ measured by TIRF-M. Single molecule densities of AF555-SNAP-GβGγ were calculated for each frame in a field of view of 3000 µm2. (B) Representative TIRF-M images showing the equilibrium membrane localization of 5 pM and 10 nM Dy647-PI3Kβ on membranes containing either pY, GβGγ, pY/GβGγ, or pY(solution)/GβGγ. The inset image (+GβGγ and +pY/GβGγ) shows low-frequency single molecule binding events detected in the presence of 10 nM Dy647-PI3Kβ. Supported membranes were conjugated with 10 µM pY peptide (final surface density of ~15,000 pY/µm2) and equilibrated with 200 nM farnesyl-GβGγ before adding Dy647-PI3Kβ. pY (solution)=10 µM. (C) Bulk membrane recruitment dynamics of 10 nM Dy647-PI3Kβ measured in the presence of either pY alone, pY/GβGγ, or pY (solution)/GβGγ. pY(solution)=10 µM. (D) Single molecule dwell time distributions measured in the presence of 5 pM Dy647-PI3Kβ on supported membranes containing pY alone (τ1=0.55 ± 0.11 s, τ2=1.44 ± 0.56 s, α=0.54, n=4698 particles, n=5 technical replicates) or pY/GβGγ (τ1=0.61 ± 0.13 s, τ2=3.09 ± 0.27 s, α=0.58, n=3421 particles, n=4 technical replicates). Alpha(α) represents the fraction of particles characterized by the time constant (τ1). (E) Step size distributions showing single molecule displacements measured in the presence of either pY alone (D1=0.34 ± 0.04 µm2/s, D2=1.02 ± 0.07 µm2/s, α=0.45) or pY/GβGγ (D1=0.23 ± 0.03 µm2/s, D2=0.88 ± 0.08 µm2/s,α=0.6); n=3-4 technical replicates from >3000 tracked particles with 10,000-30,000 total displacements measured. Alpha(α) represents the fraction of particles characterized by the diffusion coefficient (D1). (F) Combined model of the putative nSH2 and GβGγ binding sites on p110β. The p110β-GβGγ binding site is based on an Alphafold multimer model supported by previous HDX-MS and mutagenesis experiments. The orientation of the nSH2 is based on previous X-ray crystallographic data on PI3Kα (p110α-p85α, niSH2, PDB:3HHM) aligned to the structure of PI3Kβ (p110β-p85α, icSH2, PDB:2Y3A). (G) Bulk membrane recruitment dynamics of 10 nM Dy647-PI3Kβ, WT and nSH2(R358A), measured on membranes containing either pY or pY/GβGγ. (H) Bulk membrane recruitment dynamics of 10 nM Dy647-PI3Kβ, WT and GβGγ binding mutant, measured on membranes containing either pY or pY/GβGγ. (A–H) Membrane composition: 96% DOPC, 2% PI(4,5)P2, 2% MCC-PE.
-
Figure 3—source data 1
Related to Figure 3A.
- https://cdn.elifesciences.org/articles/88991/elife-88991-fig3-data1-v1.xlsx
-
Figure 3—source data 2
Related to Figure 3C.
- https://cdn.elifesciences.org/articles/88991/elife-88991-fig3-data2-v1.xlsx
-
Figure 3—source data 3
Related to Figure 3D.
- https://cdn.elifesciences.org/articles/88991/elife-88991-fig3-data3-v1.xlsx
-
Figure 3—source data 4
Related to Figure 3E.
- https://cdn.elifesciences.org/articles/88991/elife-88991-fig3-data4-v1.xlsx
-
Figure 3—source data 5
Related to Figure 3G.
- https://cdn.elifesciences.org/articles/88991/elife-88991-fig3-data5-v1.xlsx
-
Figure 3—source data 6
Related to Figure 3H.
- https://cdn.elifesciences.org/articles/88991/elife-88991-fig3-data6-v1.xlsx
Figure 3—figure supplement 1

Solution phosphorylated (pY) peptide slightly enhances Dy647-PI3Kβ binding to G-protein complexes (GβGγ) membranes.
(A–B) Single molecule dwell time distributions measured in the presence of 10 nM Dy647-PI3Kβ on supported membranes containing (A) GβGγ alone (τ1=40 ms, τ2=169 ms, α=0.65, n=3226 particles) or (B) GβGγ+10 µM pY in solution (τ1=41 ms, τ2=193 ms, α=0.64, n=9639 particles). Data plotted as log10(1–CDF) (cumulative distribution frequency). Alpha(α) represents the fraction of particles characterized by the time constant (τ1). Note that a 2000-fold higher concentration of Dy647-PI3Kβ is needed to observe single molecule binding events under these conditions compared to membrane containing membrane-anchored pY peptide.Membrane composition: 96% DOPC, 2% PI(4,5)P2, 2% MCC-PE. For these experiments, the MCC-PE lipids added for pY peptide conjugation was quenched with 5 mM beta-mercaptoethanol (BME). (C) Representative TIRF-M images showing the localization of 10 nM Dy647-PI3Kβ on supported lipid bilayers in the presence of either 20 µM pY (solution), 200 µM GβGγ (4800 molecules/µm2), or pY(solution)/GβGγ. (D) Kinetic traces showing the bulk membrane localization of 10 nM Dy647-PI3Kβ measured of supported lipid bilayers (SLBs) with either 20 µM pY (solution), 200 µM GβGγ (4800 molecules/µm2), or pY(solution)/GβGγ. (C–D) Membrane composition: 78% DOPC, 20% DOPS, 2% PI(4,5)P2.
-
Figure 3—figure supplement 1—source data 1
Related to Fig.Figure 3—figure supplement 1A.
- https://cdn.elifesciences.org/articles/88991/elife-88991-fig3-figsupp1-data1-v1.xlsx
-
Figure 3—figure supplement 1—source data 2
Related to Figure 3—figure supplement 1B.
- https://cdn.elifesciences.org/articles/88991/elife-88991-fig3-figsupp1-data2-v1.xlsx
-
Figure 3—figure supplement 1—source data 3
Related to Figure 3—figure supplement 1D.
- https://cdn.elifesciences.org/articles/88991/elife-88991-fig3-figsupp1-data3-v1.xlsx
Figure 3—figure supplement 2
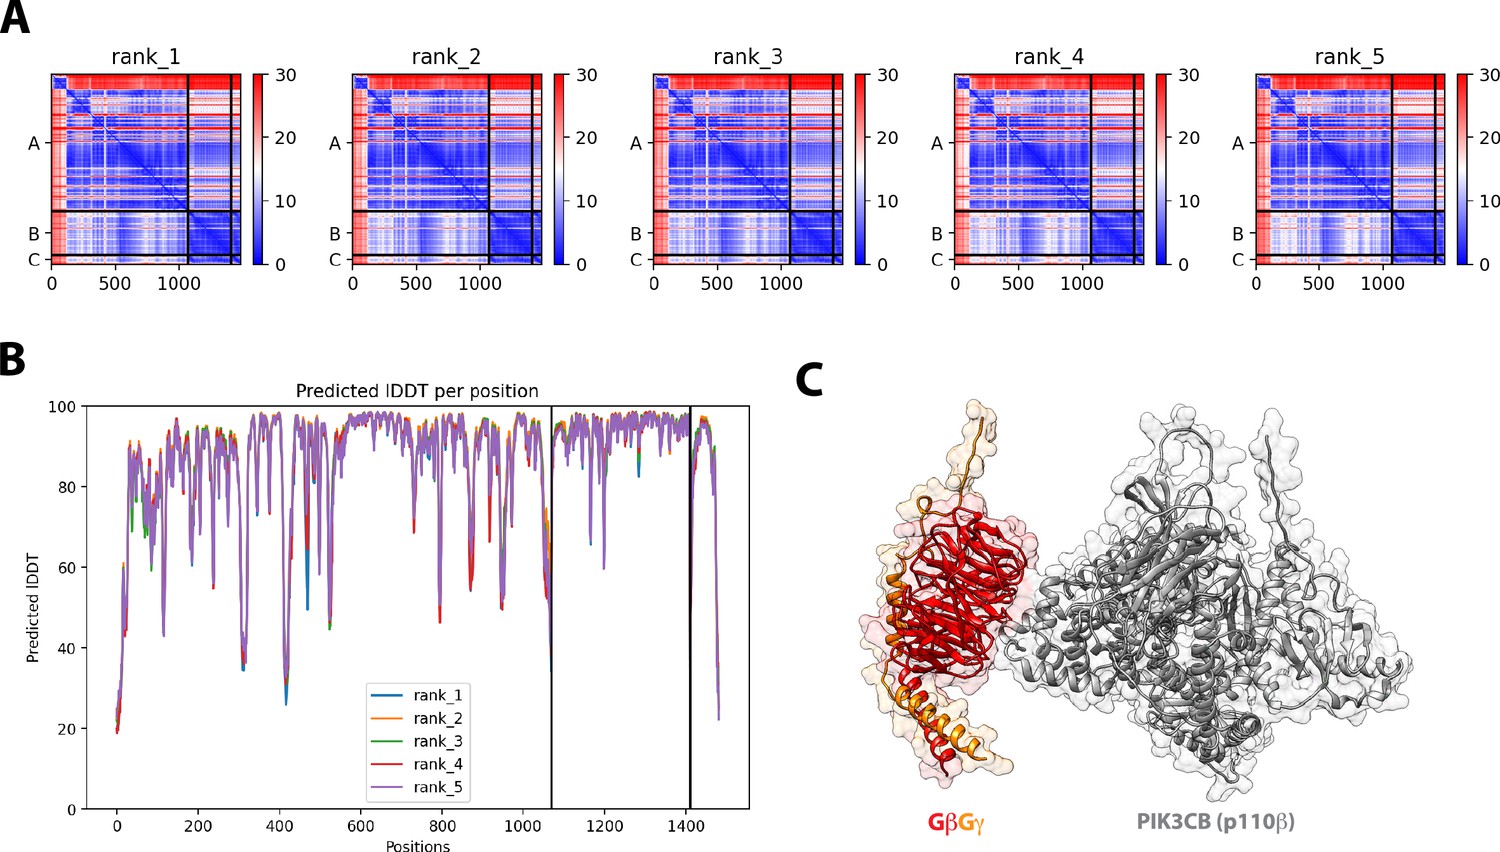
Structural model for G-protein complexes (GβGγ) binding to the Phosphoinositide 3-kinase beta (PI3Kβ) catalytic subunit (p110β).
(A) Predicted aligned error (PAE) for the top five ranked Alphafold2 Multimer structural prediction for full-length p110β binding to GβGγ. (B) Predicted Local Distance Difference Test (IDDT) for the top five ranked Alphafold2 Multimer searches. (C) Alphafold2 Multimer structural modelfor GβGγ binding to p110β. The final model shown was generated in UCSF Chimera. All five models were consistent with experimental data from previous mutagenesis and HDX-MS data.
Figure 4
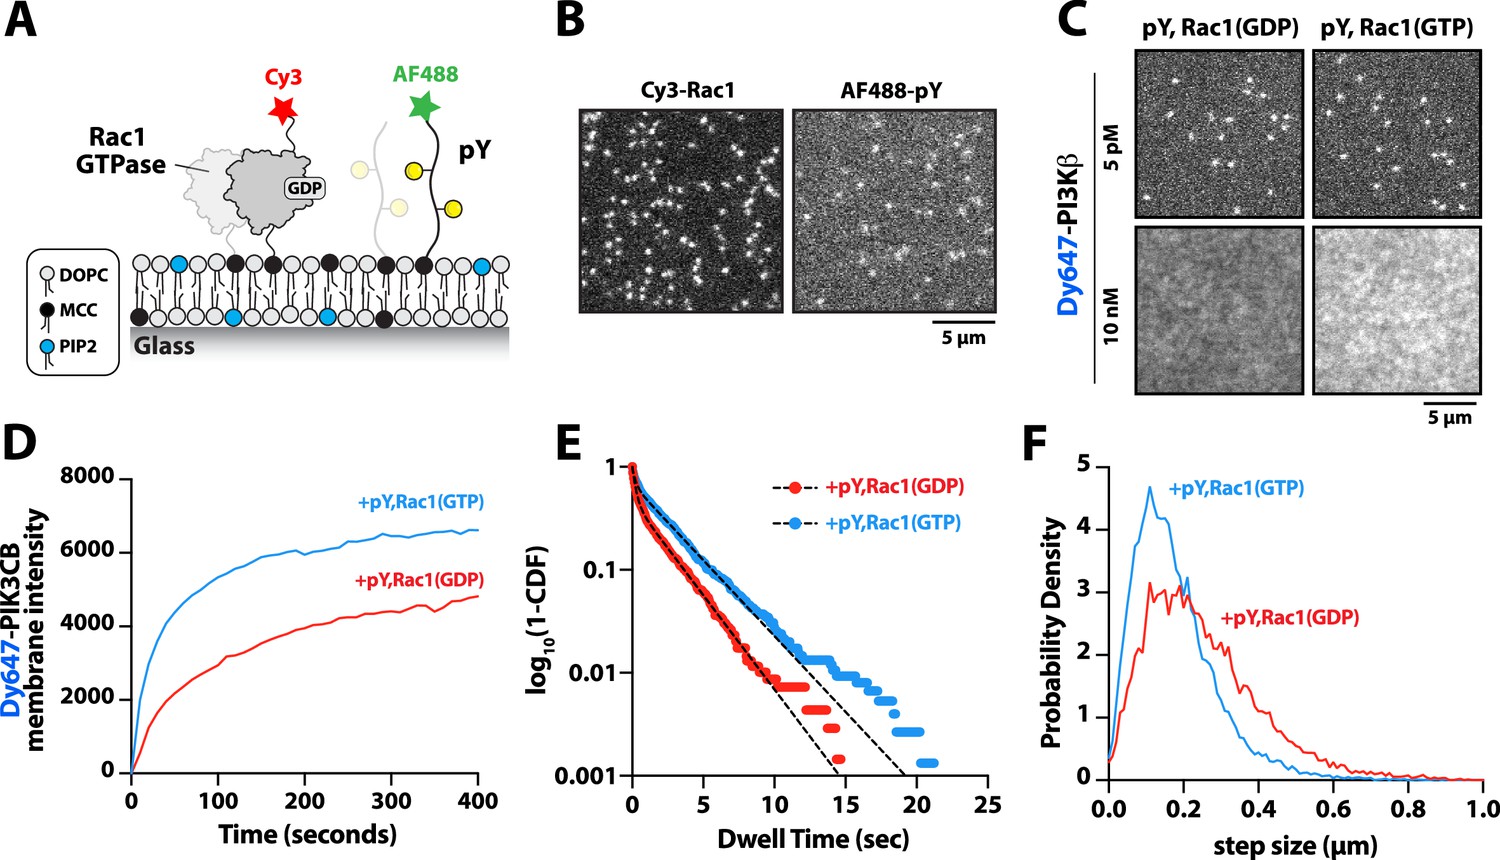
Membrane-anchored phosphorylated (pY) peptides synergistically enhance Dy647-PI3Kβ membrane binding in the presence of Rac1(GTP).
(A) Cartoon schematic showing membrane conjugation of Cy3-Rac1 and AF488-pY on membranes containing unlabeled Rac1 and pY. (B) Representative TIRF-M images showing localization of Cy3-Rac1 (1:10,000 dilution) and AF488-pY (1:30,000 dilution) after membrane conjugation in the presence of 30 µM Rac1 and 10 µM pY. Membrane surface density equals ~4000 Rac1/µm2 and ~5000 pY/µm2.(C) Representative TIRF-M images showing the equilibrium membrane localization of 5 pM and 10 nM Dy647-PI3Kβ measured in the presence of membranes containing either pY/Rac1(GDP) or pY/Rac1(GTP). (D ) Bulk membrane recruitment dynamics of 10 nM Dy647-PI3Kβ measured in the presence of pY/Rac1(GDP) or pY/Rac1(GTP). (E) Single molecule dwell time distributions measured in the presence of 5 pM Dy647-PI3Kβ on supported membranes containing pY/Rac1(GDP) or pY/Rac1(GTP). (F) Step size distributions showing single molecule displacements from >500 Dy647-PI3Kβ particles (>10,000 steps) in the presence of either pY/Rac1(GDP) or pY/Rac1(GTP). Membrane composition: 96% DOPC, 2% PI(4,5)P2, 2% MCC-PE.
-
Figure 4—source data 1
Related to Figure 4D.
- https://cdn.elifesciences.org/articles/88991/elife-88991-fig4-data1-v1.xlsx
-
Figure 4—source data 2
Related to Figure 4E.
- https://cdn.elifesciences.org/articles/88991/elife-88991-fig4-data2-v1.xlsx
-
Figure 4—source data 3
Related to Figure 4F.
- https://cdn.elifesciences.org/articles/88991/elife-88991-fig4-data3-v1.xlsx
Figure 5 with 2 supplements

G-protein complexes (GβGγ) and Rac1(GTP) stimulate phosphoinositide 3-kinase beta (PI3Kβ) activity beyond enhancing localization on phosphorylated (pY) membranes.
(A) Representative TIRF-M images showing localization of 20 nM Btk-SNAP-AF488 on supported lipid bilayers (SLBs) containing either 2% PI(4,5)P2 or 2% PI(3,4,5)P3, plus 98% DOPC. (B) Bulk membrane recruitment kinetics of 20 nM Btk-SNAP-AF488 on an SLB measured by TIRF-M. (C–D) Kinetics of PI(3,4,5)P3 production measured in the presence of 10 nM Dy647-PI3Kβ and 1 mM ATP on SLBs with membrane anchored pY, Rac1(GTP), or GβGγ alone. Reactions in (C) were performed in the absence of PS lipids, while membranes in (D) contained 20% DOPS. (E) Cartoon schematic illustrating method for measuring Dy647-PI3Kβ activity in the presence of either pY/Rac1(GDP) or pY/Rac1(GTP). Phase 1 of the reconstitution involves membrane equilibration of Dy647-PI3Kβ in the absence of ATP. During phase 2, 1 mM ATP was added to stimulate lipid kinase activity of Dy647-PI3Kβ. (F) Dual color TIRF-M imaging showing 2 nM Dy647-PI3Kβ localization and catalysis measured in the presence of 20 nM Btk-SNAP-AF488. Dashed line represents the addition of 1 mM ATP to the reaction chamber. (G) Cartoon schematic showing experimental design for measuring synergistic binding and activation of Dy647-PI3Kβ in the presence of pY and GβGγ. (H) Representative single molecule TIRF-M images showing the localization of 20 pM Dy647-PI3Kβ in (G). (I) Kinetics of PI(3,4,5)P3 production monitored in the presence of 20 nM Btk-SNAP-AF488 and 10-20 pM Dy647-PI3Kβ. Membrane contained either pY or pY/GβGγ. (B, C, F, H, I) Membrane composition: 96% DOPC, 2% PI(4,5)P2, 2% MCC-PE. (D) Membrane composition: 76% DOPC, 20% DOPS, 2% PI(4,5)P2, 2% MCC-PE. All kinetic measurements of PI(3,4,5)P3 production were performed in the presence of 20 nM Btk-SNAP-AF488.
-
Figure 5—source data 1
Related to Figure 5B.
- https://cdn.elifesciences.org/articles/88991/elife-88991-fig5-data1-v1.xlsx
-
Figure 5—source data 2
Related to Figure 5C.
- https://cdn.elifesciences.org/articles/88991/elife-88991-fig5-data2-v1.xlsx
-
Figure 5—source data 3
Related to Figure 5D.
- https://cdn.elifesciences.org/articles/88991/elife-88991-fig5-data3-v1.xlsx
-
Figure 5—source data 4
Related to Figure 5F.
- https://cdn.elifesciences.org/articles/88991/elife-88991-fig5-data4-v1.xlsx
-
Figure 5—source data 5
Related to Figure 5I.
- https://cdn.elifesciences.org/articles/88991/elife-88991-fig5-data5-v1.xlsx
Figure 5—figure supplement 1

Characterization of Bruton’s tyrosine kinase (Btk) and Grp1 membrane binding.
(A) Representative TIRF-M images showing the localization of 50 nM Grp1-AF555 and 50 nM Btk-SNAP-AF488 on supported lipid bilayers containing either 2% PI(4,5)P2 or 2% PI(3,4,5)P3, plus 98% DOPC. (B) Single molecule dwell time distributions measured in the presence of 25 pM Btk-SNAP-AF488 (τ1=183 ms, n=4865 particles) or 50 pM Grp1-AF555 (τ1=523 ms, n=3160 particles). Dwell time distributions were fit to single exponential decay curves to calculate the characteristic dwell times (τ1). (C) Representative step-size distributions fit to a two species model for diffusion (dashed black line). Diffusivity was measured in the presence of either 25 pM Btk-SNAP-AF488 (D1=0.41 µm2/s, D2=1.64 µm2/s,α=0.66, n=4865 particles, n=25,857 steps) or 50 pM Grp1-AF555 (D1=0.53 µm2/s, D2=1.48 µm2/s, α=0.6, n=3160 particles, n=34,549 steps). (D–E) Cumulative membrane of binding events measured in the presence of 25 pM, 50 pM, and 100 pM (D) Grp1-AF555 or (E) Btk-SNAP-AF488. The field of view for the data collected in (D–E) equals 3000 µm2.(F) Calculation of the on-rate (KON) for PI(3,4,5)P3 biosensors for data in (D-E). The slopes from each cumulative membrane binding curve in (D–E) were then plotted as a function of the Grp1-AF555 and Btk-SNAP-AF488 solution concentration to calculate the following association rate constants: KON(Grp1-AF555)=0.13 Grp1 nM–1×µm–2×s–1; KON(Btk-SNAP-AF488) = 0.48 molecules nM–1×µm–2×s–1. Membrane composition for single molecule measurements: 98% DOPC, 2% PI(3,4,5)P3.
-
Figure 5—figure supplement 1—source data 1
Related to Figure 5—figure supplement 1B.
- https://cdn.elifesciences.org/articles/88991/elife-88991-fig5-figsupp1-data1-v1.xlsx
-
Figure 5—figure supplement 1—source data 2
Related to Figure 5—figure supplement 1C.
- https://cdn.elifesciences.org/articles/88991/elife-88991-fig5-figsupp1-data2-v1.xlsx
-
Figure 5—figure supplement 1—source data 3
Related to Figure 5—figure supplement 1D.
- https://cdn.elifesciences.org/articles/88991/elife-88991-fig5-figsupp1-data3-v1.xlsx
-
Figure 5—figure supplement 1—source data 4
Related to Figure 5—figure supplement 1E.
- https://cdn.elifesciences.org/articles/88991/elife-88991-fig5-figsupp1-data4-v1.xlsx
-
Figure 5—figure supplement 1—source data 5
Related to Figure 5—figure supplement 1F.
- https://cdn.elifesciences.org/articles/88991/elife-88991-fig5-figsupp1-data5-v1.xlsx
Figure 5—figure supplement 2
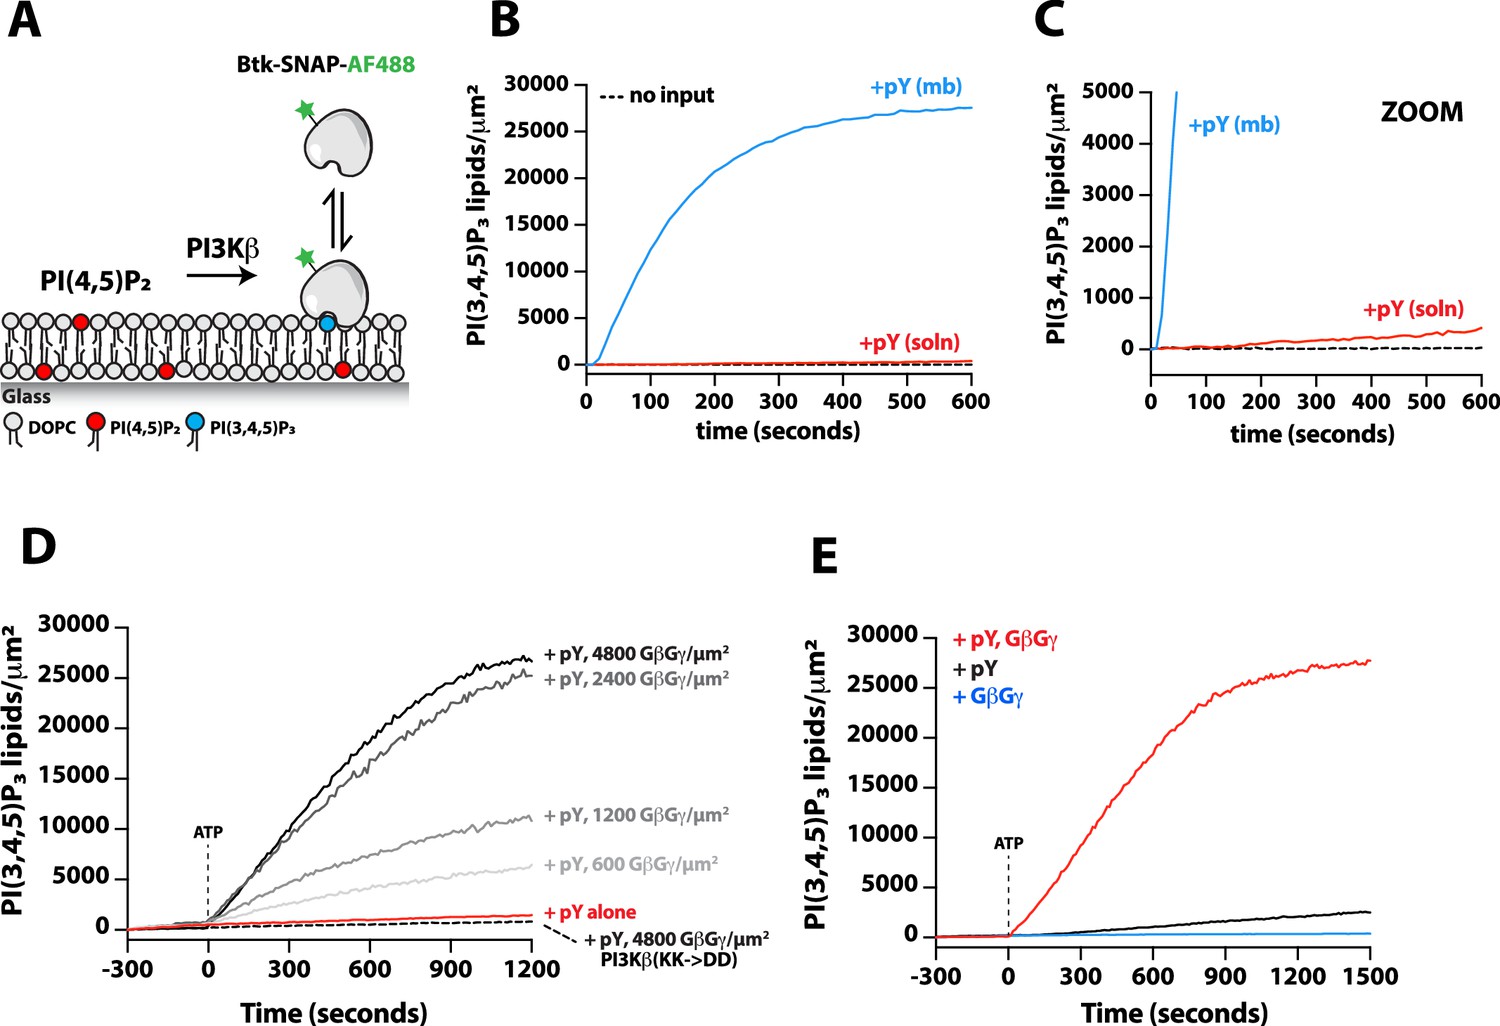
Reconstitution of Phosphoinositide 3-kinase beta (PI3Kβ) lipid kinase activity on supported membranes.
(A) Cartoon schematic showing how the production of PI(3,4,5)P3 is monitored by visualizing membrane recruitment of soluble Btk-SNAP-AF488. (B) Kinetics of PI(3,4,5)P3 production monitored in the presence of 20 nM Btk-SNAP-AF488 and 10 nM Dy647-PI3Kβ (note that this PI3Kβ concentration is higher than what was used to measure synergistic activation in Figure 5). Membranes were conjugated with 10 µM pY for 2 hrs (‘pY mb’) or 10 µM pY was added in solution to stimulate Dy647-PI3Kβ. (C) Zoom in on the graph in (B). In the presence of 10 nM Dy647-PI3Kβ, the initial reaction velocities were 157 PI(3,4,5)P3/µm2×s (+pY mb) and 0.76 PI(3,4,5)P3/µm2×s (+pY solution). Membrane composition: 96% DOPC, 2% PI(4,5)P2, 2% MCC-PE.(D) Kinetics of PI(3,4,5)P3 production monitored in the presence of 20 nM Btk-SNAP-AF488, 20 pM Dy647-PI3Kβ, and the indicated densities of SNAP-GβGγ. Membranes contained either pY alone or pY/GβGγ. As a negative control, we measured the activity of the Dy647-PI3Kβ GβGγ binding mutant (K532D, K533D). Membrane composition: 96% DOPC, 2% PI(4,5)P2, 2% MCC-PE. (E) Kinetics of PI(3,4,5)P3 production monitored in the presence of 20 nM Btk-SNAP-AF488 and 20 pM Dy647-PI3Kβ. Membrane contained either pY alone, GβGγ alone, or pY/GβGγ. Membrane composition: 76% DOPC, 20% DOPS, 2% PI(4,5)P2, 2% MCC-PE. (D–E) A final ATP concentration of 1 mM was spiked into the reaction chamber at time zero to initiate the Dy647-PI3Kβ kinase activity measurements.
-
Figure 5—figure supplement 2—source data 1
Related to .Figure 5—figure supplement 2B.
- https://cdn.elifesciences.org/articles/88991/elife-88991-fig5-figsupp2-data1-v1.xlsx
-
Figure 5—figure supplement 2—source data 2
Related to Figure 5—figure supplement 2A.
- https://cdn.elifesciences.org/articles/88991/elife-88991-fig5-figsupp2-data2-v1.xlsx
-
Figure 5—figure supplement 2—source data 3
Related to Figure 5—figure supplement 2B.
- https://cdn.elifesciences.org/articles/88991/elife-88991-fig5-figsupp2-data3-v1.xlsx
Tables
Table 1
Diffusion coefficients of Dy647-PI3Kβ (WT and SH2 domain mutants) bound to membrane-tethered tyrosine phosphorylated peptides.
| protein visualized | pY/µm2 | τ1±SD (s) | τ 2±SD (s) | α(τ)±SD | AVEDT (s) | D1 ±SD (µm2/sec) | D2 ±SD (µm2/s) | α(D)±SD | MEDIAN step (µm) |
|---|---|---|---|---|---|---|---|---|---|
| PI3Kβ (WT) | 250 | 0.58±0.28 | 1.78±0.58 | 0.60±0.37 | 1.00±0.09 | 0.39±0.07 | 1.45±0.09 | 0.29±0.08 | 0.37±0.02 |
| PI3Kβ (WT) | 573 | 0.39±0.06 | 1.37±0.14 | 0.27±0.02 | 1.12±0.09 | 0.28±0.06 | 1.15±0.14 | 0.22±0.04 | 0.35±0.01 |
| PI3Kβ (WT) | 1226 | 0.36±0.13 | 1.29±0.06 | 0.30±0.09 | 1.05±0.11 | 0.20±0.02 | 1.18±0.09 | 0.16±0.02 | 0.36±0.02 |
| PI3Kβ (WT) | 2935 | 0.44±0.11 | 1.53±0.38 | 0.47±0.25 | 1.00±0.07 | 0.28±0.09 | 1.09±0.12 | 0.26±0.09 | 0.33±0.01 |
| PI3Kβ (WT) | 6661 | 0.46±0.08 | 1.28±0.16 | 0.61±0.13 | 0.82±0.11 | 0.35±0.17 | 1.28±0.34 | 0.35±0.18 | 0.34±0.01 |
| PI3Kβ (WT) | 14944 | 0.55±0.11 | 1.44±0.56 | 0.54±0.22 | 0.91±0.09 | 0.45±0.15 | 1.40±0.54 | 0.48±0.06 | 0.33±0.05 |
| PI3Kβ (WT) | 14944 | 0.49±0.17 | 1.38±0.19 | 0.35±0.17 | 1.10±0.04 | 0.32±0.04 | 0.99±0.12 | 0.40±0.11 | 0.30±0.02 |
| PI3Kβ (nSH2*) | 14944 | 0.23±0.02 | 1.48±0.23 | 0.86±0.03 | 0.45±0.06 | 0.38±0.09 | 1.45±0.25 | 0.41±0.18 | 0.34±0.01 |
| PI3Kβ (cSH2*) | 14944 | 0.38±0.08 | 1.54±0.55 | 0.76±0.1 | 0.65±0.08 | 0.34±0.13 | 1.12±0.29 | 0.43±0.15 | 0.30±0.04 |
-
SD = standard deviation from 3-5 technical replicates. n = 331 – 1909 total particles for each technical replicate. steps = 4277 – 39378 total particle displacements measured for each technical replicate. Alpha (αt) equals the fraction of molecules with the characteristic dwell time, τ1 (DT = dwell time). The fraction of molecules with the characteristic dwell time, τ2, equals 1-αt. Alpha (αD) equals the fraction of molecules with the characteristic diffusion coefficient, D1. The fraction of molecules with diffusion coefficient, D2, equals 1-αD. Membrane composition: 96% DOPC, 2% PI(4,5)P2, 2% MCC-PE.
Appendix 1—key resources table
| Reagent type (species) or resource | Designation | Source or reference | Identifiers | Additional information |
|---|---|---|---|---|
| Chemical compound, drug | AccuPrime Pfx master mix | Thermo Fisher | 12344040 | |
| Chemical compound, drug | Pfu Ultra High-Fidelity DNA Polymerase | Agilent | 600380 | |
| Chemical compound, drug | Fugene transfection reagent | Thermo Fisher | 10362100 | |
| Chemical compound, drug | SIGMAFAST Protease Inhibitor Cocktail Tablets, EDTA-Free | Sigma | P8830 | |
| Chemical compound, drug | Beta-mercaptoethanol | Sigma | M3148-100ML | |
| Chemical compound, drug | PMSF | Sigma | P7626 | |
| Chemical compound, drug | Guanosine 5′-diphosphate (GDP) sodium salt hydrate | Sigma | G7127-100MG | |
| Chemical compound, drug | Guanosine 5′-triphosphate (GTP) sodium salt hydrate | Sigma | G8877-250MG | |
| Chemical compound, drug | Sodium deoxycholate | Sigma | D6750 | |
| Chemical compound, drug | C12E10 (Polyoxyethylene (10) lauryl ether) | Sigma | P9769 | |
| Chemical compound, drug | CHAPS | Thermo Fisher | J6735909 | |
| Chemical compound, drug | 1,2-dioleoyl-sn-glycero-3-phosphocholine (18:1 DOPC) | Avanti | 850375 C | |
| Chemical compound, drug | 1,2-dioleoyl-sn-glycero-3-phospho-L-serine (18:1 DOPS) | Avanti | 840035 C | |
| Chemical compound, drug | 1,2-dioleoyl-sn-glycero-3-phosphoethanolamine (18:1 Δ9-Cis) DOPE | Avanti | 850725 C | |
| Chemical compound, drug | L-α-phosphatidylinositol-4,5-bisphosphate (Brain PI(4,5)P2) | Avanti | 840046 X | |
| Chemical compound, drug | phosphatidylinositol 4,5-bisphosphate 18:0/20:4 (PI(4,5)P2) | Echelon | P-4524 | |
| Chemical compound, drug | 1,2-dioleoyl-sn-glycero-3-phosphoethanolamine-N- [4-(p-maleimidomethyl)cyclohexane-carboxamide] (18:1 MCC-PE) | Avanti | 780201 C | |
| Chemical compound, drug | 10 x PBS [pH 7.4] | Corning | 46–013 CM | |
| Chemical compound, drug | Trolox | Cayman Chemicals | 10011659 | |
| Chemical compound, drug | Dyomics 647 maleimide | Dyomics | 647 P1-03 | |
| Chemical compound, drug | Cy3 maleimide | Cytiva | PA23031 | |
| Chemical compound, drug | Cy5 maleimide | Cytiva | PA15131 | |
| Chemical compound, drug | Cy3 Mono NHS Ester | Cytiva | PA13101 | |
| Chemical compound, drug | SNAP-Surface Alexa Fluor 488 | NEB | S9129S | |
| Chemical compound, drug | SNAP-Surface Alexa Fluor 546 | NEB | S9132S | |
| Chemical compound, drug | SNAP-Surface Alexa Fluor 647 | NEB | S9136S | |
| Chemical compound, drug | Coenzyme A | Sigma | C3019 | |
| Chemical compound, drug | Sulfuric acid | Sigma | 58105–2.5 L-PC | |
| Peptide, recombinant protein | glucose oxidase (Aspergillus niger, 225 U/mg) | Biophoretics | B01357.02 | |
| Peptide, recombinant protein | catalase (bovine liver) | Sigma | C40-100MG | |
| Peptide, recombinant protein | 10 mg/mL beta casein solution | ThermoFisher | 37528 | |
| Peptide, recombinant protein | LPETGG | ELIM Biopharm | custom peptide synthesis | >95% purity |
| Peptide, recombinant protein | CSDGG(pY)MDMSKDESID(pY) VPMLDMKGDIKYADIE | ELIM Biopharm | custom peptide synthesis | >95% purity |
| Peptide, recombinant protein | CSDGG(pY)MDMSKDESID(pY) VPMLDMKGDIKYADIE-Alexa488 | ELIM Biopharm | custom peptide synthesis | >95% purity |
| Sequence-based reagent | CCTTTTTGGTAgcaGATGCG TCTACTAAAATGCATGGTG | Integrated DNA Technologies (IDT) | FW_ ybbr-PIK3R1 (R358A) | |
| Sequence-based reagent | GTAGACGCATCtgcTACCAAAAA GGTCCCGTCTGCTGTATC | IDT | RV_ ybbr-PIK3R1 (R358A) | |
| Sequence-based reagent | CTTTTCTTGTCgcgGAGAGC AGTAAACAGGGCTGC | IDT | FW_ ybbr-PIK3R1 (R358A) | |
| Sequence-based reagent | GTTTACTGCTCTCcgcGACAAG AAAAGTGCCATCTCGCTTC | IDT | RV_ ybbr-PIK3R1 (R358A) | |
| Sequence-based reagent | CAAGTCGAGGTGGAgatgacTTT CTTCCTGTATTGAAAGAAATCTTGG | IDT | FW_ his6-TEV-PIK3CB(K532D,K533D) | |
| Sequence-based reagent | CAATACAGGAAGAAAgtcatcTCCAC CTCGACTTGACACATTAGCAC | IDT | RV_ his6-TEV-PIK3CB(K532D,K533D) | |
| Recombinant DNA reagent | his10-SUMO3-GGGGG-Rac1(1-192aa) | This paper | pSH752 | Bacterial protein expression plasmid |
| Recombinant DNA reagent | his6-MBP-N10-TEV-GGGGG-P-Rex1 (40-405aa, DH-PH) | This paper | pSH658 | Bacterial protein expression plasmid |
| Recombinant DNA reagent | his10-SUMO3-p67/phox TRP (Rac1-GTP sensor) | This paper | pSH823 | Bacterial protein expression plasmid |
| Recombinant DNA reagent | his6-GST-TEV-nSH2 PIK3R1(322-440aa)-Cys | This paper | pSH615 | Bacterial protein expression plasmid |
| Recombinant DNA reagent | his6-SUMO-Btk(PH-TH,R49S/K52S)-SNAP | This paper | pSH1313 | Bacterial protein expression plasmid |
| Recombinant DNA reagent | his6-MBP-N10-TEV-GGGGG-Grp1 (261-387aa) | This paper | pSH558 | Bacterial protein expression plasmid |
| Recombinant DNA reagent | his6-TEV-SenP2 (368-589aa, SUMO protease) | This paper | pSH653 | Bacterial protein expression plasmid |
| Recombinant DNA reagent | his6-TEV-PIK3CB (1-1070aa) | This paper | pSH541 | Baculovirus expression plasmid |
| Recombinant DNA reagent | ybbr-PIK3R1 (1-724aa) | This paper | pSH743 | Baculovirus expression plasmid |
| recombinant DNA reagent | ybbr-PIK3R1 (FVLR->FVLA, R358A) | This paper | pSH1045 | Baculovirus expression plasmid |
| Recombinant DNA reagent | ybbr-PIK3R1 (FVLR->FVLA, R358A) | This paper | pSH1046 | Baculovirus expression plasmid |
| Recombinant DNA reagent | his6-TEV-PIK3CB (1-1070aa; K532D,K533D) | This paper | pSH1094 | Baculovirus expression plasmid |
| Recombinant DNA reagent | his6-Gg2, Gb1 (DUAL FastBac) | PMID:34452907 | pSH414 | Baculovirus expression plasmid |
| Recombinant DNA reagent | his6-Gg2, SNAP-Gb1 (DUAL FastBac) | PMID:34452907 | pSH651 | Baculovirus expression plasmid |
| Recombinant DNA reagent | PIK3CG(p110g), TwinStrept-his10-TEV-ybbr-PIK3R5(p101) | PMID:36842083 | HP29 | Baculovirus expression plasmid |
| Software, algorithm | GraphPad Prism 9 | GraphPad | https://www.graphpad.com | |
| Software, algorithm | Chimera | UCSF | https://www.rbvi.ucsf.edu/chimera/ | |
| Software, algorithm | ImageJ/Fiji | ImageJ | https://imagej.net/software/fiji/ | |
| Software, algorithm | Nikon NIS elements | Nikon | https://www.microscope.healthcare.nikon.com/products/software/nis-elements | |
| Cell line(Spodoptera frugiperda) | Sf9 insect cells | Expression Systems | 94–001 S | |
| Cell line (Trichoplusiani) | High five insect cells | UC Berkeley Barker Hall Tissue Culture Facility | High five insect cells | |
| Other | ESF 921 Serum-Free Insect Cell Culture media | Expression Systems | 96-001-01 | Media for insect cell culture |
| Other | Fetal Bovine serum | Seradigm | 1500–500 | Media for insect cell culture |
| Other | Hellmanex III cleaning solution | Fisher | 14-385-864 | Reagent for cleaning coverslips prior to Pirahna etching |
Additional files
Download links
A two-part list of links to download the article, or parts of the article, in various formats.
Downloads (link to download the article as PDF)
Open citations (links to open the citations from this article in various online reference manager services)
Cite this article (links to download the citations from this article in formats compatible with various reference manager tools)
Molecular dissection of PI3Kβ synergistic activation by receptor tyrosine kinases, GβGγ, and Rho-family GTPases
eLife 12:RP88991.
https://doi.org/10.7554/eLife.88991.3


