The zinc transporter Slc30a1 (ZnT1) in macrophages plays a protective role against attenuated Salmonella
- The Second Affiliated Hospital, School of Public Health, State Key Laboratory of Experimental Hematology, Zhejiang University School of Medicine, China
- The First Affiliated Hospital, Institute of Translational Medicine, Zhejiang University School of Medicine, China
- School of Public Health, Zhengzhou University, China
Figures
Figure 1 with 2 supplements
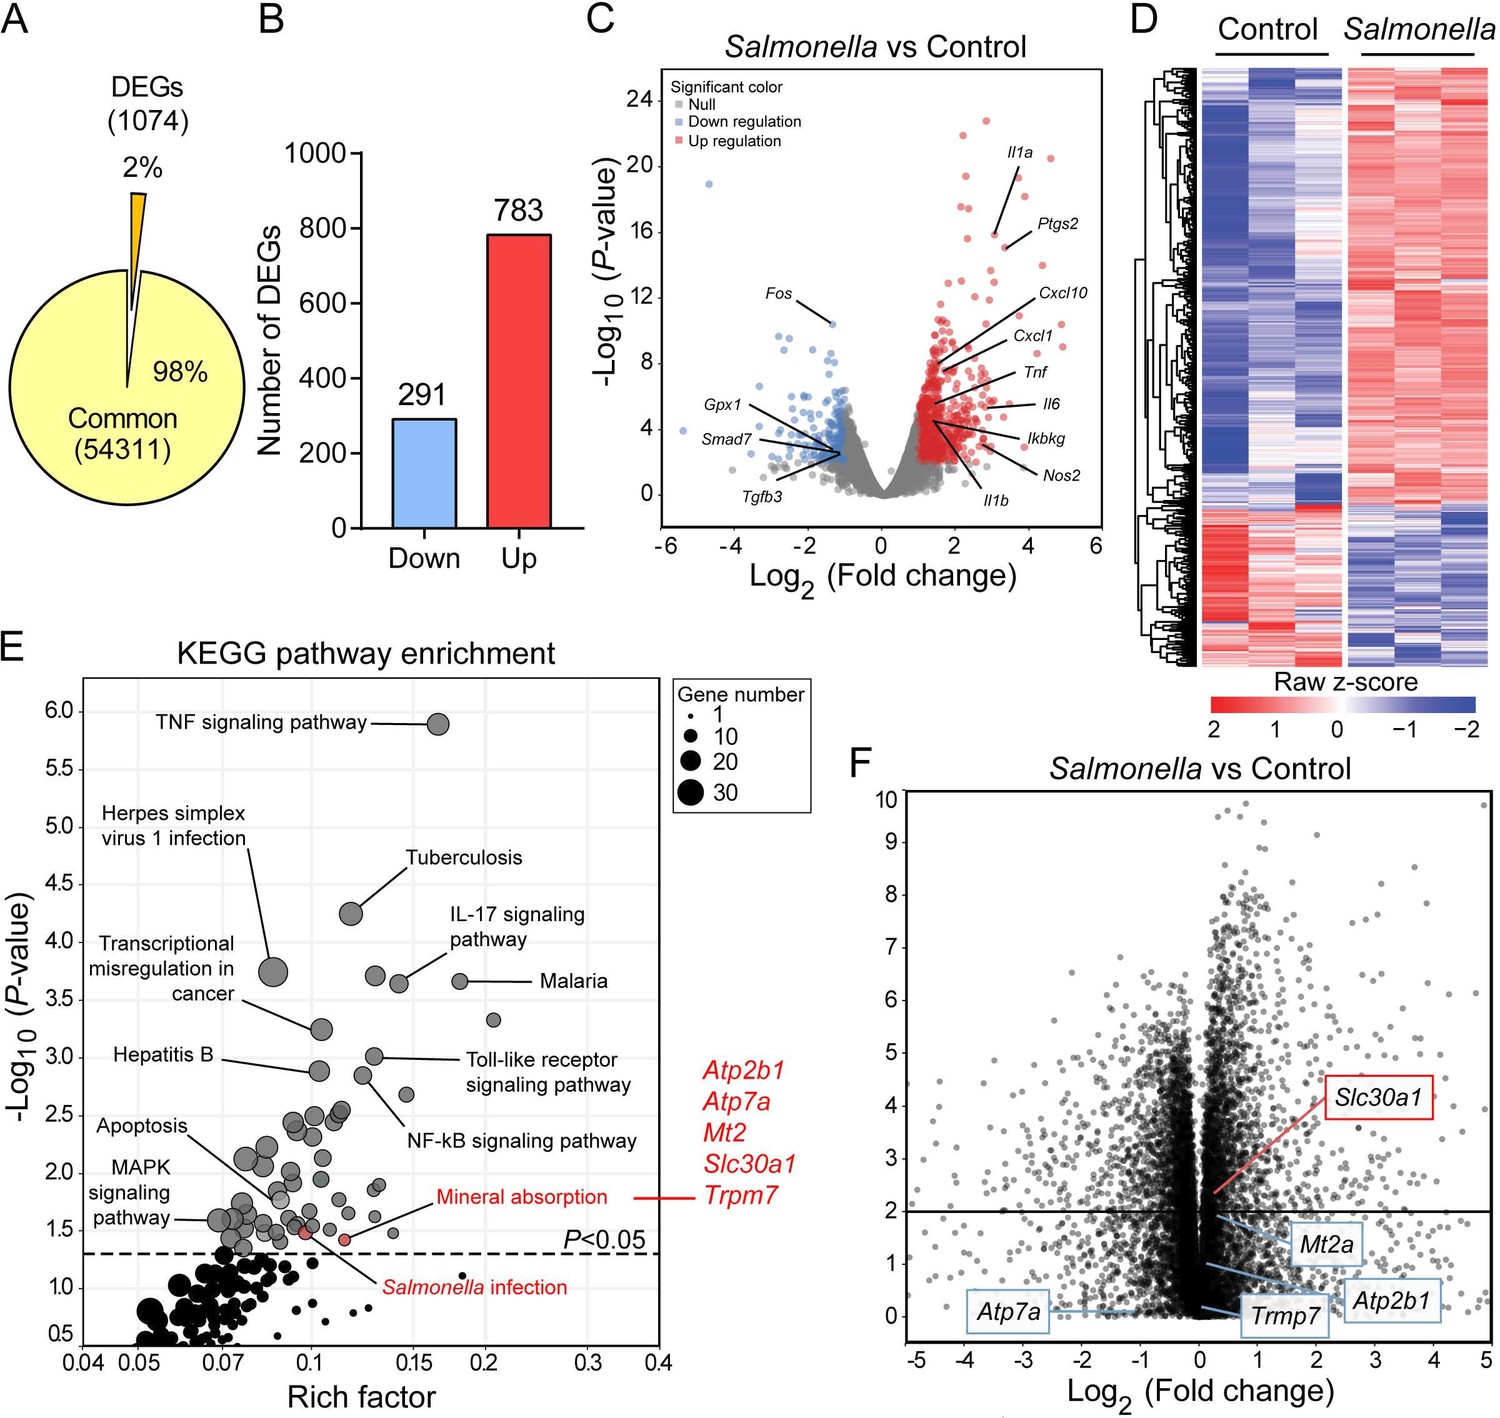
Slc30a1 expression is upregulated in Salmonella-infected macrophages.
(A) Pie chart summarizing the percentage of unchanged genes and differentially expressed genes (DEGs) in wild-type (WT) bone marrow-derived macrophages (BMDMs) 2 h after Salmonella infection (multiplicity of infection [MOI] = 1) (n = 3) using RNA sequencing (RNA-seq) analysis. (B) Bar graph displaying the number of DEGs including up- and downregulated genes identified by p < 0.05 and an absolute log2 fold change >1; shown at the right is the total number of down- and upregulated genes. (C) Volcano plot displaying the fold change in gene expression and corresponding p values for Salmonella-infected cells versus control (uninfected) cells. (D) Heatmap showing the pattern of DEGs in BMDMs measured between Salmonella-infected cells and control cells. (E) Kyoto Encyclopedia of Genes and Genomes (KEGG) enrichment pathways (p < 0.05) of DEGs between Salmonella-infected cells and control cells. (F) Schematic diagram (left) illustrating the use of RNA-seq analysis on human monocyte-derived macrophages (MDMs) infected with Salmonella for 4 hr and volcano plot (right) of DEGs in Salmonella-infected MDMs based on a previously published dataset (GSE67427); the Atp2b1, Atp7a, Mt2, Slc30a1, and Trpm7 genes are indicated.
Figure 1—figure supplement 1
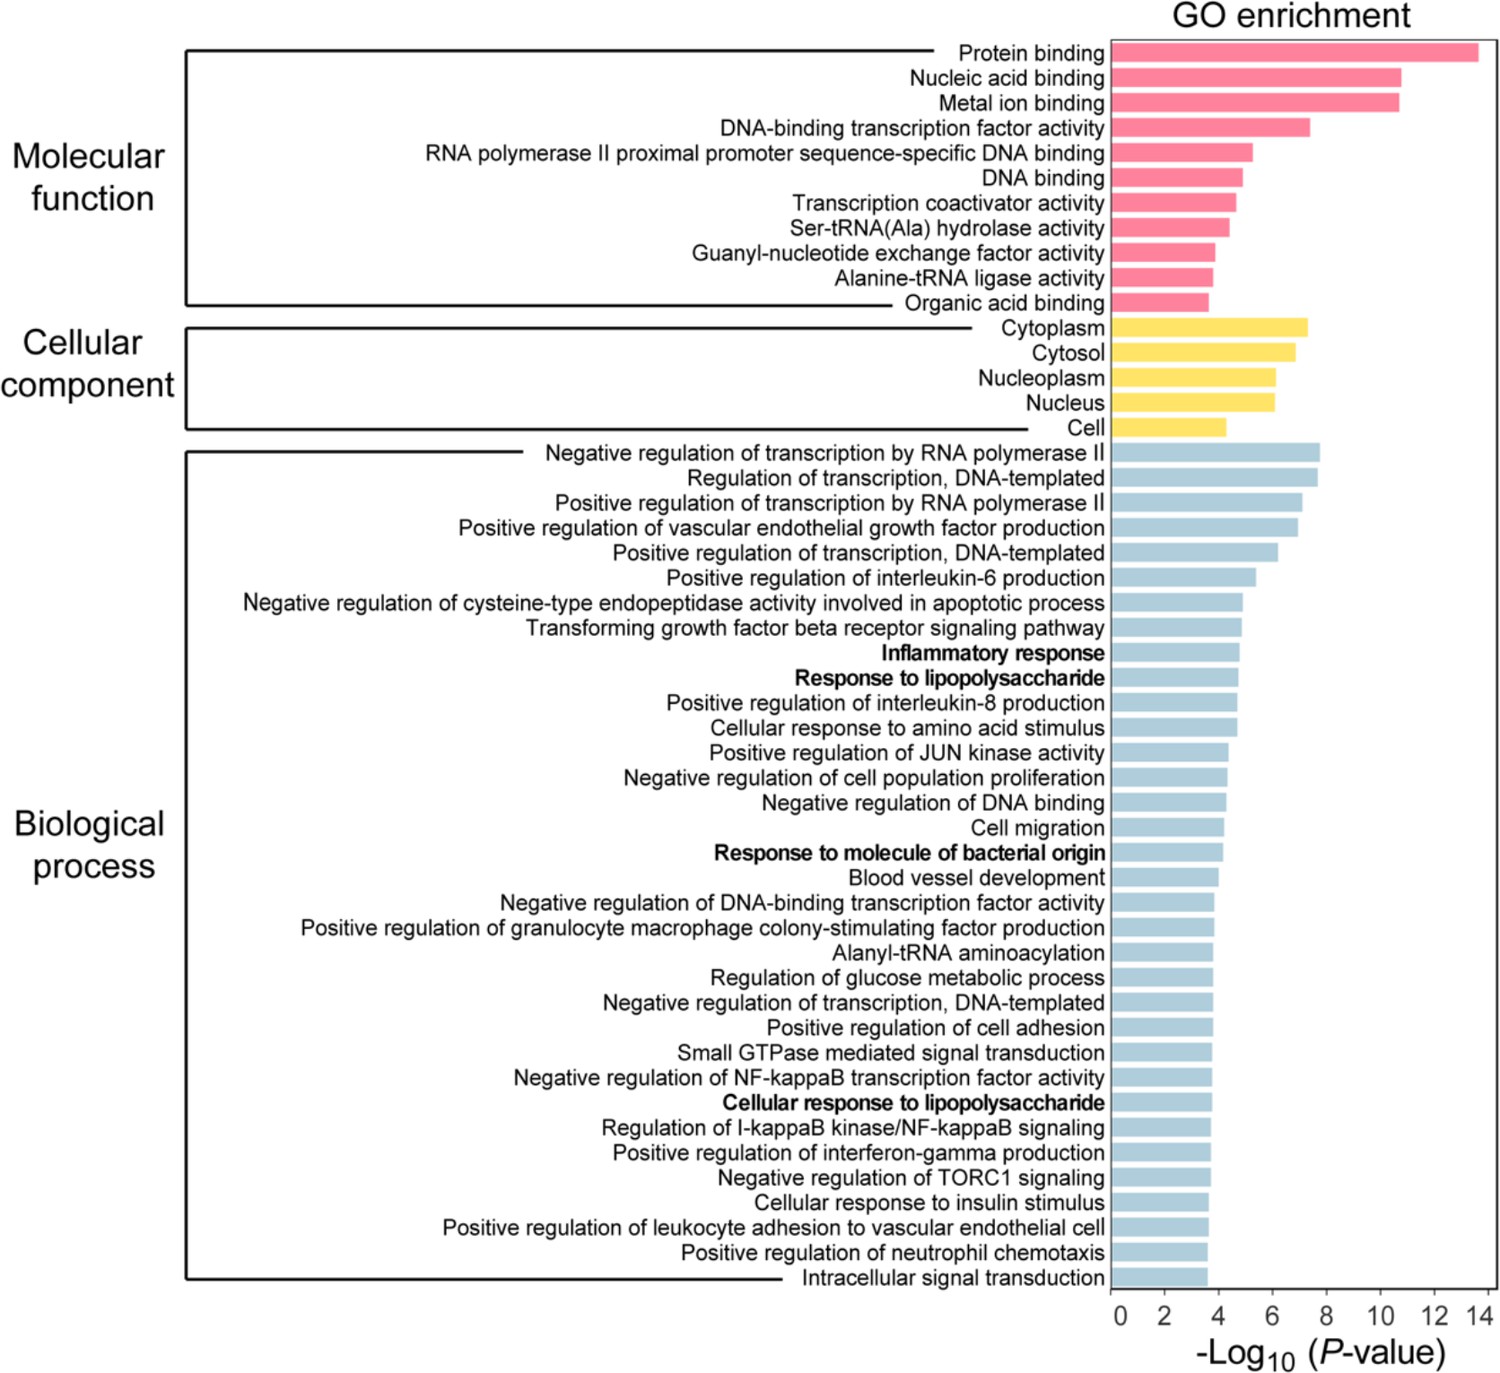
Gene ontology (GO) enrichment analysis of differentially expressed genes (DEGs) in bone marrow-derived macrophages (BMDMs) with or without Salmonella infection.
Figure 1—figure supplement 2
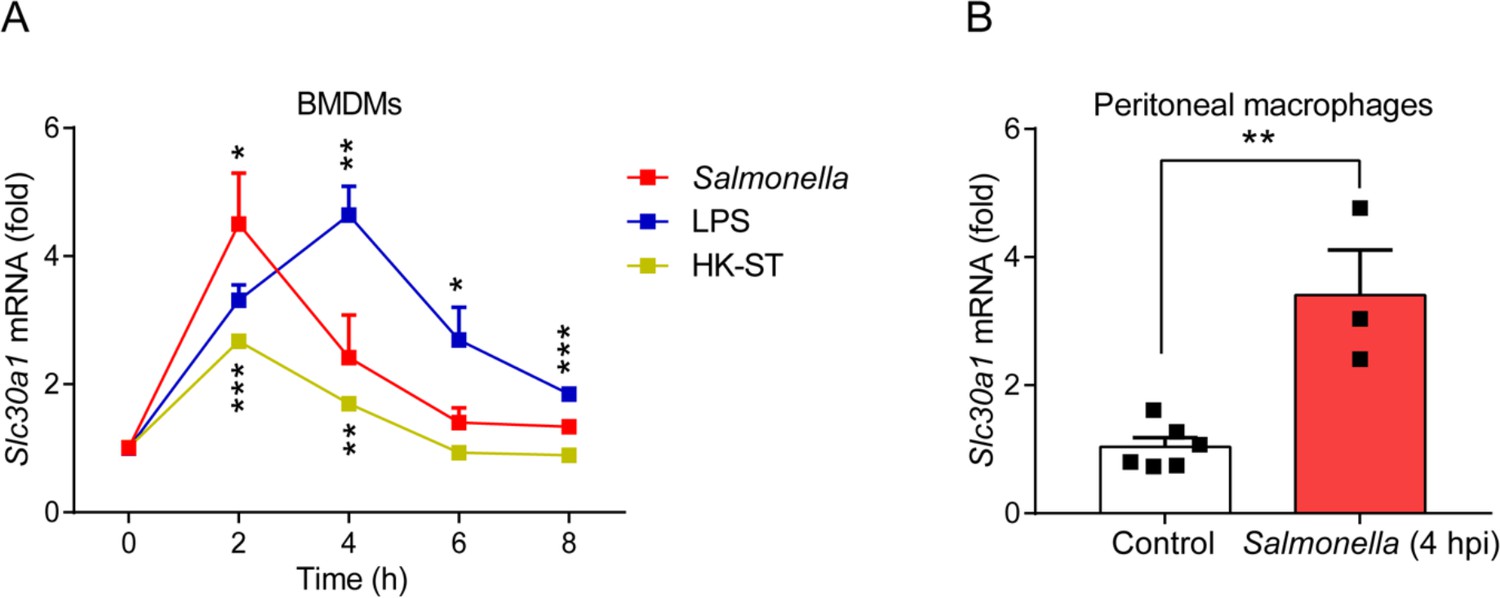
The gene expression of Slc30a1 in macrophages is induced by Salmonella infection.
Figure 2
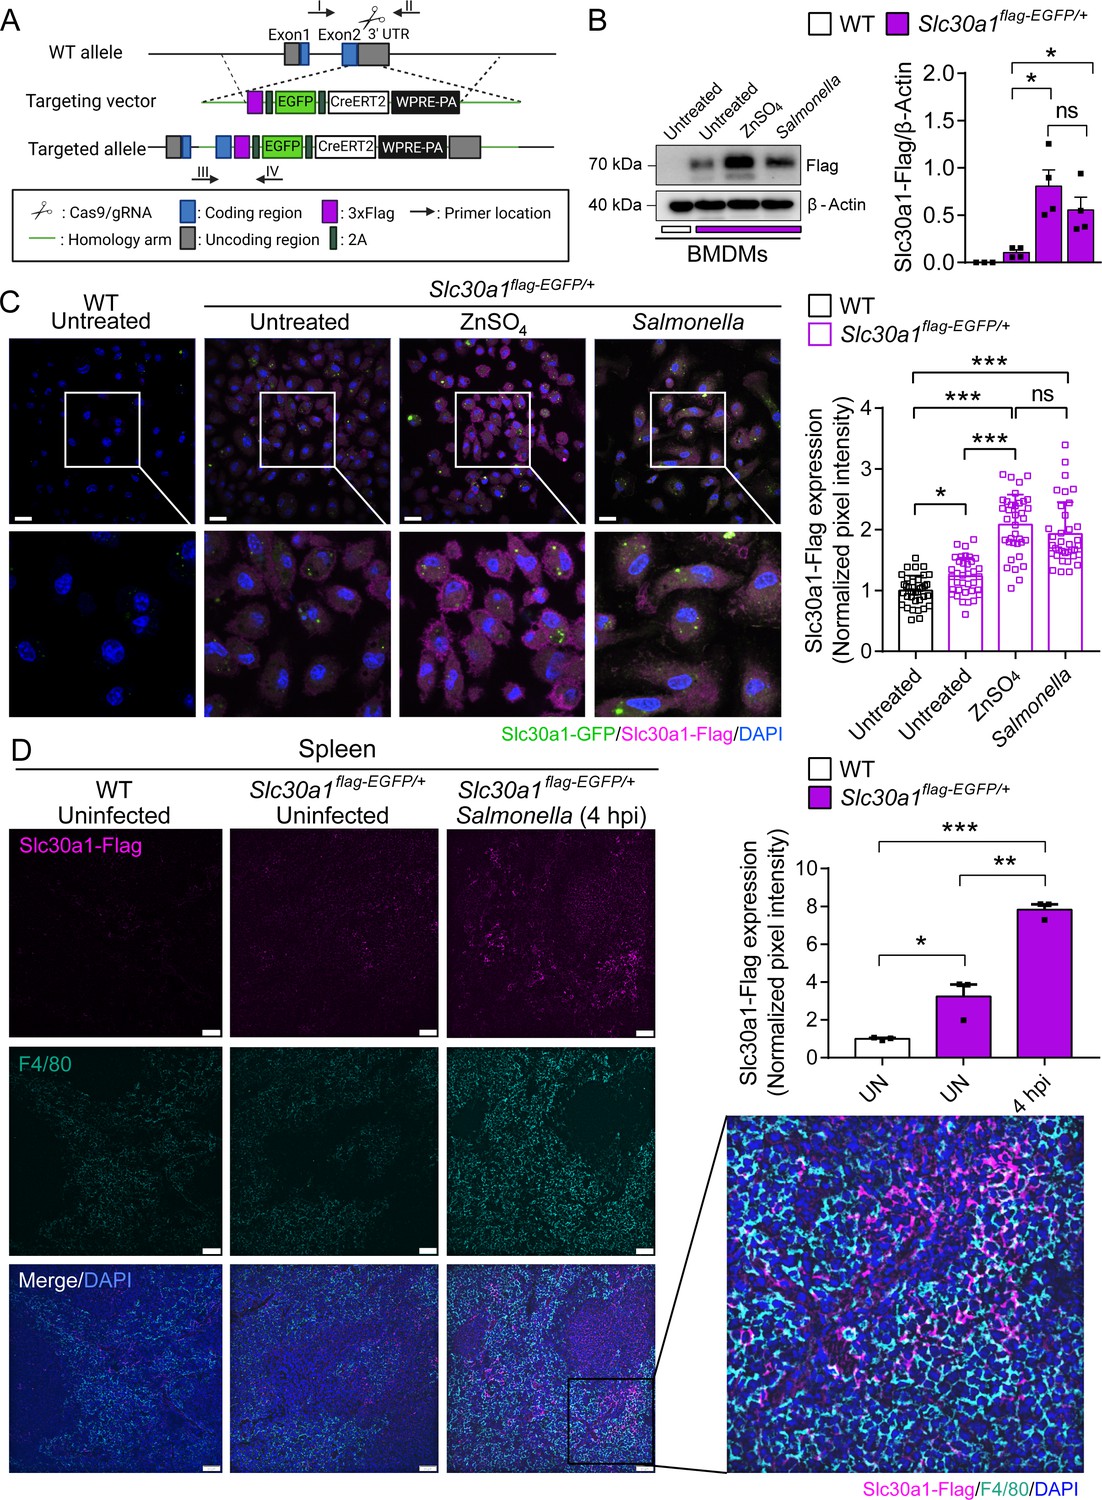
Characterization of a Slc30a1 reporter mouse with or without Salmonella infection.
(A) Strategy for generating an Slc30a1 reporter mouse line expressing 3xFlag-EGFP under the control of the endogenous Slc30a1 promotor (Slc30a1flag-EGFP/+). (B) Western blot analysis of Slc30a1-flag in bone marrow-derived macrophages (BMDMs) isolated from Slc30a1flag-EGFP/+mice and exposed to ZnSO4 treatment (40 µM) or Salmonella (multiplicity of infection [MOI] = 1) for 4 hr. (C) Confocal fluorescence images of BMDMs treated as shown in B and immunostained using an anti-flag antibody (magenta); the nuclei were counterstained with DAPI(4′,6-diamidino-2-phenylindole) (blue), and GFP(Green fluorescent protein) was visualized directly based on green fluorescence. Scale bars, 20 µm. Shown at the right is the summary of the normalized pixel intensity of Slc30a1-flag expression in BMDMs in each group. (D) Confocal fluorescence images of spleen samples obtained from a Salmonella-infected mouse at 4 hpi; also shown are samples of uninfected WT and Slc30a1flag-EGFP/+ mice. The samples were stained with anti-flag (magenta) and anti-F4/80 (cyan), and the nuclei were counterstained with DAPI (blue). Scale bars, 50 µm. Shown at the right is the summary of the normalized pixel intensity of Slc30a1-flag expression in the spleen in each group. Data are presented as mean ± SEM(Standard Error of the Mean). p values were determined using two-tailed unpaired Student’s t-test. *p < 0.05, **p < 0.01, ***p < 0.001, and ns, not significant.
-
Figure 2—source data 1
Raw images of western blot analysis for Slc30a1-flag expression.
- https://cdn.elifesciences.org/articles/89509/elife-89509-fig2-data1-v1.zip
Figure 3 with 1 supplement
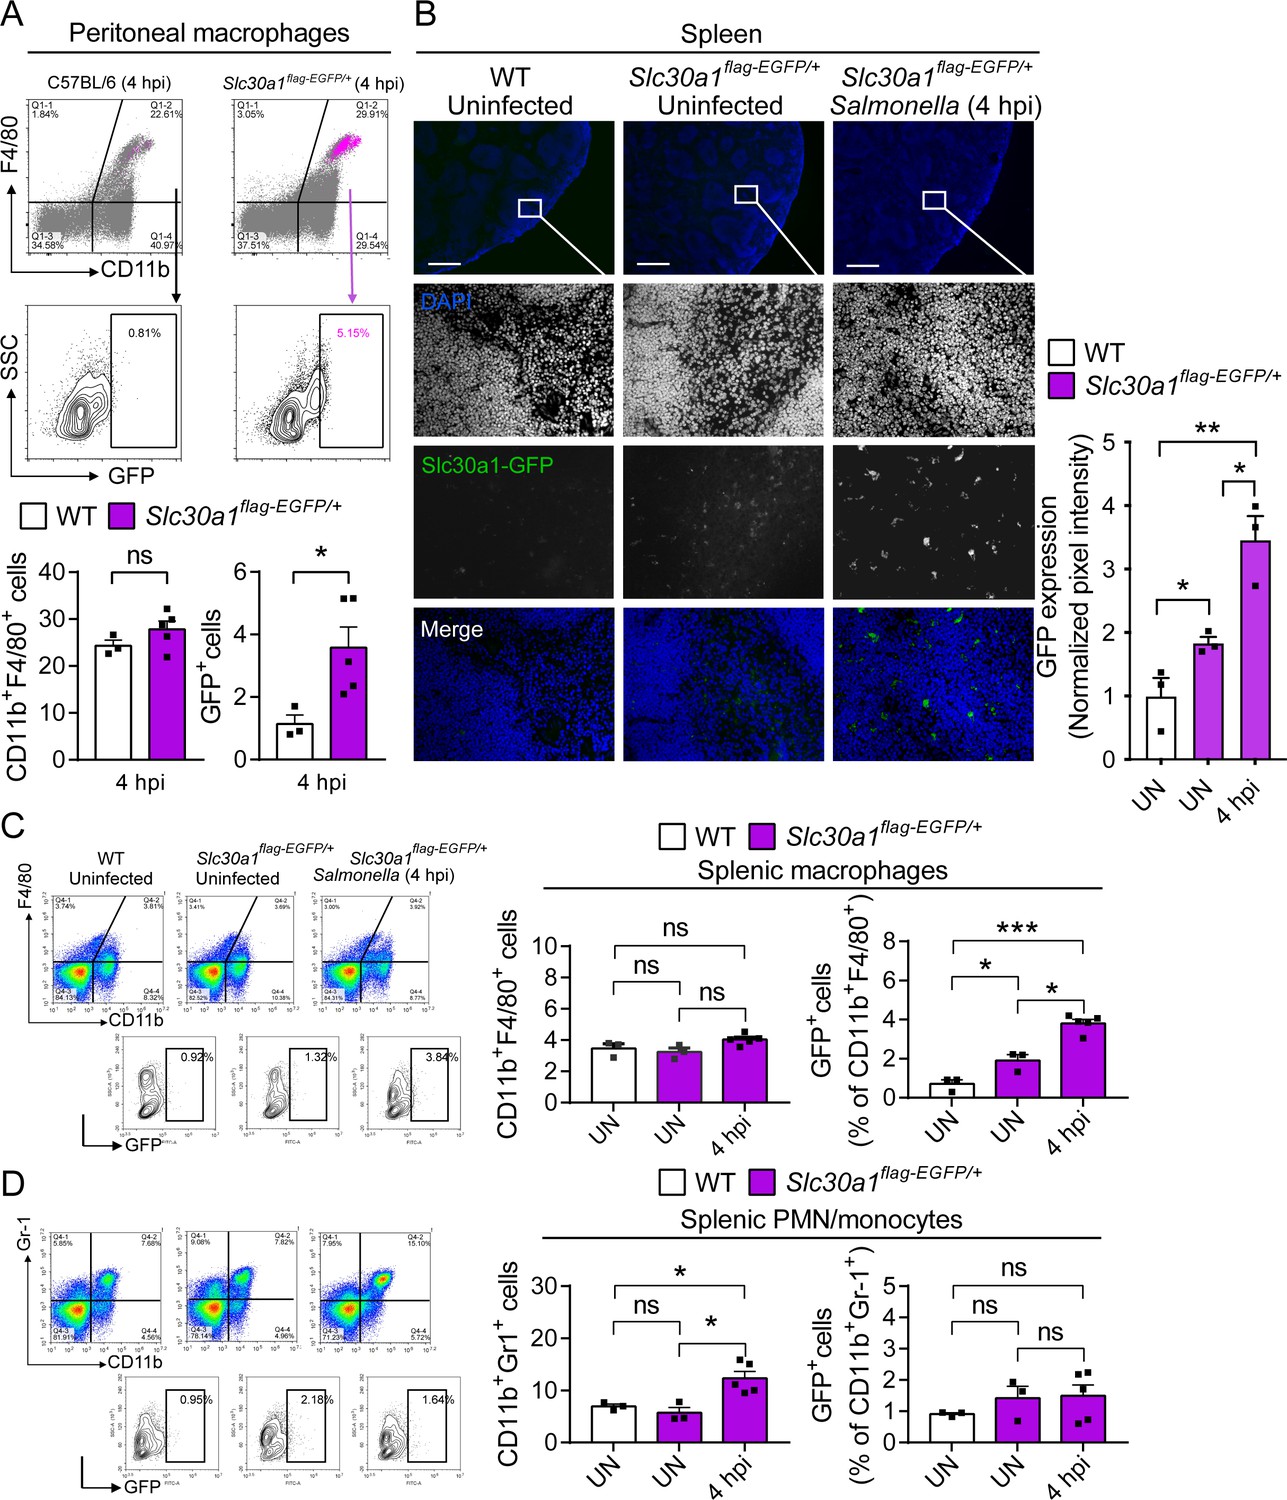
Induction of Slc30a1 expression in macrophages of a Slc30a1 reporter mouse upon Salmonella infection.
(A) FACS(Fluorescence-activated cell sorting) plots of GFP expression in CD11b+F4/80+ macrophages isolated from the peritoneal cavity of Salmonella-infected WT mice and Salmonella-infected Slc30a1flag-EGFP/+ mice at 4 hpi (n = 3–5 mice/group). (B) Fluorescence microscopy images of spleen samples obtained from a Salmonella-infected mouse at 4 hpi; also shown are samples of uninfected WT and Slc30a1flag-EGFP/+ mice. The green region indicated the Slc30a1-GFP expression, and the blue region indicated the nuclei staining by DAPI. Scale bar, 500 μm. FACS plots of GFP expression in CD11b+F4/80+ splenic macrophages (C) and CD11b+Gr-1+ splenic PMN/monocyte (D) isolated from the spleens of uninfected WT mice, uninfected Slc30a1flag-EGFP/+ mice, and Salmonella-infected Slc30a1flag-EGFP/+ mice at 4 hpi (n = 3–5 mice/group). Shown at the right is the summary of the percentage of CD11b+F4/80+ splenic macrophages and CD11b+Gr-1+ splenic PMN/monocyte in each group. Data in this figure are represented as mean ± SEM. p values were determined using two-tailed unpaired Student’s t-test. *p < 0.05, **p < 0.01, ***p < 0.001, and ns, not significant.
Figure 3—figure supplement 1
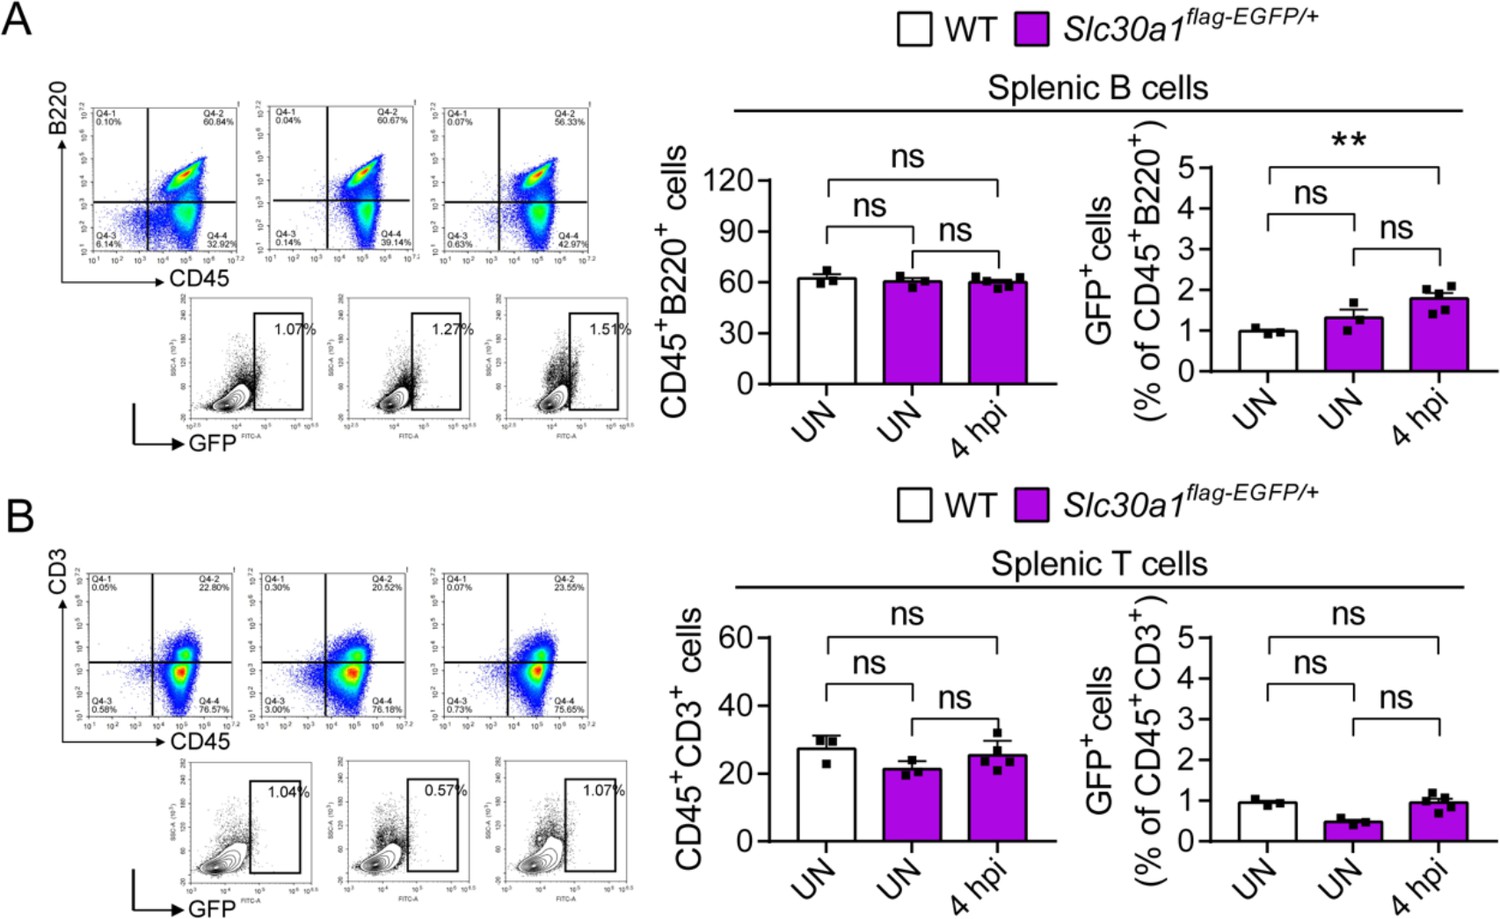
Proportion of splenic white blood cells in Slc30a1flag-EGFP/+ after Salmonella infection.
FACS plots of GFP expression in CD45+B220+ splenic B cells (A) and CD45+CD3+ splenic T cells (B) isolated from the spleens of uninfected WT mice, uninfected Slc30a1flag-EGFP/+ mice, and Salmonella-infected Slc30a1flag-EGFP/+ mice at 4 hpi (n = 3-5 mice/group). Shown at the right is the summary of the percentage of CD45+B220+ splenic B cells and CD45+CD3+ splenic T cells in each group. Data in this figure are represented as mean ± SEM. P values were determined using 2-tailed unpaired Student’s t-test. **P<0.01 and ns, not significant.
Figure 4 with 2 supplements
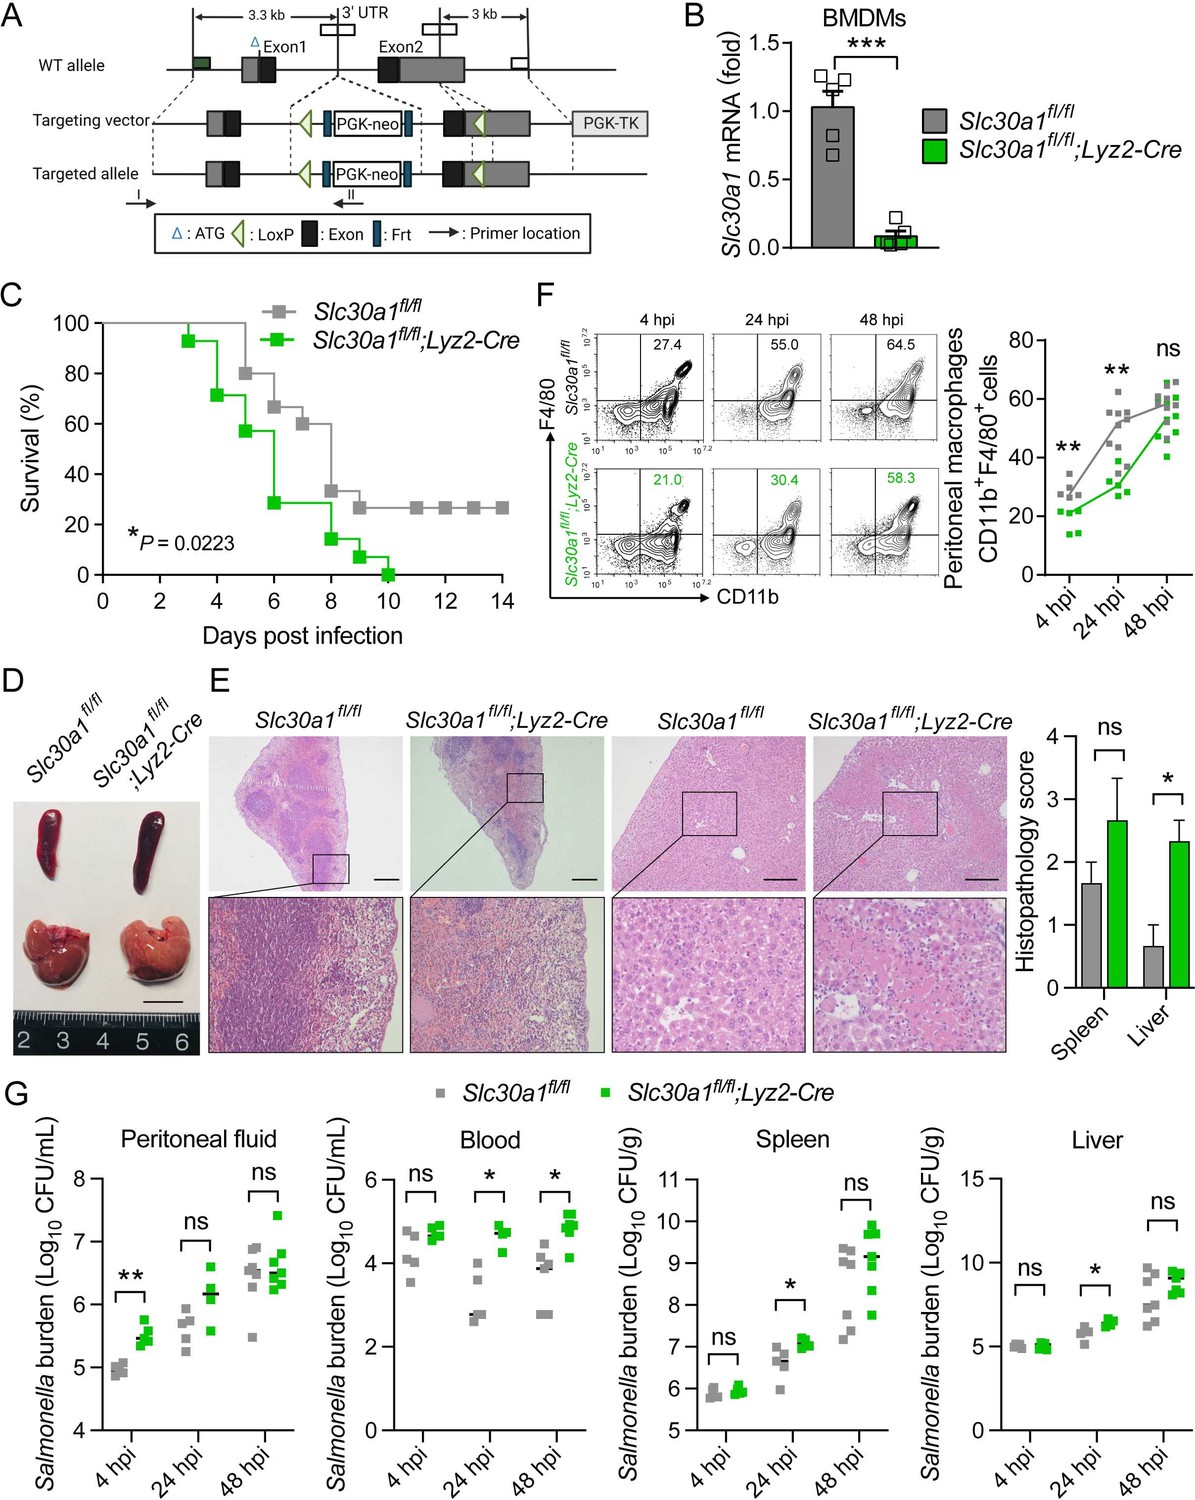
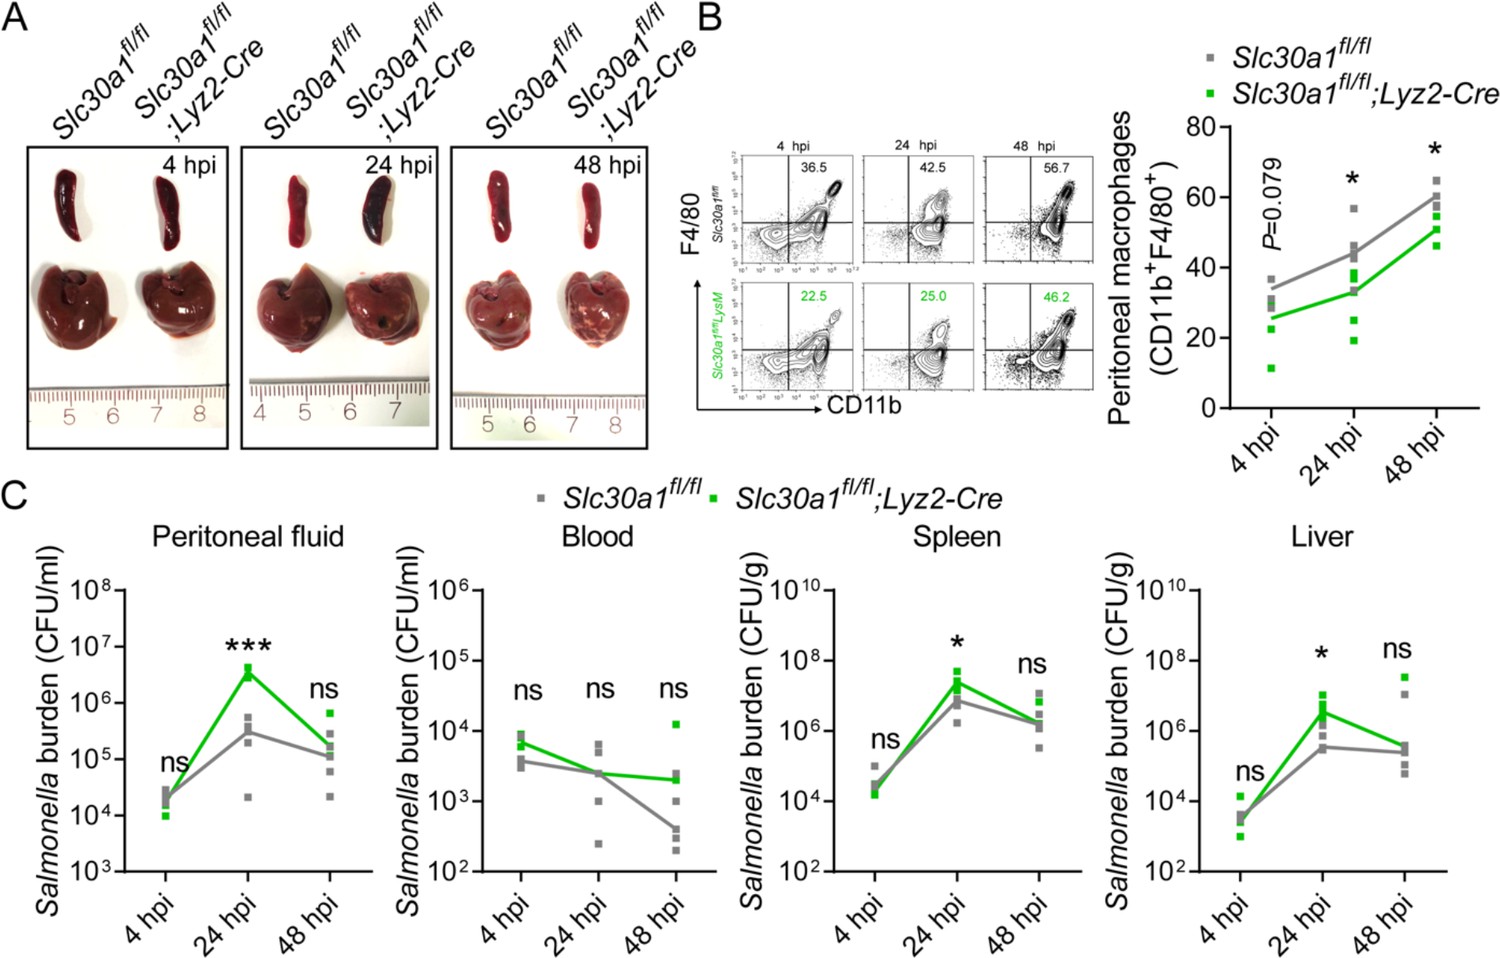
Lyz2-Cre-driven Slc30a1 conditional knockout mice are highly susceptible to Salmonella infection.
(A) Strategy for generating floxed Slc30a1 mice. Crossing this mouse with a heterozygous Lyz2-Cre mouse produces Slc30a1fl/fl;Lyz2-Cre and Slc30a1fl/fl littermates. (B) RT-qPCR analysis of relative Slc30a1 mRNA levels in bone marrow-derived macrophages (BMDMs) isolated from Slc30a1fl/fl;Lyz2-Cre and Slc30a1fl/fl mice (n = 5). (C) Kaplan–Meier survival curve of Salmonella-infected mice (n = 14–15 mice/group). (D, E) Gross and hematoxylin and eosin (H&E)-stained images of spleen and liver obtained from Salmonella-infected mice at 24 hpi. Scale bars, 1 cm, 5 mm and 10 mm, respectively. (F) FACS plots (left) and summary (right) of CD11b+F4/80+ peritoneal macrophages obtained from Salmonella-infected mice at 4, 24, and 48 hpi (n = 5–10 mice/group). (G) Summary of Salmonella CFUs measured in the peritoneal fluid, blood, spleen, and liver of Salmonella-infected mice at 4, 24, and 48 hpi (n = 3–5 mice/group). Data in this figure are represented as mean ± SEM. p values of survival in D were determined using Log-rank test, in B and F–K using two-tailed unpaired Student’s t-test. *p < 0.05, **p < 0.01, ***p < 0.001, and ns, not significant.
Figure 4—figure supplement 1
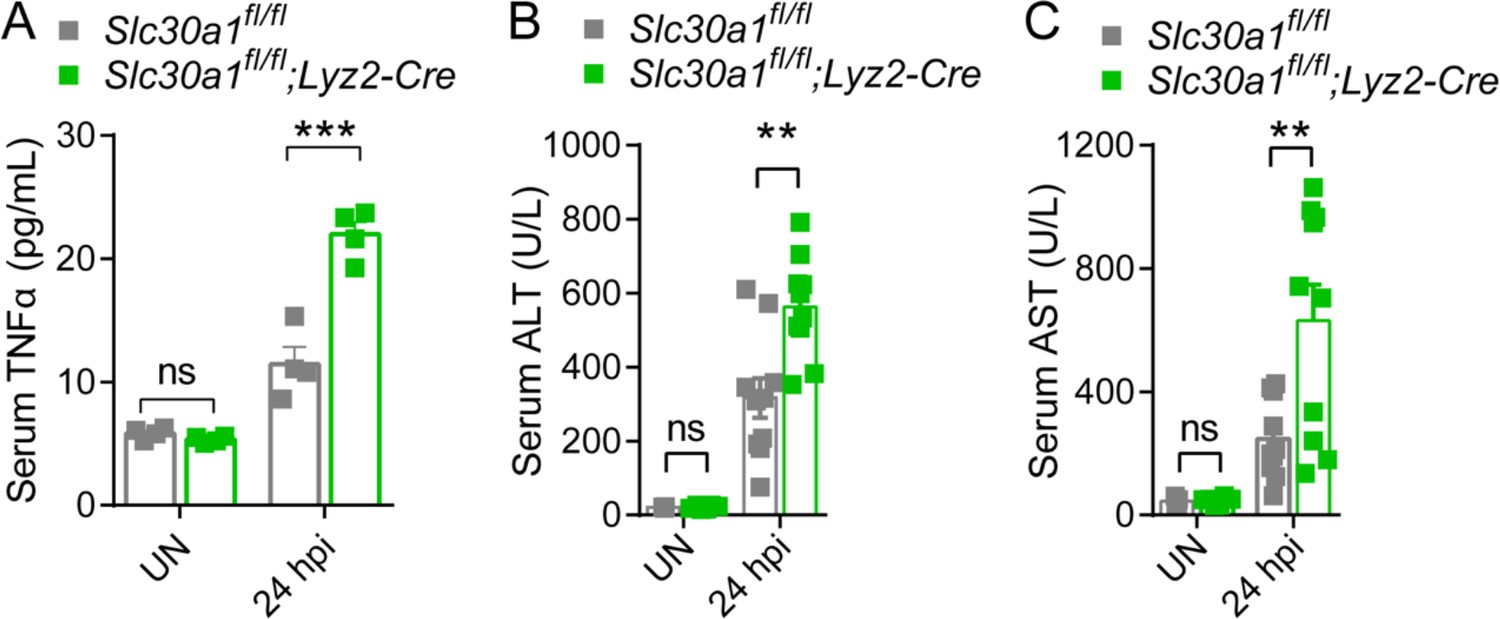
Elevated levels of proinflammatory cytokine and injury markers in the serum of Slc30a1fl/fl;Lyz2-Cre mice.
(A) Serum TNFα, (B) ALT, and (C) AST were measured in uninfected (UN) and Salmonella-infected mice at 24 hpi (n = 4-10 mice/group). Data are represented as mean ± SEM. P values were determined using 2-tailed unpaired Student’s t-test. *P<0.05 and ns, not significant.
Figure 4—figure supplement 2
Salmonella infection leads to significantly decreased macrophages and increased tissue bacterial burden in Slc30a1fl/fl;Lyz2-Cre mice.
(A) Gross image of spleen and liver of mice after infection with a non-lethal dose of Salmonella (1x10⁴ CFU/mouse) 4, 24, and 48 hpi. Scale bars, 1 cm. (B) FACS plots of CD11b+F4/80+ peritoneal macrophages obtained from Salmonella-infected Slc30a1fl/fl and Slc30a1fl/fl;Lyz2-Cre mice (n = 3-5 mice/group). (C) Bacterial burden (in CFU/ml) measured in the peritoneal fluid, blood, spleen, and liver of Salmonellainfected Slc30a1fl/fl and Slc30a1fl/fl;Lyz2-Cre mice (n = 3-5 mice/group). Data are represented as mean ± SEM. P values were determined using 2-tailed unpaired Student’s t-test. *P<0.05, ***P<0.001, and ns, not significant.
Figure 5 with 1 supplement
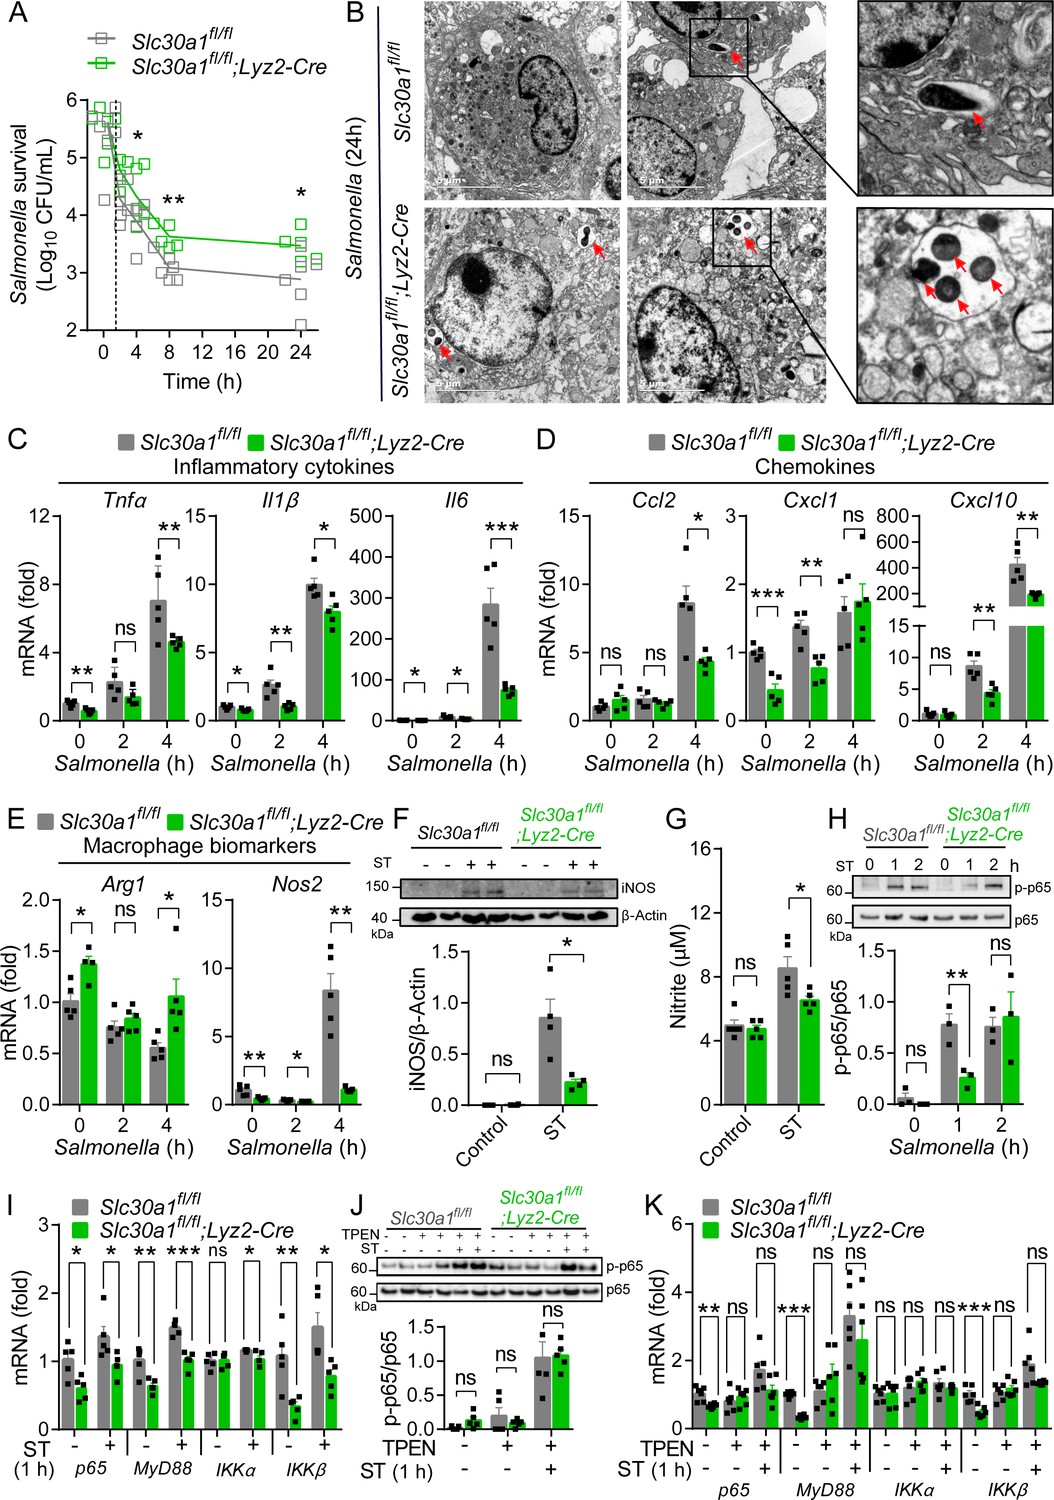
Slc30a1 is required for iNOS/nitric oxide (NO) production and intracellular pathogen-killing capacity of macrophages in response to Salmonella infection.
(A) Time course of the intracellular pathogen-killing capacity of Salmonella-infected Slc30a1fl/fl;Lyz2-Cre and Slc30a1fl/fl bone marrow-derived macrophages (BMDMs) measured in colony-forming units per ml (n = 5). (B) Transmission electron microscopy images of Salmonella-infected BMDMs at 24 hpi. Red arrows indicate bacterial-containing phagosomes, and the insets show magnified images of bacterial engulfment. Scale bars, 5 µm. (C–E) RT-qPCR analysis of mRNAs encoding inflammatory cytokines (Tnfα, Il1β, and Il6), chemokines (Ccr2, Ccl2, Cxcl1, and Cxcl10) and macrophage biomarkers (Nos2 and Arg1) in BMDMs measured at the indicated times after Salmonella infection (multiplicity of infection [MOI] = 1) (n = 5). (F) Western blot analysis and summary of iNOS protein in Slc30a1fl/fl;Lyz2-Cre and Slc30a1fl/fl BMDMs either untreated or stimulated with Salmonella for 24 hr (n = 3). (G) Summary of nitrite concentration measured in the cell culture supernatant of BMDMs either untreated or stimulated with Salmonella for 24 hr (n = 5). (H) Western blot analysis and summary of p-p65 and p65 measured at the indicated times in Salmonella-infected BMDMs (n = 3). (I) RT-qPCR analysis of mRNA levels of genes involved in nuclear factor kappa B (NF-κB) signaling (p65, MyD88, Ikkα, and Ikkβ) measured in BMDMs 60 min after Salmonella infection (n = 5). (J) Western blot analysis and summary of p-p65 and p65 measured in uninfected and Salmonella-infected BMDMs either with or without N,N,N′,N′-tetrakis-(2-pyridyl-methyl)-ethylenediamine (TPEN) (4 µM) for 60 min (n = 4). (K) RT-qPCR analysis of p65, MyD88, Ikkα, and Ikkβ mRNA in uninfected and Salmonella-infected BMDMs either with or without TPEN for 60 min (n = 6). Data in this figure are represented as mean ± SEM. p values were determined using two-tailed unpaired Student’s t-test. *p < 0.05, **p < 0.01, ***p < 0.001, and ns, not significant.
-
Figure 5—source data 1
Raw images of western blot analysis for iNOS and p65 expression.
- https://cdn.elifesciences.org/articles/89509/elife-89509-fig5-data1-v1.zip
-
Figure 5—source data 2
Raw images of western blot analysis for iNOS and related-cellular signaling proteins.
- https://cdn.elifesciences.org/articles/89509/elife-89509-fig5-data2-v1.zip
Figure 5—figure supplement 1
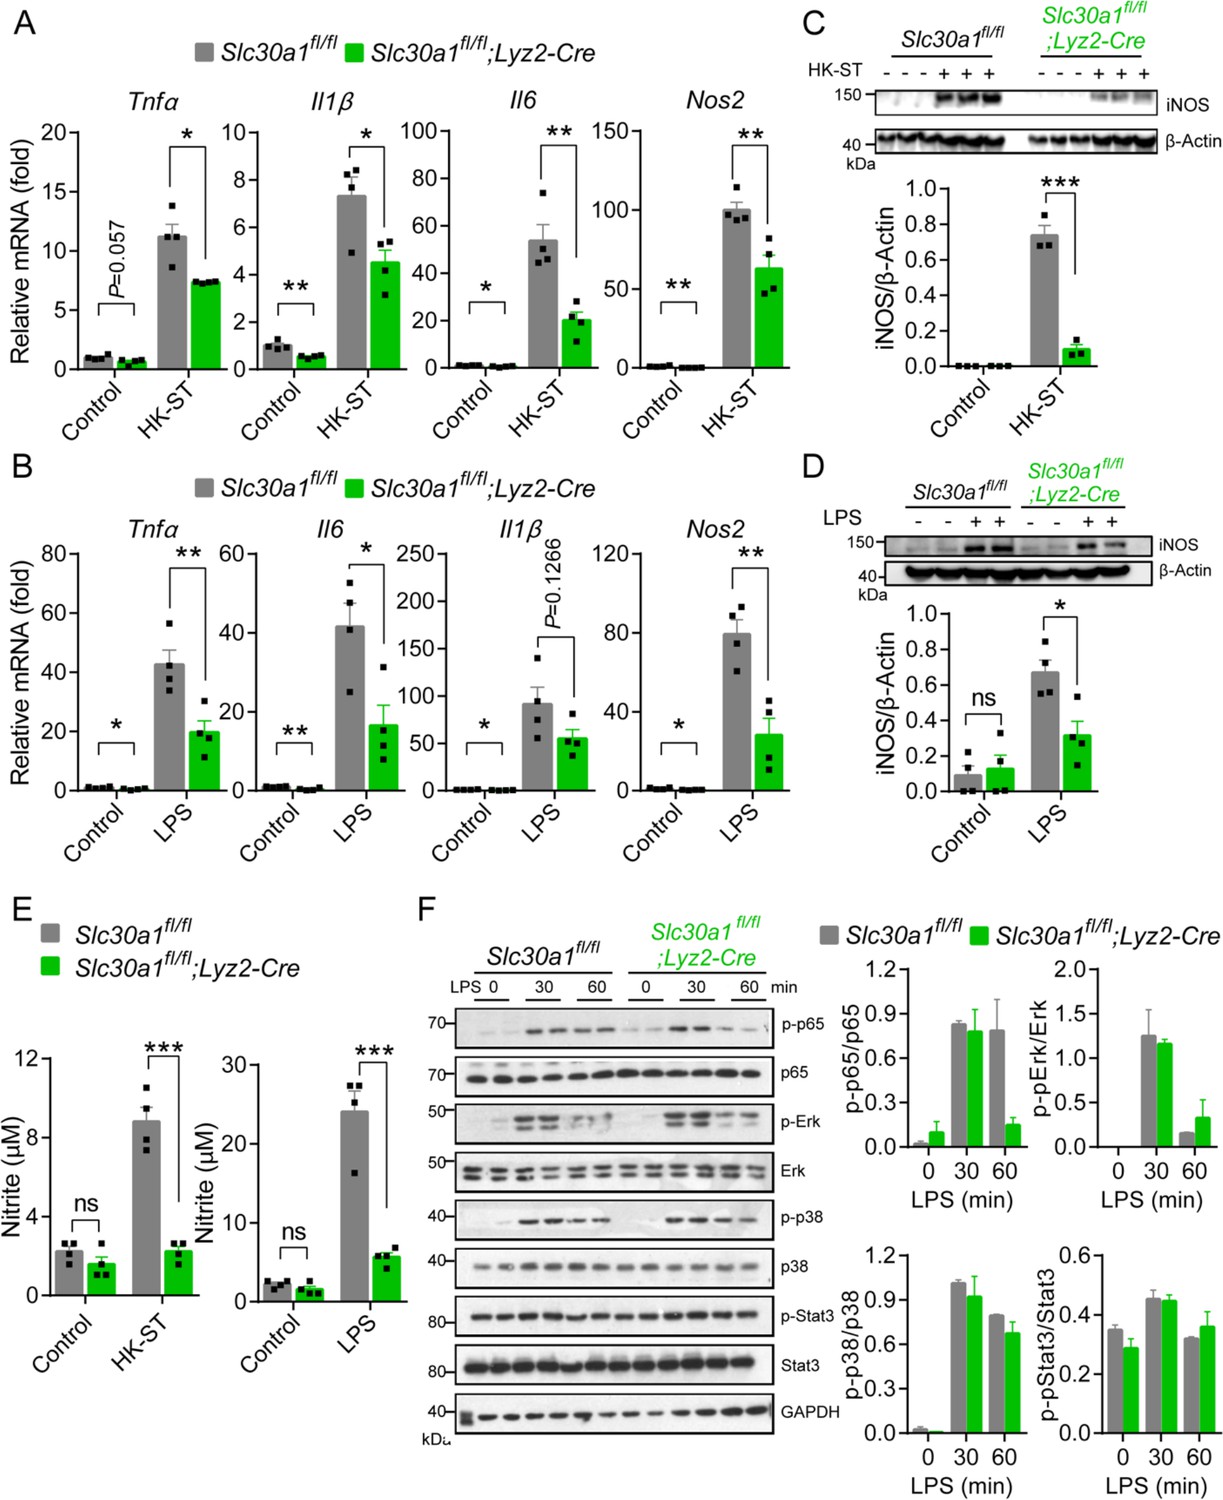
Loss of Slc30a1 in the murine macrophages reduces iNOS and nitric oxide (NO) production by inhibiting the nuclear factor kappa B (NF-κB) pathway.
Figure 6 with 2 supplements
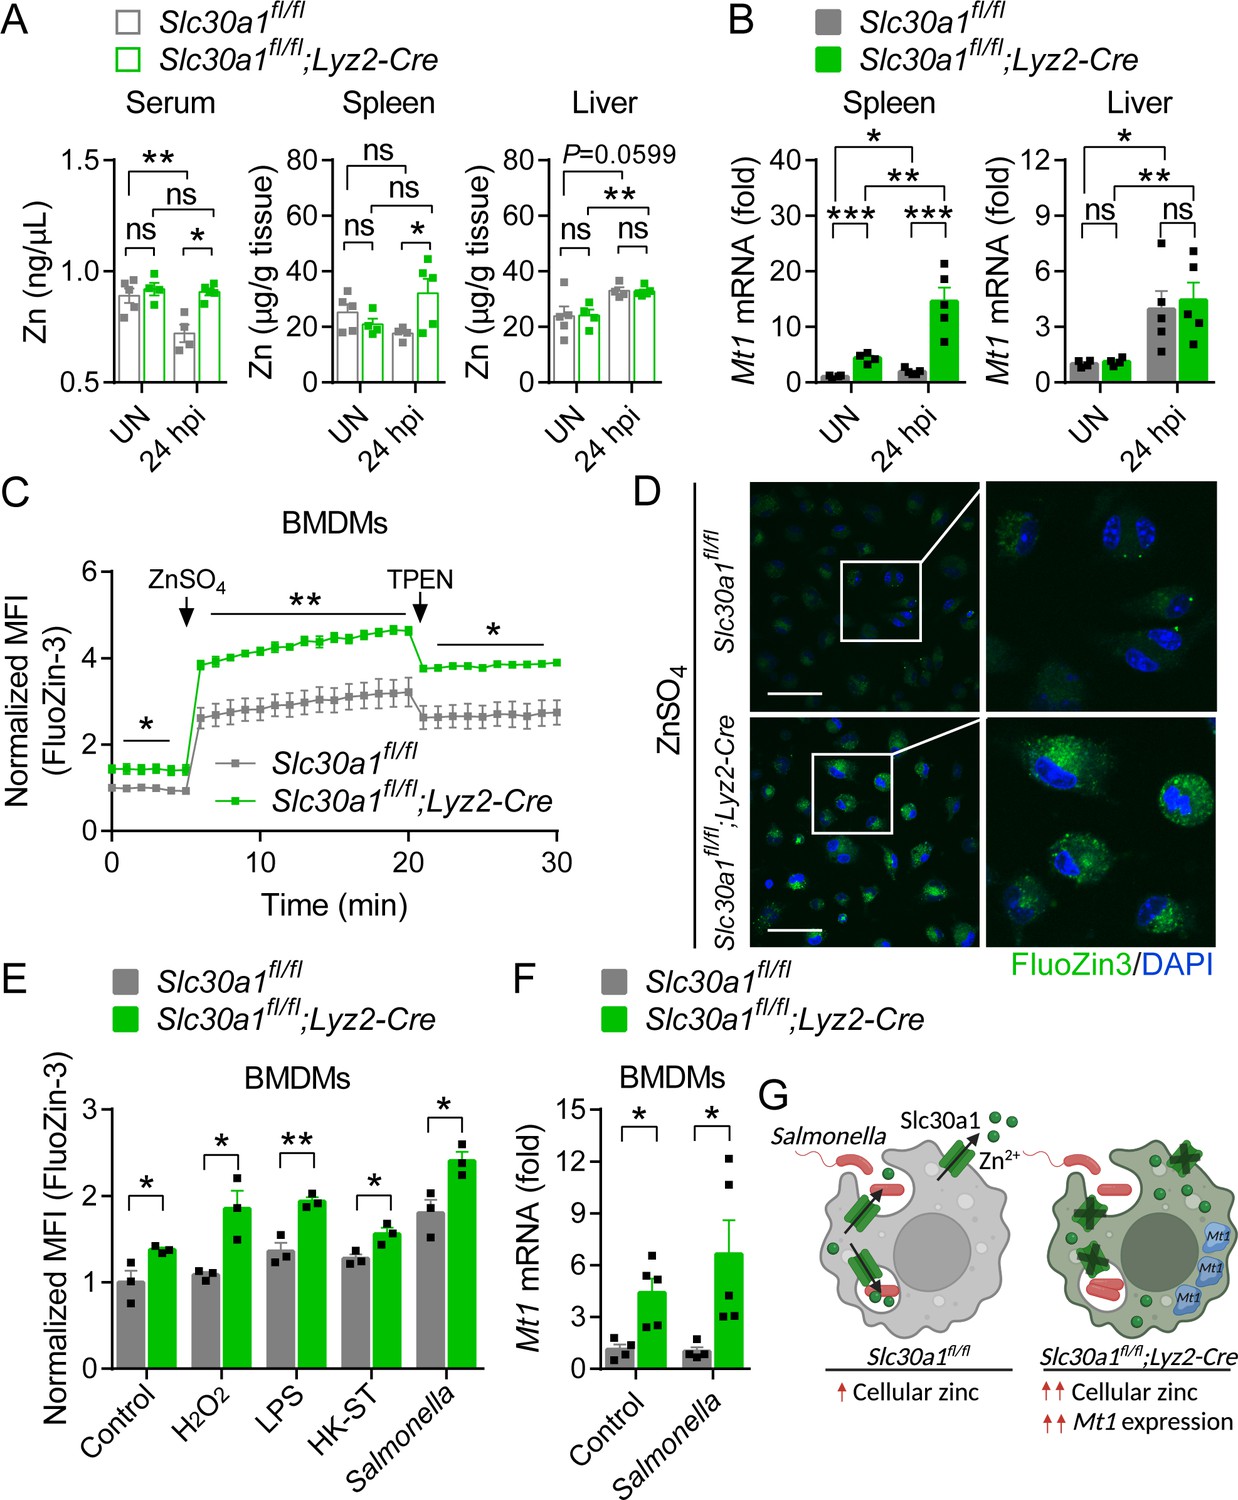
Loss of Slc30a1 in macrophages causes intracellular zinc accumulation.
(A) Summary of zinc (Zn) content measured in the serum, spleen, and liver of uninfected (UN) and Salmonella-infected mice at 24 hpi (n = 4–5 mice/group). (B) RT-qPCR analysis of Mt1 mRNA in the spleen and liver of the indicated mice. (C) Time course of normalized FluoZin-3 mean fluorescence intensity (MFI) measured in bone marrow-derived macrophages (BMDMs); where indicated, ZnSO4 (100 µM) and N, N,N′,N′-tetrakis-(2-pyridyl-methyl)-ethylenediamine (TPEN) (4 µM) were applied to the cells. (D) Confocal fluorescence images of BMDMs stained with FluoZin-3 (green) after treatment with ZnSO4 for 15 min; the nuclei were counterstained with DAPI (blue). Scale bars, 50 µm. (E) Summary of normalized FluoZin-3 MFI measured in BMDMs 30 min after application of H2O2 (1 mM), lipopolysaccharide (LPS; 1 µg/ml), heat-killed Salmonella typhimurium (HK-ST) (multiplicity of infection [MOI] = 100), or Salmonella (MOI = 10) (n = 3). (F) RT-qPCR analysis of Mt1 mRNA in uninfected and Salmonella-infected BMDMs (n = 5). (G) Model showing the predicted effects of the loss of Slc30a1 on cellular zinc trafficking and intracellular zinc accumulation in BMDMs in response to Salmonella infection. Data in this figure are represented as mean ± SEM. p values were determined using two-tailed unpaired Student’s t-test. *p < 0.05, **p < 0.01, ***p < 0.001, and ns, not significant.
Figure 6—figure supplement 1
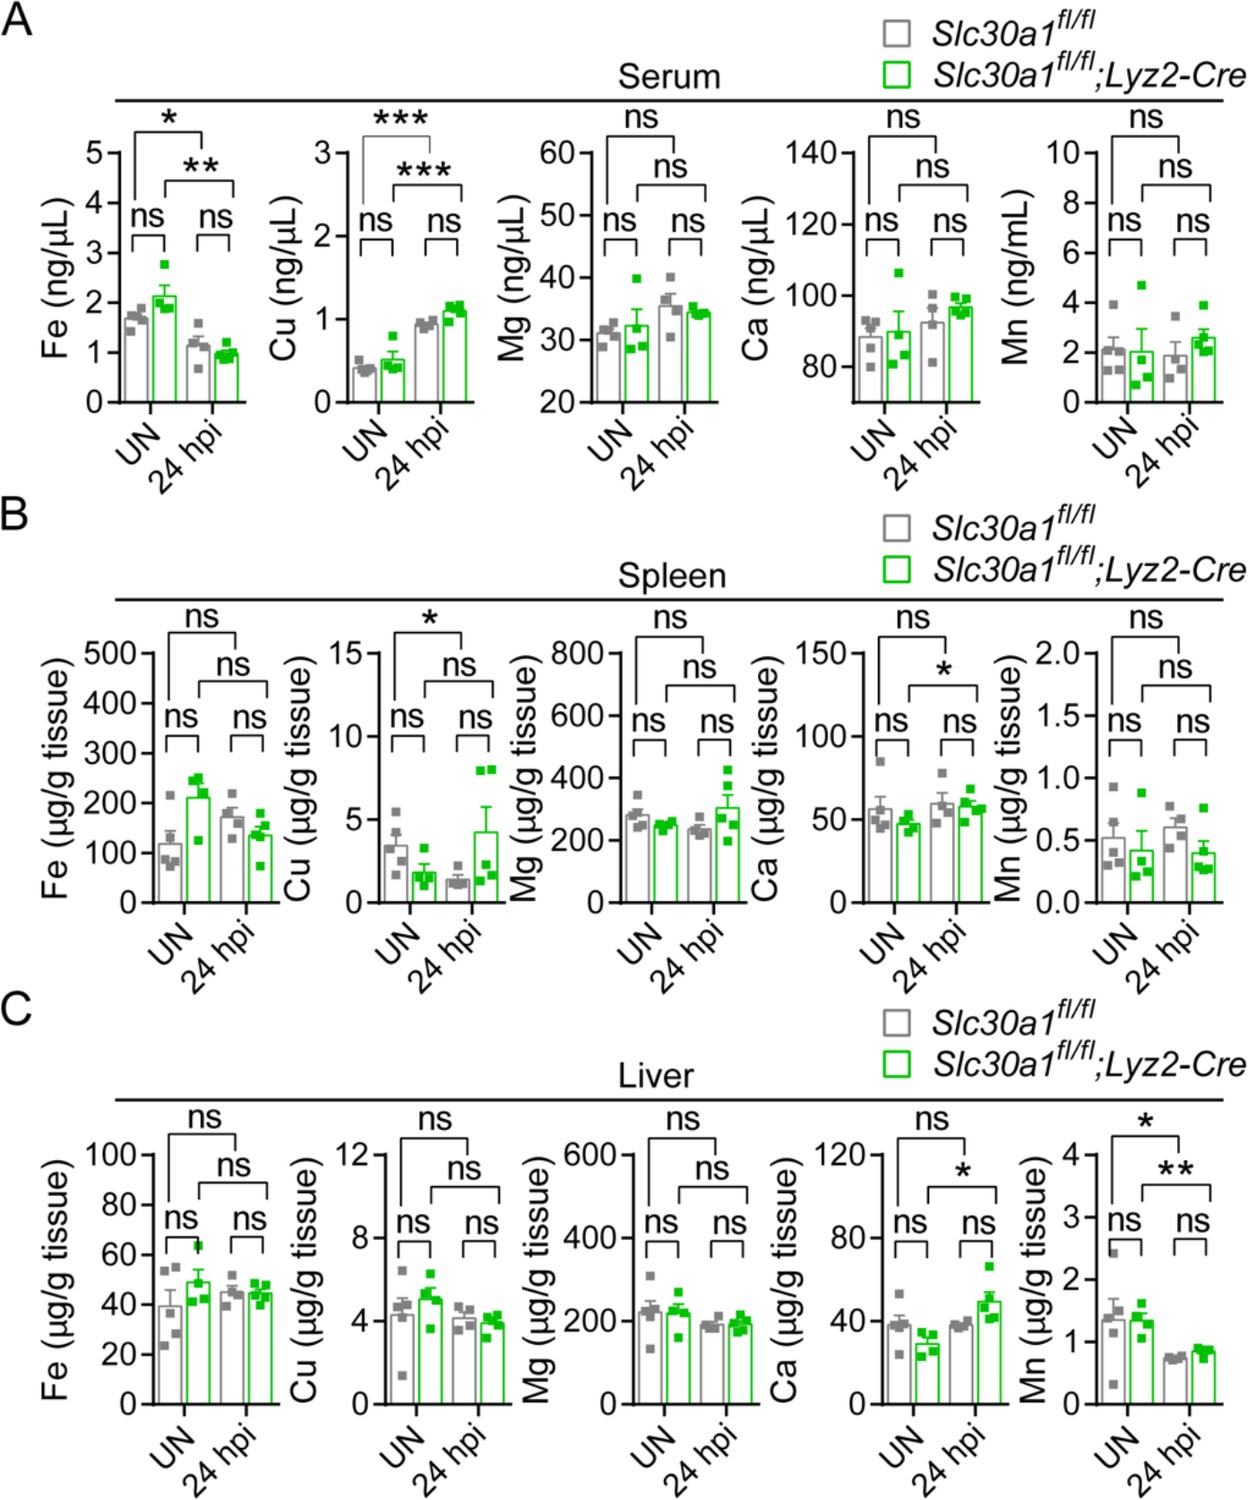
Except for Zn, Lyz2-Cre-mediated genetic deletion of Slc30a1 in mice does not affect the content of other trace minerals.
Figure 6—figure supplement 2

Slc30a1 deficiency increase sensitivity to zinc stress.
Figure 7
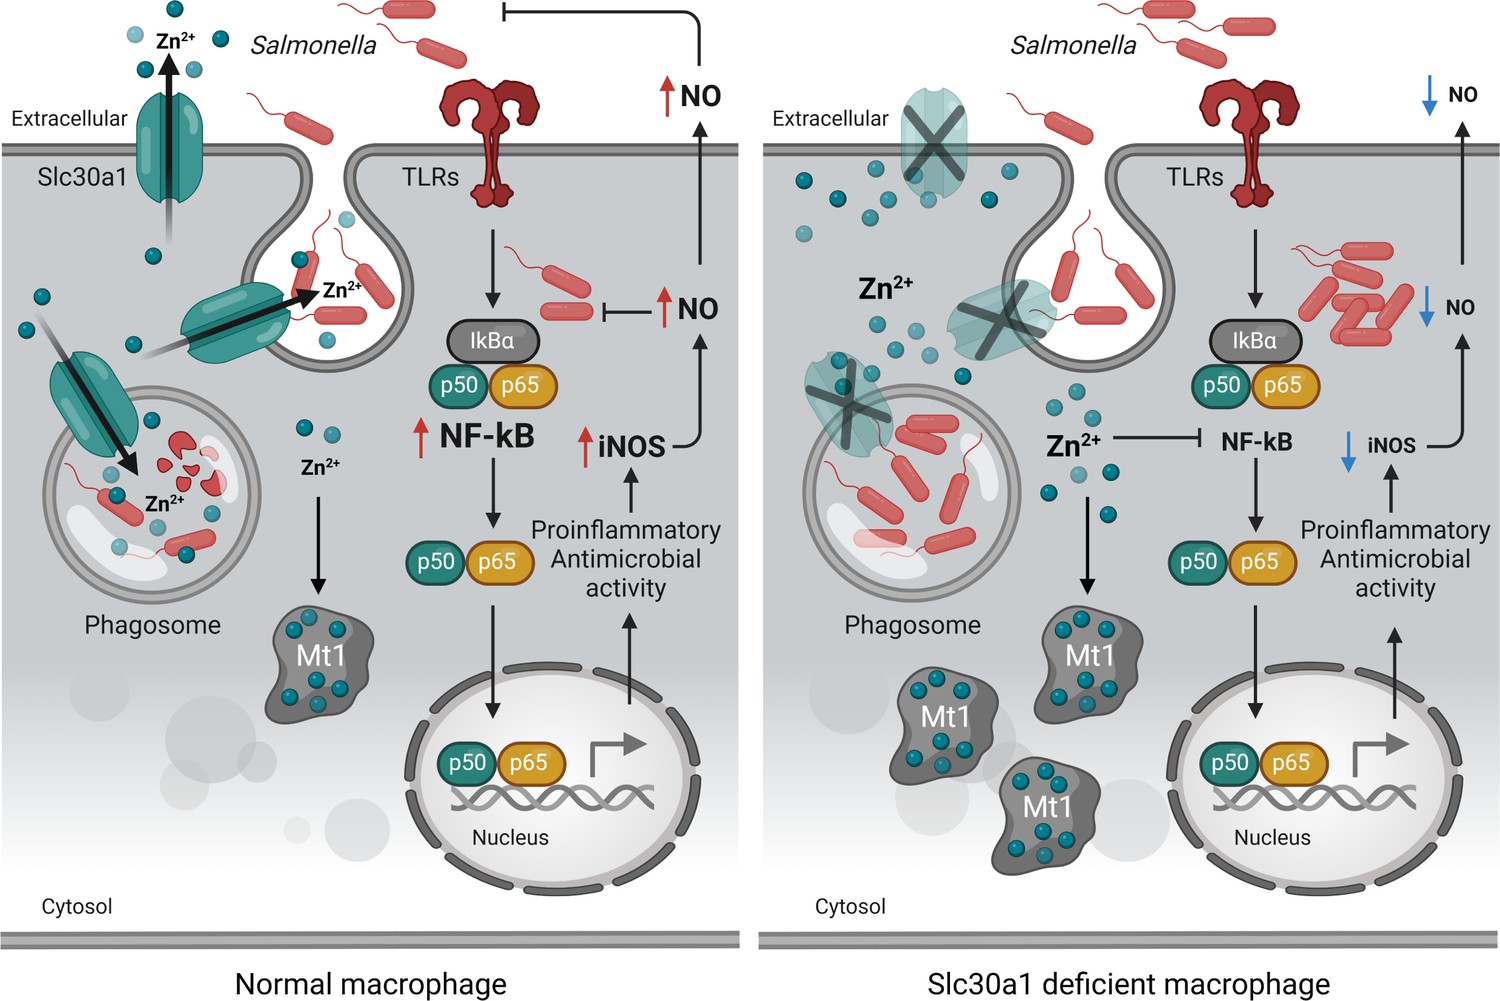
Putative protective function of Slc30a1 in macrophages during Salmonella infection.
Under normal conditions, Slc30a1 is upregulated in response to Salmonella infection, generating a short-term decrease in cytosolic zinc concentration and increasing zinc toxicity in Salmonella-containing phagosomes. Loss of Slc30a1 leads to an accumulation of intracellular zinc, thereby upregulating Mt1 overexpression and reducing iNOS and nitric oxide (NO) production via reduced nuclear factor kappa B (NF-κB) signaling, reducing the cell’s bacterial clearance capacity.
Figure 8
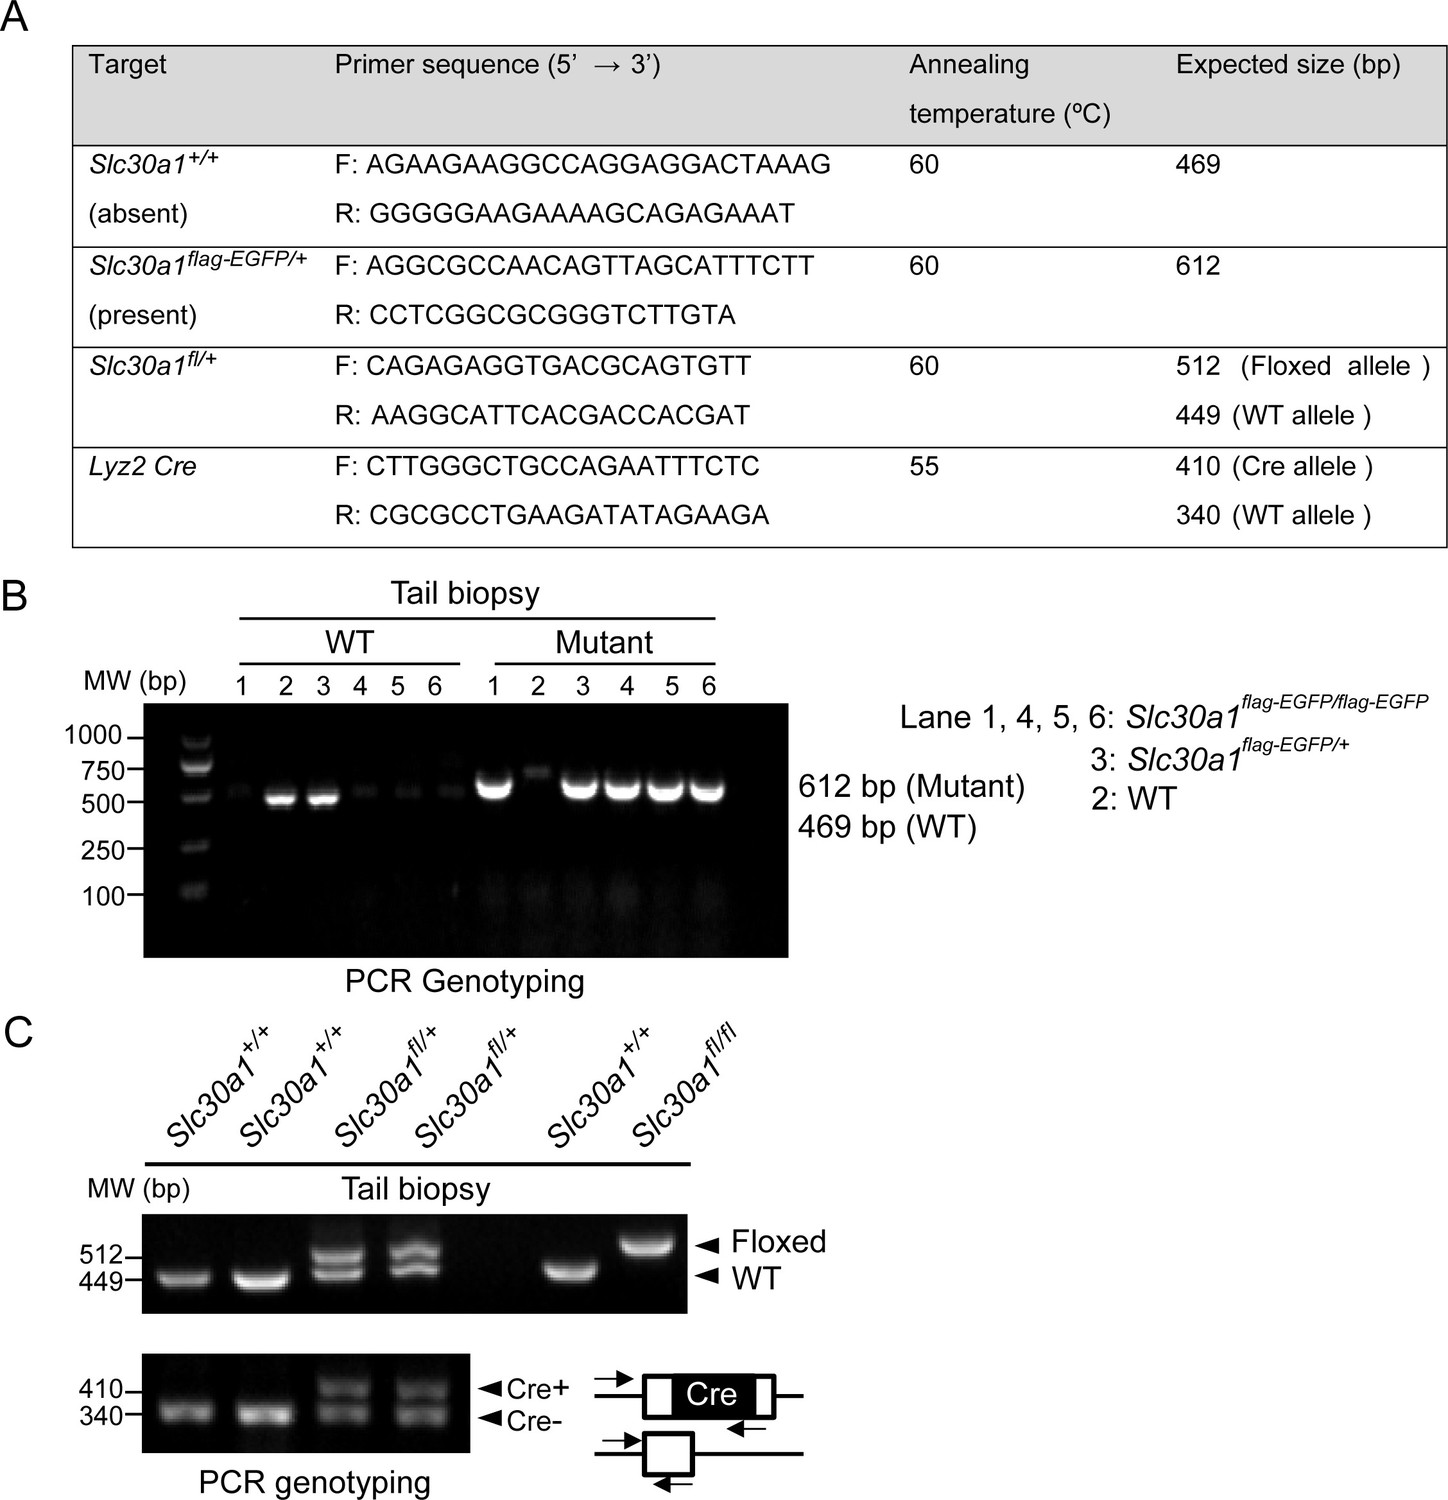
PCR-based genotyping.
(A) List of primers used for routine genotyping. PCR was performed using genomic DNA from mouse tail biopsies. (B) Genotyping of Slc30a1-3xflag-EGFP (Slc30a1flag-EGFP/+) mouse line. The PCR fragment length for the wild-type (WT) Slc30a1 allele is 612 and 469 bp for the mutant allele, respectively. (C) The conditional knockout (Slc30a1fl/fl;Lyz2-Cre) mice were recognized by genomic PCR rendering one band of flox/flox allele (512 bp) with two bands of Lyz2-Cre heterozygous (410 and 340 bp). Each lane represents one individual mice.
-
Figure 8—source data 1
Raw images of PCR genotype analysis.
- https://cdn.elifesciences.org/articles/89509/elife-89509-fig8-data1-v1.zip
Figure 9
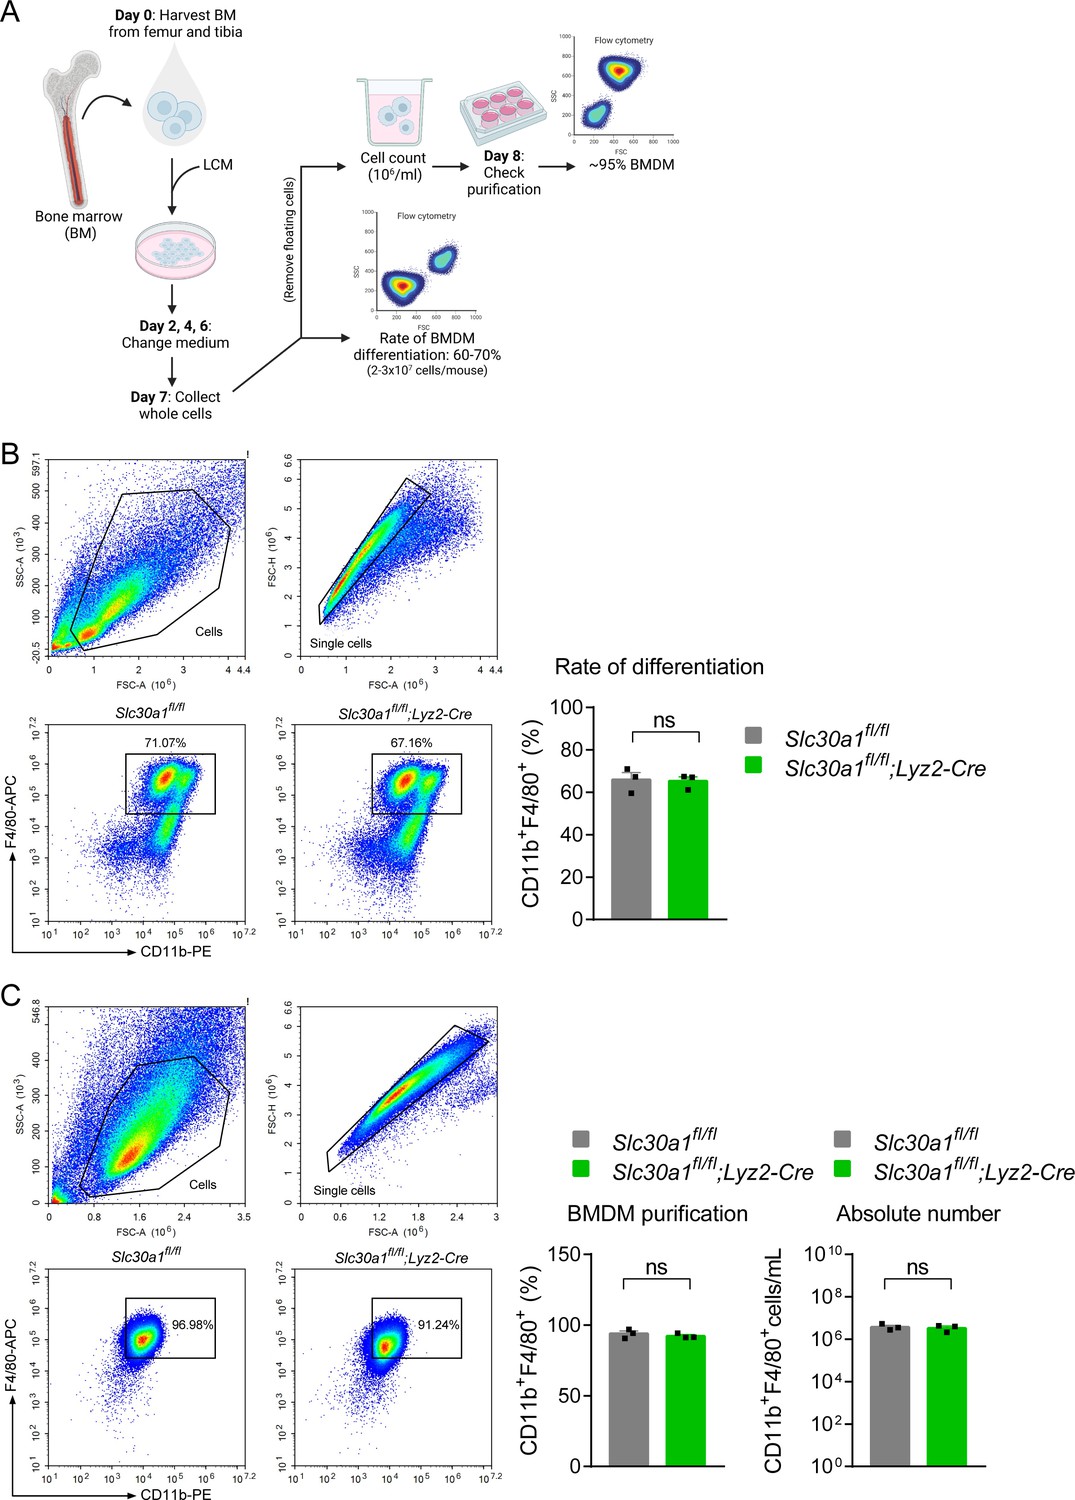
Lyz2-Cre-mediated genetic deletion of Slc30a1 in mice does not affect the differentiation of bone marrow-derived macrophages (BMDMs).
(A) Schematic illustration depicting the strategy used to measure the BMDM differentiation procedure. Bone marrow (BM) cells were harvested from the femur and tibia and cultured in L929 cell-conditioned medium (LCM) for 7 days. (B) Flow cytometry analysis and summary of the percent BMDM differentiation (CD11b+F4/80+) from BM samples obtained from the indicated mice measured at day 7 (n = 3). (C) Percent BMDM purification and absolute number of BMDMs measured after removing floating cells and measuring cell concentration. Data in this figure are represented as mean ± SEM. p values were determined using two-tailed unpaired Student’s t-test. ns, not significant.
Author response image 1

(A) Time course of the intracellular pathogen-killing capacity of Salmonella infected Slc30a1fl/flLysMCre and Slc30a1fl/fl BMDMs measured in colony-forming units per ml (n = 5). (B) Fold change in Salmonella survival (CFU/mL) at different time points from A. (C) Representative images of Salmonella colonies on solid agar medium at 24 hours. Data are represented as mean ± SEM. P values were determined using 2-tailed unpaired Student’s t-test. *P<0.05, **P<0.01, and ns, not significant.
Author response image 2
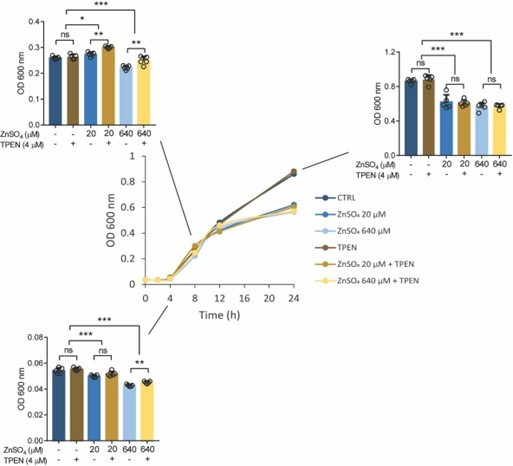
Growth curve (optical density, OD 600 nm) of Salmonella in LB medium at different concentrations of ZnSO4 and/or TPEN.
Bar graph indicating Salmonella growth at specific time points. Each value was expressed as mean of triplicates for each testing and data were determined using 2-tailed unpaired Student’s t-test. *P<0.05, **P<0.01, ***P<0.001 and ns, not significant.
Author response image 3
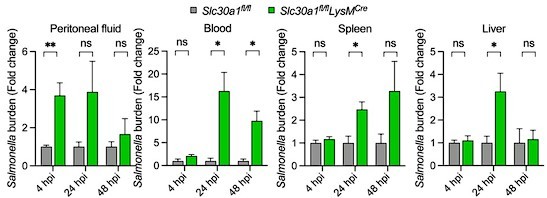
Bar graph indicates fold change in Salmonella burden of Slc30a1fl/flLysMCre normalized to Slc30a1fl/fl.
Data are represented as mean ± SEM. P values were determined using 2-tailed unpaired Student’s t-test. *P<0.05, ***P<0.001, and ns, not significant.
Author response image 4

RT-qPCR analysis of mRNA encoding Nos2 in the spleen, liver, and peritoneal macrophages of uninfected and Salmonella infected mice for 24 h.
Data are represented as mean ± SEM. P values were determined using 2-tailed unpaired Student’s t-test, *P<0.05, **P<0.01 and ns, not significant.
Author response image 5

Bar graph indicates fold change in Salmonella survival (CFU/mL) (Right).
P values were determined using 2-tailed unpaired Student’s t-test. *P<0.05, **P<0.01, ***P<0.001, and ns, not significant.
Tables
Author response table 1
The tissue sections of spleen were scored as follows.
| Lesion | Score | Description |
|---|---|---|
| Histiocytic inflammation | 0 | None |
| 1 | Minimal- filling <25% of marginal zone | |
| 2 | Mild- filling 25-50% of marginal zone | |
| 3 | Moderate- filling 51-75% of marginal zone | |
| 4 | Marked- filling >75% of marginal zone |
Author response table 2
The tissue sections of liver were scored as follows.
| Severity | Proportion of liver affected | Score | Quantifiable finding |
|---|---|---|---|
| None | None | 0 | None |
| Marginal or minimal | Very small amount | 1 | 1-2 foci |
| Slight or few | Small amount | 2 | 3-6 foci |
| Moderate or several | Medium amount | 3 | 7–12 foci |
| Marked or many | Large amount | 4 | >12 foci, coalescing |
Additional files
-
MDAR checklist
- https://cdn.elifesciences.org/articles/89509/elife-89509-mdarchecklist1-v1.pdf
-
Supplementary file 1
Top 50 enriched GO terms for the DEGs in C57BL/6 BMDMs infected with Salmonella versus uninfected cells.
- https://cdn.elifesciences.org/articles/89509/elife-89509-supp1-v1.docx
-
Supplementary file 2
KEGG enrichment pathways of the DEGs in C57BL/6 BMDMs infected with Salmonella versus uninfected cells.
- https://cdn.elifesciences.org/articles/89509/elife-89509-supp2-v1.docx
-
Supplementary file 3
Summary of blood test results for uninfected and Salmonella-infected Slc30a1fl/fl and Slc30a1fl/fl;Lyz2-Cre mice.
- https://cdn.elifesciences.org/articles/89509/elife-89509-supp3-v1.docx
-
Supplementary file 4
List of primer pairs used for RT-qPCR analysis.
- https://cdn.elifesciences.org/articles/89509/elife-89509-supp4-v1.docx
Download links
A two-part list of links to download the article, or parts of the article, in various formats.
Downloads (link to download the article as PDF)
Open citations (links to open the citations from this article in various online reference manager services)
Cite this article (links to download the citations from this article in formats compatible with various reference manager tools)
The zinc transporter Slc30a1 (ZnT1) in macrophages plays a protective role against attenuated Salmonella
eLife 13:e89509.
https://doi.org/10.7554/eLife.89509


