Hybrid immunity from severe acute respiratory syndrome coronavirus 2 infection and vaccination in Canadian adults: A cohort study
- Centre for Global Health Research, Unity Health Toronto and University of Toronto, Canada
- Lunenfeld-Tanenbaum Research Institute, Sinai Health, Canada
- Unity Health Toronto, Canada
- Toronto General Hospital, University Hospital Network, Canada
- Angus Reid Institute, Canada
Figures
Figure 1
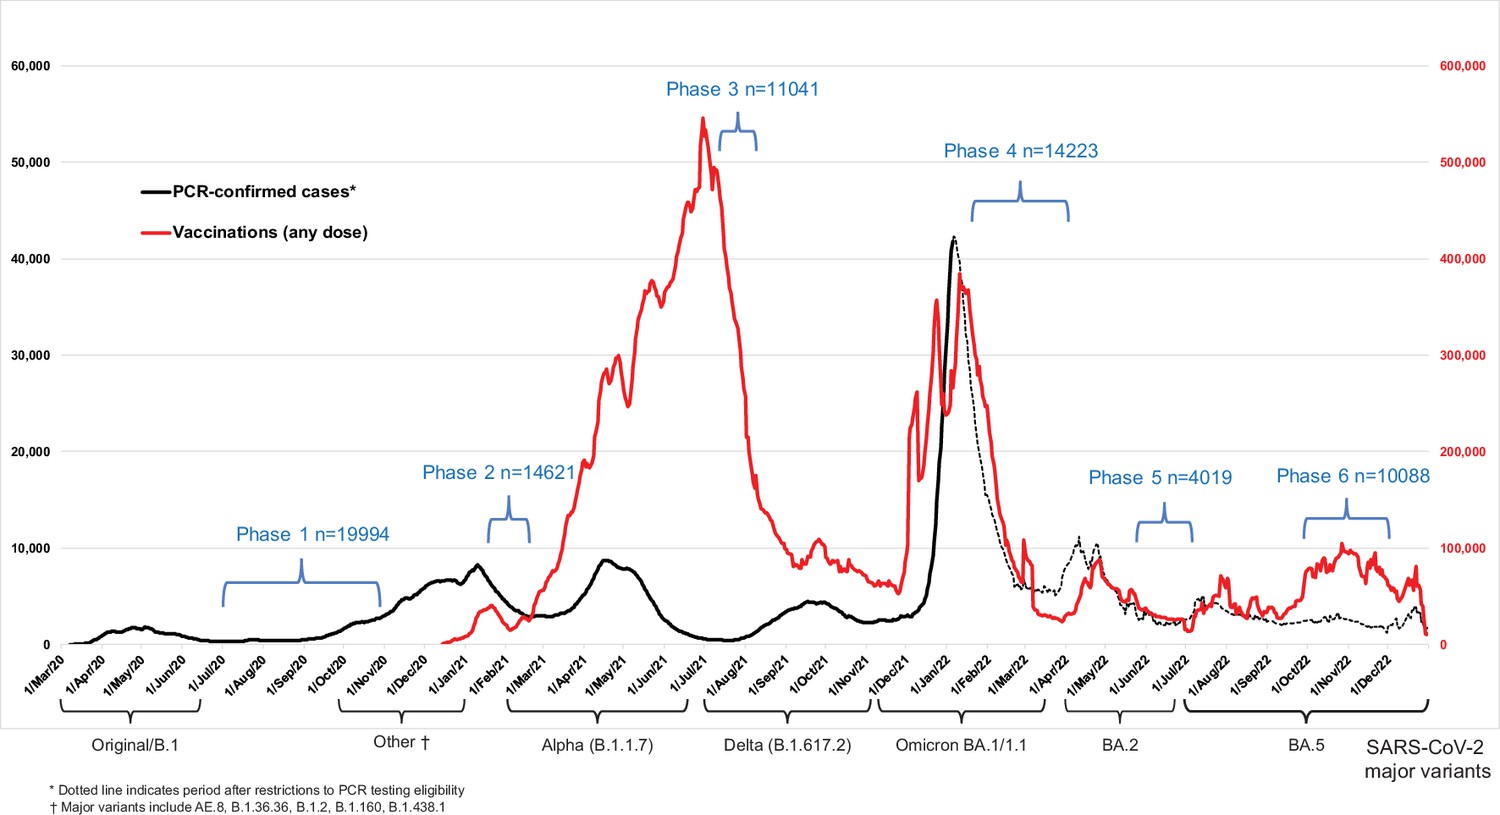
Seven-day rolling averages of PCR-confirmed COVID-19 cases in Canada (black solid and dotted line), and SARS-CoV-2 vaccinations (any dose; red line) in relation to the data collection phases of the Action to Beat Coronavirus (Ab-C) study.
Testing and vaccination data were derived from COVID-19 Tracker Canada as of 3 February 2023 (https://COVID19Tracker.ca) (Little, 2023). Data on major variants were obtained from Public Health Agency of Canada’s Health Infobase COVID-19 epidemiology update (https://health-infobase.canada.ca/covid-19/testing-variants.html) (Public Health Agency of Canada, 2023). Dotted lines for PCR-based testing after 1 January 2022 reflect the major uncertainty in PCR-based testing. Widespread PCR testing guidelines became stricter and were significantly scaled back in community settings and thus became far less reliable to monitor trends.
Figure 2
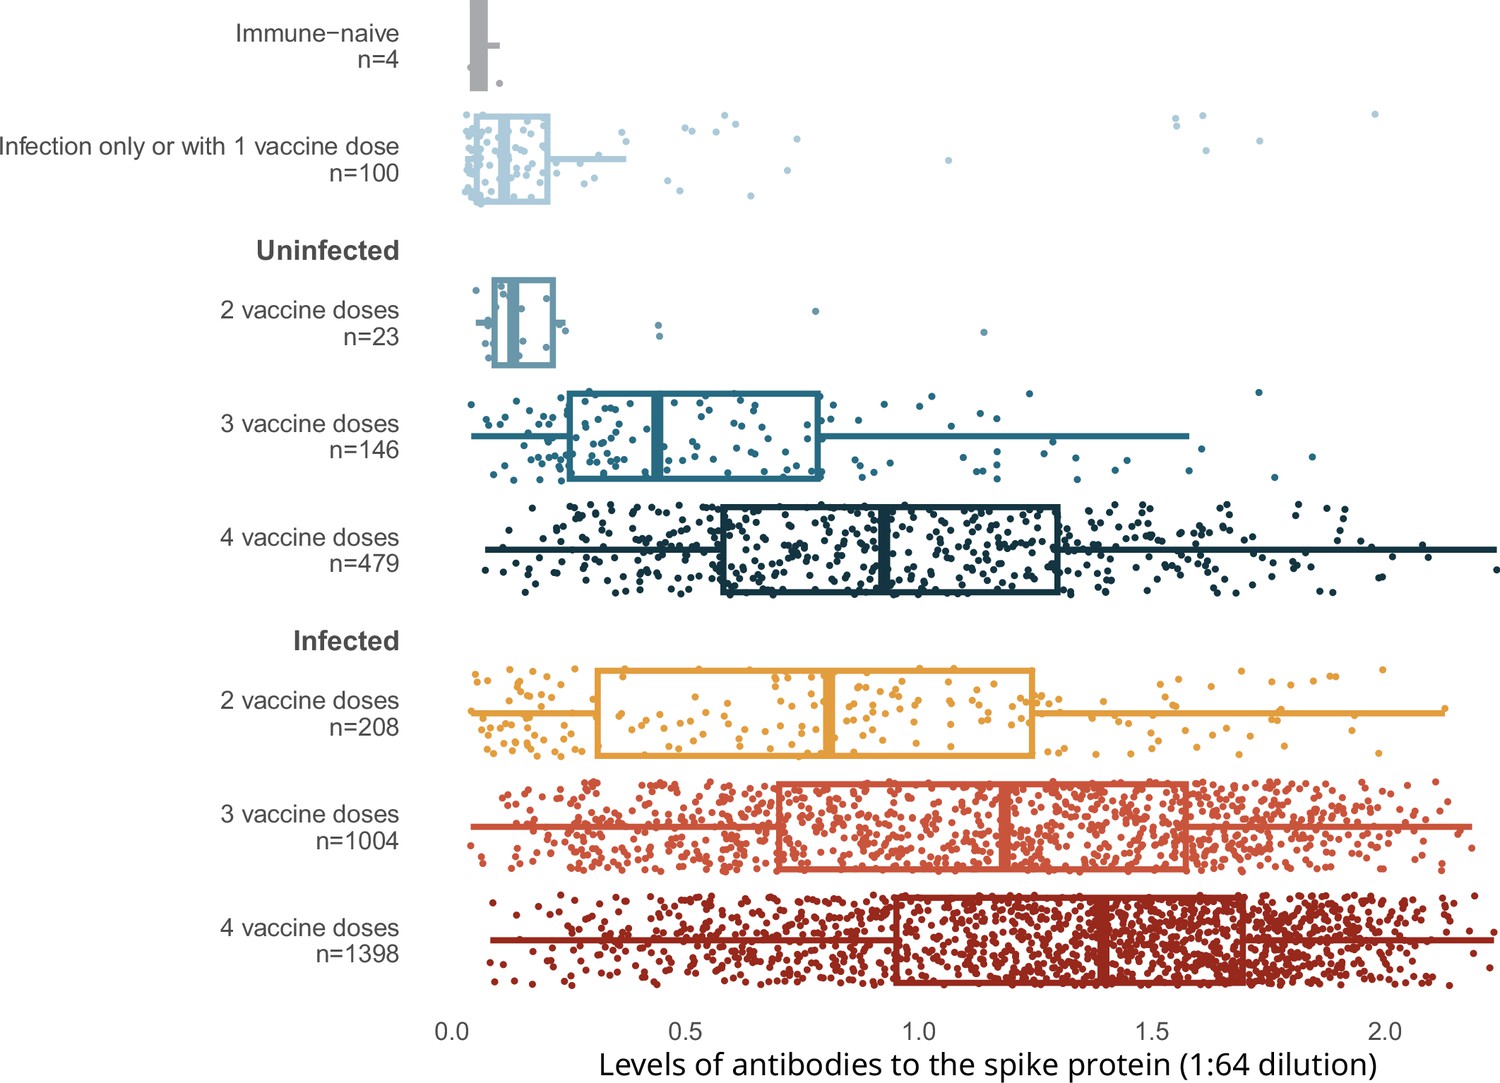
Levels of antibodies to the spike protein stratified by infection and number of vaccination doses.
Circles represent individuals with their last vaccination (or unvaccinated) >10 days prior to dried blood spot (DBS) sample collection (n = 3378 with complete information available as of the time of analyses after excluding 14 low-quality samples). We further excluded 16 participants whose samples were seronegative and viral test was positive, but who did not provide viral test dates or reported test dates less than 8 days from the receipt of DBS. The solid-coloured line represents the median and box plots show the interquartile range. The results above a relative level of 1.2 are outside the linear range of the assay. Results using the receptor-binding domain antigen were similar to the spike protein (Appendix 2—figure 3).
Figure 3
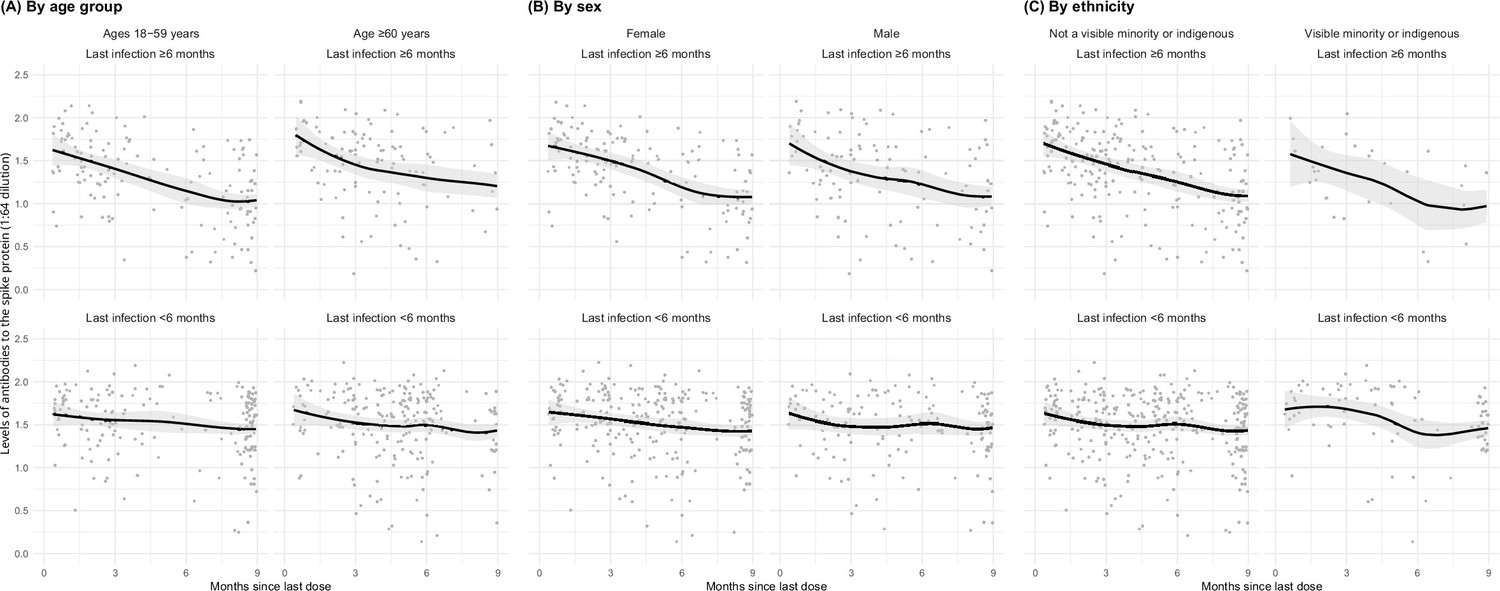
Age- (A), sex- (B), and ethnicity-specific (C) trends to 9 months in levels of antibodies to the spike protein among adults vaccinated with three to four doses, stratified by infection more than 6 months ago or less than 6 months ago.
See footnote to Figure 2 for testing details. We created smoothed curves and 95% confidence intervals using locally weighted scatterplot smoothing with span parameter of 0.8 (Fox and Weisberg, 2018).
Figure 4
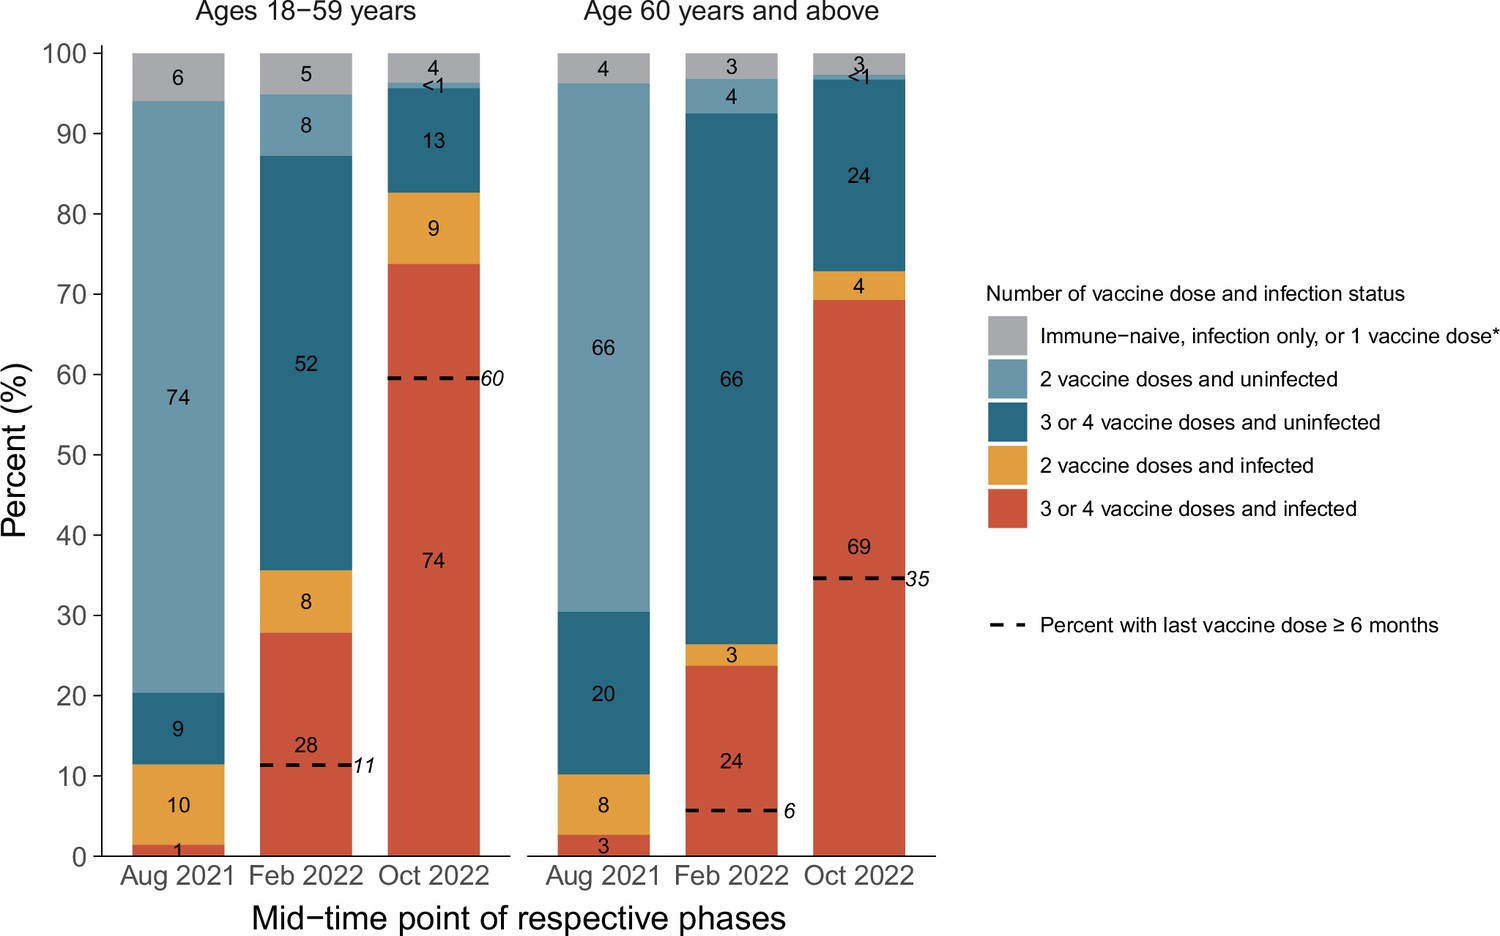
Cumulative incidence in each stratum of infection and vaccination in the pre-Omicron wave, during the Omicron BA.1/1.1 wave, and during the BA.2 and BA.5 waves by age group.
*Including uninfected and infected cases. The first column in each age group represents the antibody and viral test positivity for the entire period prior to Omicron, whereas the second column represents the values during the Omicron BA.1/1.1 wave and the third during the BA.2/5 waves. By the last time period studied, the numbers of participants aged 15–59 who were N-positive, viral test-positive, and positive to both were 675 (41%), 37 (2%), and 699 (43%). The comparable numbers for participants aged 60 or more were 763 (44%), 35 (2%), and 500 (29%).
Appendix 2—figure 1
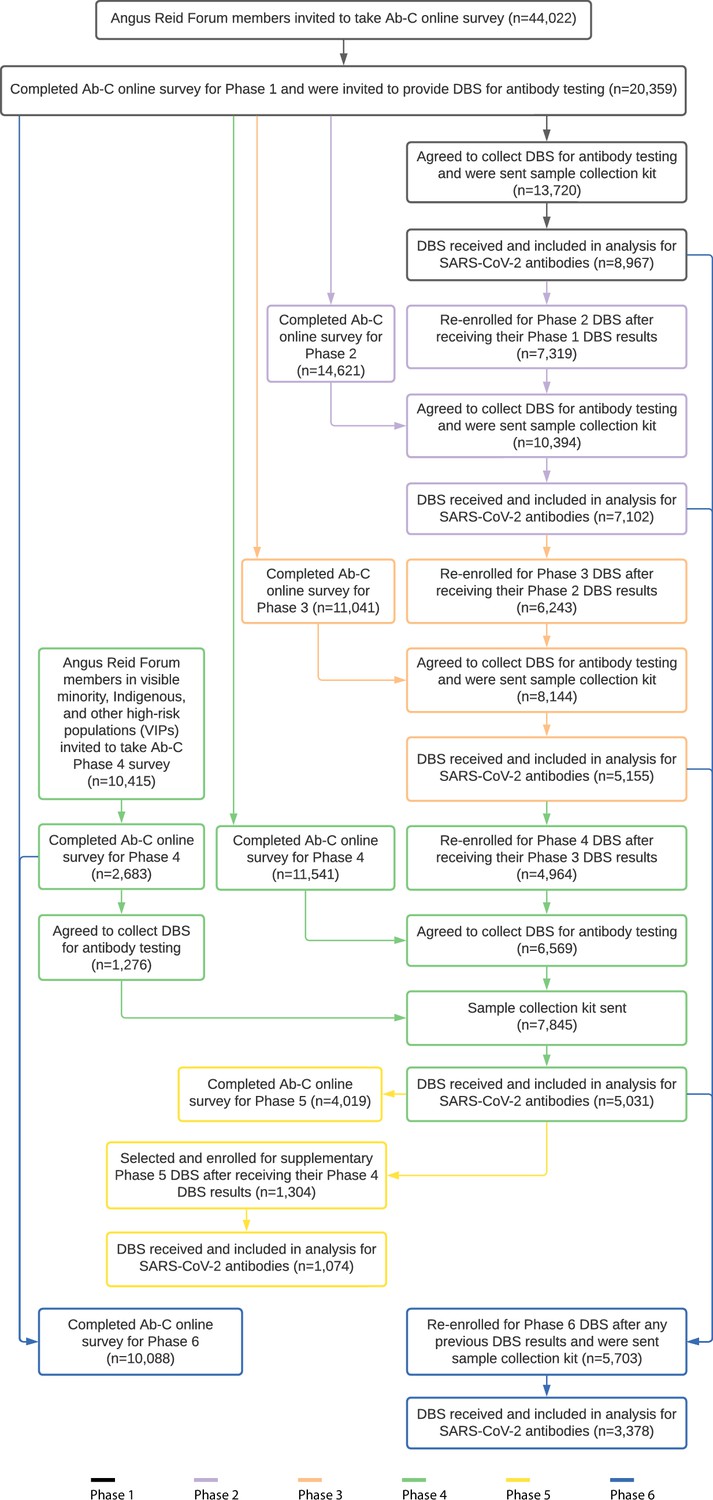
Study flow including sampling and study inclusion by phase in the Ab-C study.
Appendix 2—figure 2
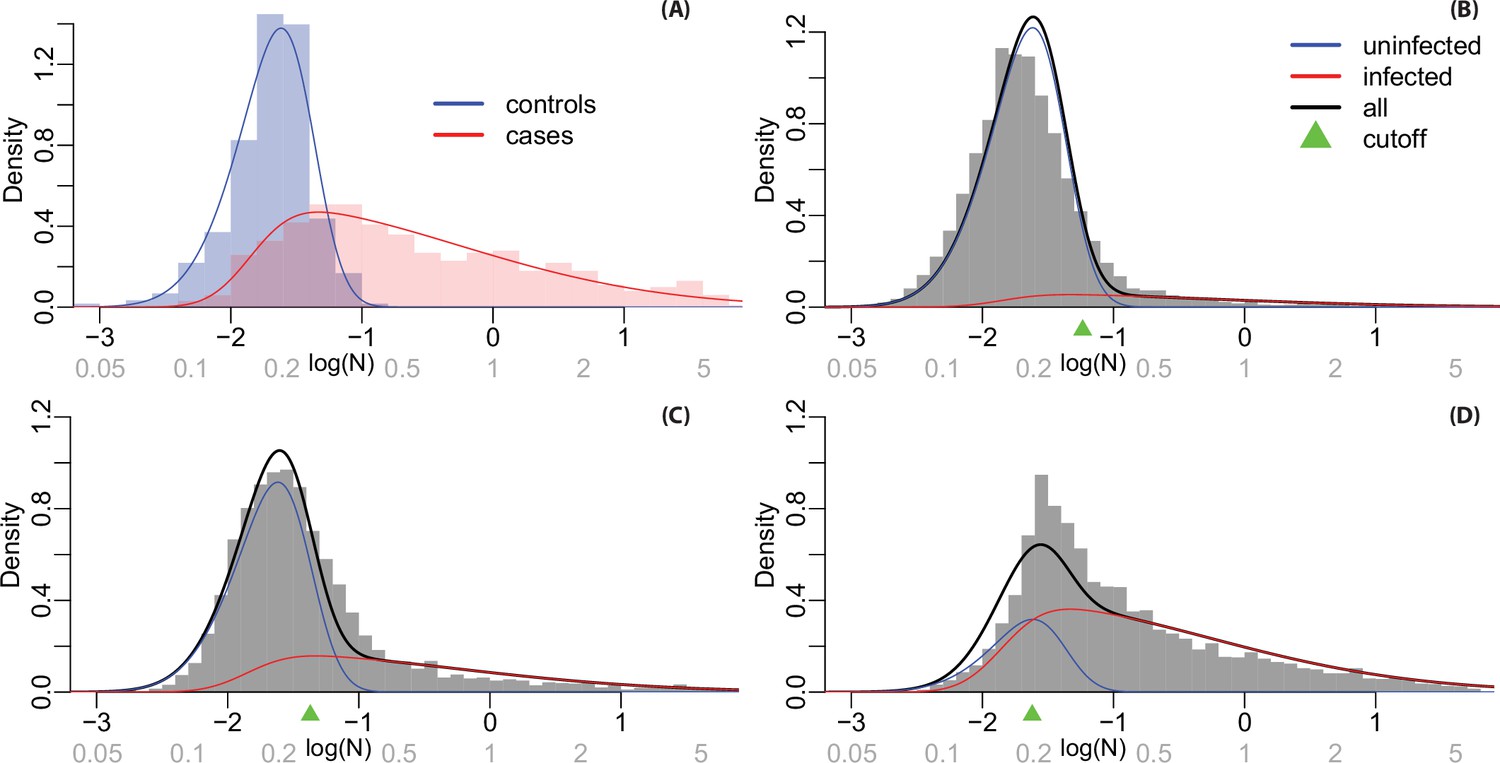
Histograms and fitted densities for N-positivity levels.
Values on the log scale are shown on the horizontal axis in black and on the natural scale (not logged) are shown in grey. Notes: (A) Fitted densities for known cases and controls in calibration samples; (B) densities estimated for infected and uninfected individuals from the mixture model in Phase 3 samples; (C) Phase 4 samples; and (D) Phase 6 samples.
Appendix 2—figure 3
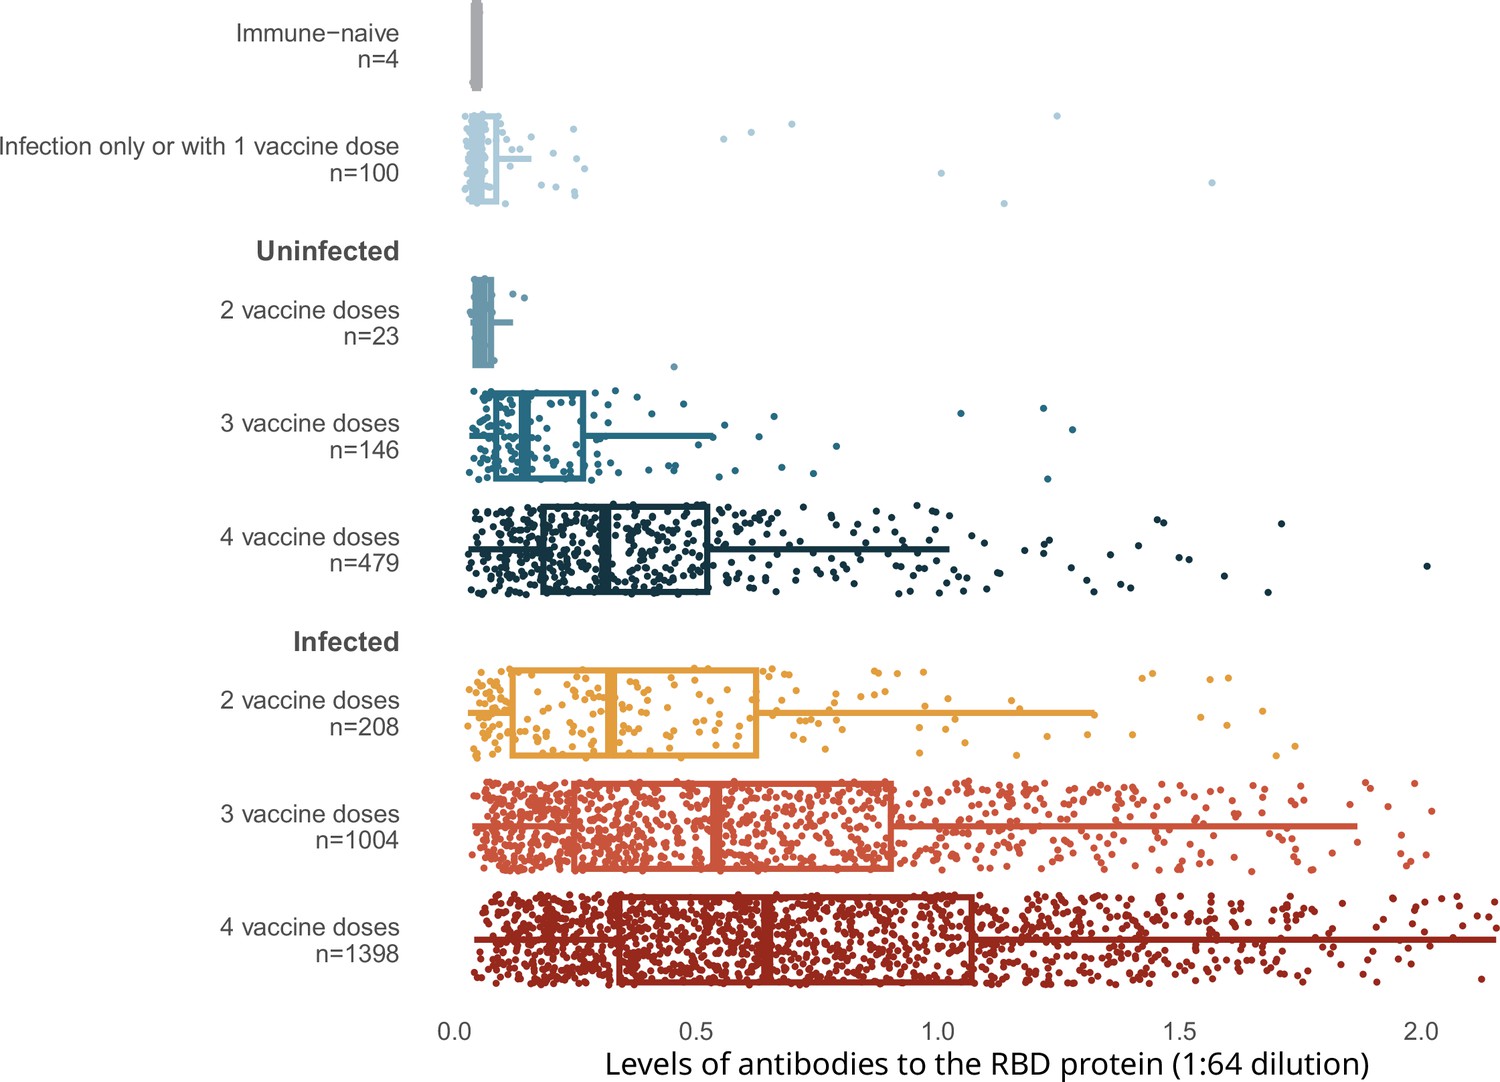
Levels of antibodies to RBD stratified by infection and number of vaccination doses.
Appendix 2—figure 4
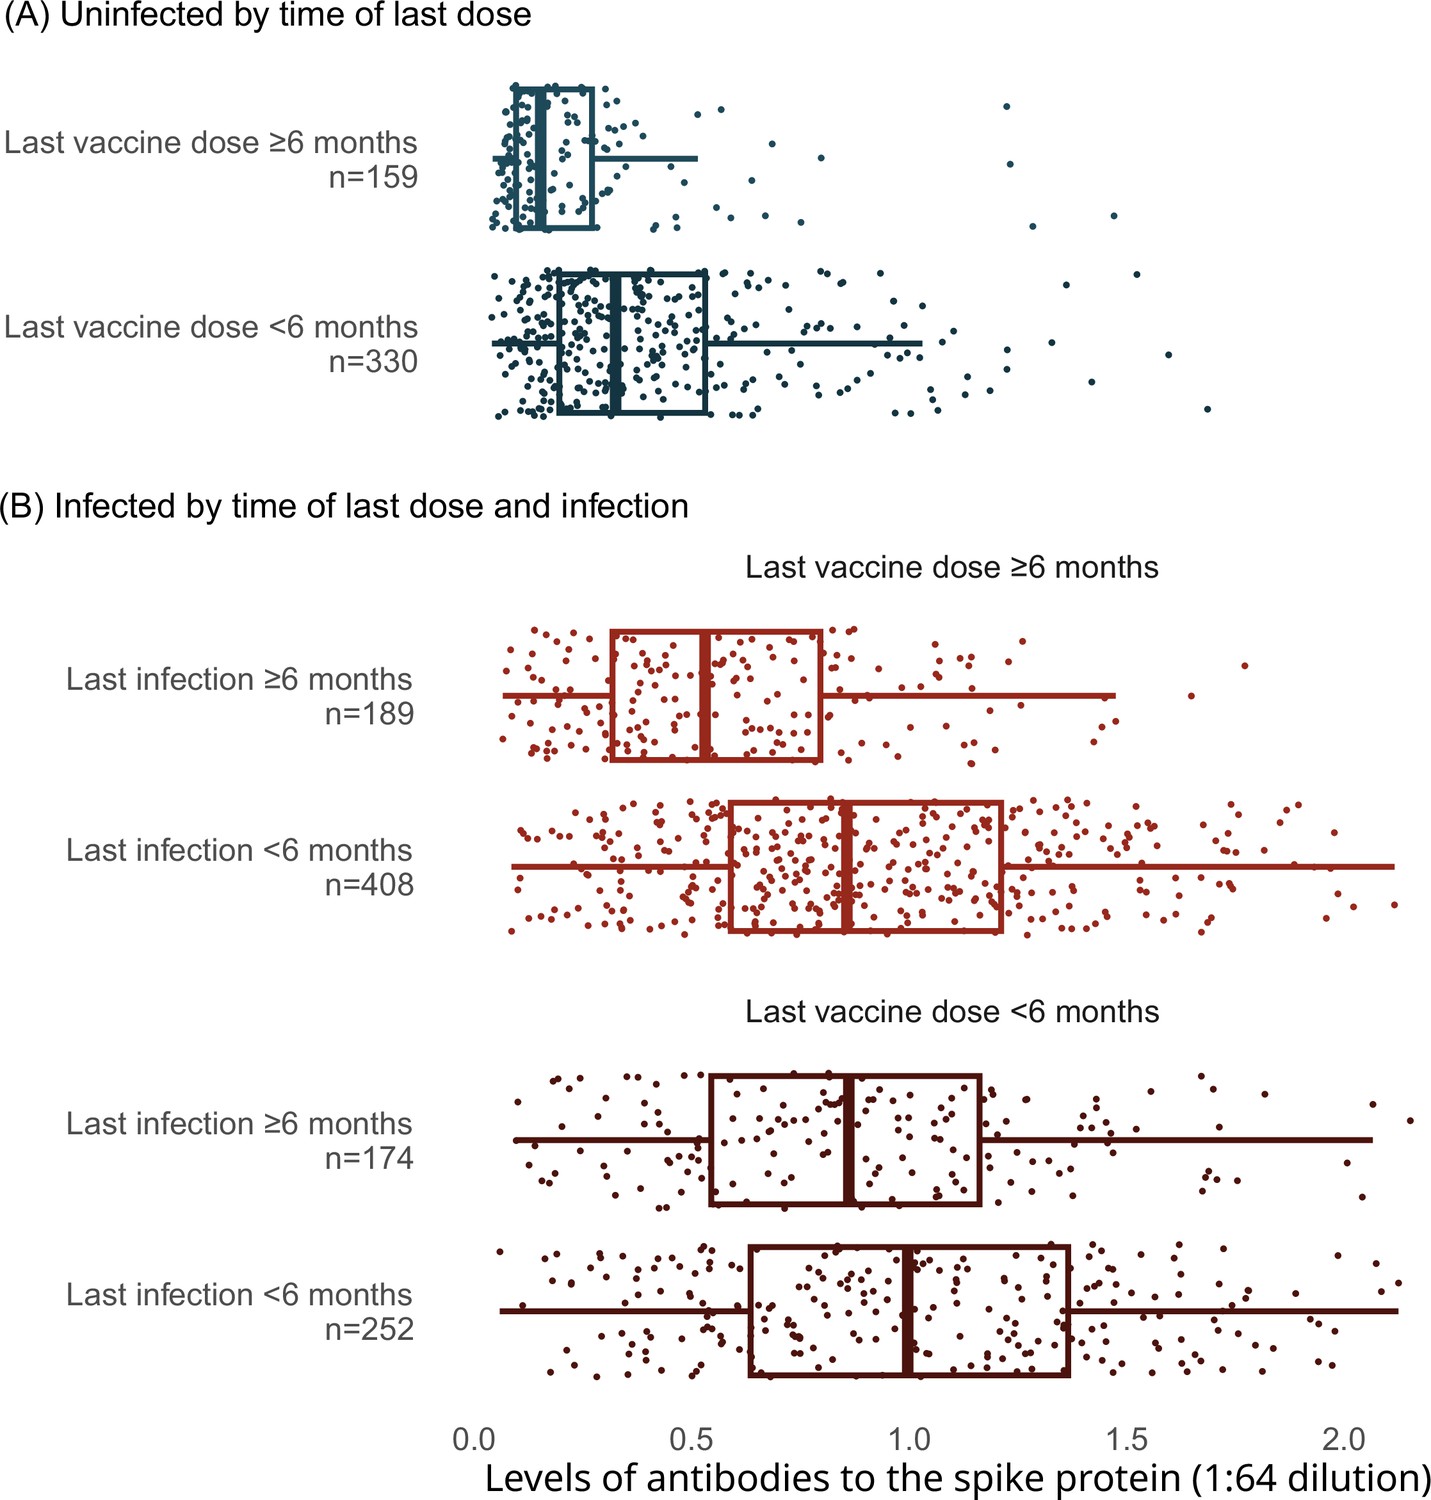
Levels of antibodies to the spike protein stratified by infection, vaccination doses, and time since last vaccination or since last infection.
Appendix 2—figure 5
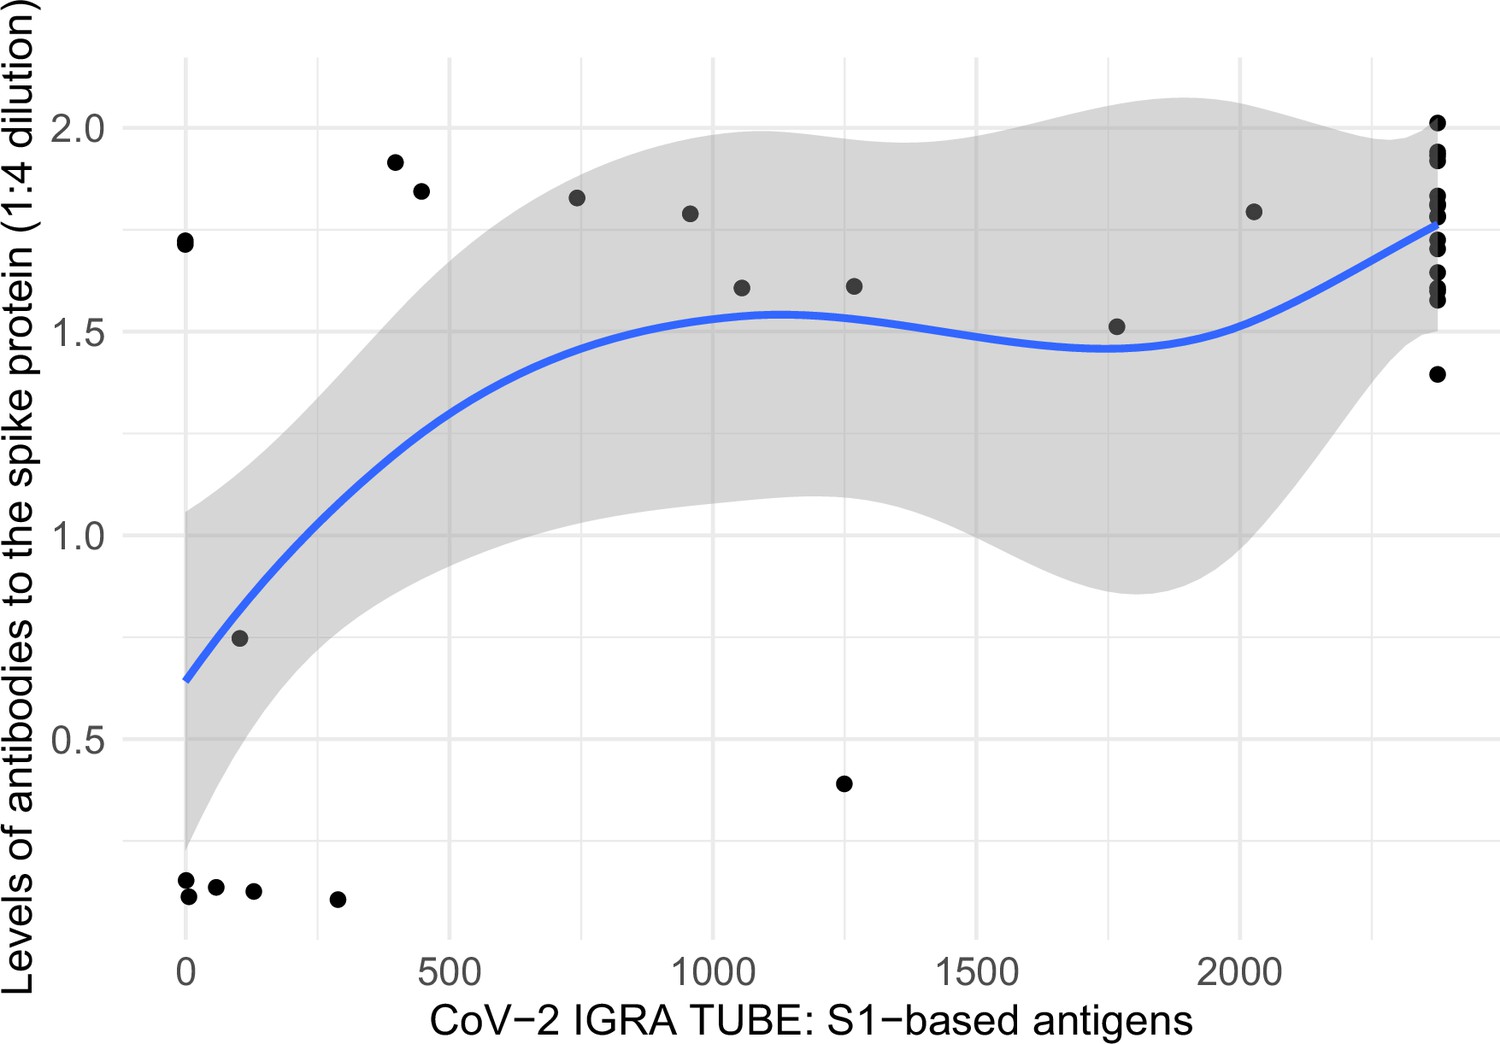
Correlation between levels of antibodies to the spike protein and T-cell spike titers.
Notes: x-axis represents interferon-gamma stimulation on blood samples using antigens based on the SARS-CoV-2 spike protein (https://www.coronavirus-diagnostics.com/documents/Indications/Infections/Coronavirus/ET_2606_D_UK_A.pdf), and y-axis represents SARS-CoV-2 spike protein antibodies in dried-blood spot samples. The two variables had a Spearman correlation of 0.508. Smoothed curves and 95% confidence intervals were obtained using locally weighted scatterplot smoothing with span parameter of 0.8 (Fox and Weisberg, 2018).
Appendix 4—figure 1
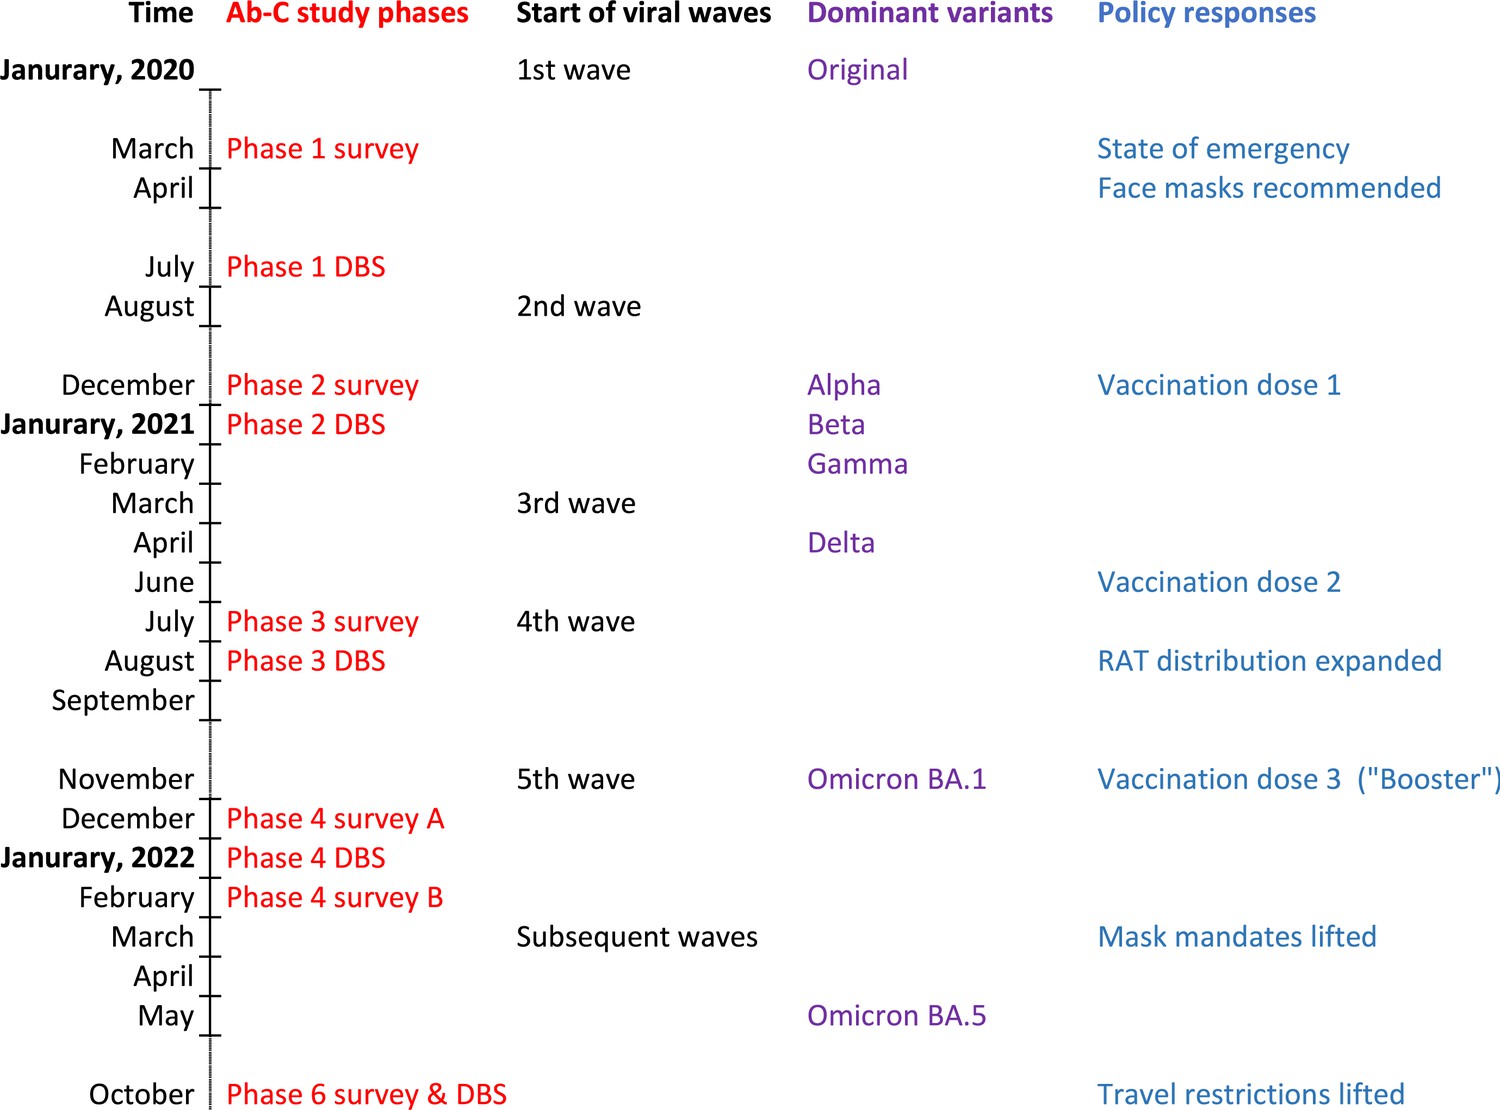
Ab-C study timeline with pandemic waves, dominant variants and policy responses in Canada.
Tables
Table 1
Cumulative incidence, numbers of infected adults, cumulative deaths, and period COVID-19 mortality rate in Canada during various SARS-CoV-2 viral waves.
| Time period | Cumulative incidence*% (95% CI) | No of adult (age 18 or older) infections in millions | Cumulative no of deaths† | COVID-19 mortality rate per million per week during the relevant period |
|---|---|---|---|---|
| Pre-Omicron 2020–2021 | 12.7 (11.2–14.1) | 3.9 (3.5–4.4) | 30,149 | 8.6 |
| Omicron BA.1/1.1 January–March 2022 | 35.7 (34.0–37.4) | 11.3 (10.7–11.8) | 37,750 | 16.6 |
| Omicron BA.2/5 April–December 2022 | 77.7 (75.7–79.6) | 24.6 (23.9–25.2) | 49,674 | 7.7 |
-
*
Post-stratified for geographic region, age, sex, and vaccination status to derive the mean estimate (supplementary methods).
-
†
We used data by end of December 2021, March 2022, and December 2022 from Public Health Agency of Canada’s COVID-19 epidemiology update (https://health-infobase.canada.ca/covid-19/) for total number of deaths (Public Health Agency of Canada, 2023). Applying the proportion of long-term care deaths from Long-term Care COVID-19 Tracker (https://ltc-covid19-tracker.ca) to the last period, 19,789 of total cumulative deaths occurred in long-term care. Of all long-term care deaths, about 80% occurred during the pre-Omicron period, mostly during the first viral wave of March–June 2020 (Figure 1). Over 90% of all COVID deaths occurred at ages 60 or older.
Appendix 3—table 1
Sample characteristics and representativeness of Phases 4 and 6 for online surveys and DBS samples.
| 2016 Canadian Census or national surveys (%) | Phase 4 survey | Phase 4 DBS sample | Phase 6 survey | Phase 6DBS sample | |||||
|---|---|---|---|---|---|---|---|---|---|
| n | % | n | % | n | % | n | % | ||
| Total (N) | 14,224 | 5031 | 10,088 | 3378 | |||||
| High risk regions* | 4824 | 33.6 | 1732 | 34.0 | 3530 | 34.6 | 1164 | 33.5 | |
| Province | |||||||||
| Ontario | 38 | 5707 | 40.0 | 2103 | 41.5 | 3957 | 39.3 | 1417 | 41.6 |
| British Columbia & Yukon | 14 | 2862 | 20.1 | 1035 | 20.9 | 2120 | 21.1 | 732 | 22.4 |
| Quebec | 23 | 1764 | 12.5 | 617 | 12.2 | 1223 | 12.0 | 364 | 10.5 |
| Prairie provinces & NWT | 19 | 2992 | 21.1 | 979 | 19.6 | 2155 | 21.5 | 653 | 19.4 |
| Atlantic provinces | 7 | 899 | 6.2 | 297 | 5.9 | 633 | 6.2 | 212 | 6.2 |
| Sex | |||||||||
| Male | 49 | 6453 | 45.9 | 1997 | 40.1 | 4492 | 45.0 | 1271 | 37.8 |
| Female | 51 | 7628 | 53.1 | 3003 | 59.3 | 5515 | 54.2 | 2089 | 61.7 |
| Prefer to self-describe | 143 | 1.0 | 31 | 0.6 | 81 | 0.8 | 18 | 0.6 | |
| Age group (years) | |||||||||
| 18–39 | 49 | 3632 | 23.9 | 1060 | 19.5 | 2084 | 19.1 | 512 | 13.8 |
| 40–59 | 28 | 5195 | 36.1 | 1752 | 34.4 | 3699 | 35.9 | 1134 | 32.7 |
| 60–69 | 12 | 3303 | 24.5 | 1355 | 28.3 | 2484 | 26.1 | 994 | 30.7 |
| 70+ | 11 | 2094 | 15.5 | 864 | 17.9 | 1821 | 18.9 | 738 | 22.8 |
| Education | |||||||||
| Some college or less | 45 | 3372 | 34.0 | 1050 | 30.6 | 2395 | 34.3 | 702 | 30.7 |
| College graduate | 32 | 4680 | 31.6 | 1621 | 31.5 | 3333 | 32.1 | 1102 | 32.3 |
| University graduate | 23 | 6172 | 34.4 | 2360 | 37.9 | 4360 | 33.6 | 1574 | 37.0 |
| Visible minority | 22 | 3438 | 23.5 | 820 | 15.8 | 2482 | 24.2 | 525 | 15.3 |
| Indigenous | 5 | 1504 | 11.0 | 495 | 10.2 | 803 | 8.6 | 234 | 7.3 |
| Household size | |||||||||
| Live alone | 28 | 2614 | 18.7 | 990 | 19.7 | 2070 | 20.8 | 730 | 21.5 |
| Two people | 34 | 6144 | 44.0 | 2328 | 47.0 | 4475 | 45.2 | 1635 | 49.4 |
| Three people | 15 | 2338 | 16.2 | 747 | 14.8 | 1558 | 15.2 | 477 | 14.0 |
| Four people or more | 22 | 3128 | 21.2 | 966 | 18.5 | 1985 | 18.8 | 536 | 15.2 |
| Ever smoking | 54 | 6652 | 49.8 | 2331 | 49.1 | 4781 | 50.6 | 1599 | 50.4 |
| Obesity (≥30 kg/m2) | 27 | 3750 | 27.4 | 1368 | 28.1 | 2675 | 27.7 | 908 | 27.8 |
| Diabetic history | 9 | 1418 | 10.6 | 518 | 11.0 | 1037 | 10.9 | 359 | 11.4 |
| Hypertension history | 23 | 3826 | 28.4 | 1452 | 30.4 | 2850 | 29.7 | 1006 | 31.3 |
| Vaccination† | |||||||||
| Unvaccinated | 10 | 1275 | 9.7 | 209 | 4.5 | 739 | 7.9 | 95 | 3.1 |
| Vaccinated | 90 | 12,949 | 90.3 | 4819 | 95.5 | 9349 | 92.1 | 3283 | 96.9 |
| One dose | 1 | 136 | 1.1 | 23 | 0.5 | 76 | 0.8 | 10 | 0.3 |
| Two doses | 29 | 3807 | 29.9 | 876 | 18.5 | 1246 | 13.0 | 233 | 7.2 |
| Three doses | 32 | 9006 | 69.0 | 3920 | 81.0 | 3801 | 37.2 | 1158 | 34.0 |
| Four or more doses | 28 | 4226 | 41.1 | 1882 | 55.5 | ||||
-
*
17 high-burden regions identified from a regression analysis of SARS-CoV-2 case counts.
-
†
As of 1 January 2023.
Additional files
Download links
A two-part list of links to download the article, or parts of the article, in various formats.
Downloads (link to download the article as PDF)
Open citations (links to open the citations from this article in various online reference manager services)
Cite this article (links to download the citations from this article in formats compatible with various reference manager tools)
Hybrid immunity from severe acute respiratory syndrome coronavirus 2 infection and vaccination in Canadian adults: A cohort study
eLife 13:e89961.
https://doi.org/10.7554/eLife.89961


