Temporal transcriptomic dynamics in developing macaque neocortex
- Institute of Medical Biology Chinese Academy of Medical Sciences, Chinese Academy of Medical Science and Peking Union Medical College, China
- Department of Molecular Biology and Biochemistry, Institute of Basic Medical Sciences, Medical Primate Research Center, Neuroscience Center, Chinese Academy of Medical Sciences, School of Basic Medicine Peking Union Medical College, China
- Agricultural Bioinformatics Key Laboratory of Hubei Province, Hubei Engineering Technology Research Center of Agricultural Big Data, College of Informatics, Huazhong Agricultural University, China
- State Key Laboratory of Common Mechanism Research for Major Diseases, Chinese Academy of Medical Sciences, Peking Union Medical College, China
- Chinese Institute for Brain Research, China
- State Key Laboratory of Respiratory Health and Multimorbidity, Chinese Academy of Medical Sciences, Peking Union Medical College, China
- Institute of Laboratory Animal Science, Chinese Academy of Medical Sciences & Peking Union Medical College, China
Figures
Figure 1 with 2 supplements
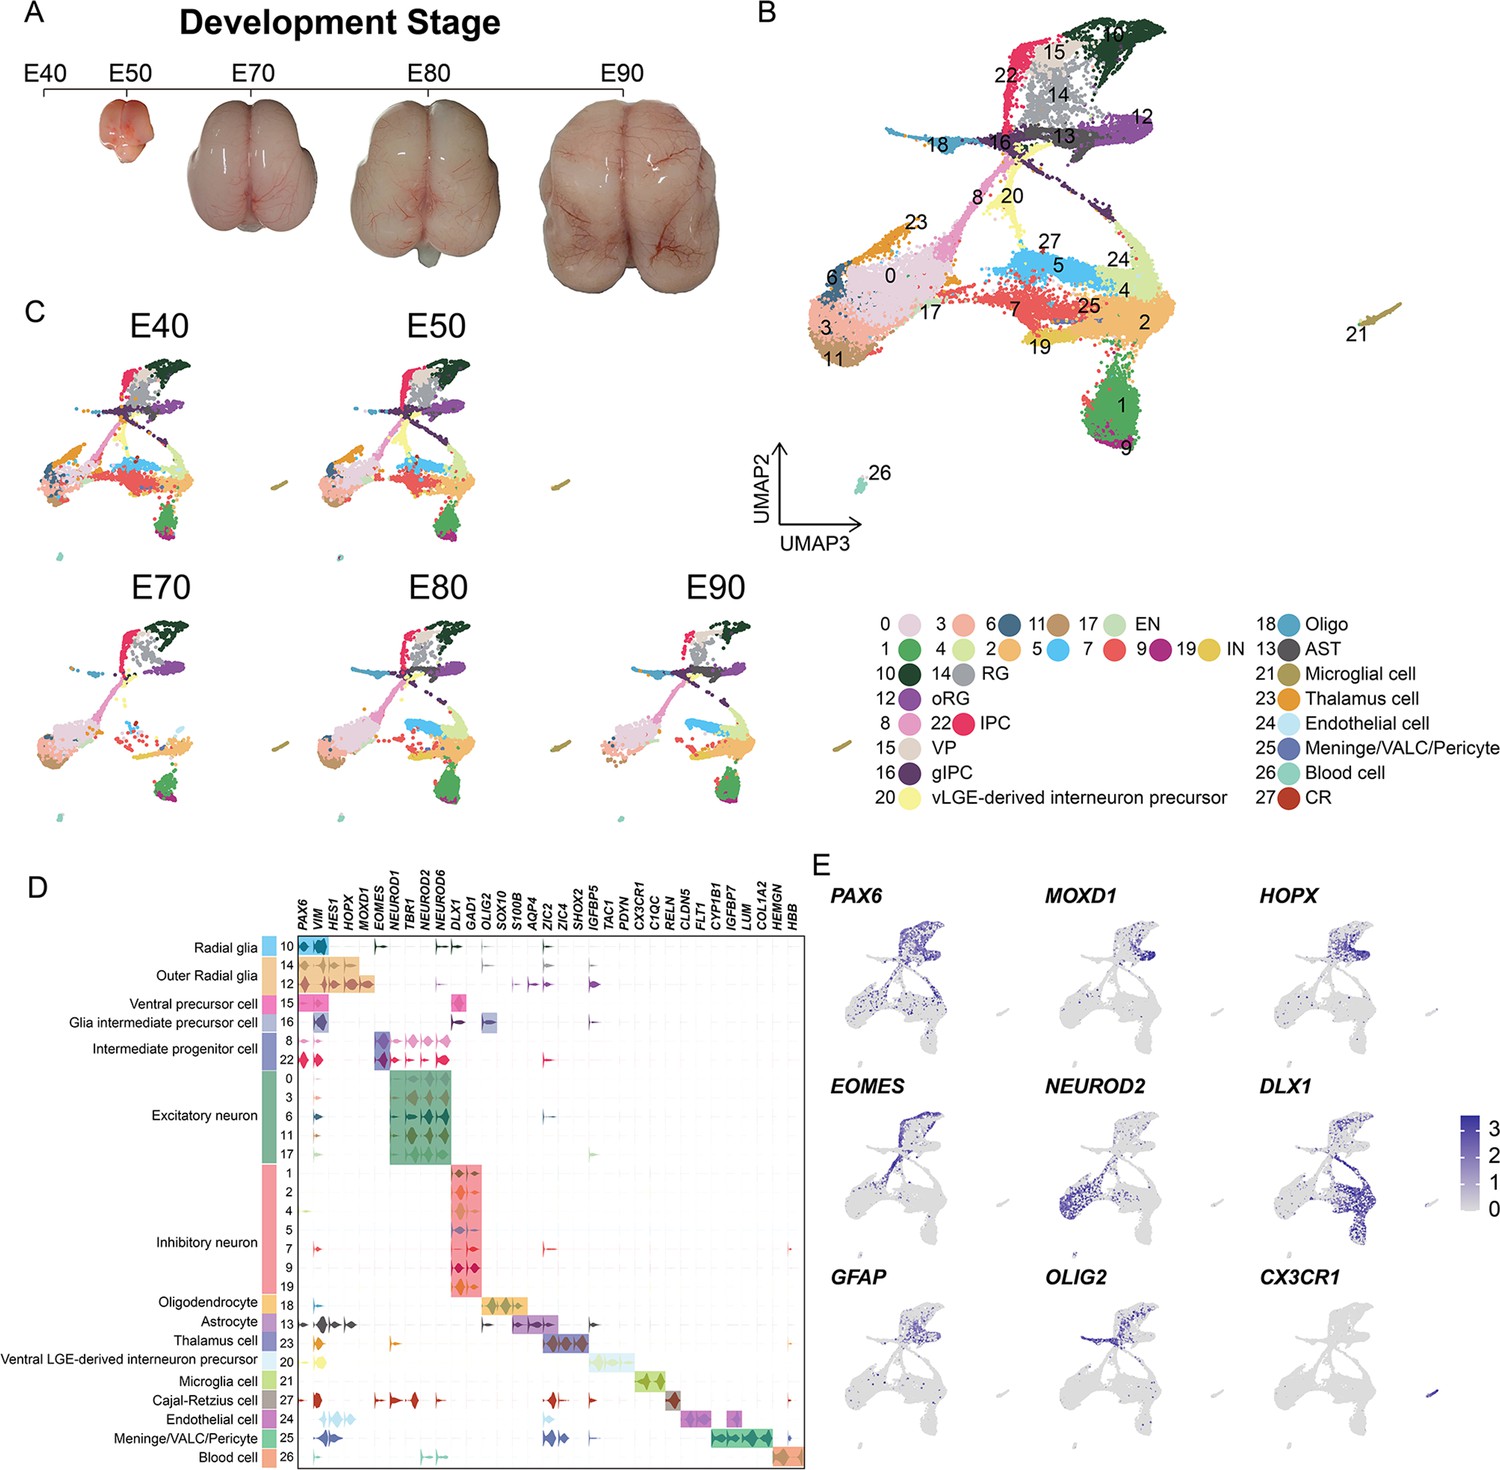
Cell types in macaque prenatal and fetal brain development.
(A) Schematic diagram of sample collecting and data analysis. We collected the parietal lobe from the embryos across developmental stages from E40 to E90. (B and C) The transcriptome data of single cells were collected and used to do clustering using Seurat. Visualization of major types of cells using uniform manifold approximation and projection (UMAP). Dots, individual cells; color, clusters. (D) Violin plot of molecular markers for annotating cell types. (E) The expressions of the classic marker genes for each cell type were plotted for UMAP visualization. Light gray, no expression; dark blue, relative expression.
Figure 1—figure supplement 1
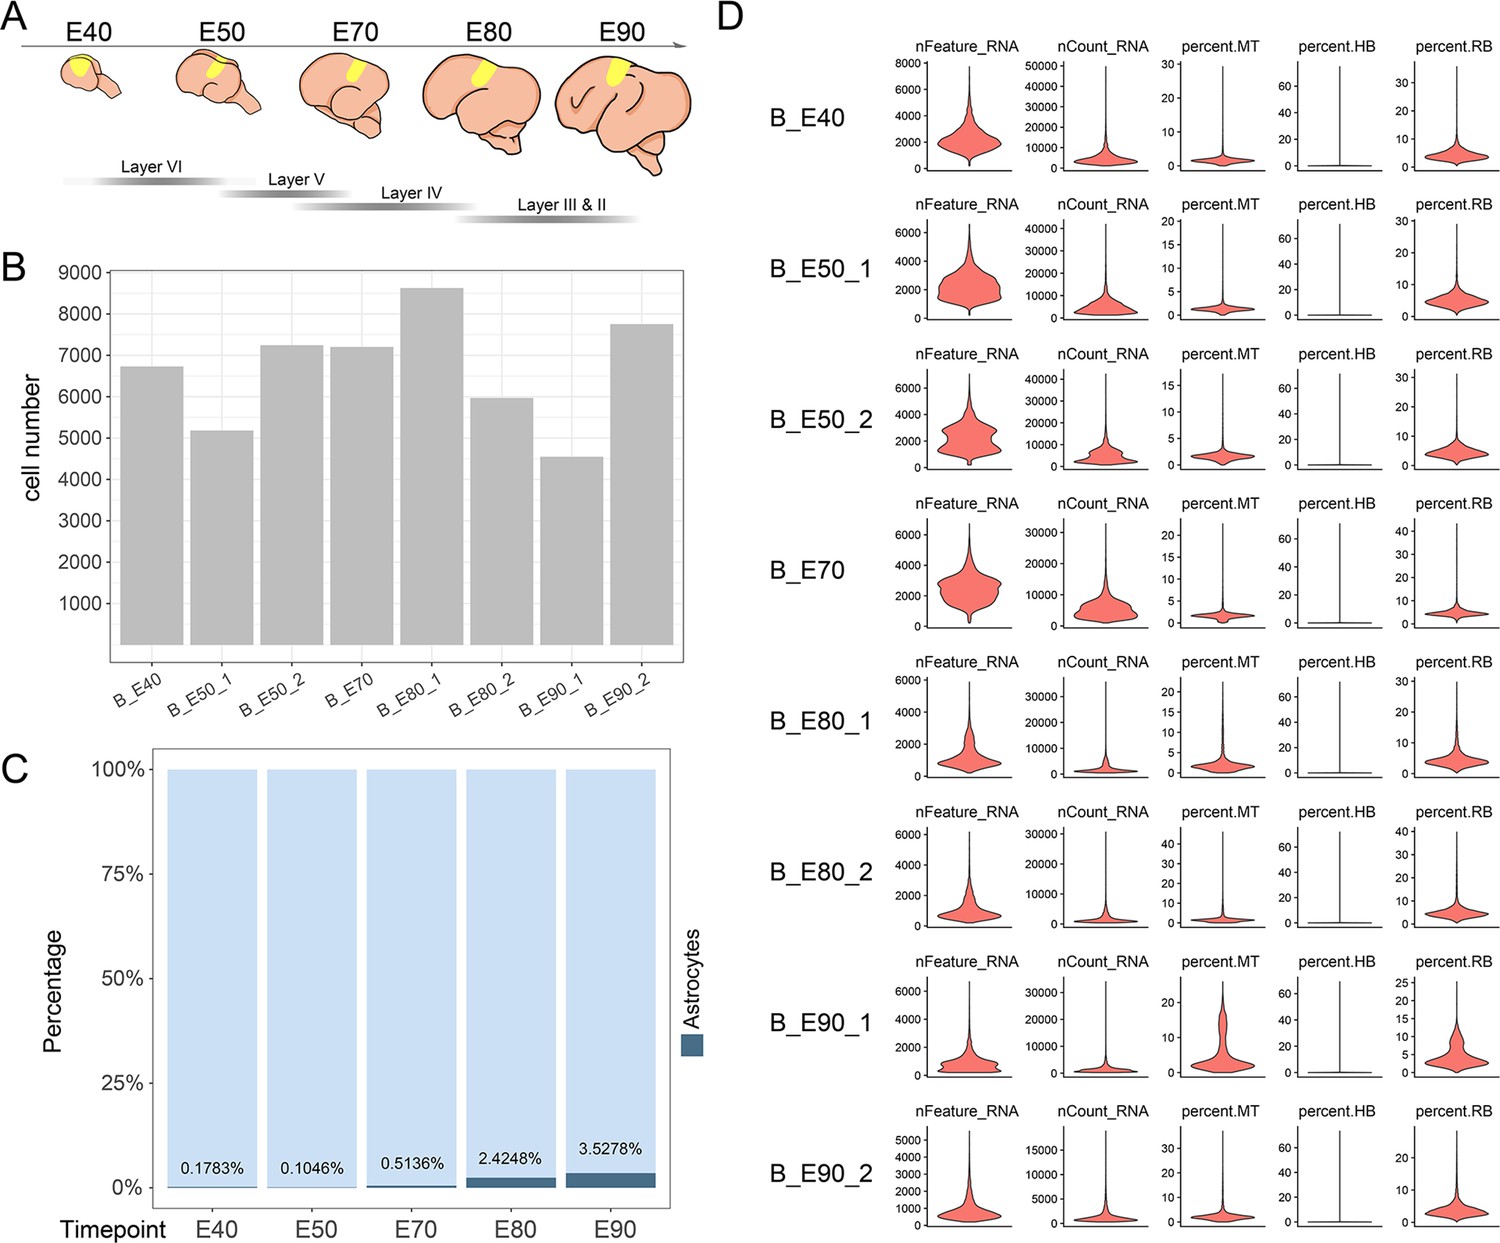
Sample collection and quality control.
(A) Schematic diagram of sample collecting anatomical area. (B) The cell number per sample after quality control. (C) Bar chart of astrocytes’ proportion statistical at each time point. (D) Single-cell transcriptome library information for each sample.
Figure 1—figure supplement 2
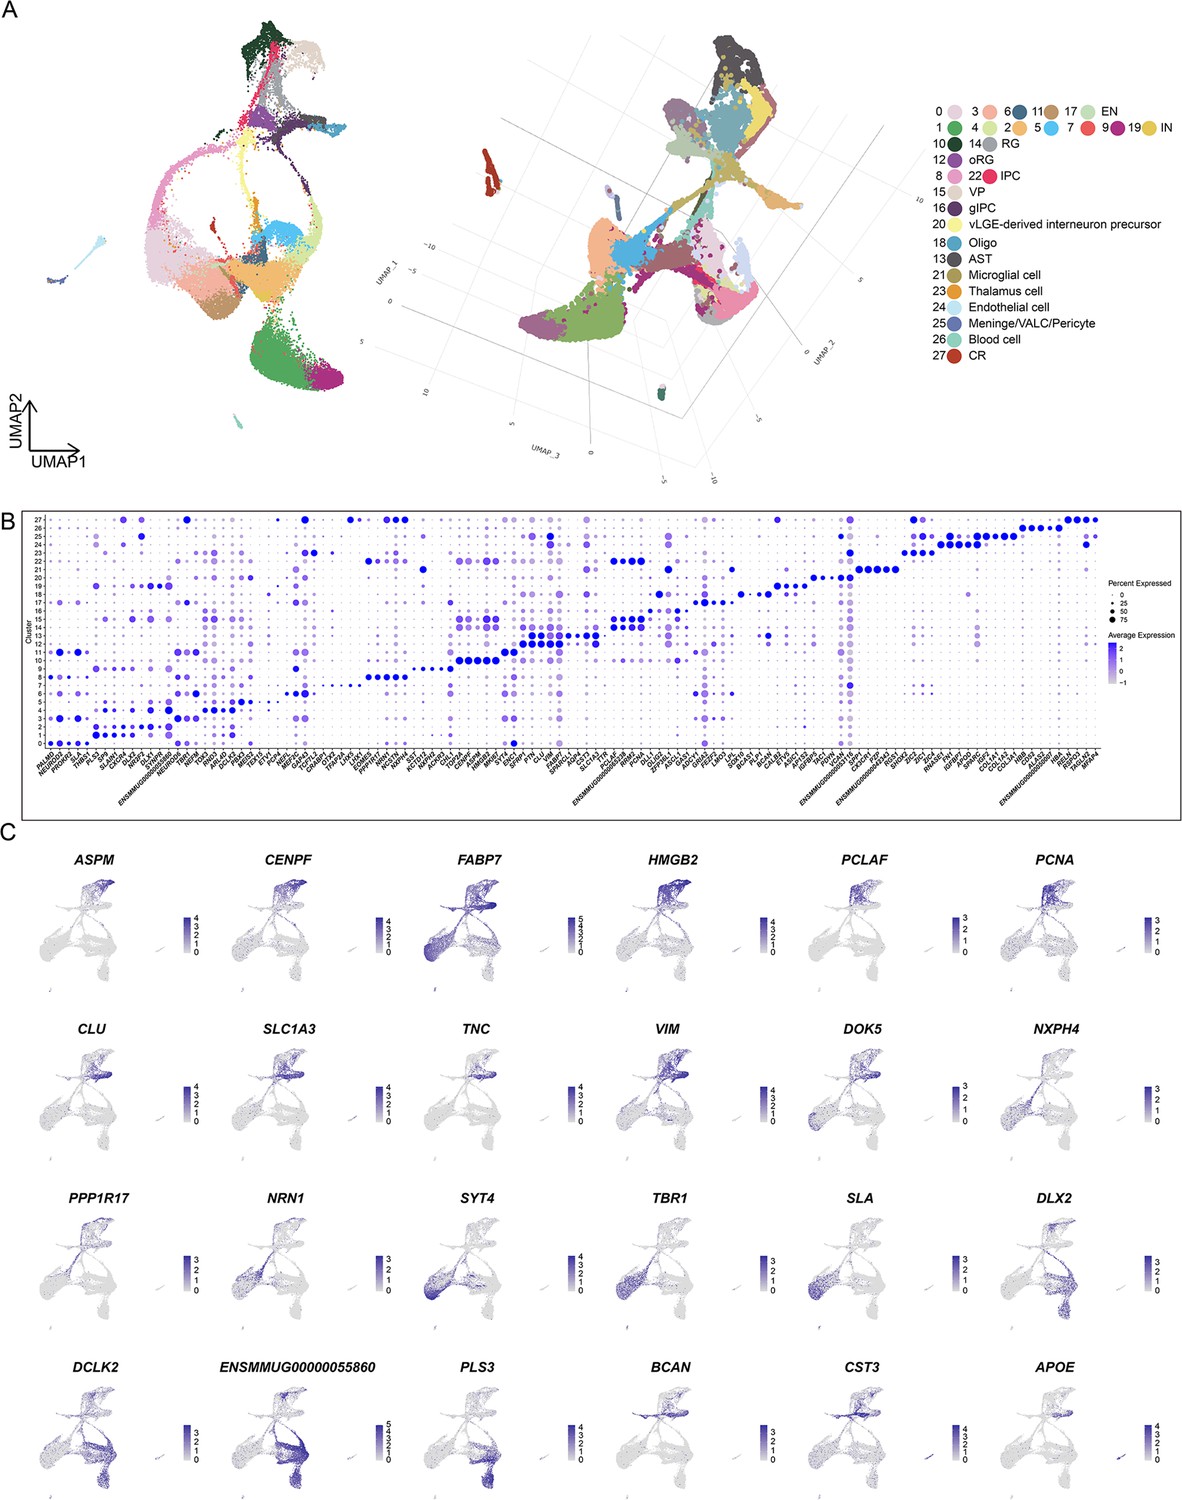
Single-cell RNA sequencing (scRNA-seq) uncovers cell type in the developing macaque neocortex.
(A) Visualization of different dimensionality reduction of all cells. (left, uniform manifold approximation and projection [UMAP] visualization with UMAP1 and UMAP2; right, 3D model of UMAP visualization with UMAP1, UMAP2, and UMAP3). (B) Top marker genes for each of the 28 cell clusters shown in Figure 1B. (C) Feature plots of marker gene expression. Colors represent scaled gene expression.
Figure 2 with 1 supplement
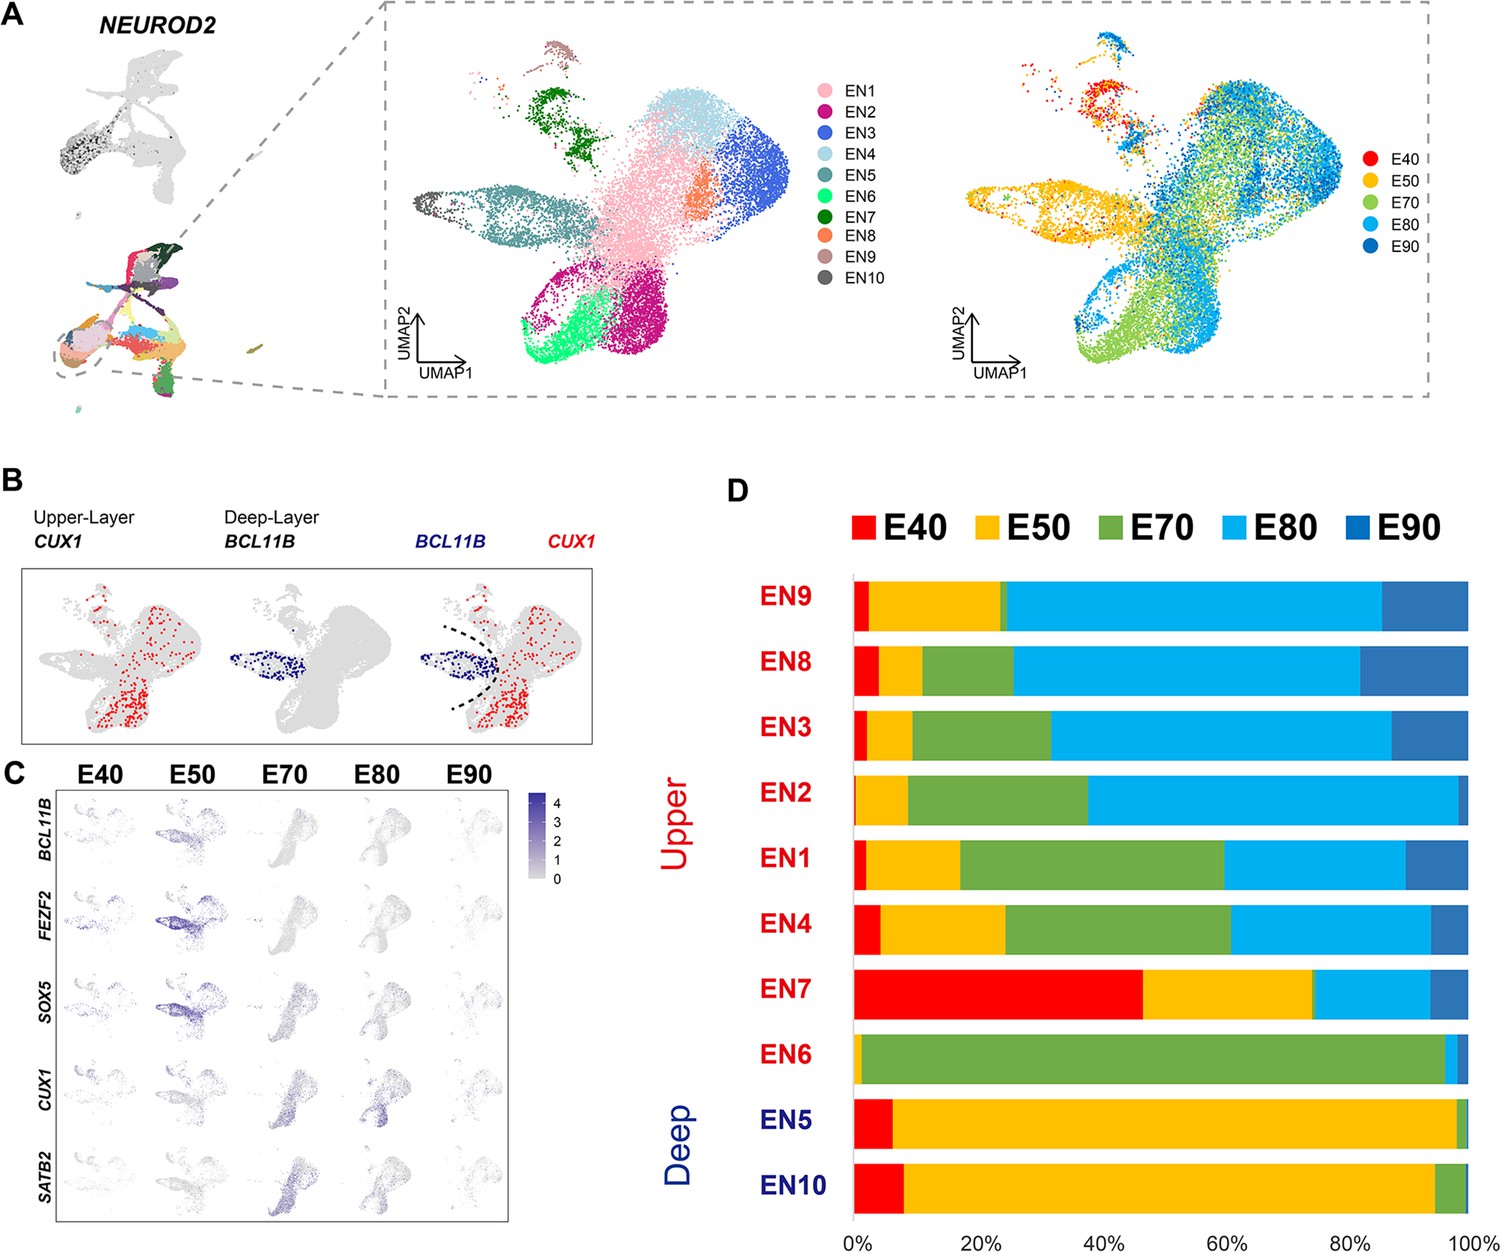
Excitatory neuron subclusters in the developing macaque cerebral cortex.
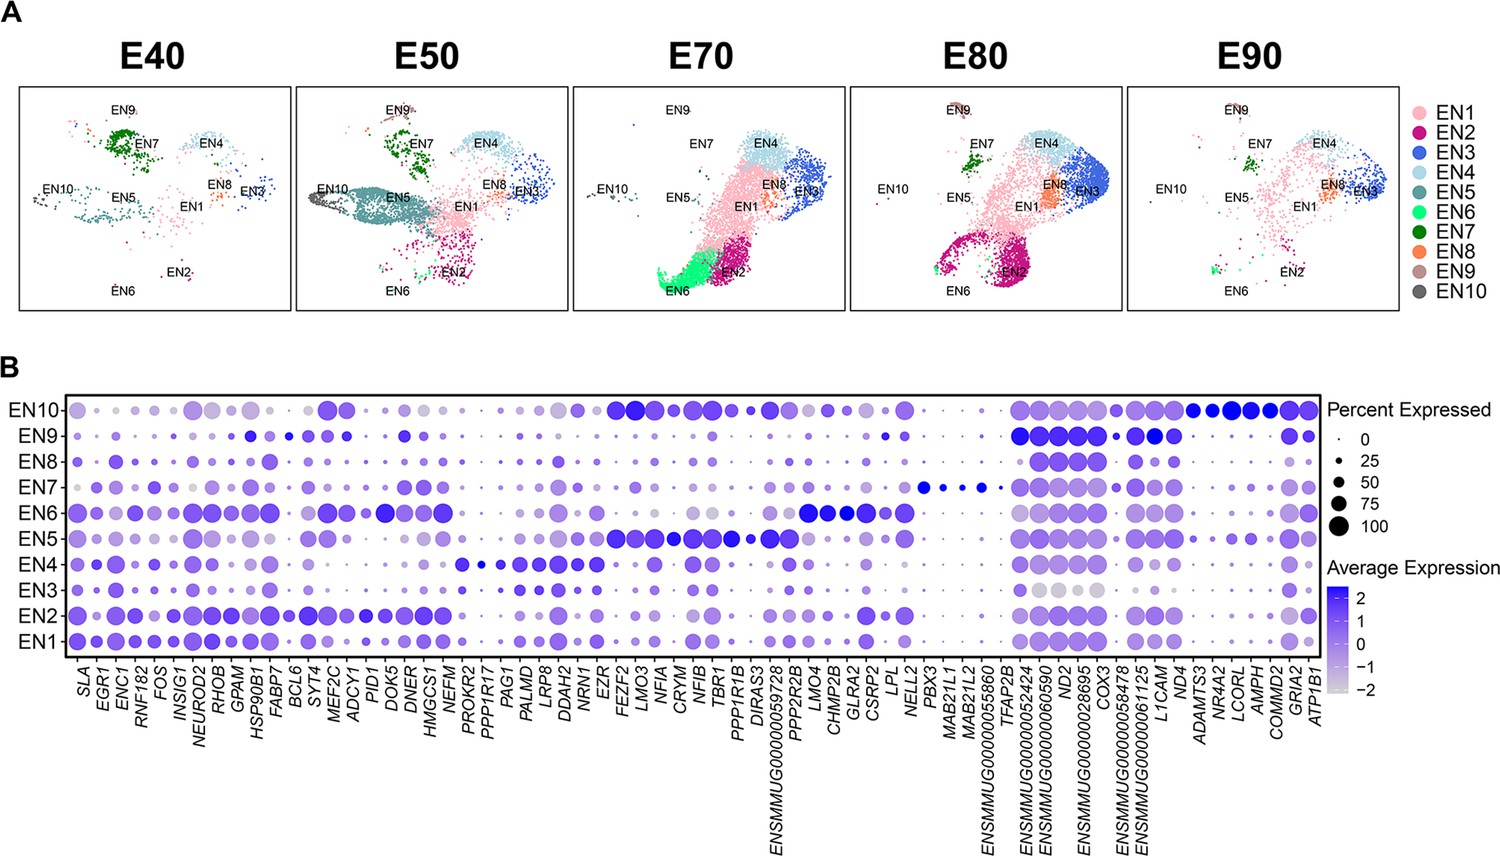
(A) Left, clustering of excitatory neuron subclusters collected at all time points, visualized via uniform manifold approximation and projection (UMAP). Cells are colored according to subcluster identities (left) and collection time points (right). (B) Differentially, the expression of deep-layer marker BCL11B and upper-layer marker CUX1 are highlighted. (C) Excitatory neuron subclusters’ UMAP plot shows the expression of classic markers for deep layers (BCL11B, FEZF2, SOX5) and upper layers (CUX1, SATB2) present at each time point. (D) The proportion of different excitatory neuron subclusters corresponding to excitatory neurons in each time point.
Figure 2—figure supplement 1
Additional information for excitatory neuron subcluster.
(A) Uniform manifold approximation and projection (UMAP) visualization of excitatory neuron subcluster cell single-cell RNA sequencing (scRNA-seq) data from individual time points. Cells are colored by excitatory neuron subcluster assignment. (B) Top marker genes for each of the excitatory neuron subclusters.
Figure 3 with 2 supplements
Cell diversity and regulation of progenitor cells in the macaque cortical neurogenesis.
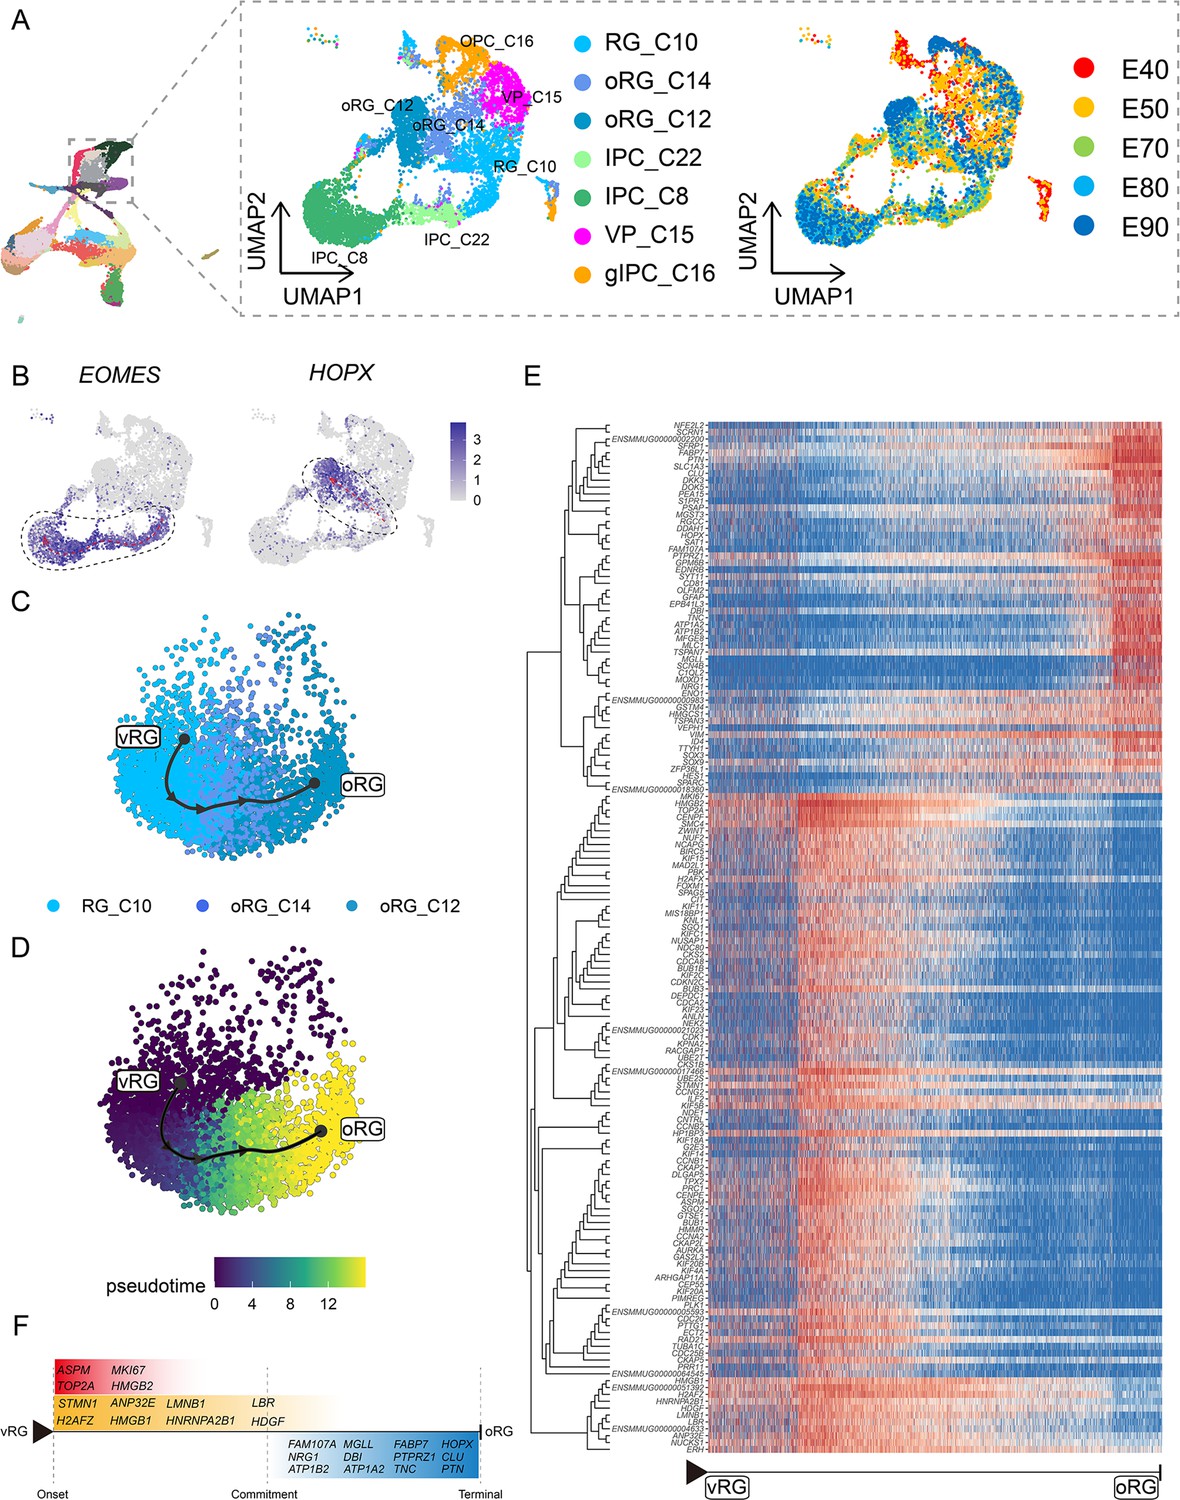
(A) Uniform manifold approximation and projection (UMAP) shows eight progenitor clusters and cell annotation. Left cells are colored according to Seurat clusters; right, cells are colored according to the collection time point. (B) Feature plot of outer radial glia (oRG) marker genes HOPX shows higher expression in C10–C14–C12 (left). Feature plots of intermediate progenitor cell marker gene EOMES show higher expression in C10–C22–C8 (right). (C and D) Pseudotime analysis by Slingshot of HOPX-positive cells (C10–C14–C12). The Slingshot result with the lines indicating the trajectories of lineages and the arrows indicating directions of the pseudotime. Cells are colored according to cell (C) and pesudotime (D). Dots: single cells; colors: cluster and subcluster identity. (E) The heatmap shows the relative expression of top 150 genes displaying significant changes along the pseudotime axis of radial glia (RG) to oRG (C10–C14–C12). The columns represent the cells being ordered along the pseudotime axis. (F) Schematic diagram of some significant genes related to (E). (The depth of the color indicates the levels of gene expression.)
Figure 3—figure supplement 1
Developmental regulation of gene expression from radial glia (RG) to intermediate progenitor cell (IPC).
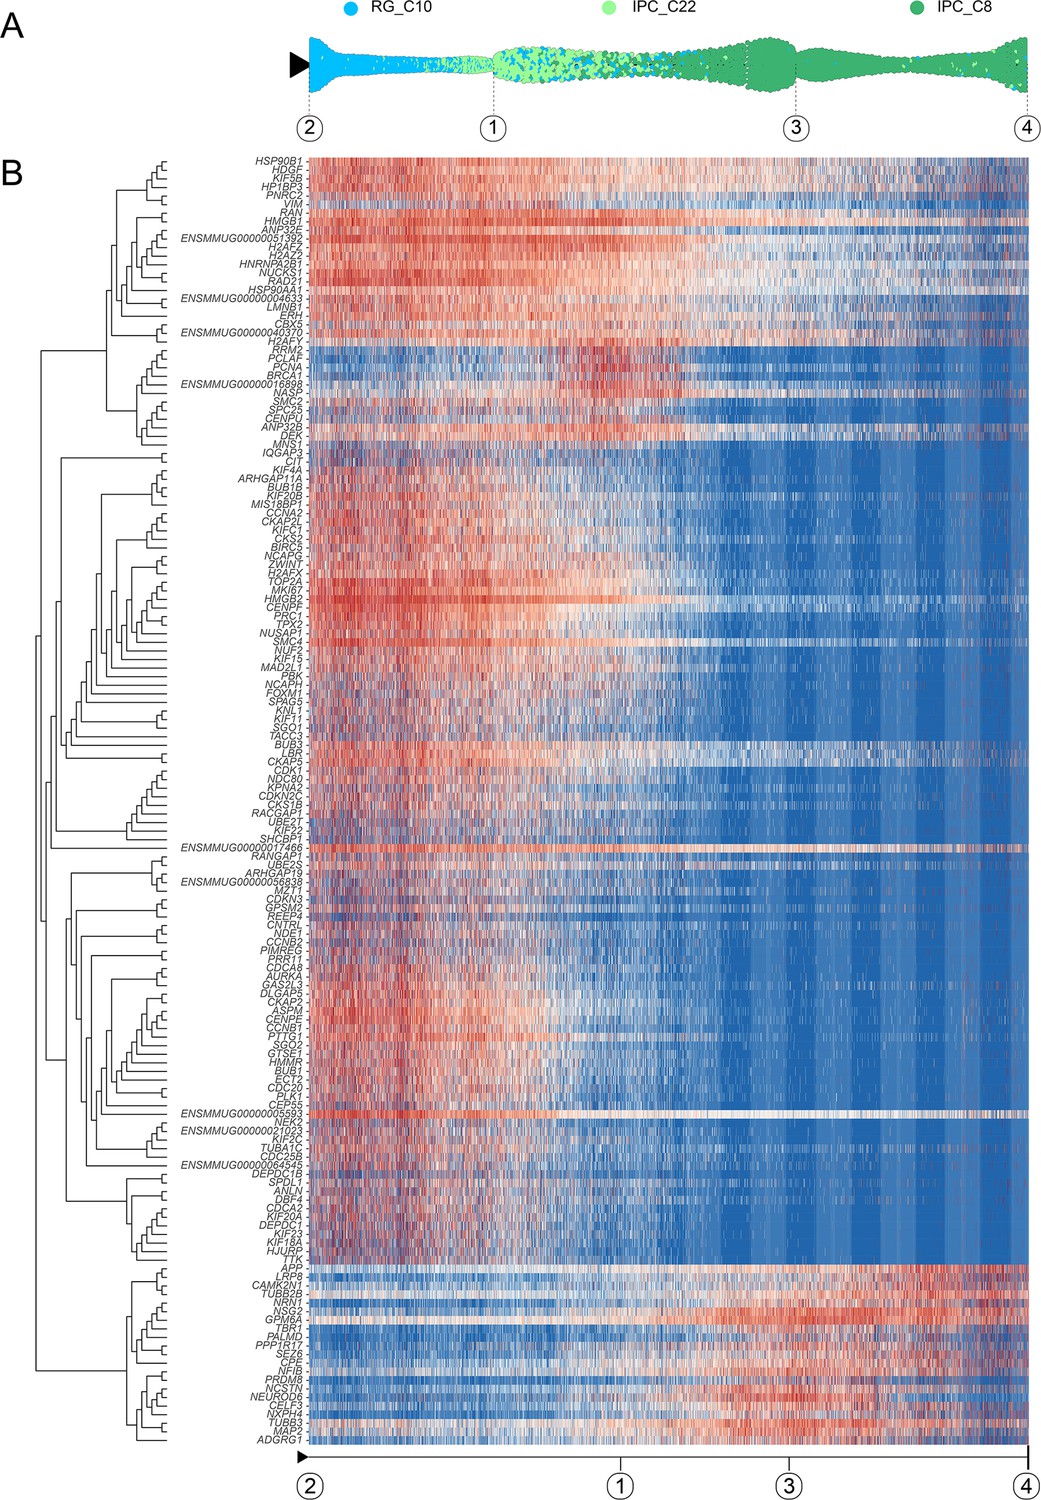
(A) Pseudotime analysis by Slingshot of EOMES-positive cells (C10–C22–C8). Dots: single cells; cells are colored by their identity. (B) Heatmap shows the relative expression of top 150 genes displaying significant changes along the pseudotime axis of RG to IPC (C10–C22–C8). The columns represent the cells being ordered along the pseudotime axis. The start point, endpoint, and important nodes of the Slingshot inference trajectory were marked by framed numbers. Framed number ‘2’ was radial glial cells at the beginning of pseudotime (C10). Framed numbers ‘1’ and ‘3’ marked intermediate state nodes. Framed number ‘4’ marked intermediate progenitor cell (C8).
Figure 3—figure supplement 2
Transcriptional regulation of glia intermediate precursor cell (gIPC) differentiation into astrocytes and oligodendrocytes.
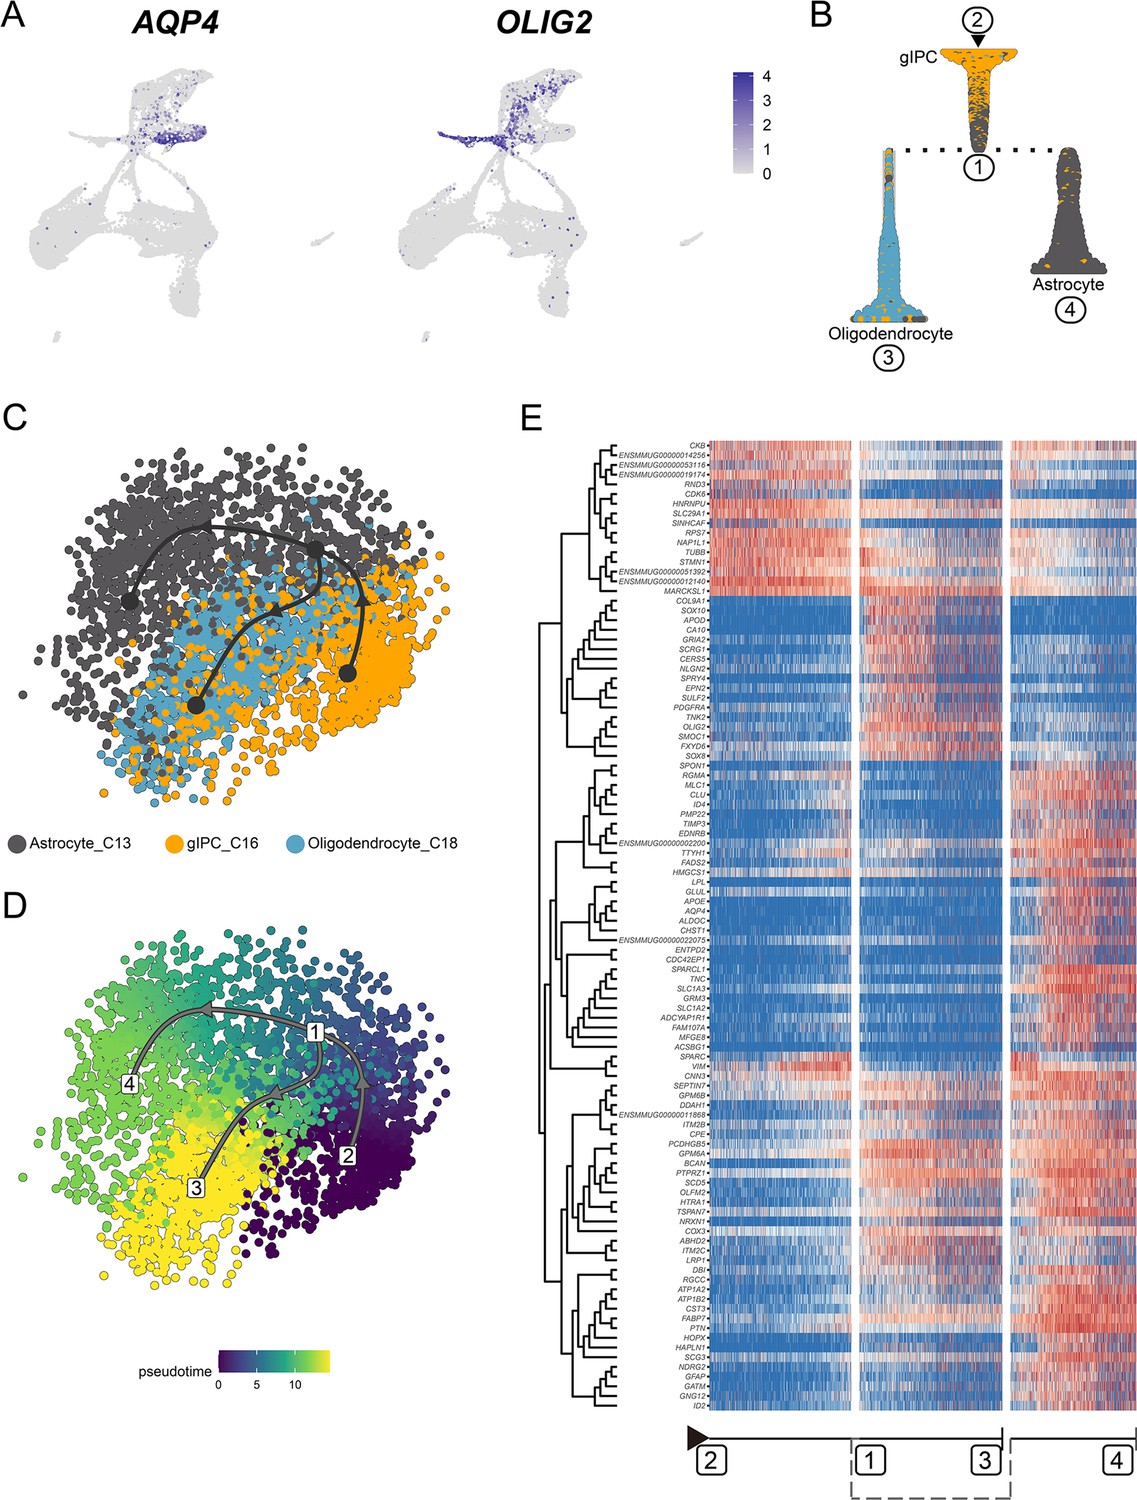
(A) Feature plot of classic marker for astrocytes (AQP4) and oligodendrocytes (OLIG2). (B) Slingshot branching tree related to Slingshot pseudotime analysis in (C and D). Root is gIPC (C16), tips astrocytes (C13), and oligodendrocytes (C18). (C and D) Pseudotime analysis by Slingshot of glial cell lineage (C16→C13, C16→C12). The Slingshot result indicated the trajectories of lineages, and the arrows indicated directions of the pseudotime. Cells are colored according to their identity (C) and pesudotime (D). Dots: single cells; colors: cluster and subcluster identity. (E) Heatmap shows the relative expression of top 150 genes displaying significant changes along the pseudotime axis of glial cell lineage (C16→C13, C16→C12). The columns represent the cells being ordered along the pseudotime axis.
Figure 4 with 1 supplement
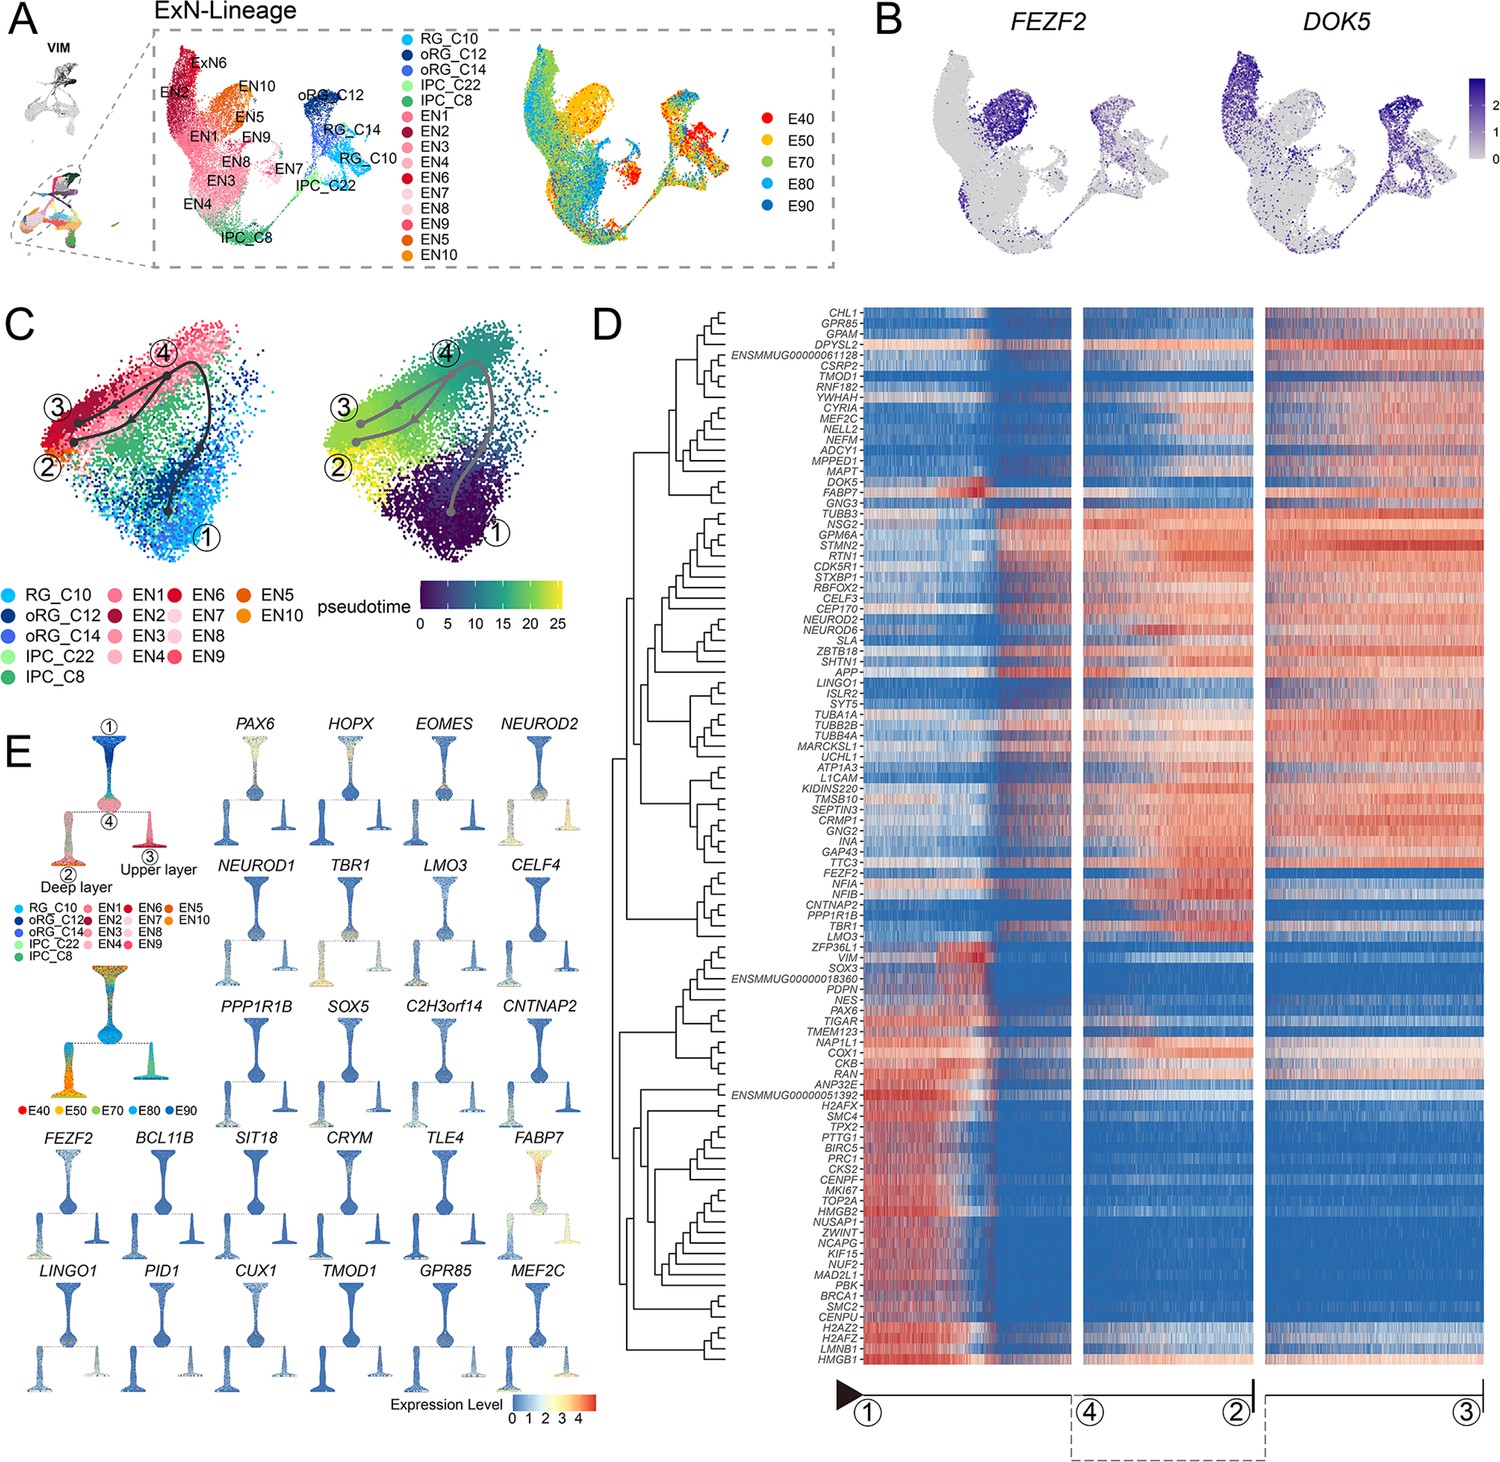
Transcriptional regulation of excitatory neuron lineage during prenatal cortical neurogenesis.
(A) Uniform manifold approximation and projection (UMAP) shows the alignment of macaque cortical NPCs, intermediate progenitor cells (IPCs), and excitatory neurons. Left, cells are colored according to cell annotation. Different yellow/orange colors are used for deep-layer excitatory neuron subclusters (EN5 and EN10), and different red/pink colors are used for upper-layer excitatory neuron subclusters (EN1, EN2, EN3, EN4, EN6, EN7, EN9, and EN10). Right, cells are colored according to the time point of collection. (B) Dot plot showing the marker genes for the deep-layer excitatory neuron (FEZF2) and upper-layer excitatory neuron (DOK5). Light gray, no expression; dark blue, relative expression. (C) Pseudotime analysis by Slingshot projected on PCA plot of RGCs, oRGCs, IPCs, and excitatory neuron subclusters. The Slingshot result indicates the trajectories of lineages, and the arrows indicate the directions of the pseudotime. Dots: single cell; colors: cluster and subcluster identity. Framed numbers marked the start point, endpoint, and essential nodes of the Slingshot inference trajectory. Framed number ‘1’ was the excitatory neuron lineage trajectory start point (C10). Framed number ‘4’ marked immature neurons. Framed numbers ‘2’ and ‘3’ marked deep-layer and upper-layer neurons. Cells are colored according to cell annotation and pseudotime. (D) The heatmap shows the relative expression of the top 100 genes displaying significant changes along the pseudotime axis of each lineage branch. The columns represent the cells being ordered along the pseudotime axis. (E) Left, Slingshot branching tree related to Slingshot pseudotime analysis in C. The root is E40 earliest RG (C10), tips are deep-layer excitatory neurons generated at the early stage (E40, E50), and upper-layer excitatory neurons are generated at the later stage (E70, E80, E90). Right, branching trees showing the expression of marker genes of apical progenitors (PAX6), outer radial glia cells (HOPX), intermediate progenitors (EOMES), and excitatory neurons (NEUROD2), including callosal neurons (SATB2, CUX2), deeper layer neurons (SOX5, FEZF2), corticofugal neurons (FEZF2, TLE4). There is a sequential progression of radial glia cells, intermediate progenitors, and excitatory neurons.
Figure 4—figure supplement 1
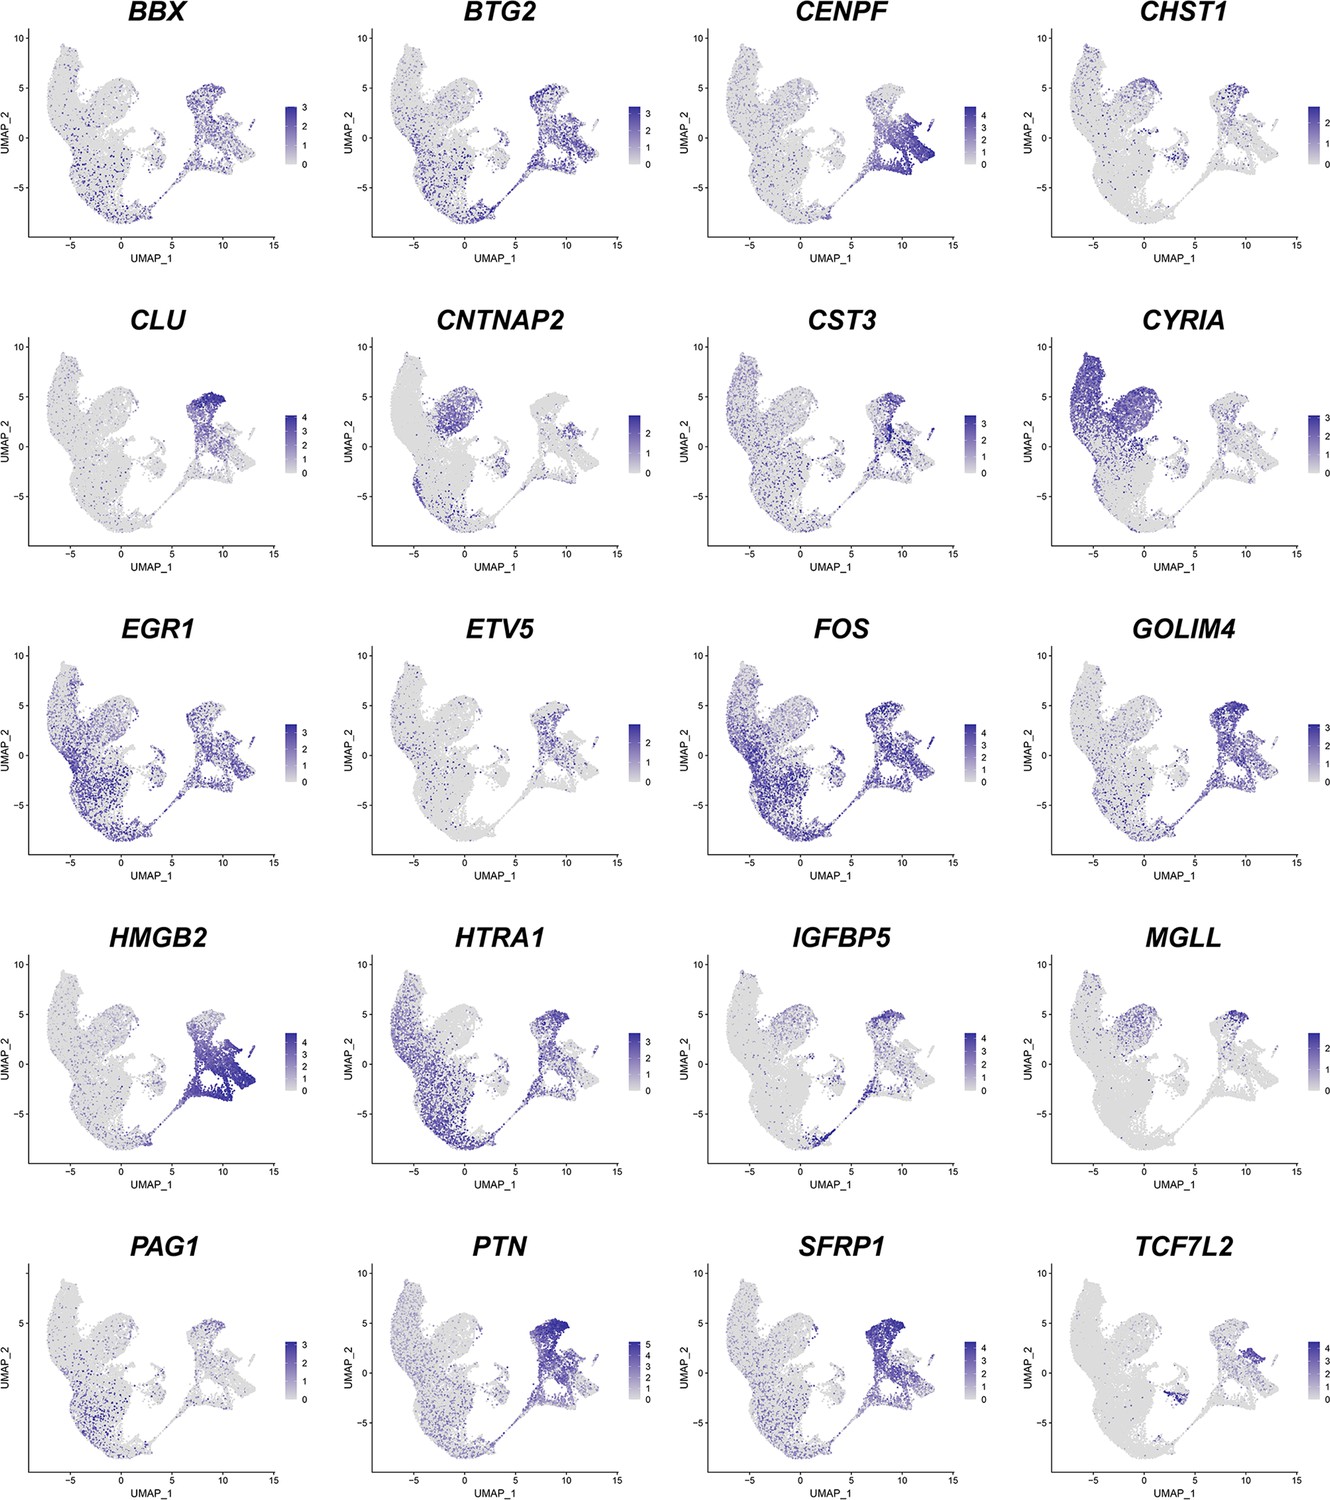
Stem and excitatory neuron subcluster mapping genes.
Figure 5 with 1 supplement
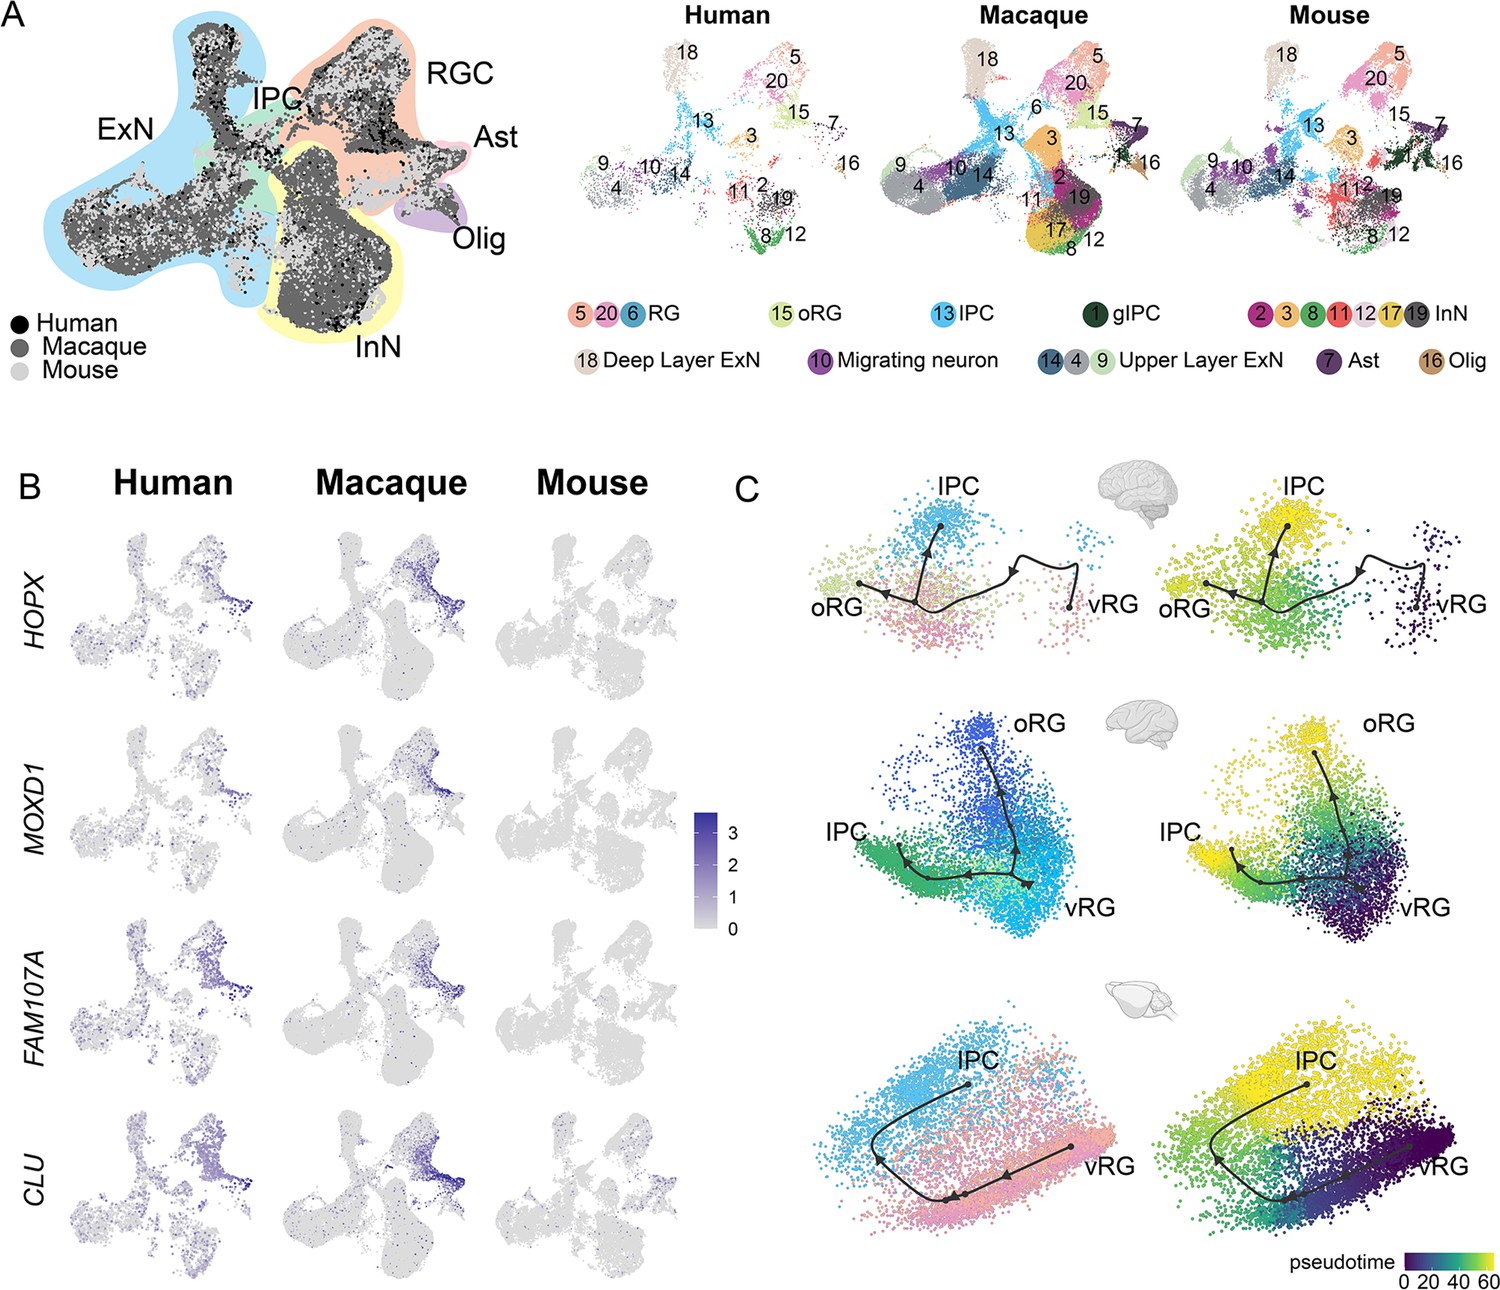
Integration of human, macaque, and mouse single-cell datasets reveals conserved and divergent progenitor cell types.
(A) Left, uniform manifold approximation and projection (UMAP) plot of cross-species integrated single-cell transcriptome data with LIGER. Colors represent different major cell types (black: human dataset; dark gray: macaque dataset; lighter gray: mouse). Right, the UMAP plot of each dataset, colored according to the LIGER cluster. (B) The expressions of the classic outer radial glia (oRG) marker genes were plotted to UMAP visualization. Light gray, no expression; dark blue, relative expression. (C) Comparison of vRG→oRG and vRG→IPC developmental trajectories between human, macaque, and mouse.
Figure 5—figure supplement 1
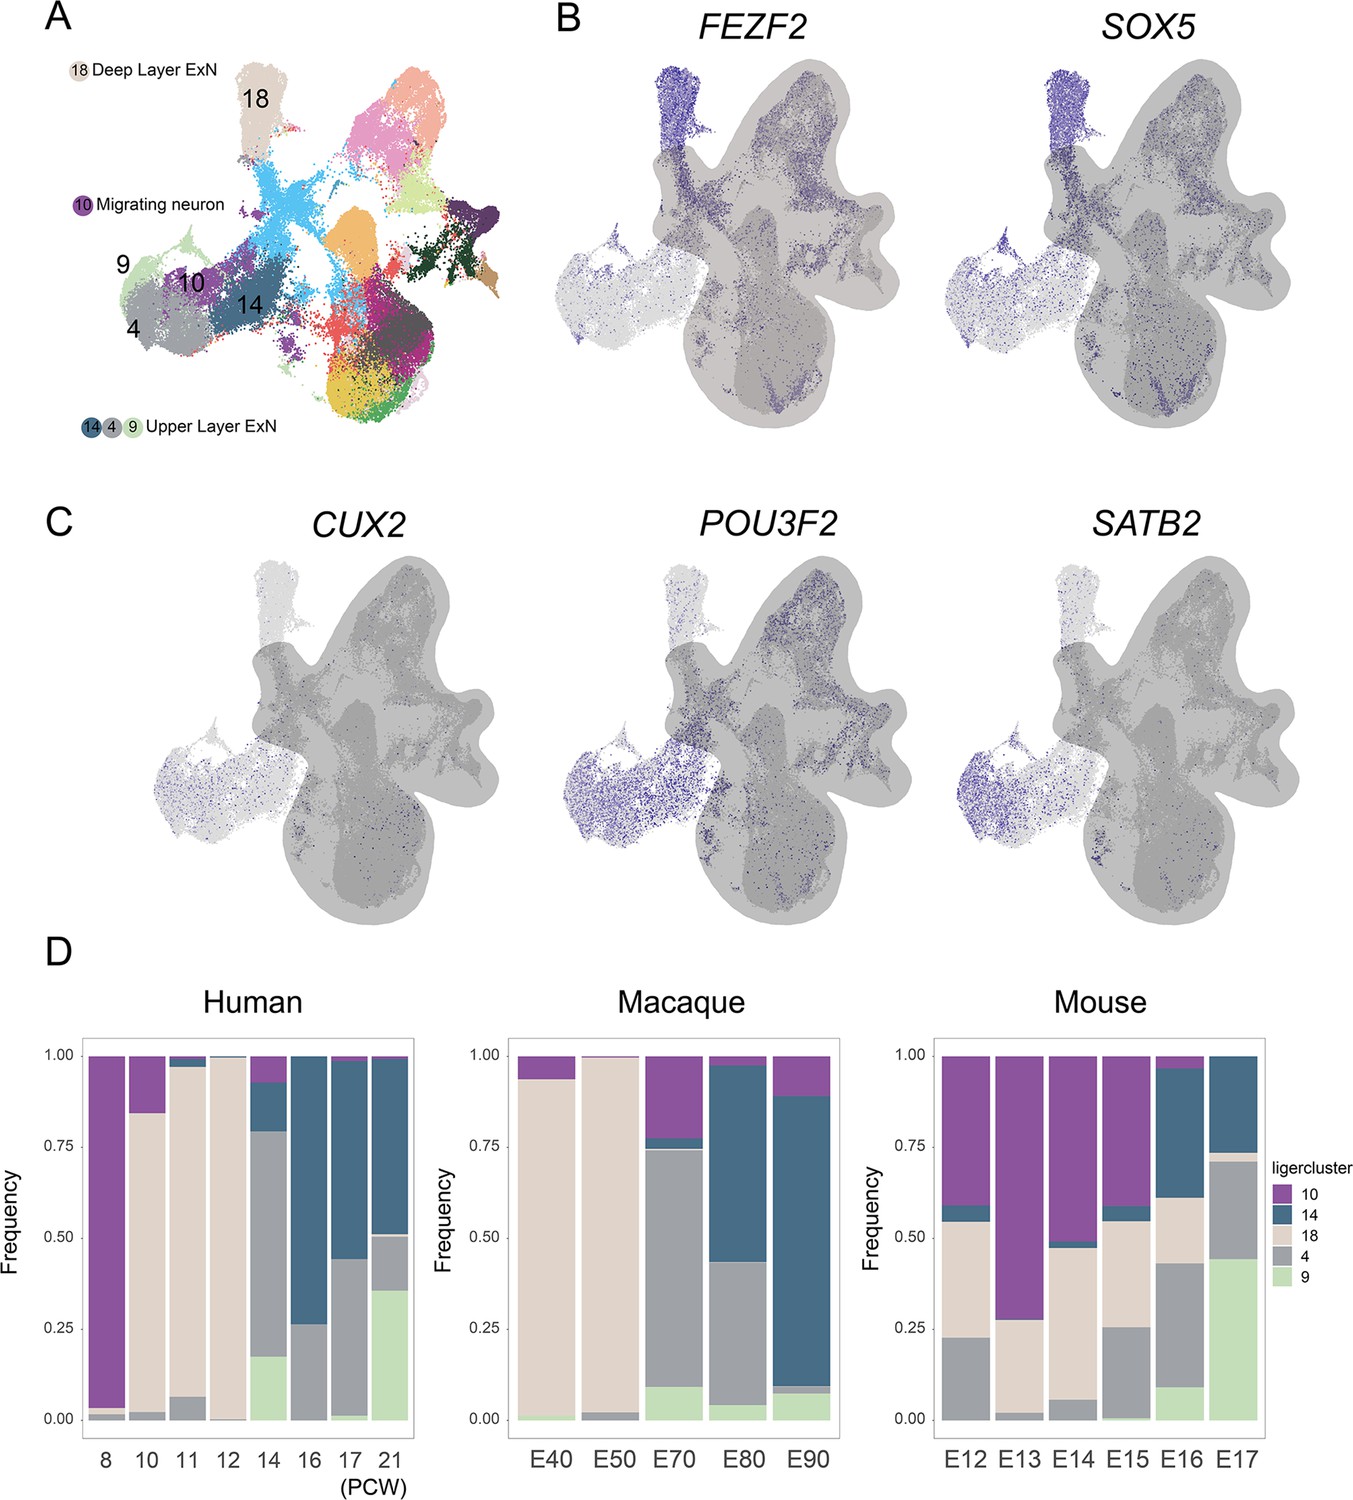
Upper-layer and deep-layer excitatory neuron proportion analysis among species.
(A) Cell-type annotation of the integrated dataset. (B and C) Feature plot shows the expression of upper-layer marker genes CUX2, POU3F2, SATB2, and deep-layer marker genes FEZF2 and SOX5. (D) Proportion analysis of excitatory neuron subclusters in human, macaque, and mouse datasets at different developmental time points.
Figure 6 with 1 supplement

The patterns of transcriptional regulation comparative analysis responsible in ventricular radial glia (vRGs).
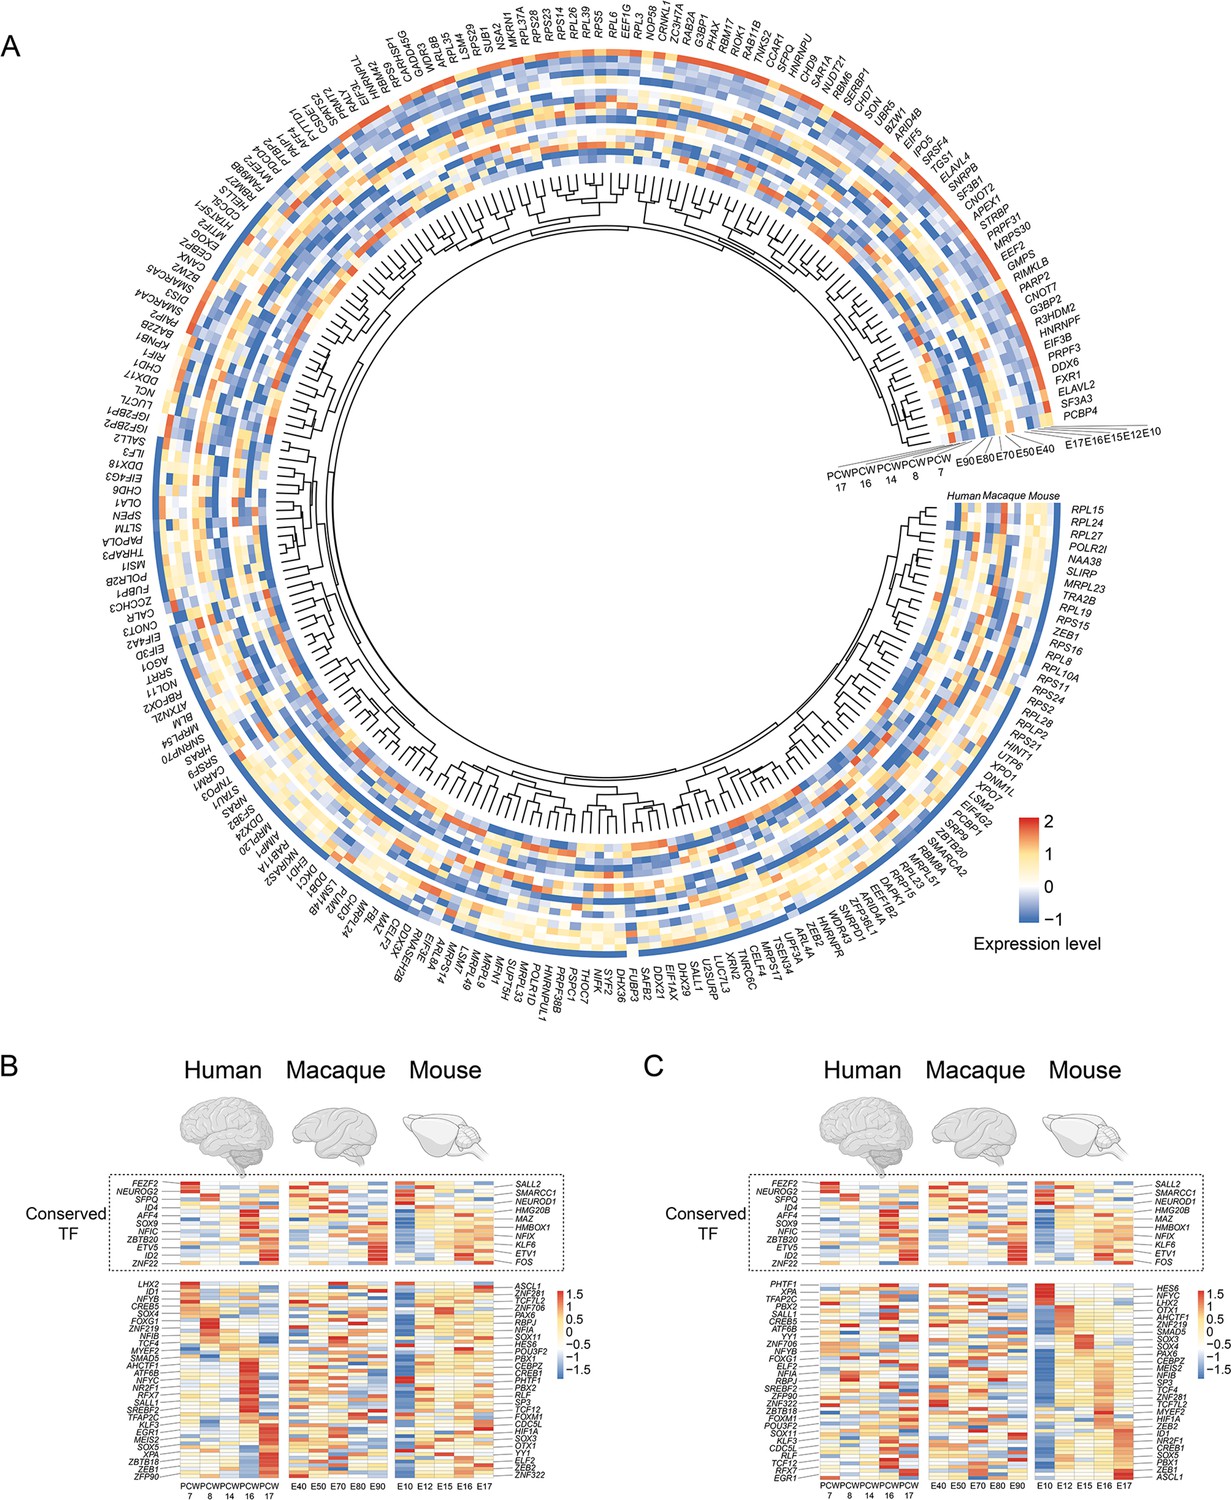
(A) Normalized expressions of genes that show temporal dynamics in the vRGs of human, macaque, and mouse. (B) Temporal expression heatmap of homologous transcription factor (TF) genes among human, macaque, and mouse. (The TFs genes in the dashed boxes showed similar temporal expression patterns across species.) (C, E, and G) Regulon specificity score for each time point in human, macaque, and mouse vRG. Regulons with high scores in multiple species vRG cells are colored yellow. (D, F, and H) show a network generated with Cytoscape using the top 10 regulons in the human, macaque, and mouse vRG at each time point and their top 5 target genes identified by SCENIC as an input. The interactions between conserved TFs in more than one species are colored yellow.
Figure 6—figure supplement 1
Temporal expression pattern of RNA binding protein and transcription factor genes in human, macaque, and mouse ventricular radial glia (vRG).
(A) Temporal expression heatmap of RNA binding protein genes in human, macaque, and mouse vRG. (B and C) Temporal expression heatmap of transcription factor genes in human, macaque, and mouse vRG sorted by human (B) and mouse (C) temporal pattern. (Note: each line is the same homologous gene.)
Author response image 1
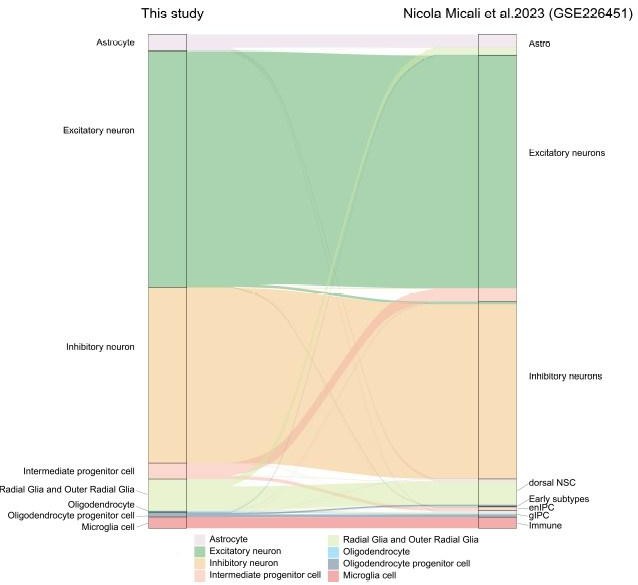
Riverplot illustrates relationships between datasets in this study and recently published developing macaque telencephalon datasets major cell type annotation.
Author response image 2
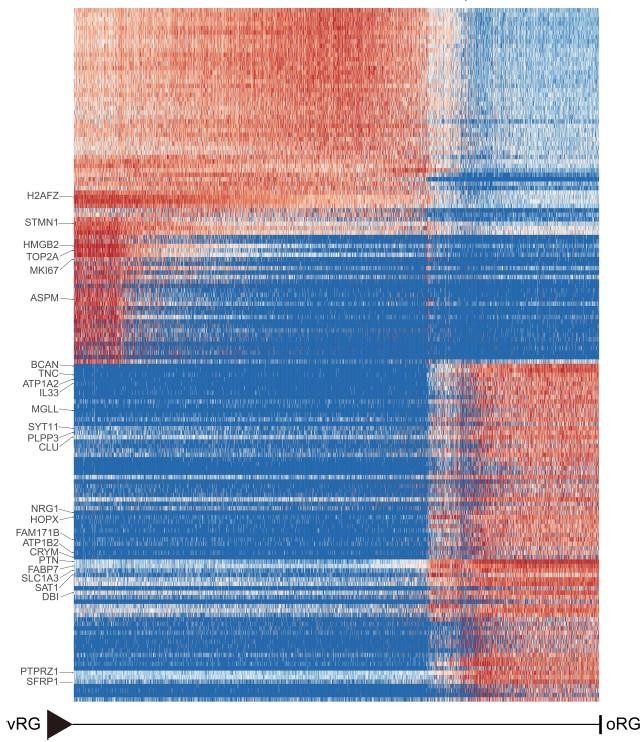
Heatmap shows the relative expression of genes displaying significant changes along the pseudotime axis of vRG to oRG from the dataset of Nicola Micali et al.
2023(GEO: GSE226451). The columns represent the cells being ordered along the pseudotime axis.
Author response image 3

Vlnplot of additional markers in cluster 23.
Author response image 4

(A) Modified diagram of clustering of excitatory neuron subclusters collected at all time points, visualized via UMAP related to Figure 2A. (B) Vlnplot of different marker genes in EN8.
Author response image 5

Subdivide analysis of oRG_C12.
(A)and (B) Subdividing of e oRG_C12 visualized via UMAP. Cells are colored according to subcluster timepoint (A) and subcluster identities (B). (C) Violin plot of molecular markers for the subclusters.
Author response image 6

Vlnplot of different markers in EN8.
Author response image 7

Gene Ontology (GO) analysis of unconserved temporal patterns transcription factors among mouse, macaque and human vRG cells.
Additional files
-
Supplementary file 1
Marker list of 28 cell clusters.
- https://cdn.elifesciences.org/articles/90325/elife-90325-supp1-v1.csv
-
Supplementary file 2
Gene expression importance across the ventricular radial glia (vRG) to outer radial glia (oRG) (C10–C14–C12) lineage trajectory related to Figure 3E (vRG: milestone2; oRG: milestone4).
- https://cdn.elifesciences.org/articles/90325/elife-90325-supp2-v1.csv
-
Supplementary file 3
Gene expression importance across the radial glia (RG) to deep-layer neurons and upper-layer lineage trajectory related to Figure 4D.
- https://cdn.elifesciences.org/articles/90325/elife-90325-supp3-v1.csv
-
Supplementary file 4
Gene expression importance across the ventricular radial glia (vRG) to intermediate progenitor cell (IPC) (C10–C22–C8) trajectory related to Figure 3—figure supplement 1B.
- https://cdn.elifesciences.org/articles/90325/elife-90325-supp4-v1.csv
-
Supplementary file 5
Gene expression importance across the glia intermediate precursor cell (gIPC) differentiation into astrocytes and oligodendrocytes lineage trajectory related to Figure 3—figure supplement 2E.
- https://cdn.elifesciences.org/articles/90325/elife-90325-supp5-v1.csv
-
Supplementary file 6
The original data of normalized gene expression matrix in human, macaque, and mouse ventricular radial glia (vRG) related to Figure 6A.
- https://cdn.elifesciences.org/articles/90325/elife-90325-supp6-v1.xlsx
-
Supplementary file 7
Regulon specificity score for each time point in human, macaque, and mouse ventricular radial glia (vRG) related to Figure 6C to H.
- https://cdn.elifesciences.org/articles/90325/elife-90325-supp7-v1.xlsb
-
MDAR checklist
- https://cdn.elifesciences.org/articles/90325/elife-90325-mdarchecklist1-v1.docx
Download links
A two-part list of links to download the article, or parts of the article, in various formats.
Downloads (link to download the article as PDF)
Open citations (links to open the citations from this article in various online reference manager services)
Cite this article (links to download the citations from this article in formats compatible with various reference manager tools)
Temporal transcriptomic dynamics in developing macaque neocortex
eLife 12:RP90325.
https://doi.org/10.7554/eLife.90325.3


