The antigenic landscape of human influenza N2 neuraminidases from 2009 until 2017
- VIB-UGent Center for Medical Biotechnology, Belgium
- Department of Biochemistry and Microbiology, Ghent University, Belgium
- Gnomixx, Belgium
- VIB Bioinformatics Core, Belgium
- Sanofi, Research North America, United States
Figures
Figure 1
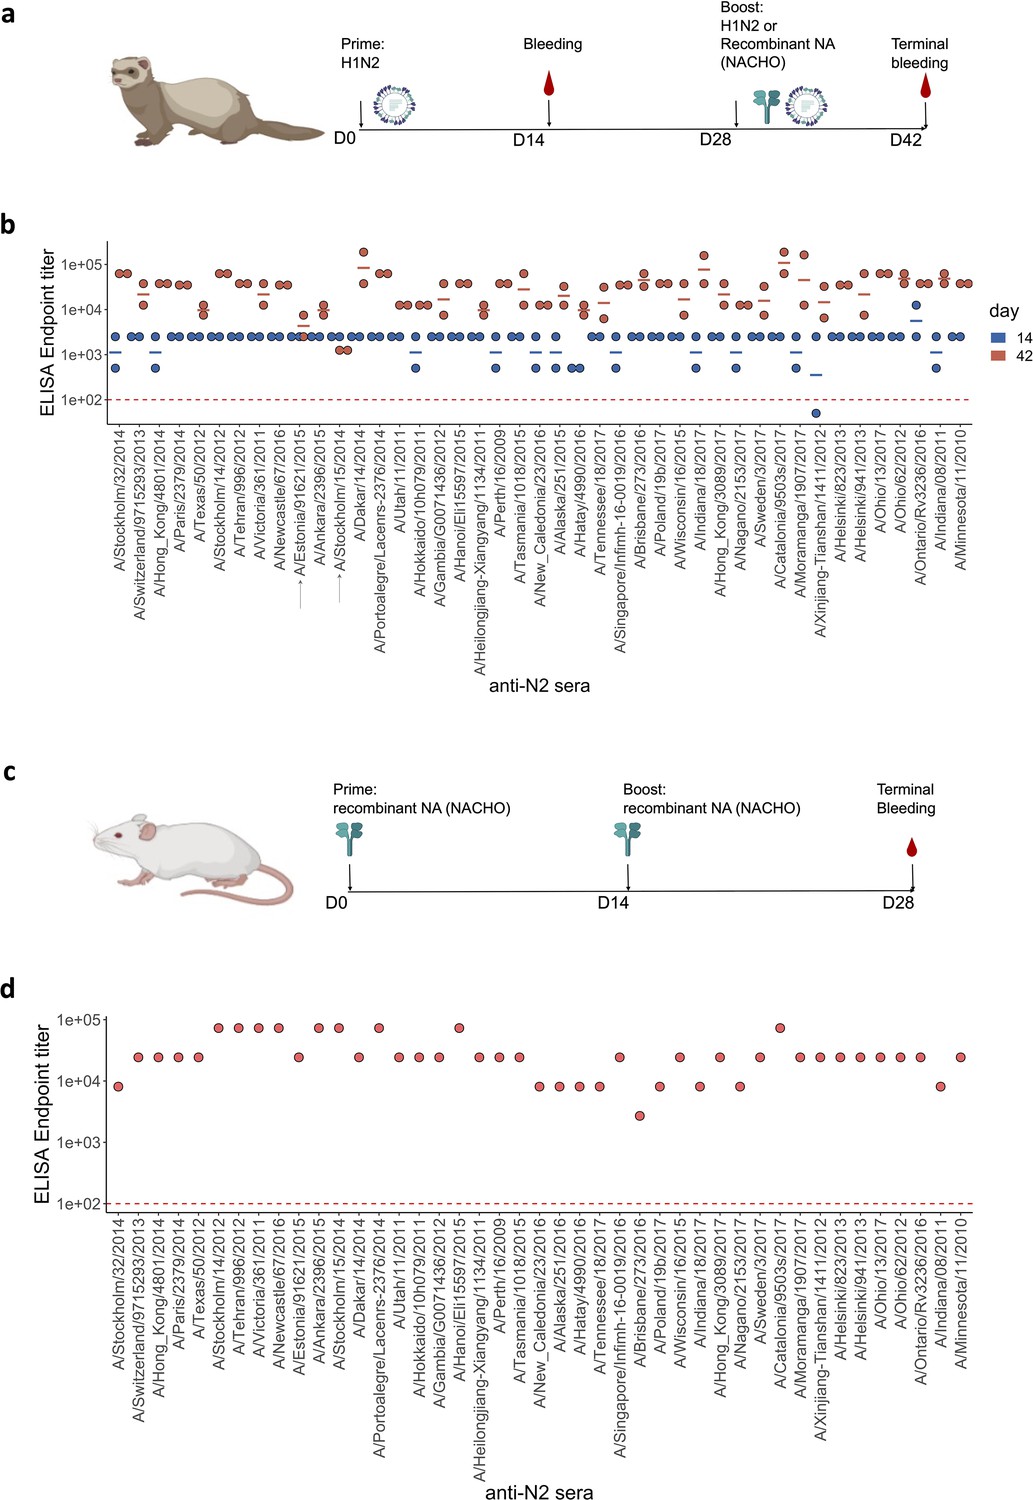
Generation of anti-N2 sera panel from ferrets and mice.
(a) 43 Ferret immunisation and blood sampling scheme. The second immunisation on day 28 was performed with homologous NACHO except for the ferrets that had been primed with H1N2A/Estonia/91621/2015 or H1N2A/Stockholm/15/2014, which were infected again on day 28 post prime with the same H1N2 viruses. (b) Homologous NACHO ELISA titer of ferret sera sampled on day 14 after inoculation with H1N2 virus and 2 weeks after the boost with recombinant neuraminidase (NA) or by re-inoculation with H1N2A/Estonia/91621/2015 or H1N2A/Stockholm/15/2014 (indicated by arrows on the x-axis). (c) 43 BALB/c mouse immunisation and blood sampling scheme. (d) Homologous NACHO serum IgG titers in pooled sera from mice that were immunised twice with recombinant NA. Mouse and ferrets representations were created with BioRender.com, and published using a CC BY-NC-ND license with permission.
© 2024, BioRender Inc. Figure 1 was created using BioRender, and is published under a CC BY-NC-ND 4.0. Further reproductions must adhere to the terms of this license
-
Figure 1—source data 1
Total IgG ELISA titers against homologous recombinant N2 neuraminidases.
- https://cdn.elifesciences.org/articles/90782/elife-90782-fig1-data1-v1.xlsx
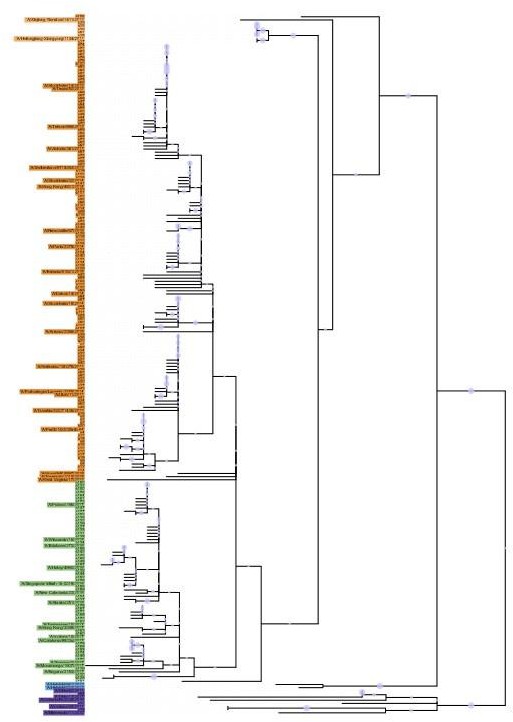
Figure 2 with 6 supplements
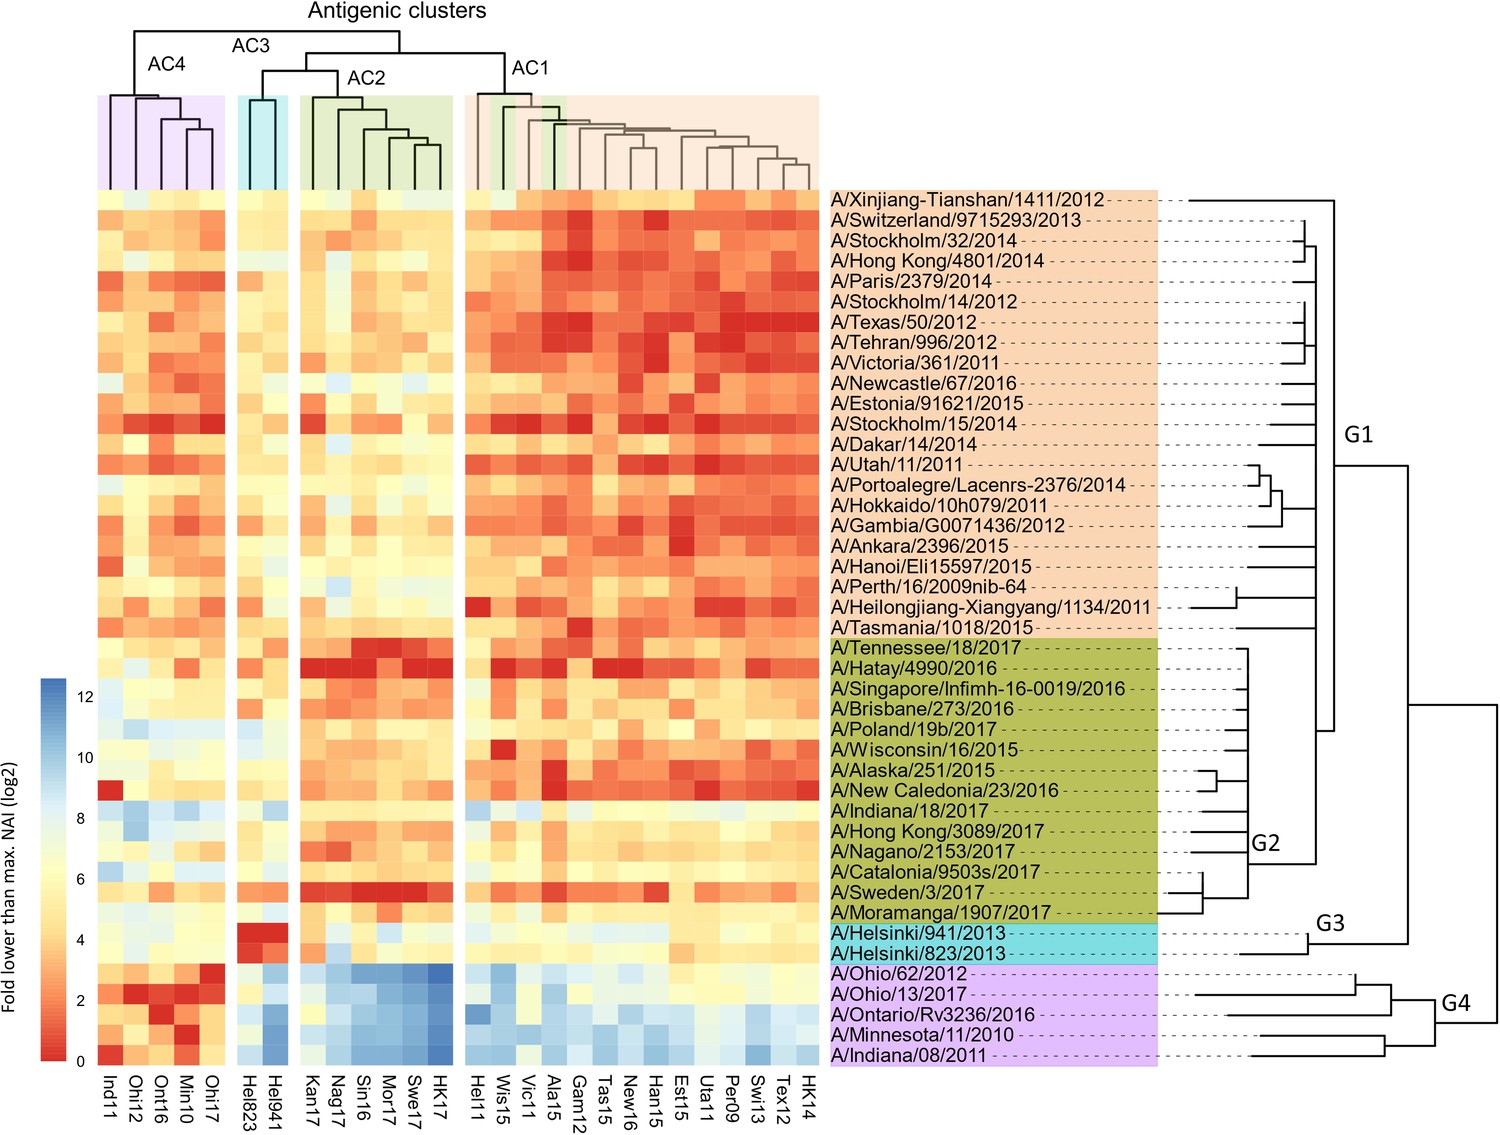
Breadth of N2 neuraminidase (NA) inhibition.
43 Phylogenetic tree based on the N2 NA head domain amino acid sequences and heatmap representing the average of normalised NA inhibition (NAI) per H6N2 [log2 max (NAI/ELISA homologous titer)/(NAI/homologous ELISA titer)] determined in ferret sera after the boost (listed vertically). The red-to-blue scale indicates high-to-low NAI observed in enzyme-linked lectin assay (ELLA) against the H6N2 reassortants (listed at the bottom). Unweighted pair group method with arithmetic mean (UPGMA) clustering of H6N2s inhibition profiles are shown on top of the heatmap and coloured according to the phylogenetic groups.
-
Figure 2—source data 1
Neuraminidase inhibition of H6Nx strains by ferrets sera.
- https://cdn.elifesciences.org/articles/90782/elife-90782-fig2-data1-v1.xlsx
-
Figure 2—source data 2
Neuraminidase inhibition of H6Nx strains by mouse sera.
- https://cdn.elifesciences.org/articles/90782/elife-90782-fig2-data2-v1.xlsx
Figure 2—figure supplement 1
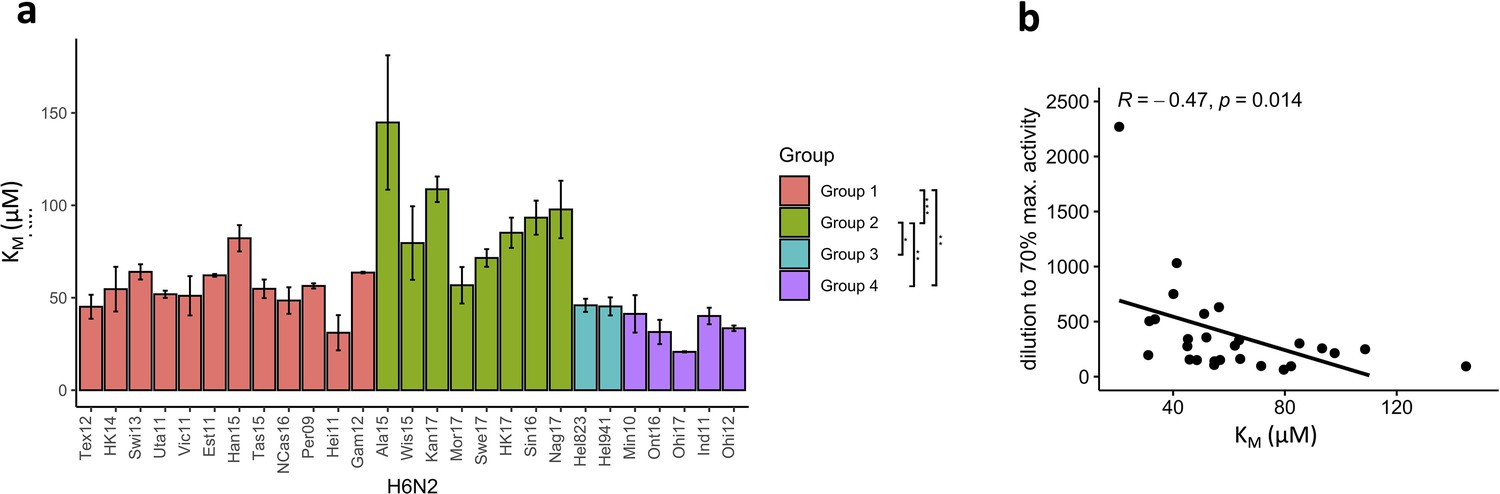
The N2 neuraminidase (NA) substrate affinity is distinct in the N2 phylogenetic groups.
(a) KM was determined for each H6N2 reassortant virus using the fluorogenic substrate 4-methylumbelliferyl-N-acetylneuraminic acid (MUNANA). N2 NAs are coloured according to the phylogenetic groups. Global test comparing the four groups was done using ANOVA (p=2.4e-05) and pairwise comparison performed using Wilcoxon, ***p<0.001, **p<0.01, *p<0.05. (b) Scatter plot and correlation between the KM values and dilutions required to obtain 70% max activity in enzyme-linked lectin assay (ELLA).
Figure 2—figure supplement 2
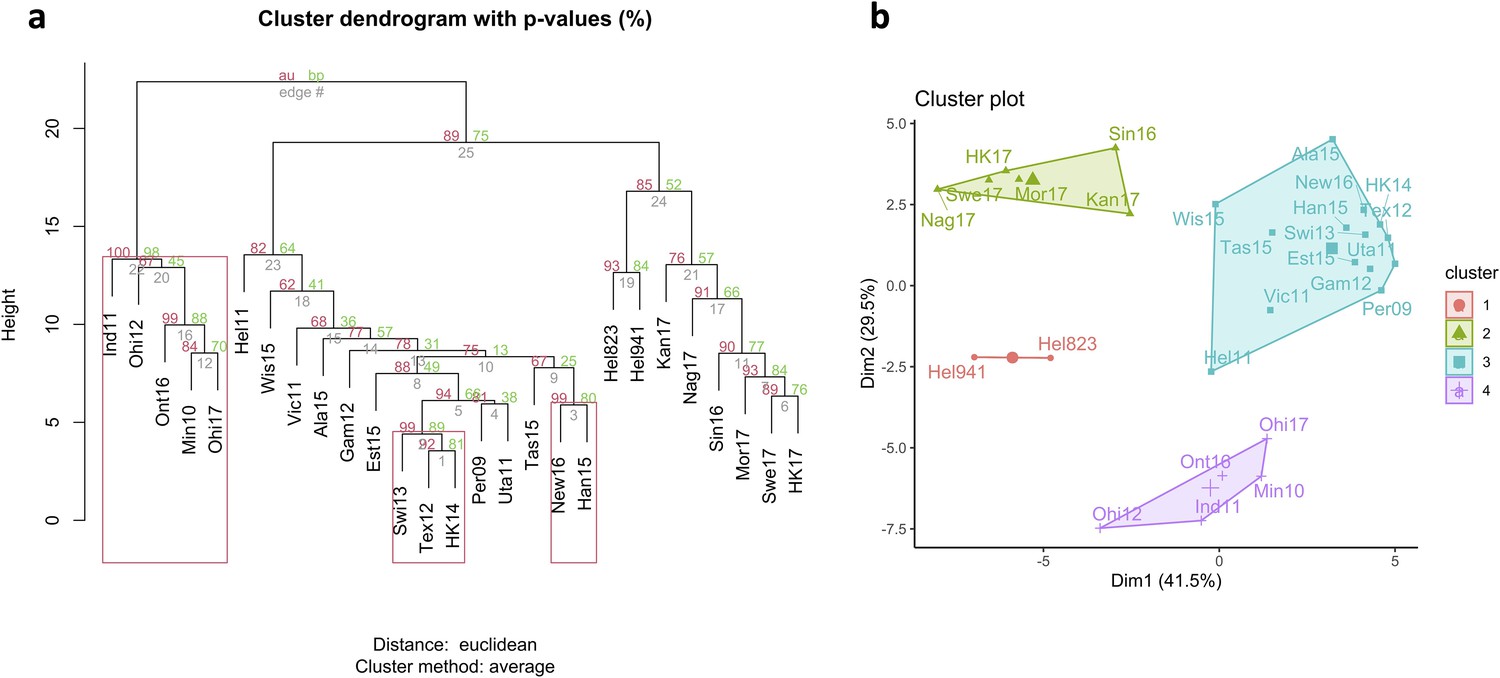
Antigenic relationship between neuraminidase (NA) of the H6N2 viruses.
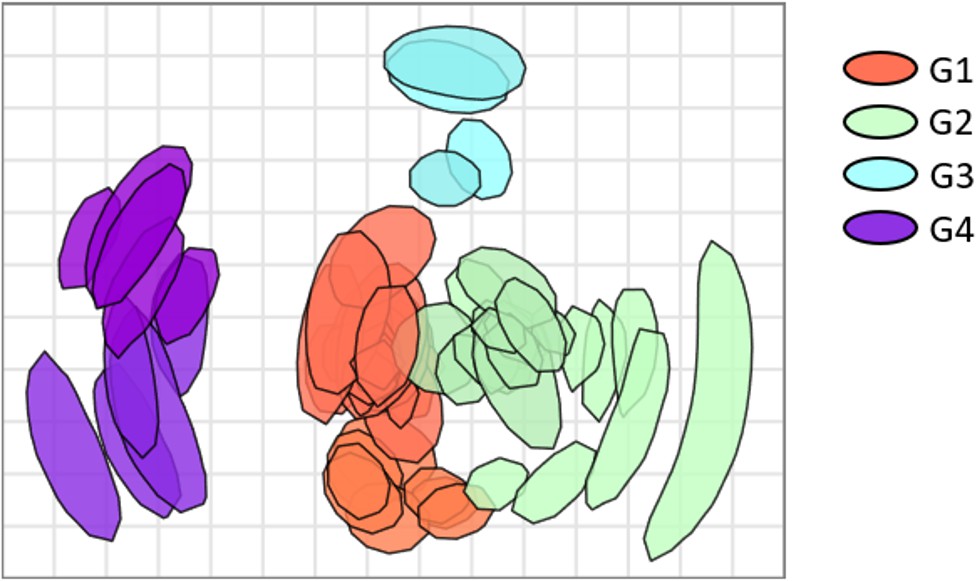
(a) Hierarchical clustering based on multisampling and multiscale bootstrap resampling. Approximately unbiased p-values (AU) are shown in red, bootstrap values in green, and edge values in grey. The red brackets represent the clusters with AU >95%. (b) k-Means clustering represented using principal component analysis (k=4).
Figure 2—figure supplement 3
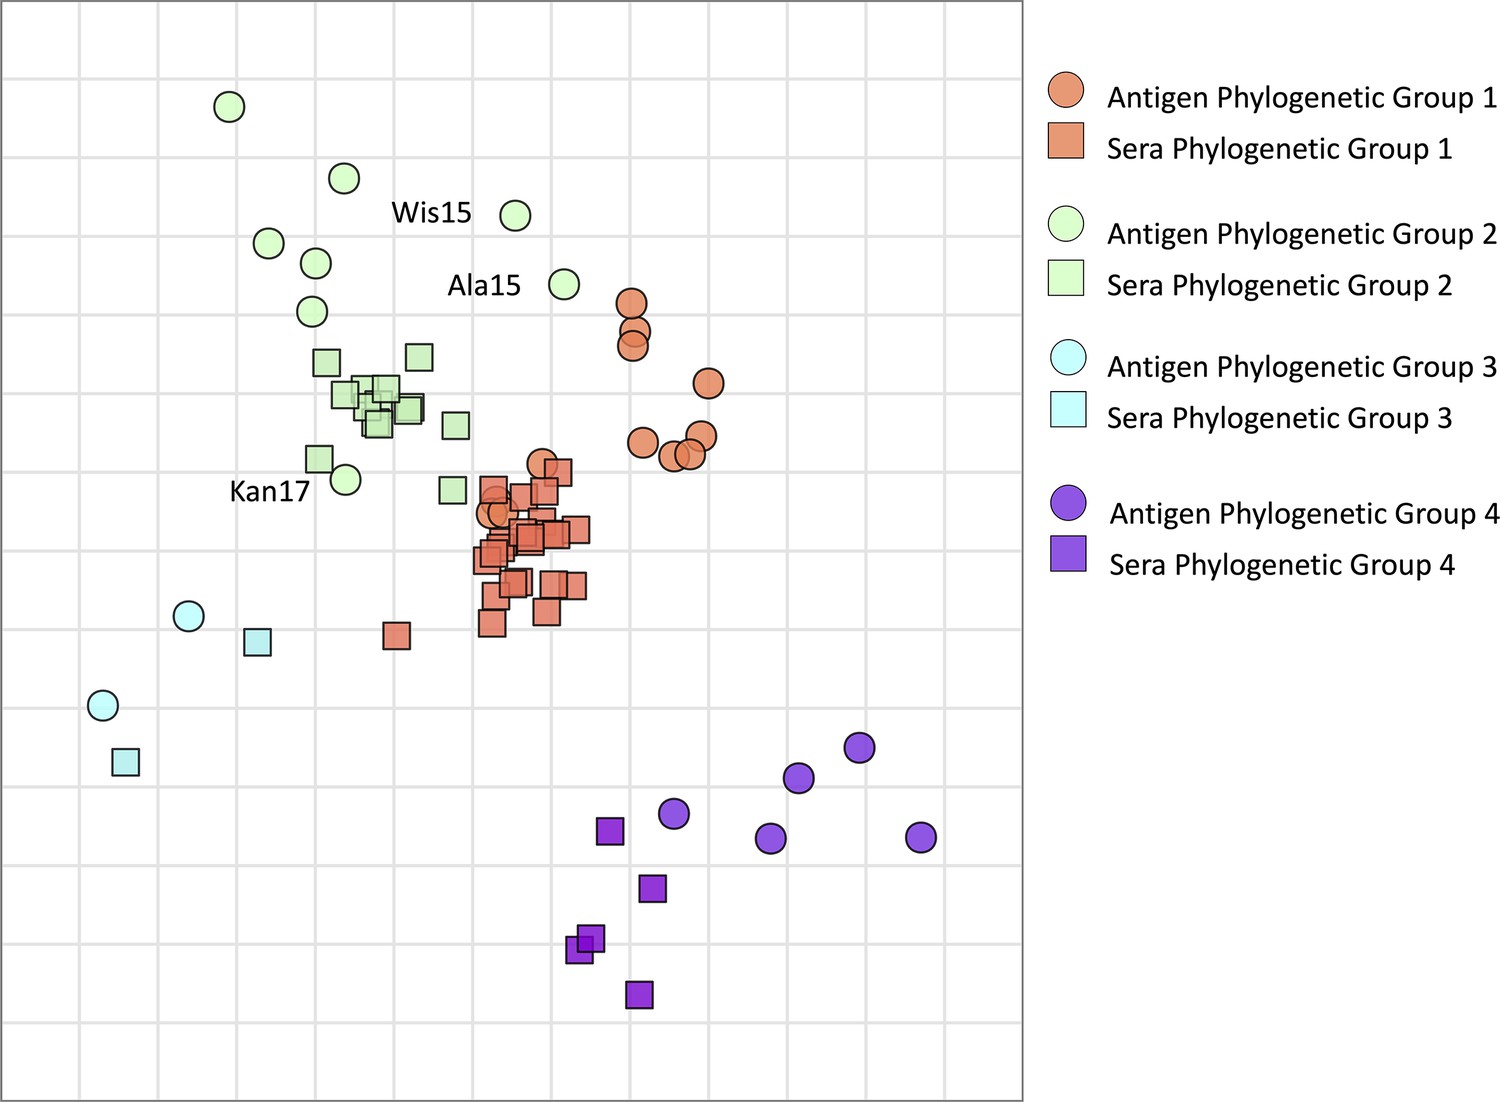
Antigenic map of N2 neuraminidases (NAs).
Antigen and sera distances are represented in the graph and coloured according to distinct phylogenetic groups. The spacing between grid lines is 1 unit of antigenic distance corresponding to a twofold dilution of immune serum in the NA inhibition (NAI) assay.
-
Figure 2—figure supplement 3—source code 1
Antigenic map generation and quality control.
- https://cdn.elifesciences.org/articles/90782/elife-90782-fig2-figsupp3-code1-v1.zip
Figure 2—figure supplement 4
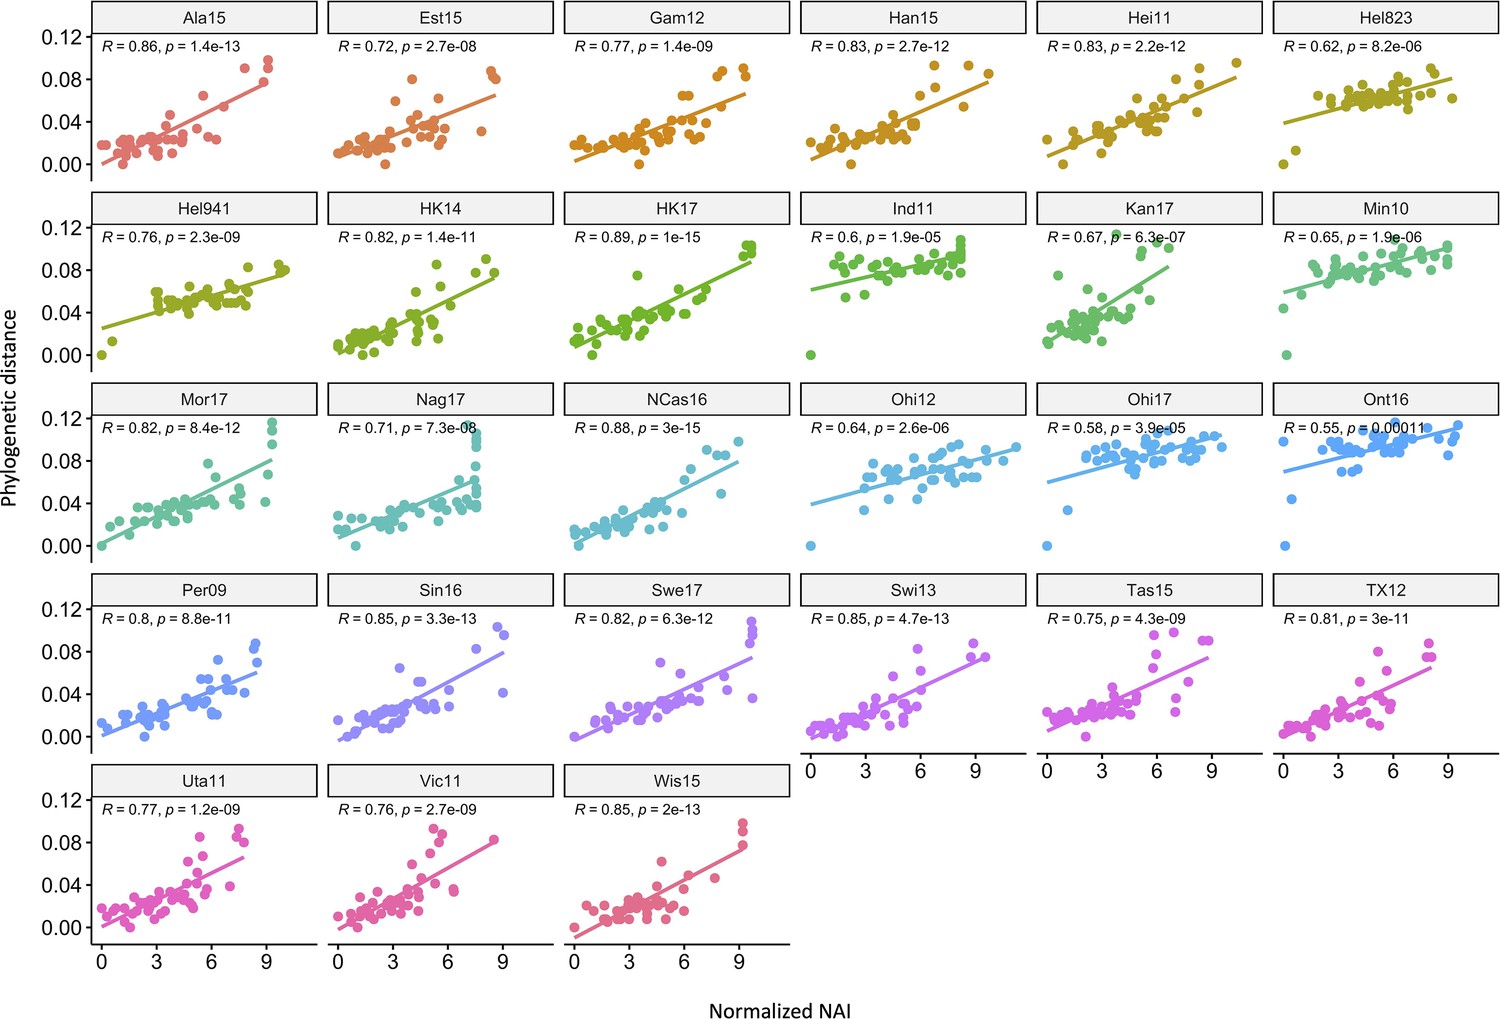
Correlation of neuraminidase inhibition (NAI) fold reduction and phylogenetic relatedness.
The scatter plots show the phylogenetic distances (y-axis) and normalised NAI as fold reduction relative to the maximal inhibition [log2 (max NAI/NAI)] (x-axis). Each graph represents one of the 27 H6N2s that were tested.
Figure 2—figure supplement 5
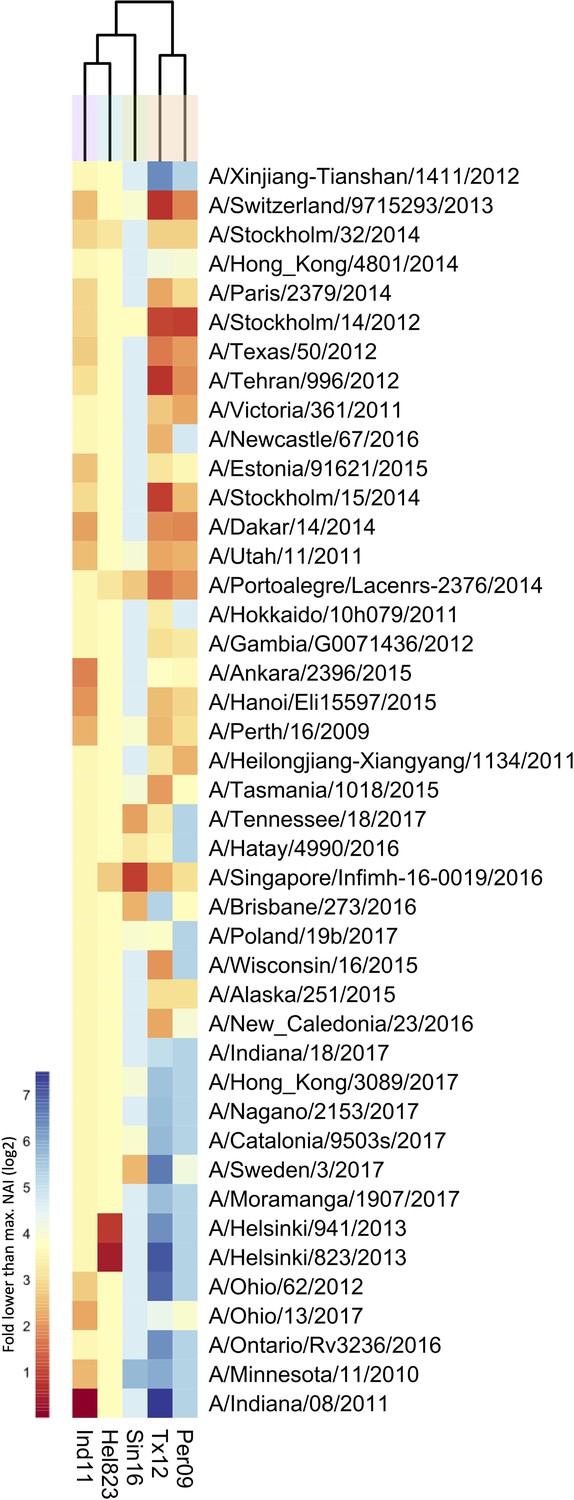
Breadth of N2 inhibition of sera from ferrets primed by H1N2 infection only.
43 Heatmap representing the average of normalised neuraminidase inhibition per H6N2 [log2 (max NAI/NAI)] determined in ferret sera 2 weeks after infection. The red-to-blue scale indicates the fold reduction compared to the max NAI observed in enzyme-linked lectin assay (ELLA) against the H6N2 reassortants (listed at the bottom). Unweighted pair group method with arithmetic mean (UPGMA) clustering of H6N2 inhibition profiles are shown on top of the heatmap and coloured according to the phylogenetic groups.
Figure 2—figure supplement 6
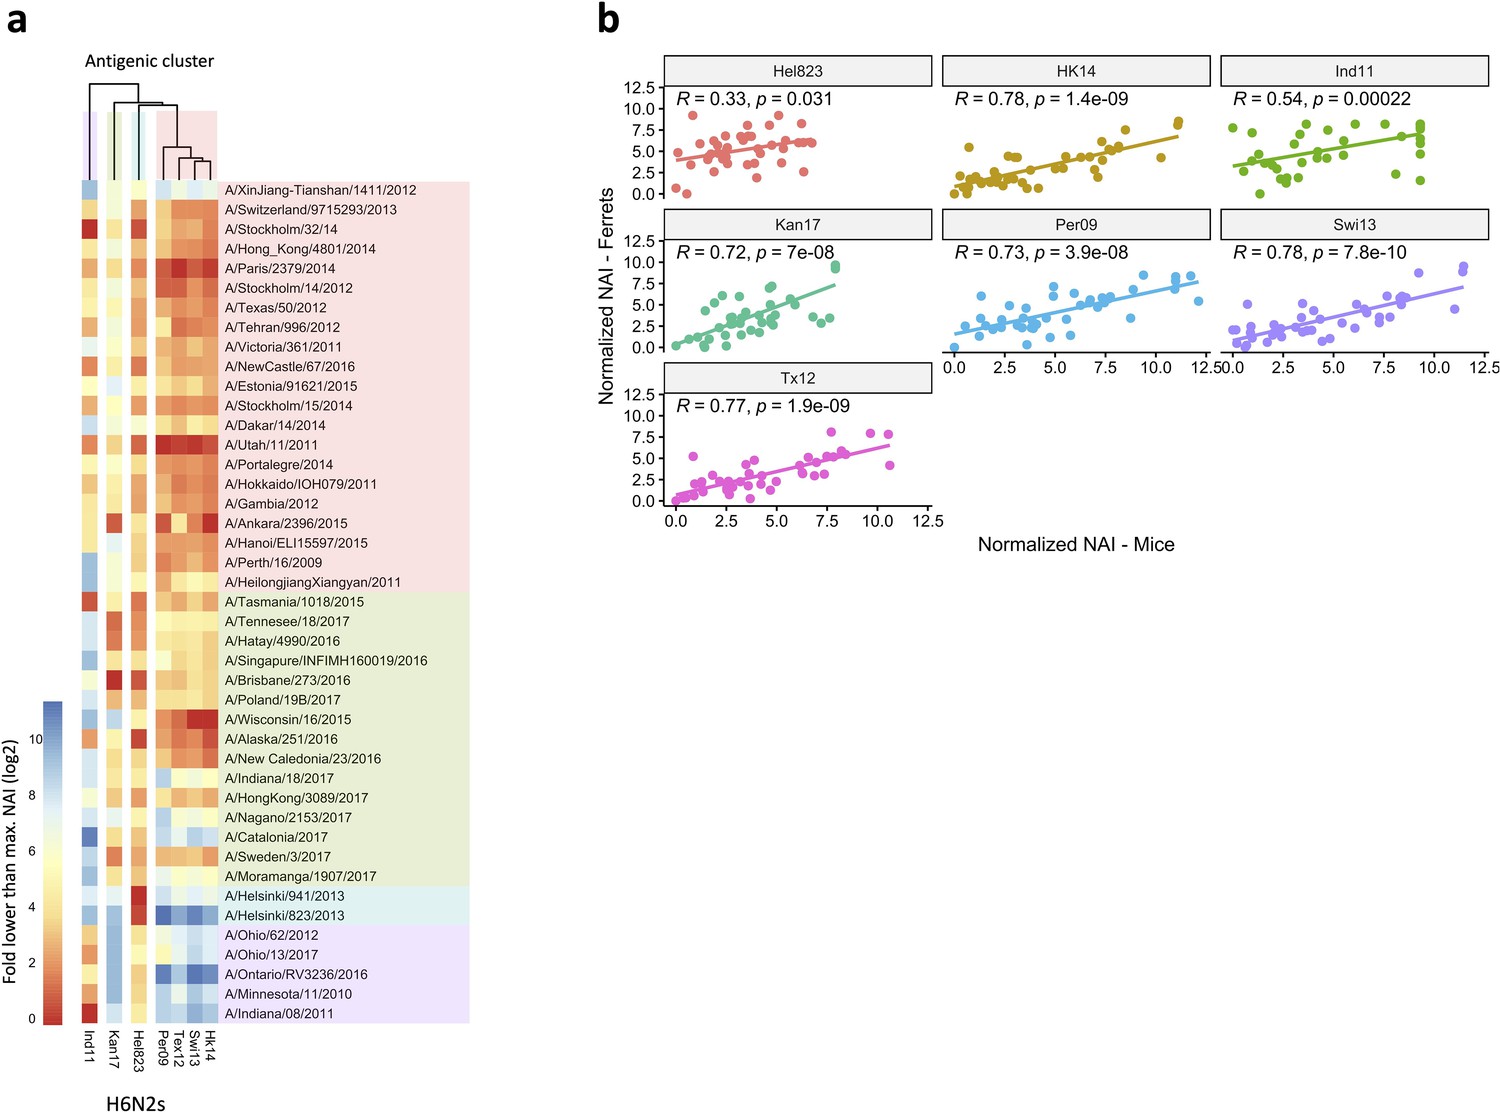
Breadth of N2 inhibition is confirmed in mouse sera.
43 Heatmap representing the average of normalised neuraminidase inhibition per H6N2 [log2 (max NAI/NAI)] determined in mice sera after the boost (listed on the right). The red-to-blue scale indicates low-to-high NAI observed in enzyme-linked lectin assay (ELLA) against the H6N2 reassortants (listed at the bottom). Unweighted pair group method with arithmetic mean (UPGMA) clustering of H6N2 inhibition profiles are shown on top of the heatmap and coloured according to the phylogenetic groups. (b) Correlation of NAI between mice and ferrets. Scatter plot shows the normalised NAI as fold reduction from maximal inhibition [log2 (max NAI/NAI)] from ferrets (y-axis) versus mice (x-axis). The 7 H6N2s tested are indicated in the graphs. NAI, neuraminidase inhibition.
Figure 3 with 3 supplements
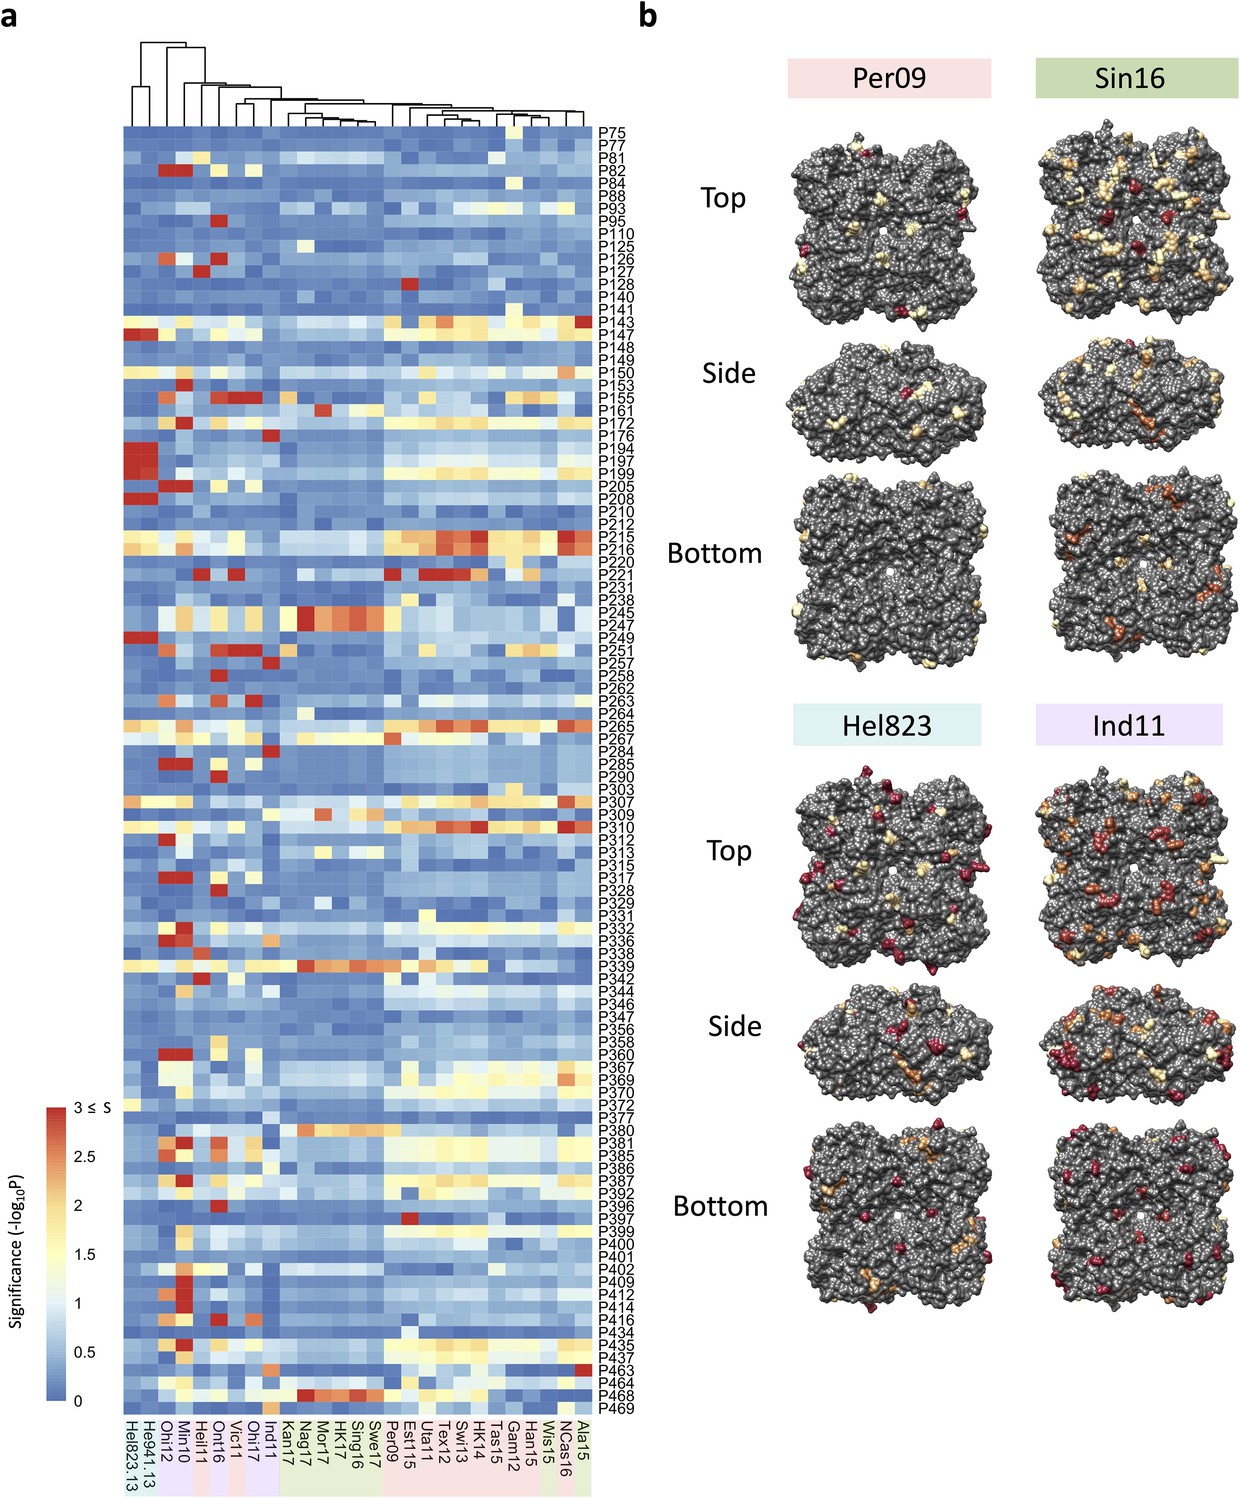
Association analysis reveals impact of amino acid mutations on neuraminidase inhibition (NAI).
(a) Association study performed for each H6N2 virus (listed at the bottom) to determine the probability of each variable amino acid (listed on the right) present in the panel of 43 NAs to impact the NAI. The red-to-blue scale represents significance values (S=-log10p) associated with each amino acid substitution. The dark red in the colour scale represent all values that are equal or higher than 3 (corresponding to p-values ≤ 0.001). The colour shades on the bottom side indicate the distinct phylogenetic groups. (b) The significant values (p<0.05) were represented on the surface of N2 tetramer (PDB accession number 4H53) for one representative strain of each phylogenetic group with a yellow to red scale of significance (-log10p).
Figure 3—figure supplement 1
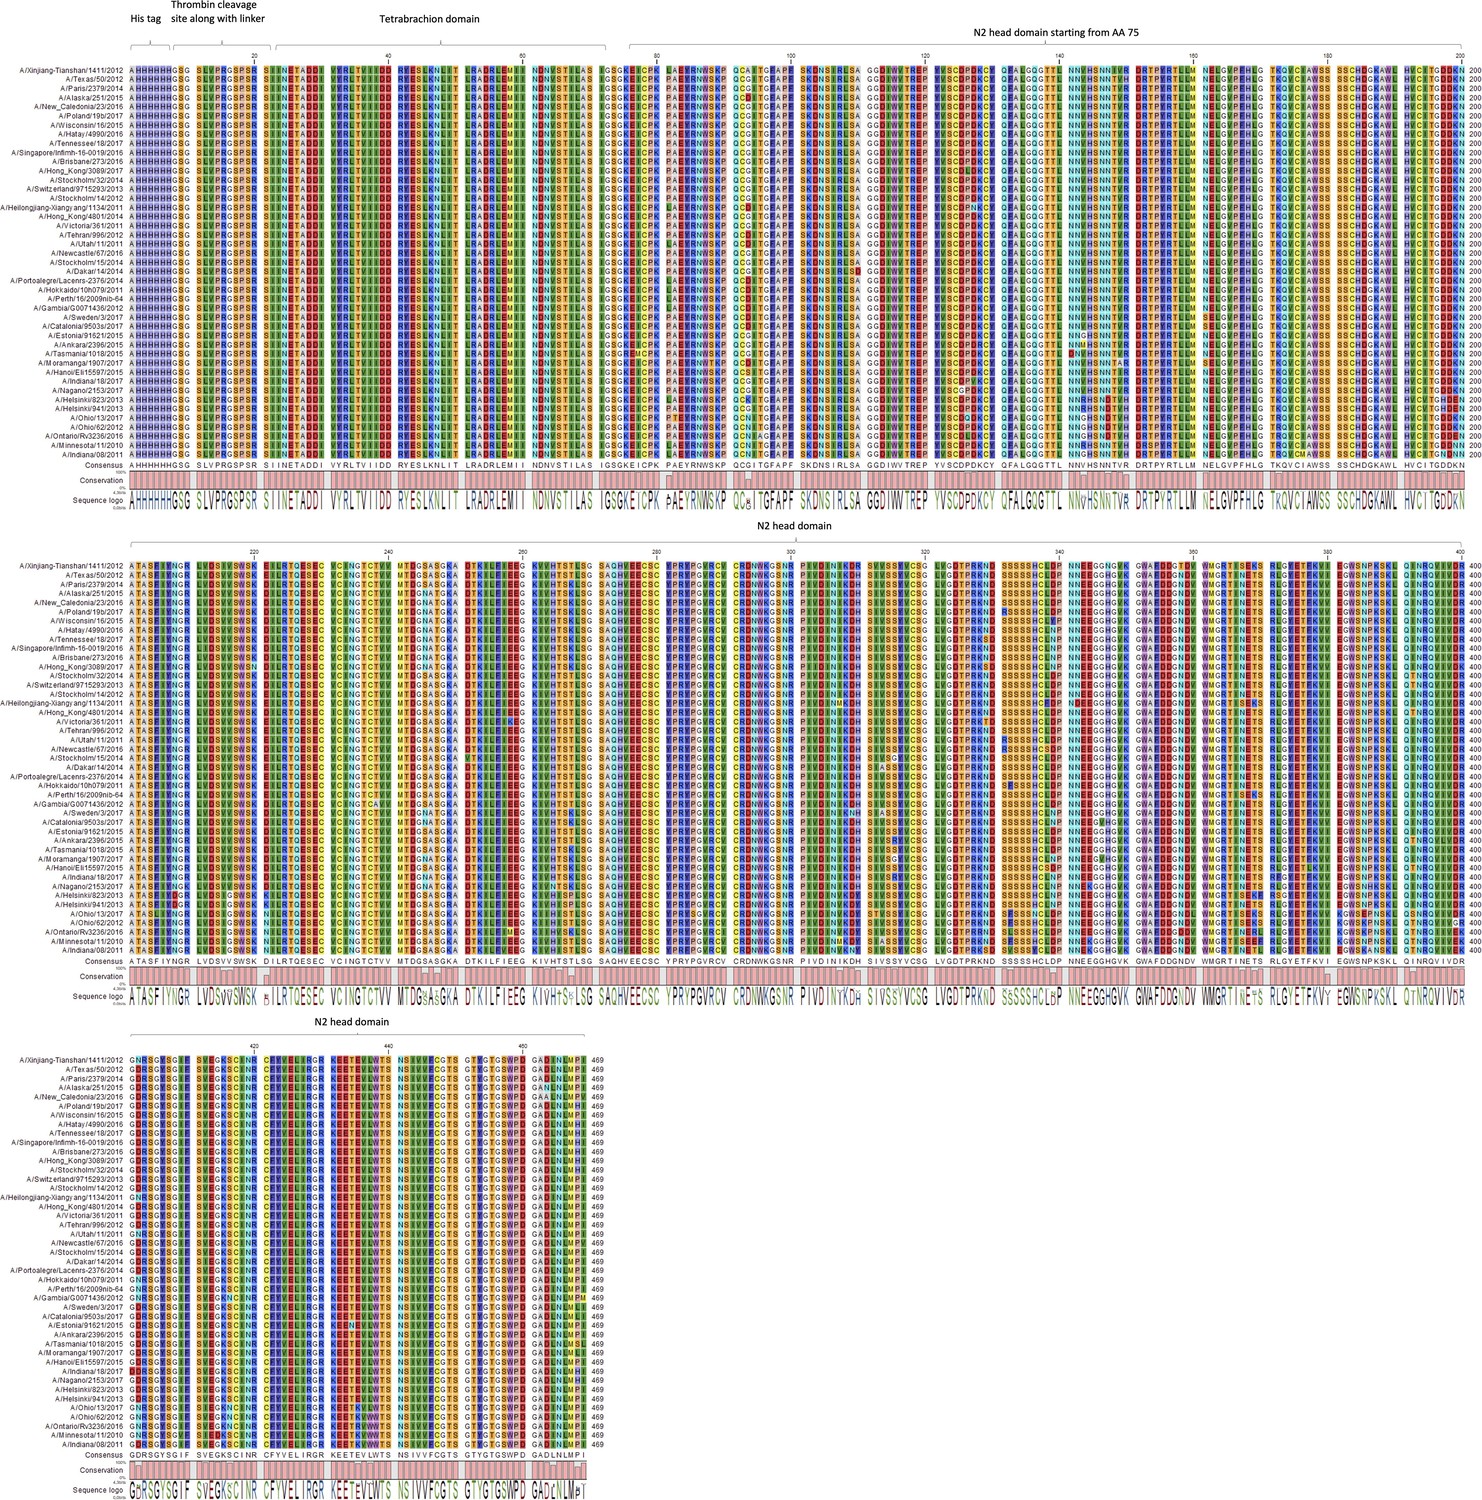
Protein sequence alignment of N2 NACHO panel used for immunisation.
The sequence of recombinant neuraminidase (NA) that was used for boosting ferrets or to prime/boost BALB/c mice was aligned starting from the His-tag, tetrabrachion, and followed by NA head domain, as depicted on top of the sequences.
Figure 3—figure supplement 2
Geometrical distribution of amino acid substitutions in the N2 structure.
The surface and ribbon representations indicate the geometrical distribution of the amino acid substitutions that are present in the panel of 43 N2 neuraminidases (NAs) used as immunogens in the study. Substitutions are highlighted in red on the model structure of N2 from H2N2 (A/RI/5+/1957, PBD 4H53).
Figure 3—figure supplement 3
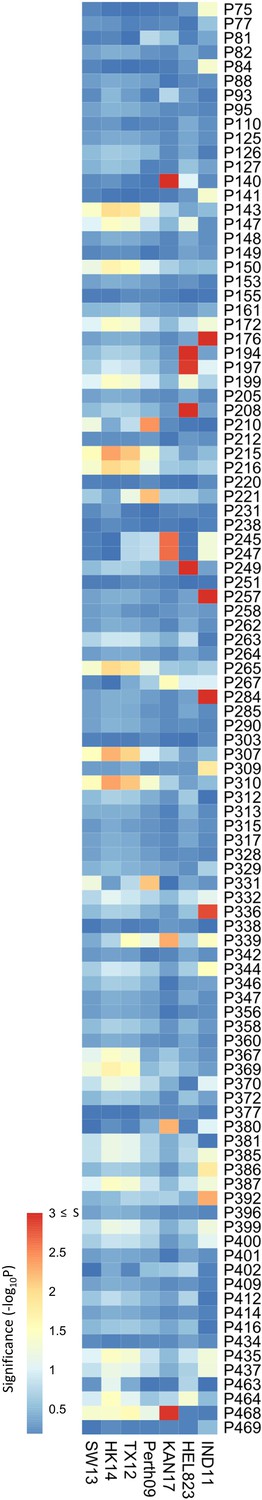
Association study was performed on data obtained from mouse sera.
Association study performed for each H6N2 virus (listed at the bottom) to determine the probability of each variable amino acid (listed on the right) present in the panel of 43 neuraminidases (NAs) to impact NA inhibition (NAI). The red-to-blue scale represents significance values (-log10p) associated with each variable amino acid.
Figure 4 with 1 supplement
Residues close to the catalytic pocket are more likely to impact neuraminidase inhibition (NAI).
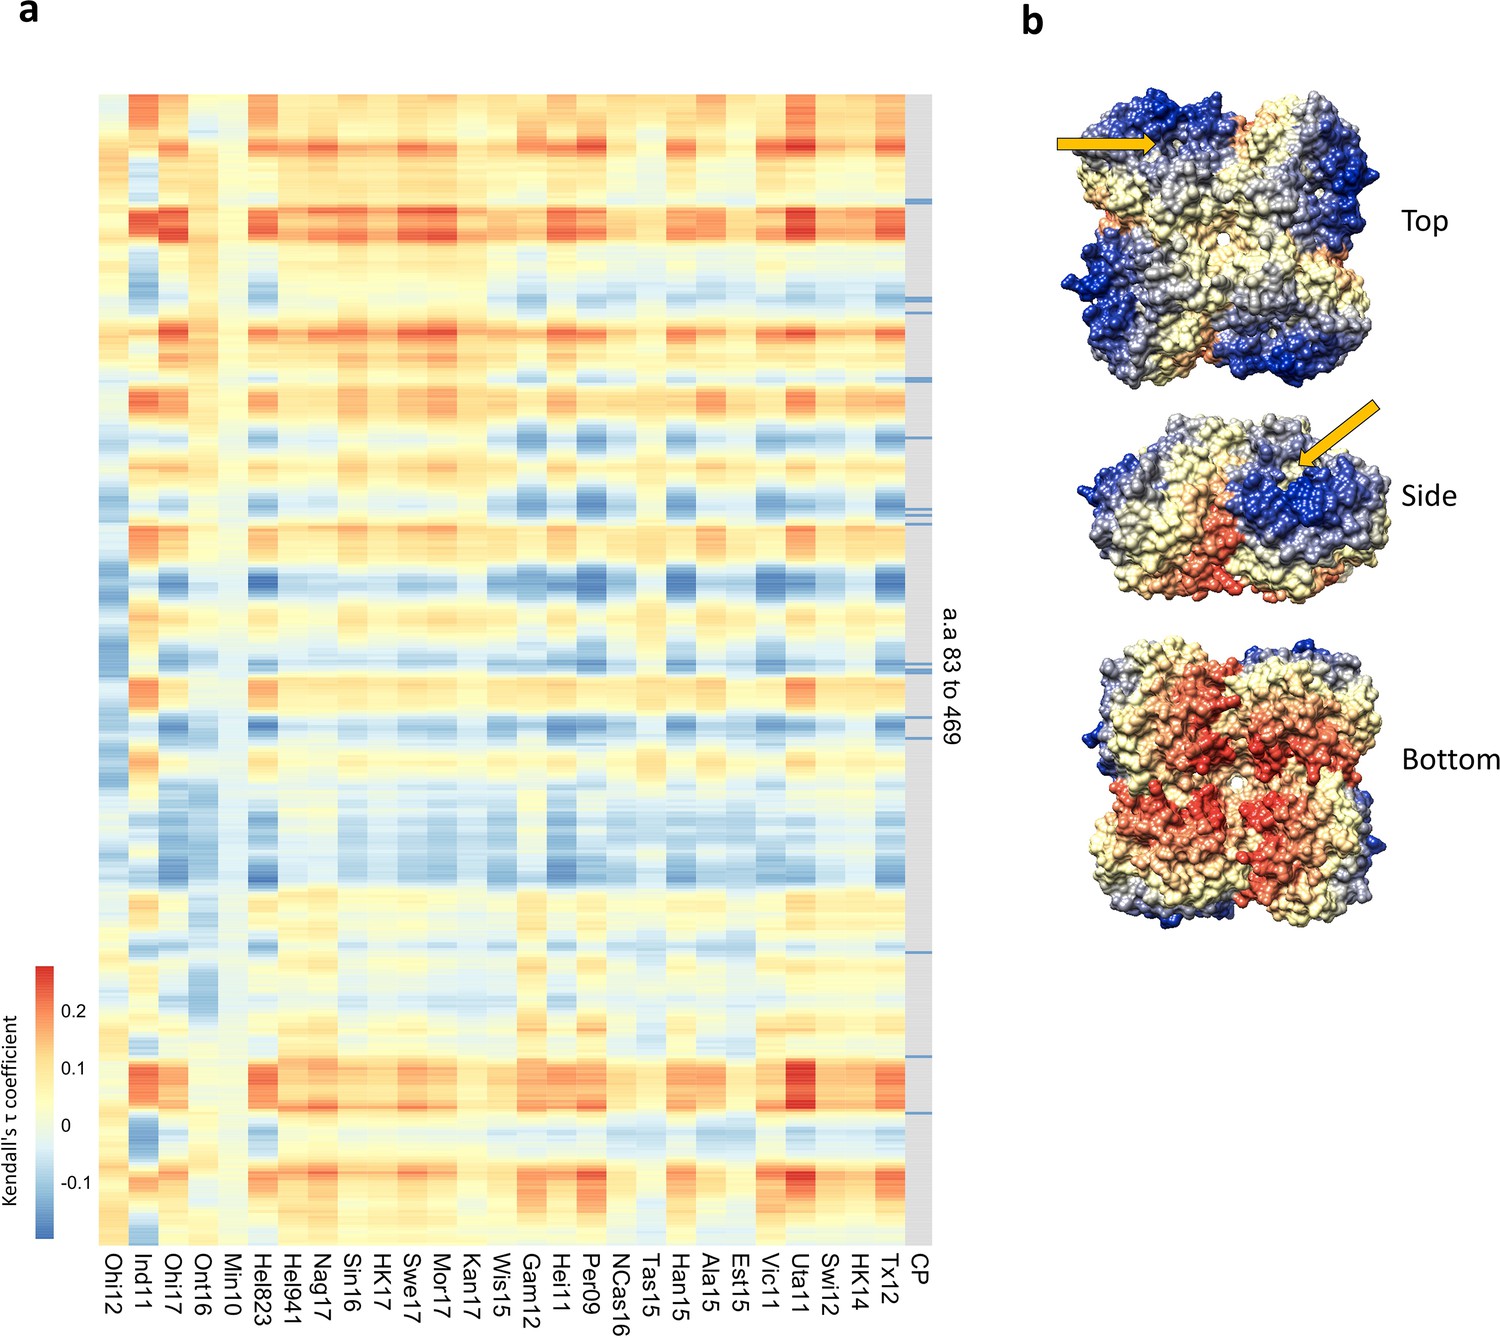
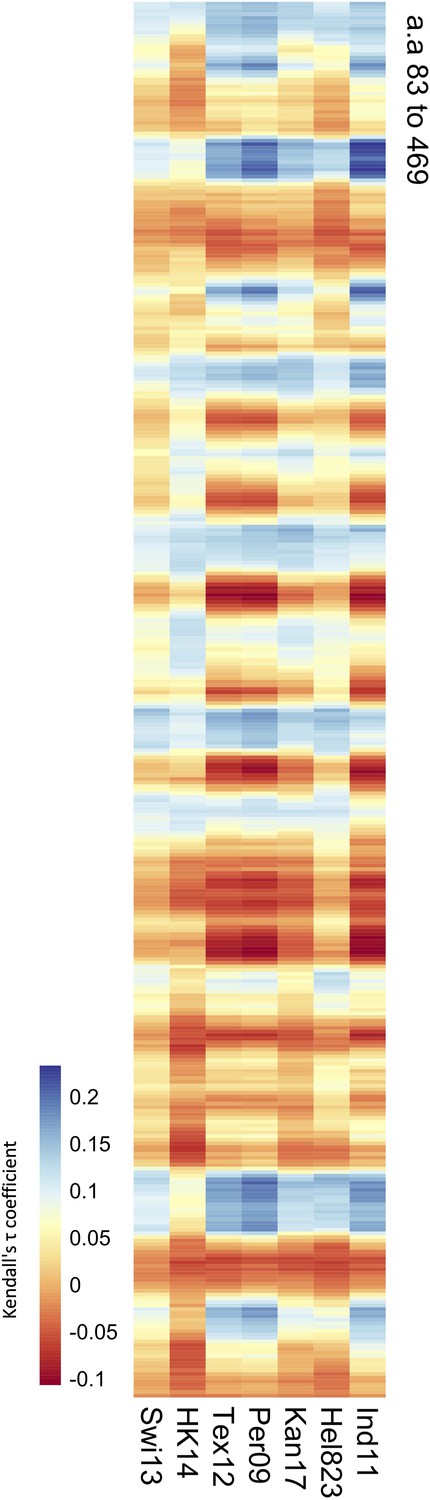
(a) Significance values (102 variable amino acids) obtained from the association study were correlated to the distance between every amino acid and each of the variable amino acids in the NA structure. The red-to-blue scale represents the Tau values obtained in the Kendall correlation. Amino acids 83–469 are shown from top to bottom in the heatmap. The H6N2s used in the NAI panel are listed at the bottom. The grey column indicates the residues that are part of the catalytic pocket (CP) that directly interact with the substrate (R118, D151, R152, R224, E276, R292, R371, and Y406) and the residues that play a key role in stabilising the catalytic site (E119, R156, W178, S179, D198, I222, E227, H274, E277, N294, and E425). (b) Tau values obtained from Tex12 H6N2 correlation are represented on the surface of the N2 structure of A/RI/5+/1957 (PBD 4H53), the arrow indicates the catalytic pocket in one NA protomer.
Figure 4—figure supplement 1
Correlation of values obtained from the mouse sera panel and amino acid distances.
Significance values (102 variable amino acids) obtained from the association study were correlated to the distance between every amino acid and each of the variable amino acids in the neuraminidase (NA) structure. The red-to-blue scale represents the Tau values obtained in the Kendall correlation. Amino acids 83–469 are shown from top to bottom of the heatmap. The H6N2s used in the NA inhibition (NAI) panel are listed at the bottom.
Figure 5
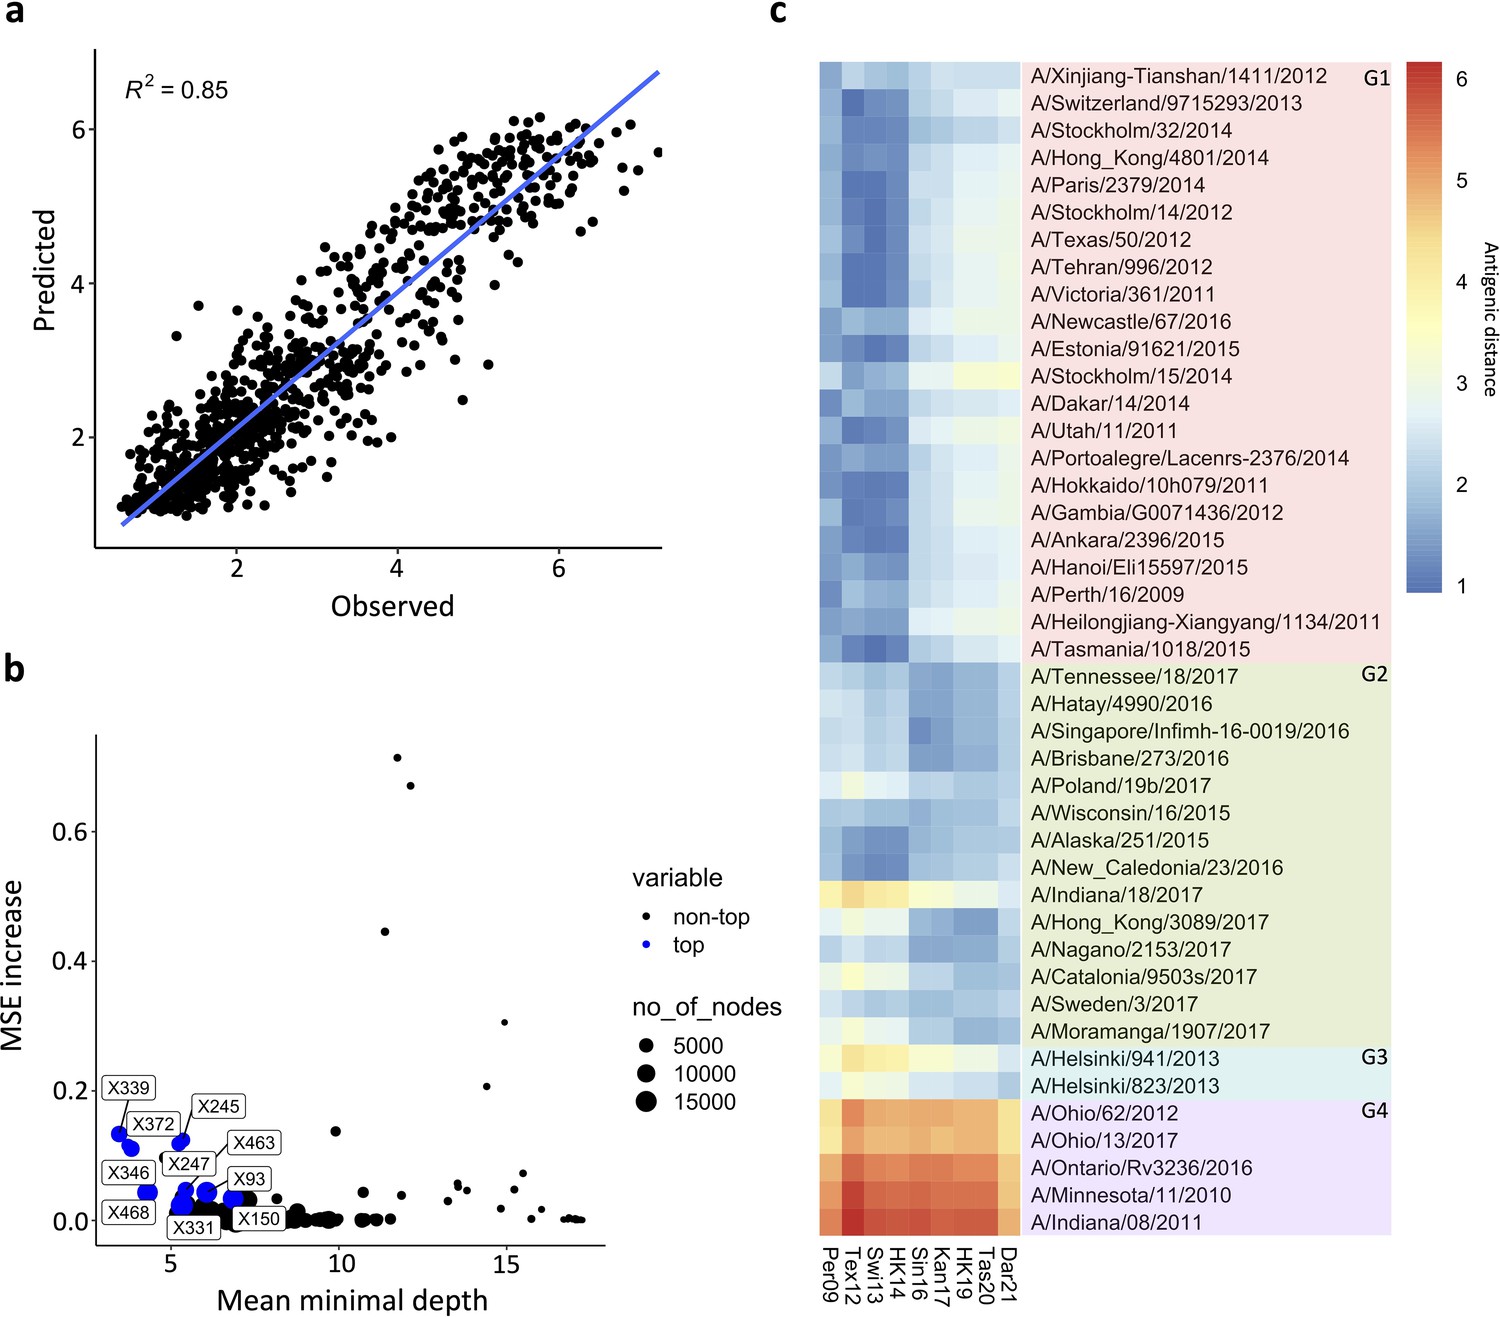
Prediction of N2 antigenicity based on machine learning.
(a) Predicted vs observed normalised neuraminidase inhibitions (NAIs) are shown. (b) Multi-way importance plot indicating the increase in mean standard error, the mean depth, and number of nodes. The top 10 most important amino acid changes are highlighted in blue and annotated with their position in the NA sequence. (c) 43 Heatmap indicates the predicted antigenic distances of N2s from recent H3N2 isolates (at the bottom of the heatmap) relative to the N2s that were used in the NAI breadth panel (listed vertically). The antigenic distances were calculated based on NA protein sequence.
-
Figure 5—source code 1
Random forest modeling.
- https://cdn.elifesciences.org/articles/90782/elife-90782-fig5-code1-v1.zip
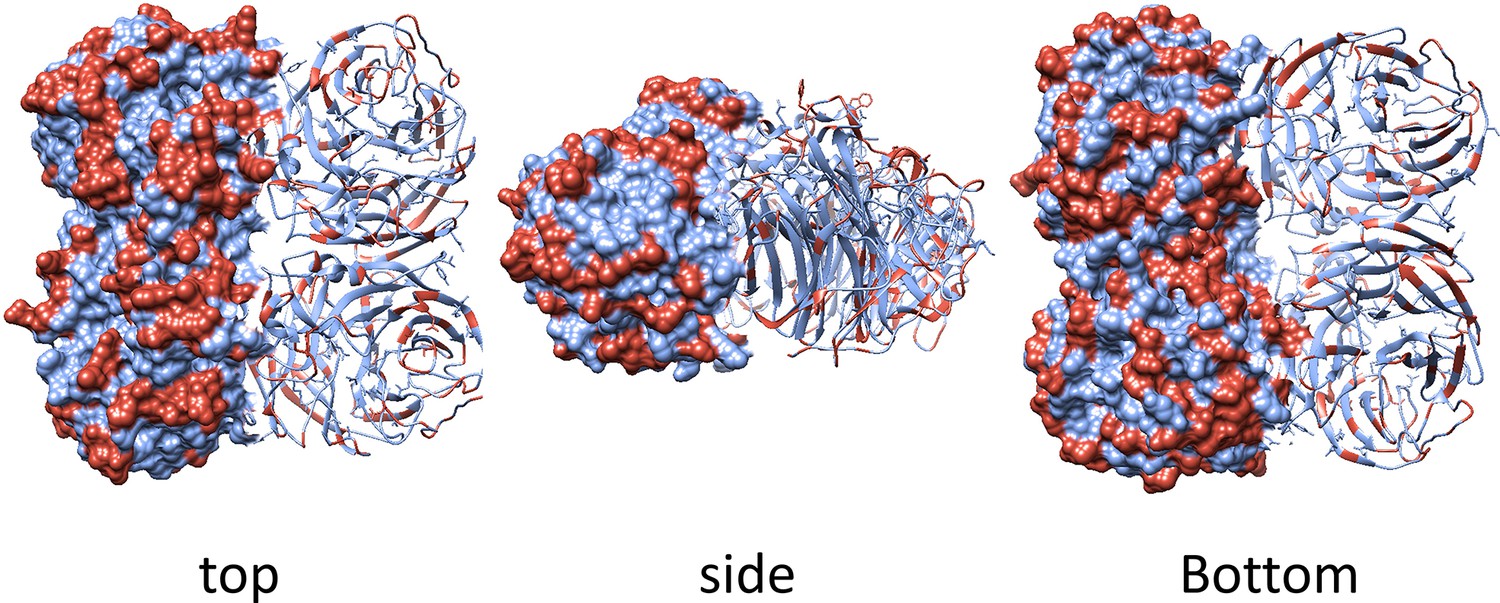
Author response image 1

The stress per point is presented in the heat map below.
Author response image 2
Author response image 3
Tables
Key resources table
| Reagent type (species) or resource | Designation | Source or reference | Identifiers | Additional information |
|---|---|---|---|---|
| Gene (influenza A) | NA | GISAID | EPI232655 | A/PERTH/ 16/2009 |
| Gene (influenza A) | NA | GISAID | EPI543762 | A/SWITZERLAND/97 15293/2013 |
| Gene (influenza A) | NA | GISAID | EPI993642 | A/TENNESSEE/ 18/2017 |
| Gene (influenza A) | NA | GISAID | EPI715819 | A/ANKARA/ 2396/2015 |
| Gene (influenza A) | NA | GISAID | EPI574238 | A/PARIS/2379/ 2014 |
| Gene (influenza A) | NA | GISAID | EPI369152 | A/STOCKHOLM/14/ 2012 |
| Gene (influenza A) | NA | GISAID | EPI892776 | A/BRISBANE/ 273/2016 |
| Gene (influenza A) | NA | GISAID | EPI1013098 | A/HATAY/4990/ 2016 |
| Gene (influenza A) | NA | GISAID | EPI1015697 | A/CATALONIA/9503S/2017 |
| Gene (influenza A) | NA | GISAID | EPI531449 | A/STOCKHOLM/ 15/2014 |
| Gene (influenza A) | NA | GISAID | EPI679413 | A/ALASKA/251/ 2015 |
| Gene (influenza A) | NA | GISAID | EPI630701 | A/ESTONIA/91621/ 2015 |
| Gene (influenza A) | NA | GISAID | EPI394905 | A/OHIO/62/2012 |
| Gene (influenza A) | NA | GISAID | EPI446773 | A/TEHRAN/ 996/2012 |
| Gene (influenza A) | NA | GISAID | EPI831629 | A/NEWCASTLE/ 67/2016 |
| Gene (influenza A) | NA | GISAID | EPI831647 | A/NEWCALEDONIA/23/ 2016 |
| Gene (influenza A) | NA | GISAID | EPI935704 | A/WISCONSIN/ 16/2015 |
| Gene (influenza A) | NA | GISAID | EPI981927 | A/INDIANA/ 18/2017 |
| Gene (influenza A) | NA | GISAID | EPI1055123 | A/NAGANO/ 2153/2017 |
| Gene (influenza A) | NA | GISAID | EPI408590 | A/XINJIANGTIANSHAN /1411/2012 |
| Gene (influenza A) | NA | GISAID | EPI330528 | A/HEILONGJIANGXIANGYANG /1134/2011 |
| Gene (influenza A) | NA | GISAID | EPI316206 | A/UTAH/11/2011 |
| Gene (influenza A) | NA | GISAID | EPI536339 | A/GAMBIA/ G0071436/2012 |
| Gene (influenza A) | NA | GISAID | EPI1036140 | A/POLAND/ 19B/2017 |
| Gene (influenza A) | NA | GISAID | EPI675974 | A/TASMANIA/ 1018/2015 |
| Gene (influenza A) | NA | GISAID | EPI539797 | A/DAKAR/14/ 2014 |
| Gene (influenza A) | NA | GISAID | EPI340631 | A/HOKKAIDO/ 10H079/2011 |
| Gene (influenza A) | NA | GISAID | EPI465399 | A/MINNESOTA/ 11/2010 |
| Gene (influenza A) | NA | GISAID | EPI956450 | A/HANOI/ ELI15597/2015 |
| Gene (influenza A) | NA | GISAID | EPI869121 | A/ONTARIO/ RV3236/2016 |
| Gene (influenza A) | NA | GISAID | EPI344404 | A/INDIANA/ 08/2011 |
| Gene (influenza A) | NA | GISAID | EPI558926 | A/STOCKHOLM/ 32/2014 |
| Gene (influenza A) | NA | GISAID | EPI104388 | A/HONGKONG/ 3089/2017 |
| Gene (influenza A) | NA | GISAID | EPI1056652 | A/OHIO/13/ 2017 |
| Gene (influenza A) | NA | GISAID | EPI489603 | A/HELSINKI/ 941/2013 |
| Gene (influenza A) | NA | GISAID | EPI489571 | A/HELSINKI/ 823/2013 |
| Gene (influenza A) | NA | GISAID | EPI1050862 | A/MORAMANGA/ 1907/2017 |
| Gene (influenza A) | NA | GISAID | EPI996522 | A/PORTOALEGRE/ LACENRS2376/2014 |
| Gene (influenza A) | NA | GISAID | EPI945994 | A/SWEDEN/3/2017 |
| Gene (influenza A) | NA | GISAID | EPI1047603 | A/SINGAPORE/ INFIMH160019/ 2016 |
| Gene (influenza A) | NA | GISAID | EPI377498 | A/TEXAS/50/2012 |
| Gene (influenza A) | NA | GISAID | EPI1026710 | A/HONGKONG /4801/2014 |
| Gene (influenza A) | NA | GISAID | EPI551805 | A/VICTORIA/ 361/2011 |
| Gene (influenza A) | HA | GISAID | EPI251808 | A/mallard/Sweden/ 81/2002 |
| Cell line (Canis lupus) | MDCK | ATCC | CCL-34 | |
| Cell line (Homo sapiens) | 293FT | Thermo Fisher Scientific | R70007 | |
| Biological sample (Mus musculus) | Sera | This paper | Harvested from immunised mice | |
| Biological sample (Mustela furo) | Sera | This paper | Harvested from infected/immunised ferrets | |
| Antibody | Anti-mouse IgG-HRP (Goat polyclonal) | GE Healthcare | NA931-1ml | (1:5000) |
| Antibody | Anti-ferret IgG-HRP (Goat polyclonal) | Abcam | 112770 | (1:100,000) |
| Chemical compound, drug | 3,3’,5,5’-Tetramethylbenzidine | BD | 555214 | |
| Chemical compound, drug | Fetuin | Sigma | F3385 | |
| Chemical compound, drug | PNA-HRP | Sigma | L61135-1MG | |
| Chemical compound, drug | 4-Methylumbelliferyl-α-d-N-acetylneuraminic acid | Sigma | M8639 | |
| Other | Pierce nickel-coated plates | Thermo Fisher Scientific | 15442 | See Materials and methods: ELISA |
Additional files
-
Supplementary file 1
Specific activity of the recombinant NACHOs.
- https://cdn.elifesciences.org/articles/90782/elife-90782-supp1-v1.docx
-
Supplementary file 2
H6N2 reassortant viruses used in the enzyme-linked lectin assay (ELLA) assay.
- https://cdn.elifesciences.org/articles/90782/elife-90782-supp2-v1.docx
-
Supplementary file 3
Neuraminidase inhibition (NAI) titers against H6N2 viruses of ferret sera obtained after the boost.
- https://cdn.elifesciences.org/articles/90782/elife-90782-supp3-v1.docx
-
MDAR checklist
- https://cdn.elifesciences.org/articles/90782/elife-90782-mdarchecklist1-v1.docx
Download links
A two-part list of links to download the article, or parts of the article, in various formats.
Downloads (link to download the article as PDF)
Open citations (links to open the citations from this article in various online reference manager services)
Cite this article (links to download the citations from this article in formats compatible with various reference manager tools)
The antigenic landscape of human influenza N2 neuraminidases from 2009 until 2017
eLife 12:RP90782.
https://doi.org/10.7554/eLife.90782.4


