Modeling corticotroph deficiency with pituitary organoids supports the functional role of NFKB2 in human pituitary differentiation
- Aix-Marseille University, INSERM, UMR1251, Marseille Medical Genetics, Institut MarMaRa, France
- Hanoi Medical University Hospital, Viet Nam
- Aix-Marseille University, CNRS, UMR7051, Institut de NeuroPhysiopathologie, France
- Aix-Marseille University, APHM, INSERM, MMG, Laboratory of Molecular Biology, La Conception Hospital, Institut MarMaRa, France
- Aix Marseille University, APHM, INSERM, MMG, Department of Endocrinology, La Conception Hospital, Institut MarMaRa, France
Figures
Figure 1 with 2 supplements
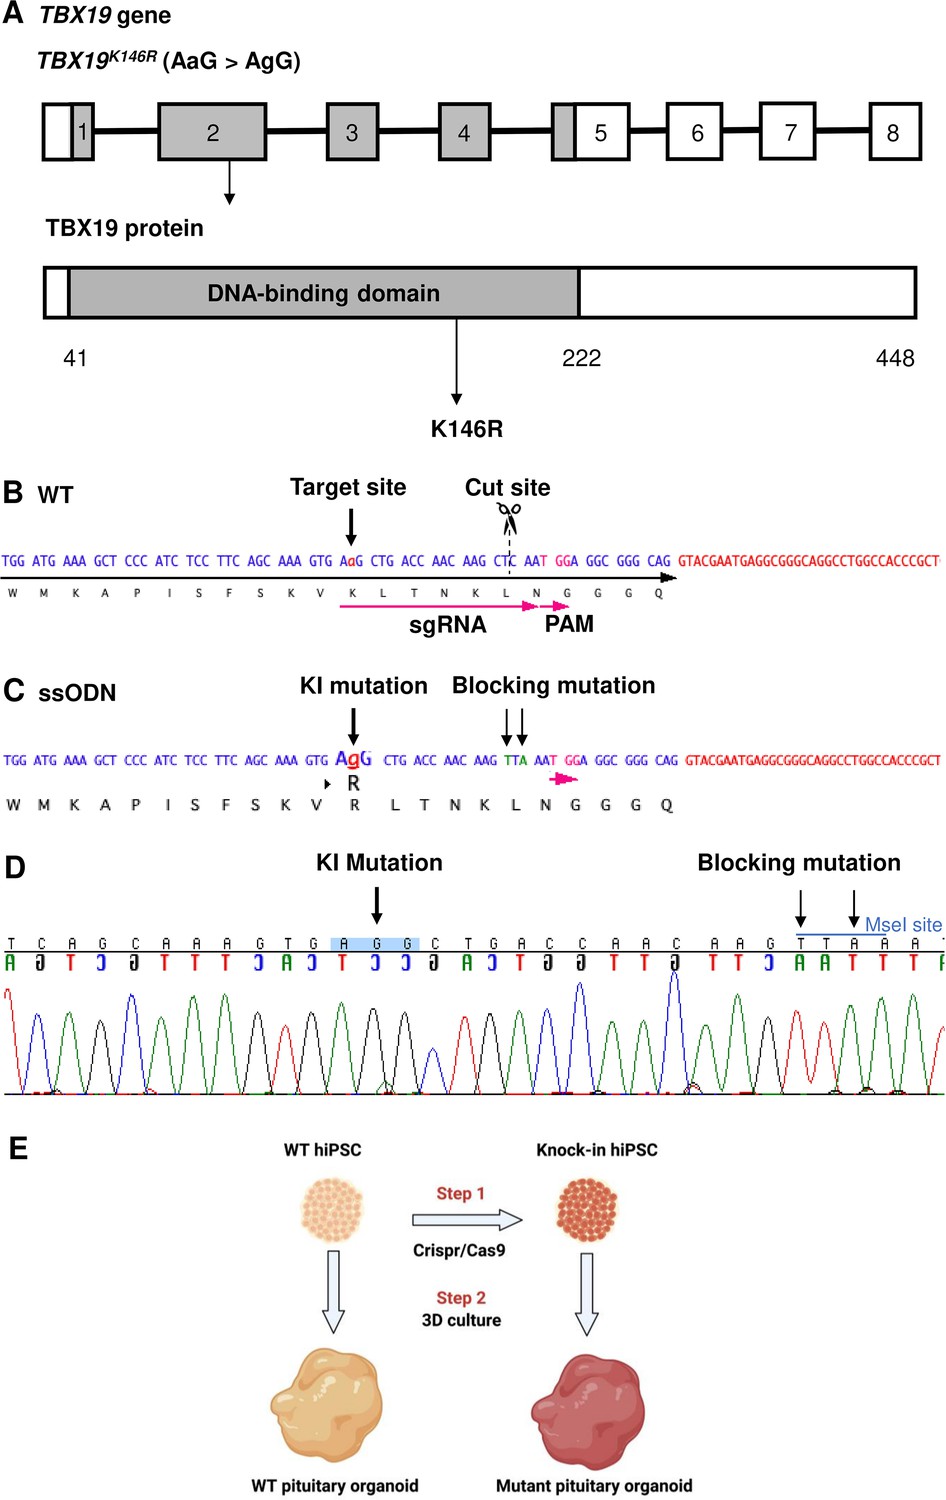
Design of single guide RNA (sgRNA) and single-stranded oligo DNA nucleotides (ssODN) to edit in the TBX19K146R mutation.
(A) Illustration of the TBX19 gene (HGNC: 11596; ENSEMBL: ENSG00000143178; Human GRCh38) and TBX19 protein. (B) Wild-type (WT) sequence containing target site, cut site, target, and protospacer-adjacent motif (PAM) sequences. (C) ssODN design to edit in a missense K146R mutant of TBX19 using CRISPR/Cas9. (D) Sequence analysis of a TBX19 KI human induced pluripotent stem cell (hiPSC) clone 63 obtained by Sanger sequencing after screening by cleaved amplified polymorphic sequences (CAPS). This clone was subsequently used in this work to differentiate into pituitary organoids (see below). (E) Summary of our strategy procedure. Step 1: Production of the knock-in hiPSC lines by CRISPR/Cas9 genome editing. Step 2: Differentiation into pituitary organoids from mutant hiPSC lines in parallel with the isogenic WT line using 3D culture, followed by the comparison of the development of organoids between the two groups.
Figure 1—figure supplement 1
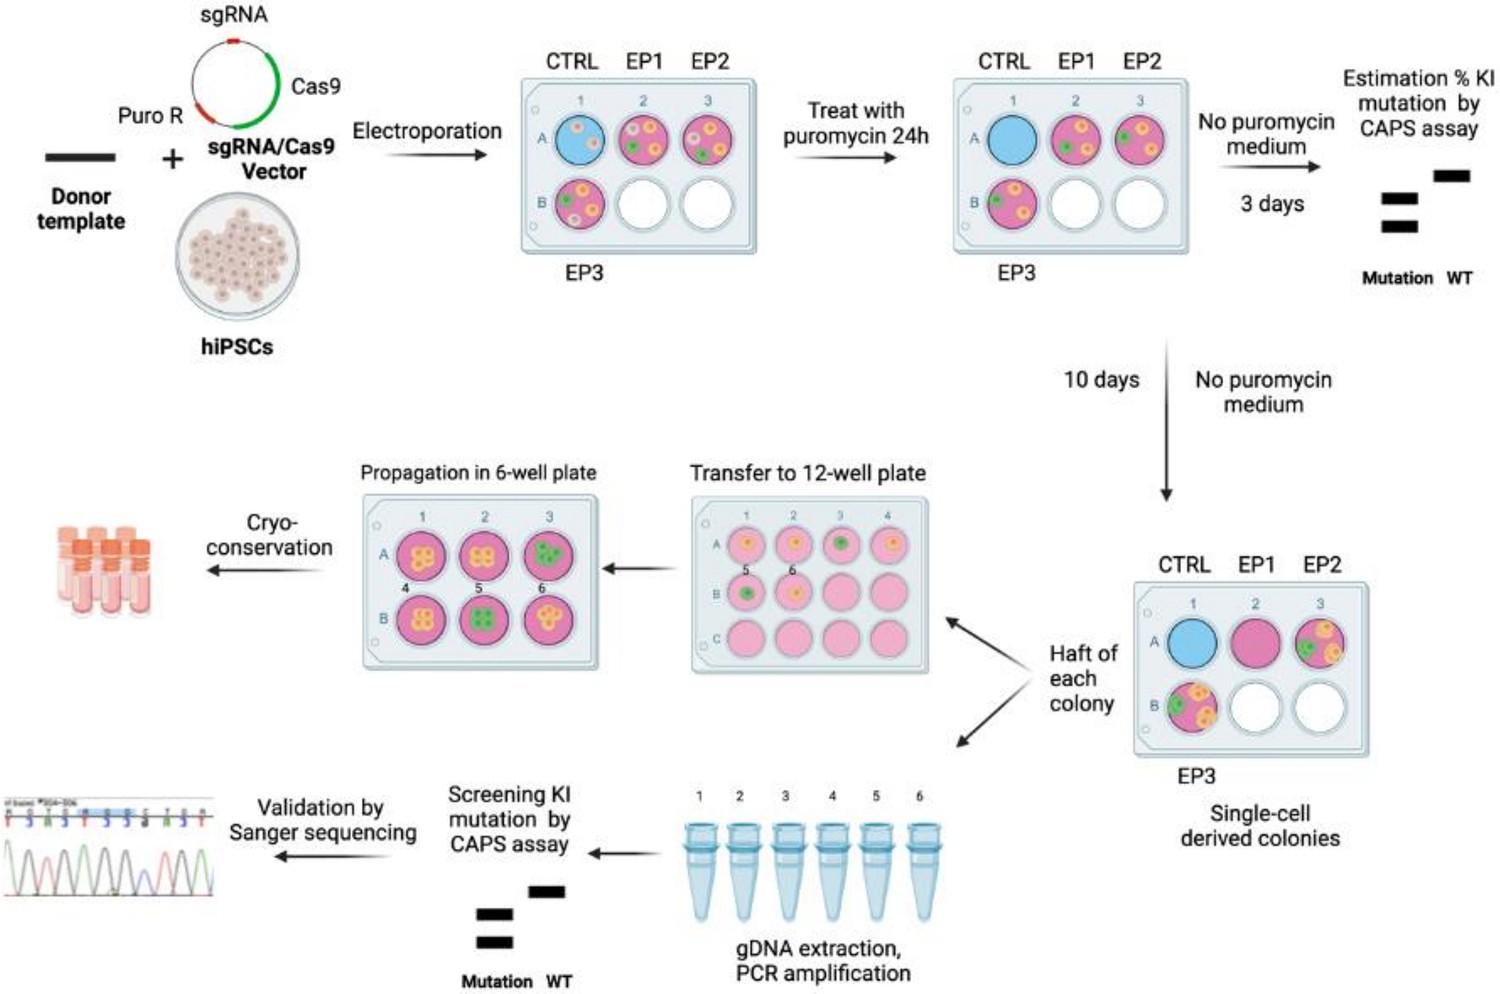
Summary of the key steps of CRISPR/Cas9-mediated genome knock-in editing in human induced pluripotent stem cell (hiPSC).
The appropriate CRISPR/Cas9 vector and single-stranded oligo DNA nucleotides (ssODN) were introduced in hiPSC by electroporation. Resistant cells were selected by puromycin for 24 hr. Percentage of mutants was estimated by a CAPS assay. Mutant cells were amplified and manually picked after 10 d. Half of each clonal colony was used for screening and verified by Sanger sequencing. The other half was used for amplification and then stocked by cryo-conservation. Non-edited cells (in gray), edited cells without desired mutations (in yellow), and edited cells with desired mutations (in green) are depicted. sgRNA: single guide RNA; puro R: puromycin resistant sequence; CTRL: control; EP1, EP2, EP3: three wells containing hiPSC electroporated with the vectors and donor template; CAPS: cleaved amplified polymorphic sequences; WT: wild-type; KI: knock-in.
Figure 1—figure supplement 2
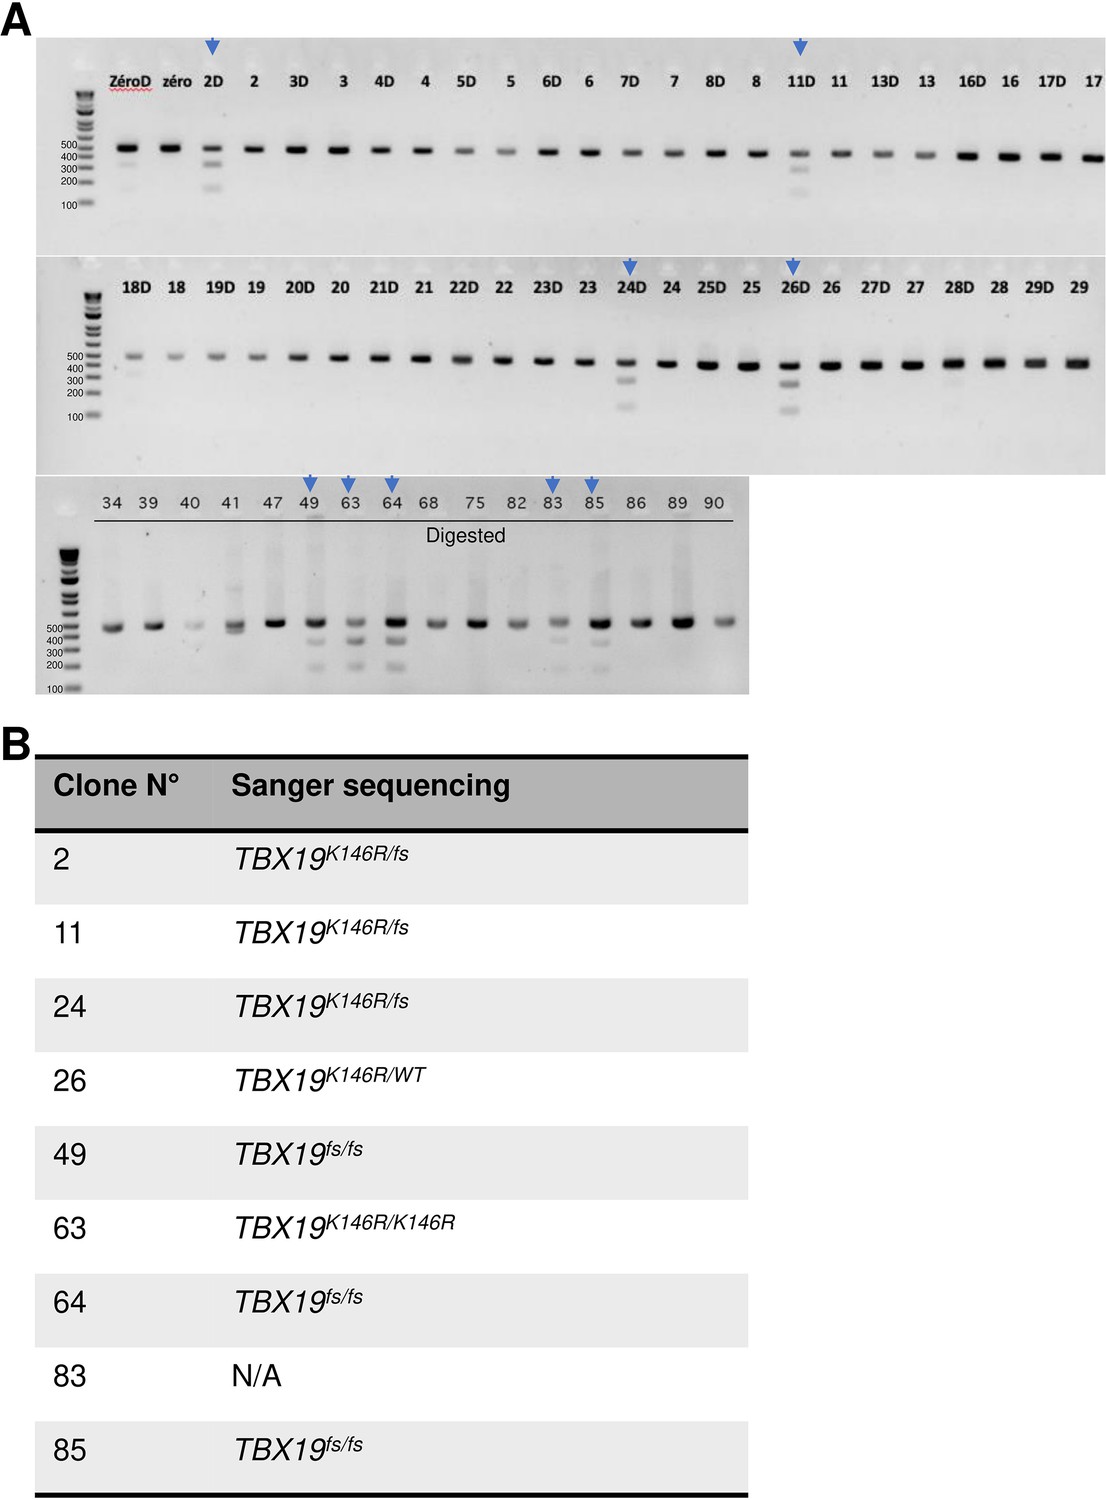
Results of cleaved amplified polymorphic sequences (CAPS) assay and Sanger sequencing analysis for editing TBX19 mutation.
(A) CAPS assay with MseI restriction enzyme in human induced pluripotent stem cell (hiPSC) population (zero) on day 3 post-transfection and screening individual colony. wild-type (WT) (472 bp band); Blocking mutant digested (D, 2 bands at 314 bp and 158 bp). Positif clones which had three bands (marked by a blue arrow) were then confirmed by Sanger sequencing. (B) Sanger sequencing analysis of positive clones. There was one clone (# 63) homozygous TBX19K146R/K146R. There were heterozygous TBX19K146R/WT, TBX19K146R/fs, and TBX19fs/fs. Frameshift (fs). N/A: not available.
-
Figure 1—figure supplement 2—source data 1
A pdf file describing modifications of original pictures used in Figure 1—figure supplement 2.
- https://cdn.elifesciences.org/articles/90875/elife-90875-fig1-figsupp2-data1-v1.zip
-
Figure 1—figure supplement 2—source data 2
Three original pictures used in Figure 1—figure supplement 2.
- https://cdn.elifesciences.org/articles/90875/elife-90875-fig1-figsupp2-data2-v1.zip
Figure 2 with 1 supplement
Time course of organoid growth and gene expression in wild-type (WT) and TBX19 KI organoids.
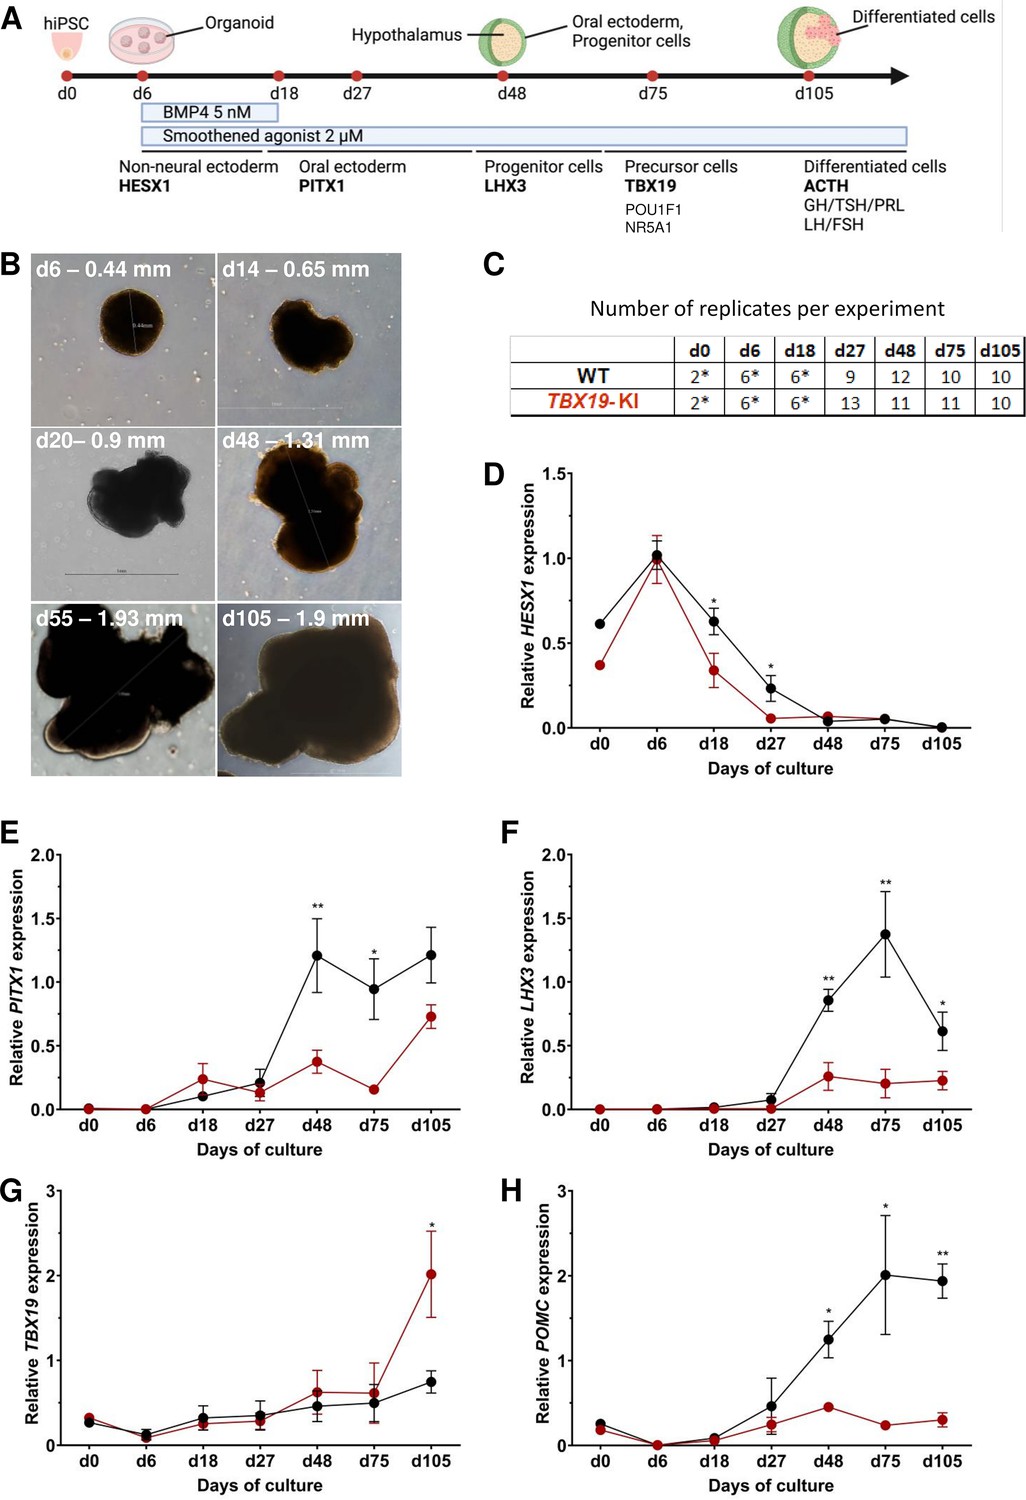
(A) Culture protocol and outline to generate pituitary organoids in three-dimensional (3D) culture from human induced pluripotent stem cell (hiPSC). Organoids were collected at days (d) 0, 6, 18, 27, 48, 75, and 105 during differentiation to analyze. (B) Brightfield microscopy views of WT organoid examples at different time points throughout differentiation. Scale bars are indicated in each image. (C) Number of replicates per time point and per genotype in experiments depicted in the following graphs. Asterisks indicate that 7–8 organoids were grouped for each sample. For other points, each sample consists of a single organoid. (D–H) Relative quantification (RQ) mRNA expression analysis for key markers of pituitary organoids during differentiation: WT (in black line) and TBX19 KI organoids (in red line). Relative quantification of each target gene was obtained by the 2-ΔΔCt method from qRT-PCR results (see Methods). Data show means ± standard error of the mean (SEM, Mann-Whitney t-test [unpaired, two-tailed, nonparametric]). p<0.05 (*), p<0.01 (**). (D) Relative quantification of HESX1 expression, the earliest pituitary placode marker assessed. The expression of HESX1 is significantly downregulated in TBX19 KI organoids vs. WT at d18 and d27. (E) Relative quantification expression of PITX1, a pituitary progenitor marker. PITX1 was significantly downregulated in TBX19 KI organoids by d48 and d75. (F) Relative quantification expression of LHX3, a pituitary progenitor marker. LHX3 was significantly lower in TBX19 KI organoids as compared to WT from d48 onwards. (G) Relative quantification expression of TBX19, a critical transcriptional determinant for corticotroph differentiation. TBX19 expression is higher in TBX19 KI organoids at d105. (H) Relative quantification expression of pro-opiomelanocortin (POMC), a corticotroph marker. POMC was significantly downregulated in TBX19 KI organoids from d48 onwards.
Figure 2—figure supplement 1
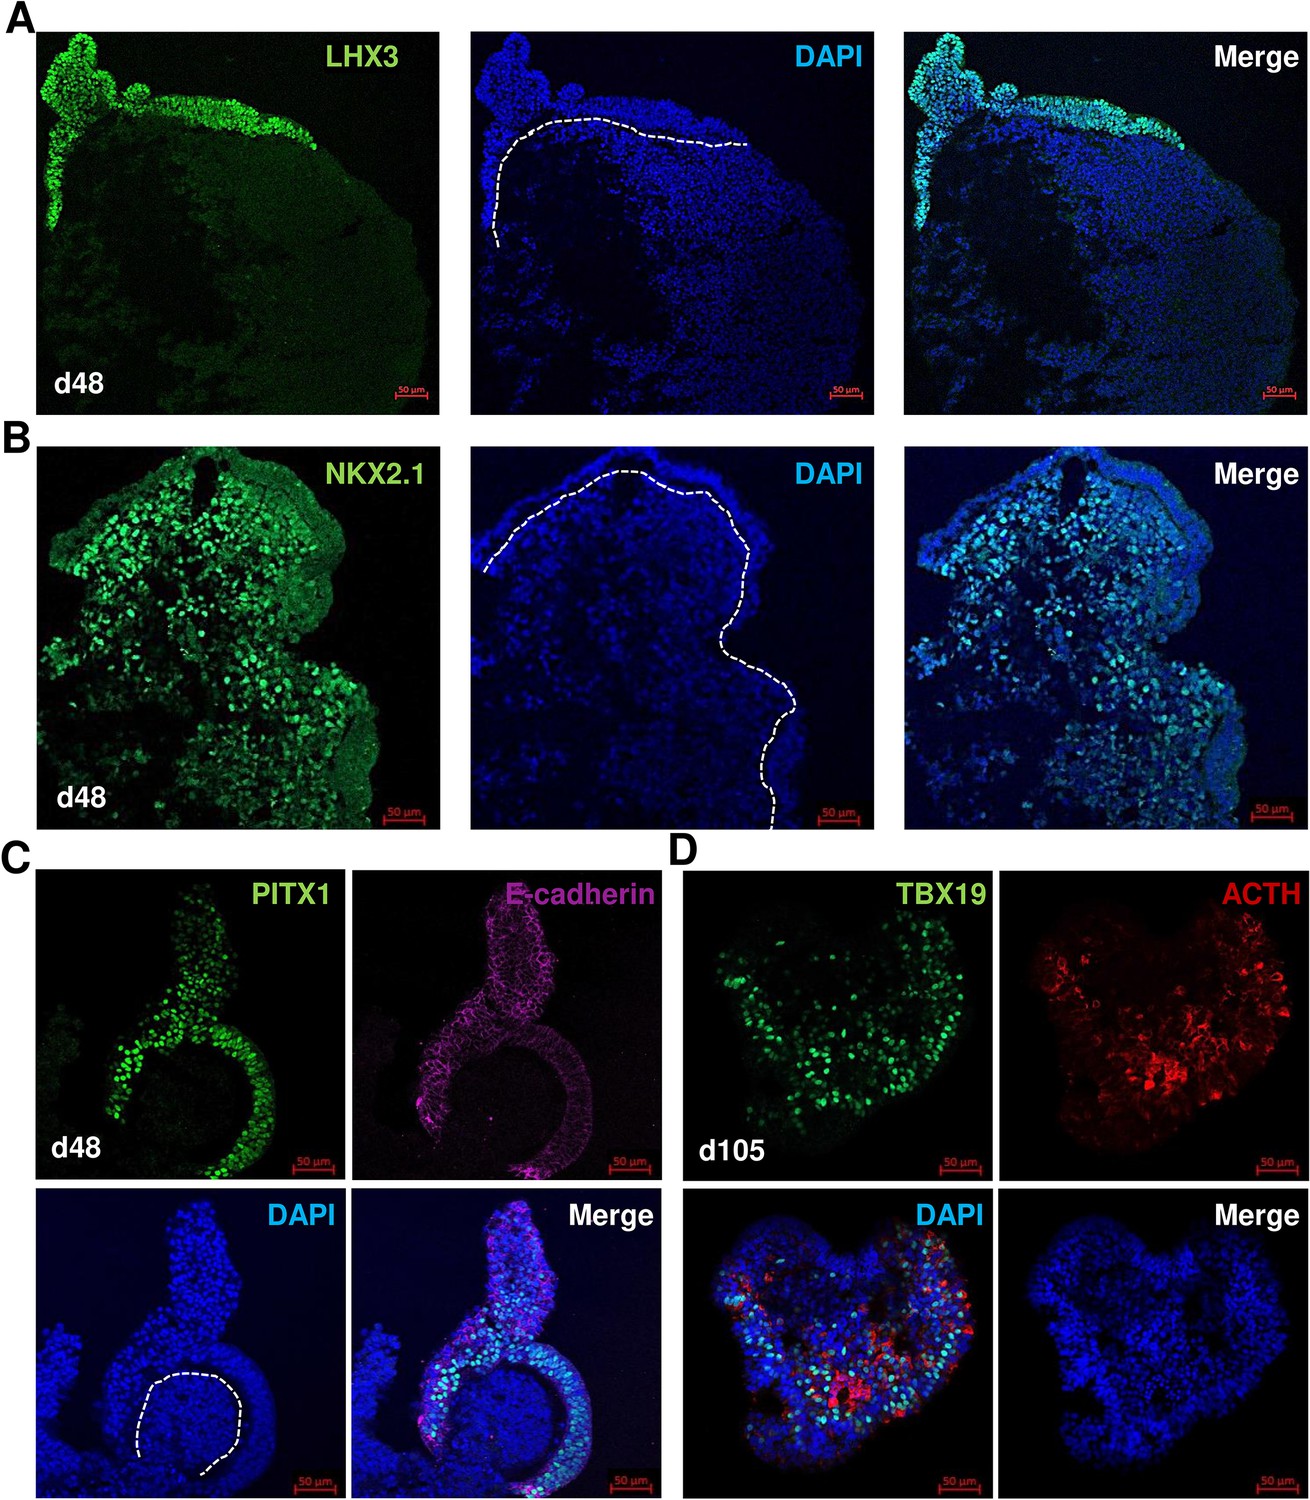
Differentiation of human induced pluripotent stem cell (hiPSC) control into pituitary organoid using 3D culture.
(A–C) Induction of two tissues hypothalamus-pituitary in organoid on day 48. (A) Oral ectoderm-like tissue expressed pituitary progenitor markers (LHX3). (B) Hypothalamus-like tissue expressed hypothalamic progenitor markers (NKX2.1). (C) Oral ectoderm-like tissue expressed PITX1 and E-cadherin. (D) Corticotroph cells expressed TBX19 in the nucleus and adrenocorticotropic hormone (ACTH) in the cytoplasm in organoid on day 105. Scale bars: 50 µm.
Figure 3
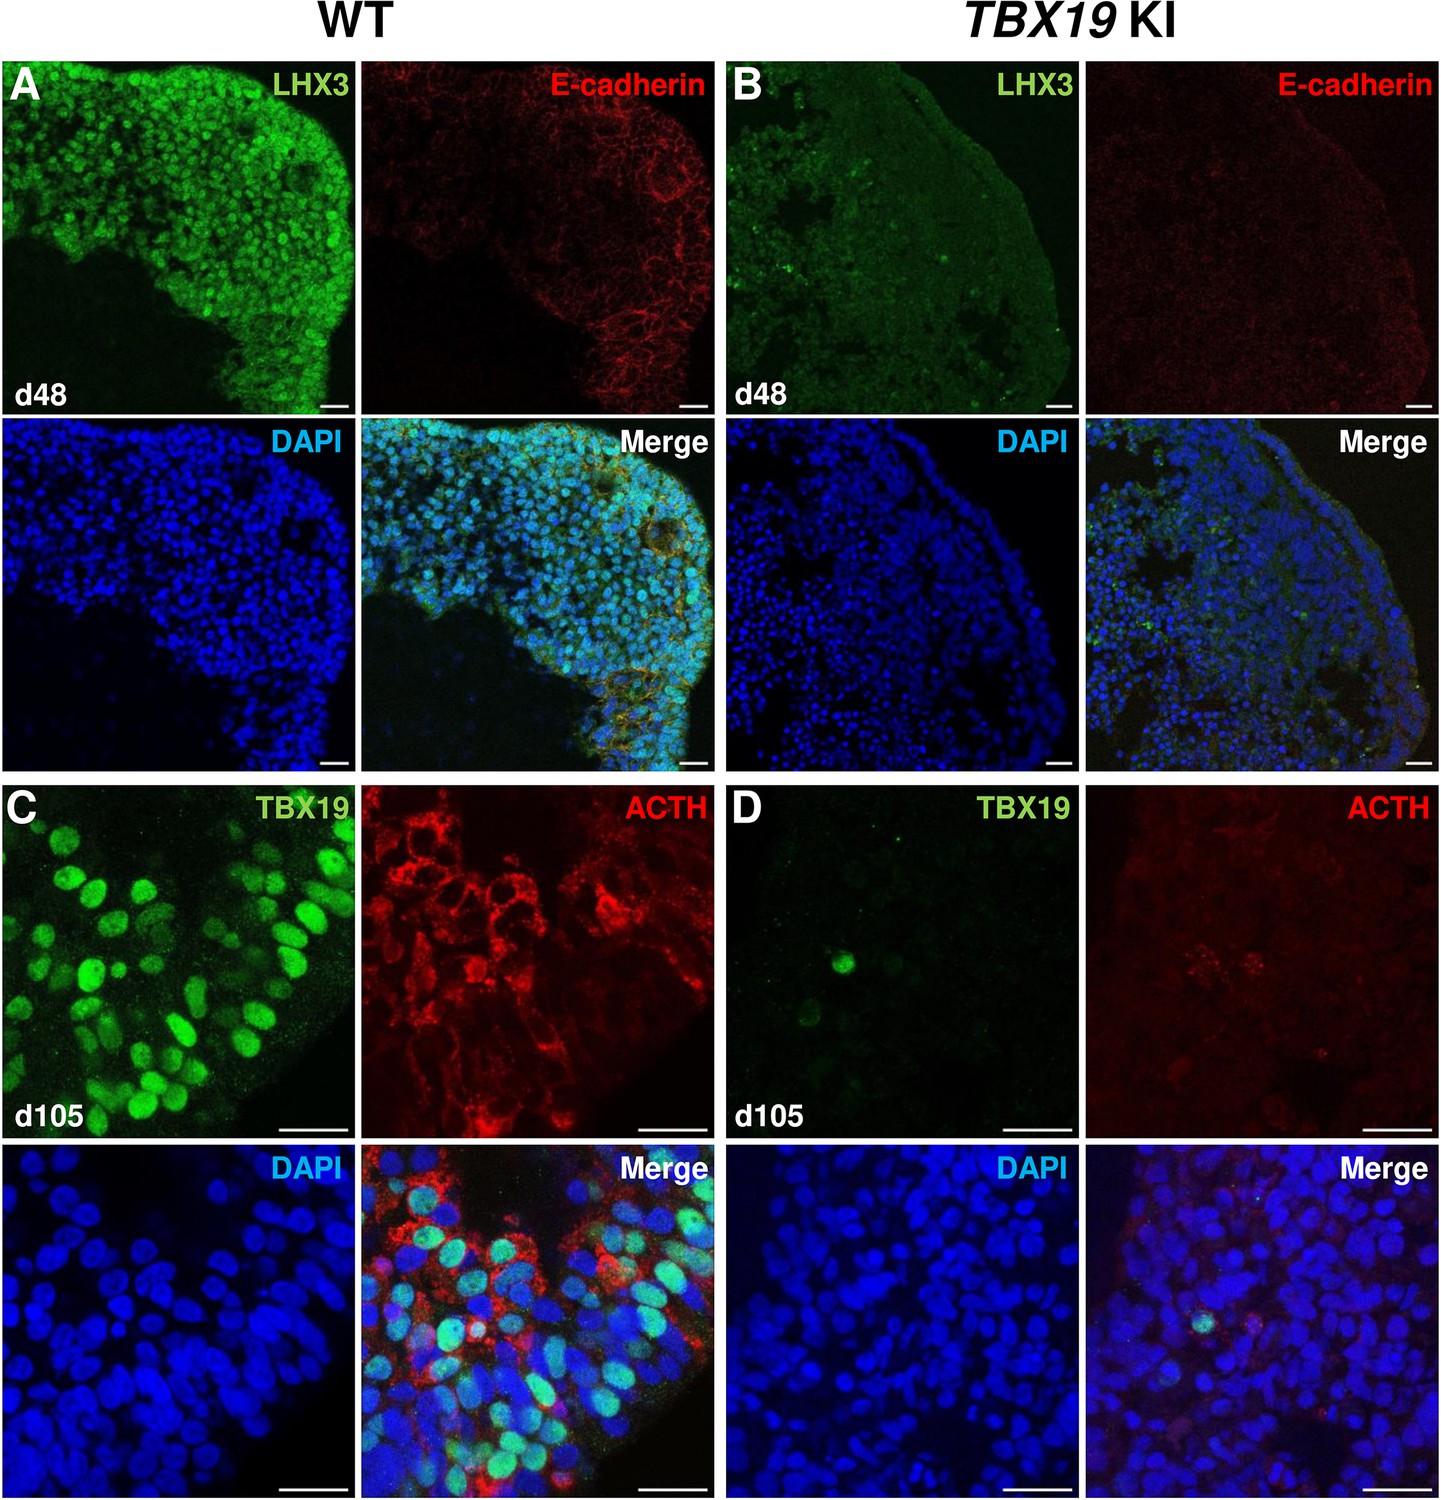
Impairment of corticotroph development in TBX19 KI organoids as compared with controls at the protein level.
(A, B) Immunostaining of LHX3 and CDH1 (E-cadherin) expression in epithelial cells, typical of Rathke’s pouch ectoderm in early pituitary primordia, was reduced in TBX19 KI organoid vs wild-type (WT) on day 48 (n=10 organoids for each group). Scale bars: 10 μm. (C, D) Immunostaining showed that adrenocorticotropic hormone (ACTH) and TBX19 expressions were reduced in TBX19 KI organoid vs WT on day 105 (n=10 organoids for each group). Scale bars: 10 μm.
Figure 4 with 2 supplements
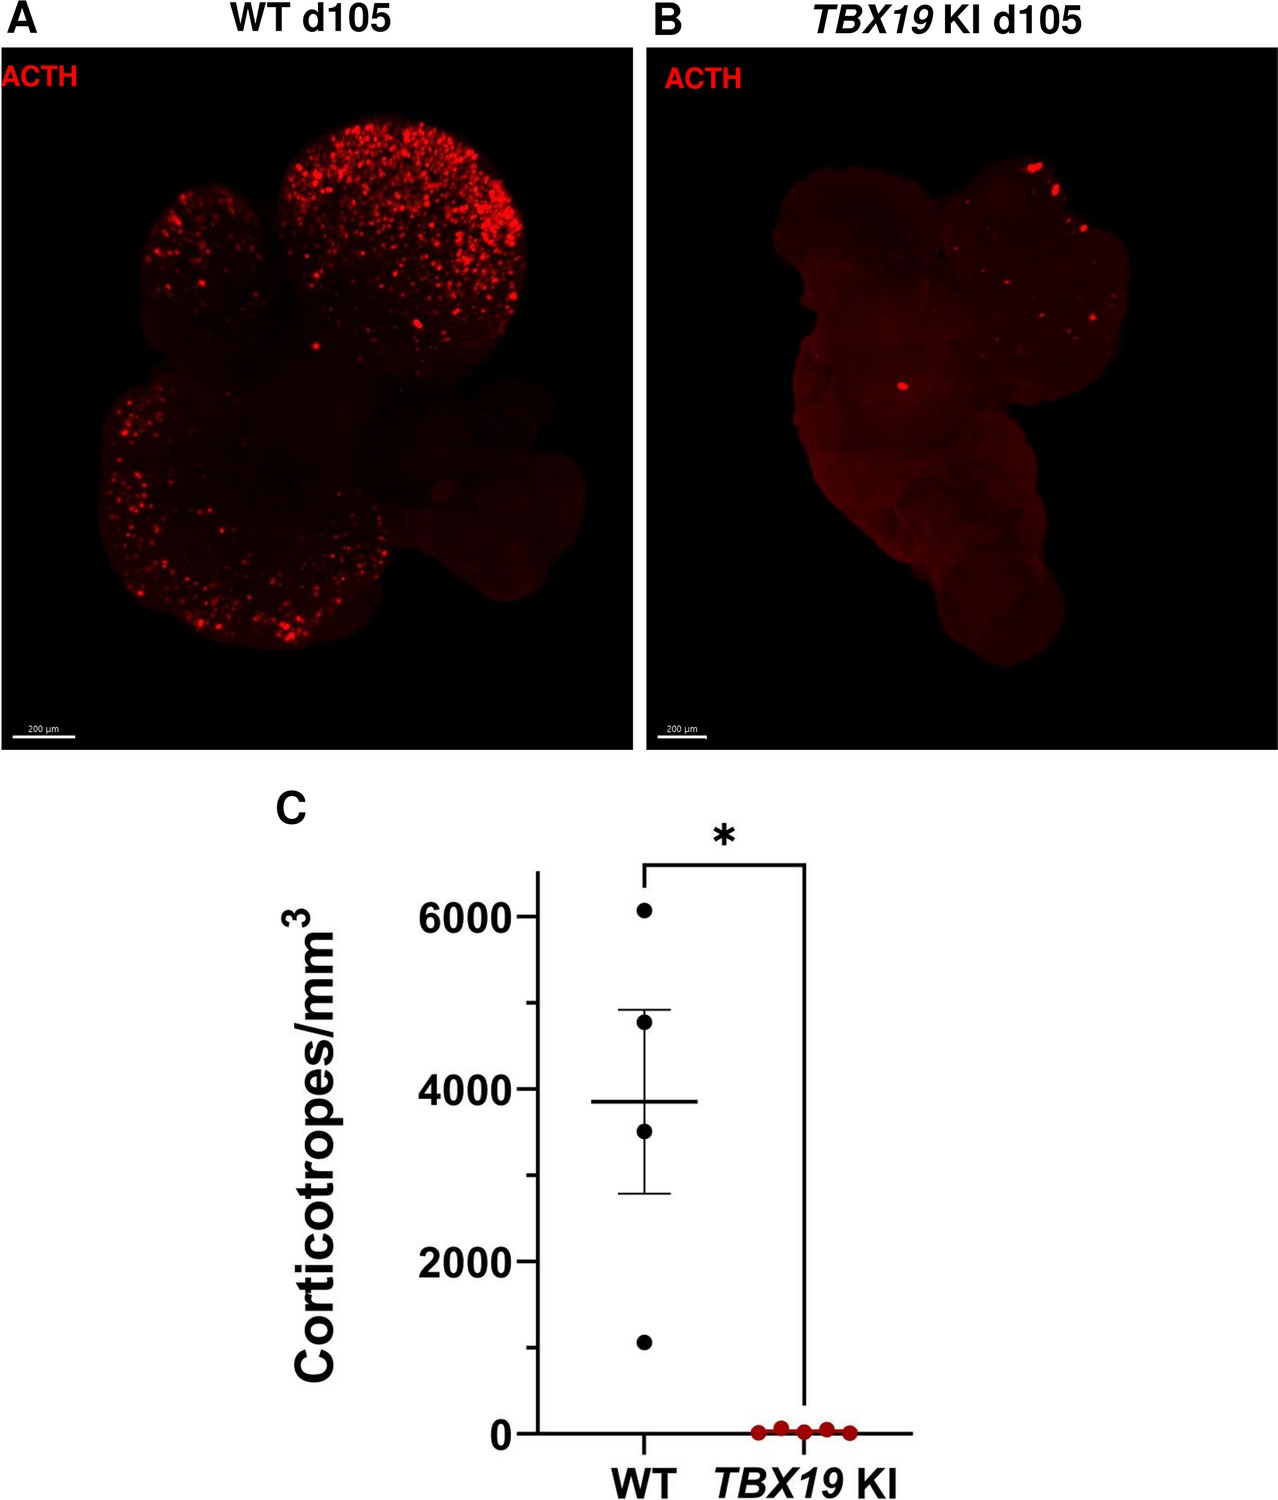
3D reconstruction of whole wild-type (WT) and TBX19 KI organoids on day 105.
(A) A representative image of whole-mount immunostaining against adrenocorticotropic hormone (ACTH) in a cleared WT organoid on d105 using light-sheet microscopy. Scale bar: 200 μm. (B) A representative image of whole-mount immunostaining against ACTH in a cleared TBX19 KI organoid on d105 as above, showing impaired corticotroph differentiation. Scale bar: 200 μm. (C) The number of corticotroph cells per mm3 was significantly decreased in TBX19 KI organoids (* p=0.0159). Means ± SEM for n=4 WT, n=5 TBX19 KI organoids. Mann-Whitney test (unpaired, two-tailed, nonparametric).
Figure 4—video 1
3D animation of whole-mount d105 WT cleared organoid immunostained for TBX19 (green) and adrenocorticotropic hormone (ACTH) (red).
Scale bar: 200 μm.
Figure 4—video 2
3D animation of whole-mount d105 TBX19 KI cleared organoid immunostained for TBX19 (green) and adrenocorticotropic hormone (ACTH) (red).
Scale bar: 200 μm.
Figure 5 with 1 supplement
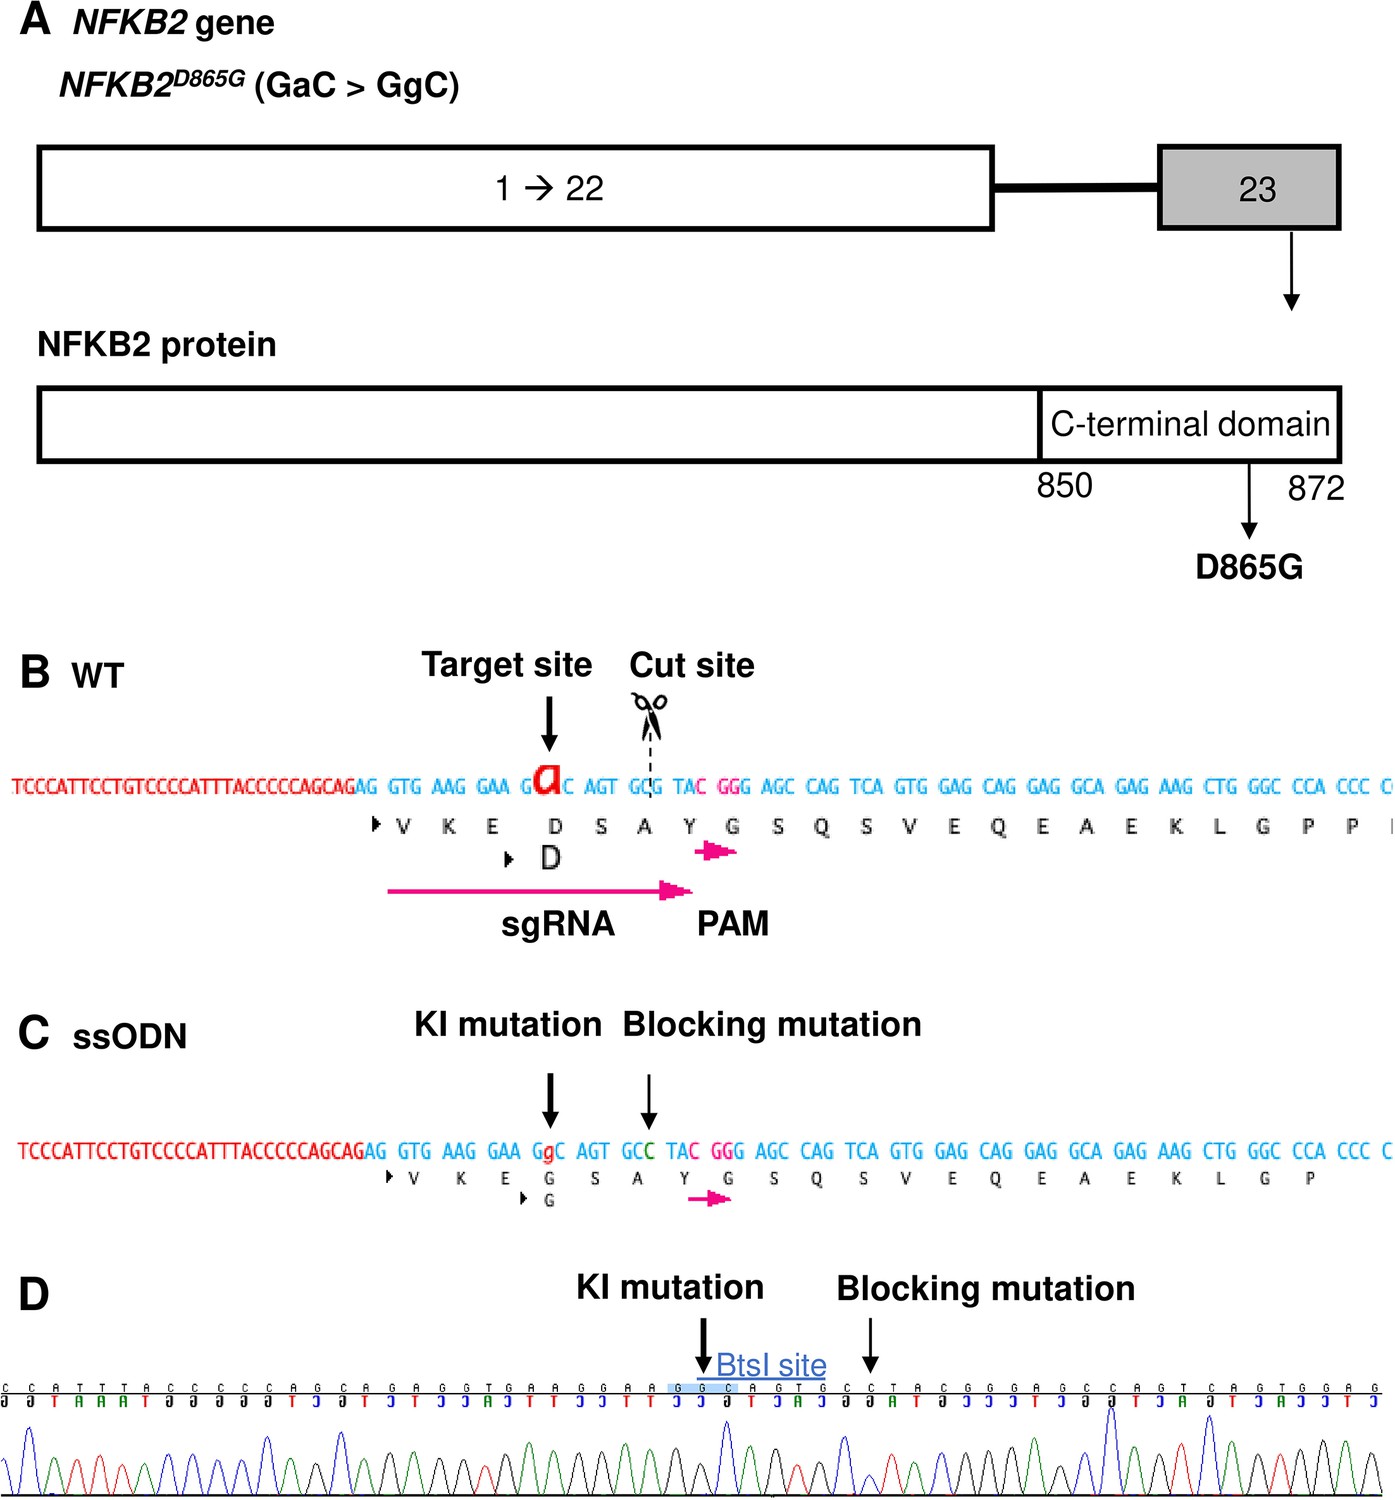
Design of sgRNA and single-stranded oligo DNA nucleotides (ssODN) to introduce a nuclear factor kappa-B subunit 2 (NFKB2)D865G mutation.
(A) Illustration of the NFKB2 gene (HGNC: 7795; ENSEMBL: ENSG00000077150; Human GRCh38). (B) Wild-type (WT) sequence containing target site, cut site, target, and protospacer-adjacent motif (PAM) sequence. (C) ssODN design to introduce the missense mutation D865G into NFKB2 using CRISPR/Cas9. (D) Sequence analysis of the NFKB2 KI hiPSC clone 7, obtained by Sanger sequencing, after screening by cleaved amplified polymorphic sequences (CAPS). This clone was subsequently used in this work to differentiate into pituitary organoids (see below).
Figure 5—figure supplement 1
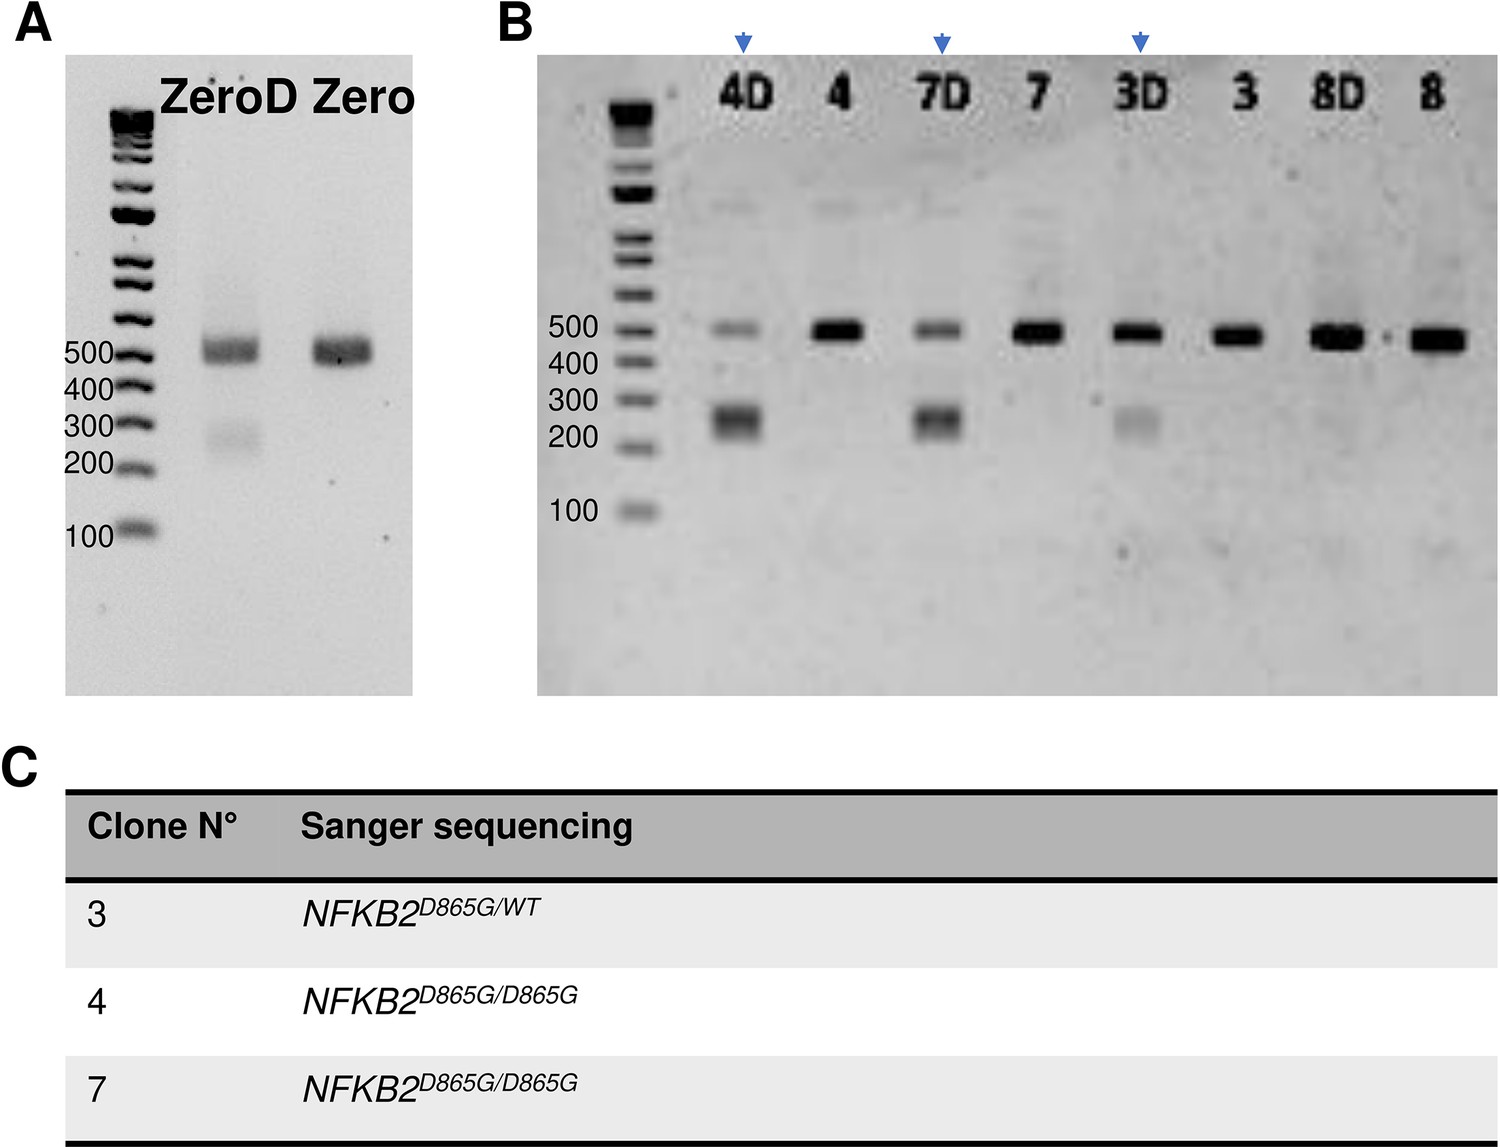
Results of cleaved amplified polymorphic sequences (CAPS) assay and Sanger sequencing for editing nuclear factor kappa-B subunit 2 (NFKB2) mutation.
(A) CAPS assay with BtsI restriction enzyme in human induced pluripotent stem cell (hiPSC) population (zero) on day 3 post-transfection. Wild-type (WT) or Undigested (498 bp band); Digested or mutant (D, 2 bands at 239 bp and 259 bp). (B) CAPS assay with BtsI restriction enzyme for screening individual colony. D: digested. Positif clones which had 3 bands (marked by a blue arrow) were then confirmed by Sanger sequencing. (C) Sanger sequencing analysis of positive clones. 2 clones (#4 and #7) were homozygous NFKB2D865G/D865G. One clone was heterozygous NFKB2D865G/WT.
-
Figure 5—figure supplement 1—source data 1
A pdf file describing modifications of original pictures used in Figure 5—figure supplement 1.
- https://cdn.elifesciences.org/articles/90875/elife-90875-fig5-figsupp1-data1-v1.zip
-
Figure 5—figure supplement 1—source data 2
Two original pictures used in Figure 5—figure supplement 1.
- https://cdn.elifesciences.org/articles/90875/elife-90875-fig5-figsupp1-data2-v1.zip
Figure 6
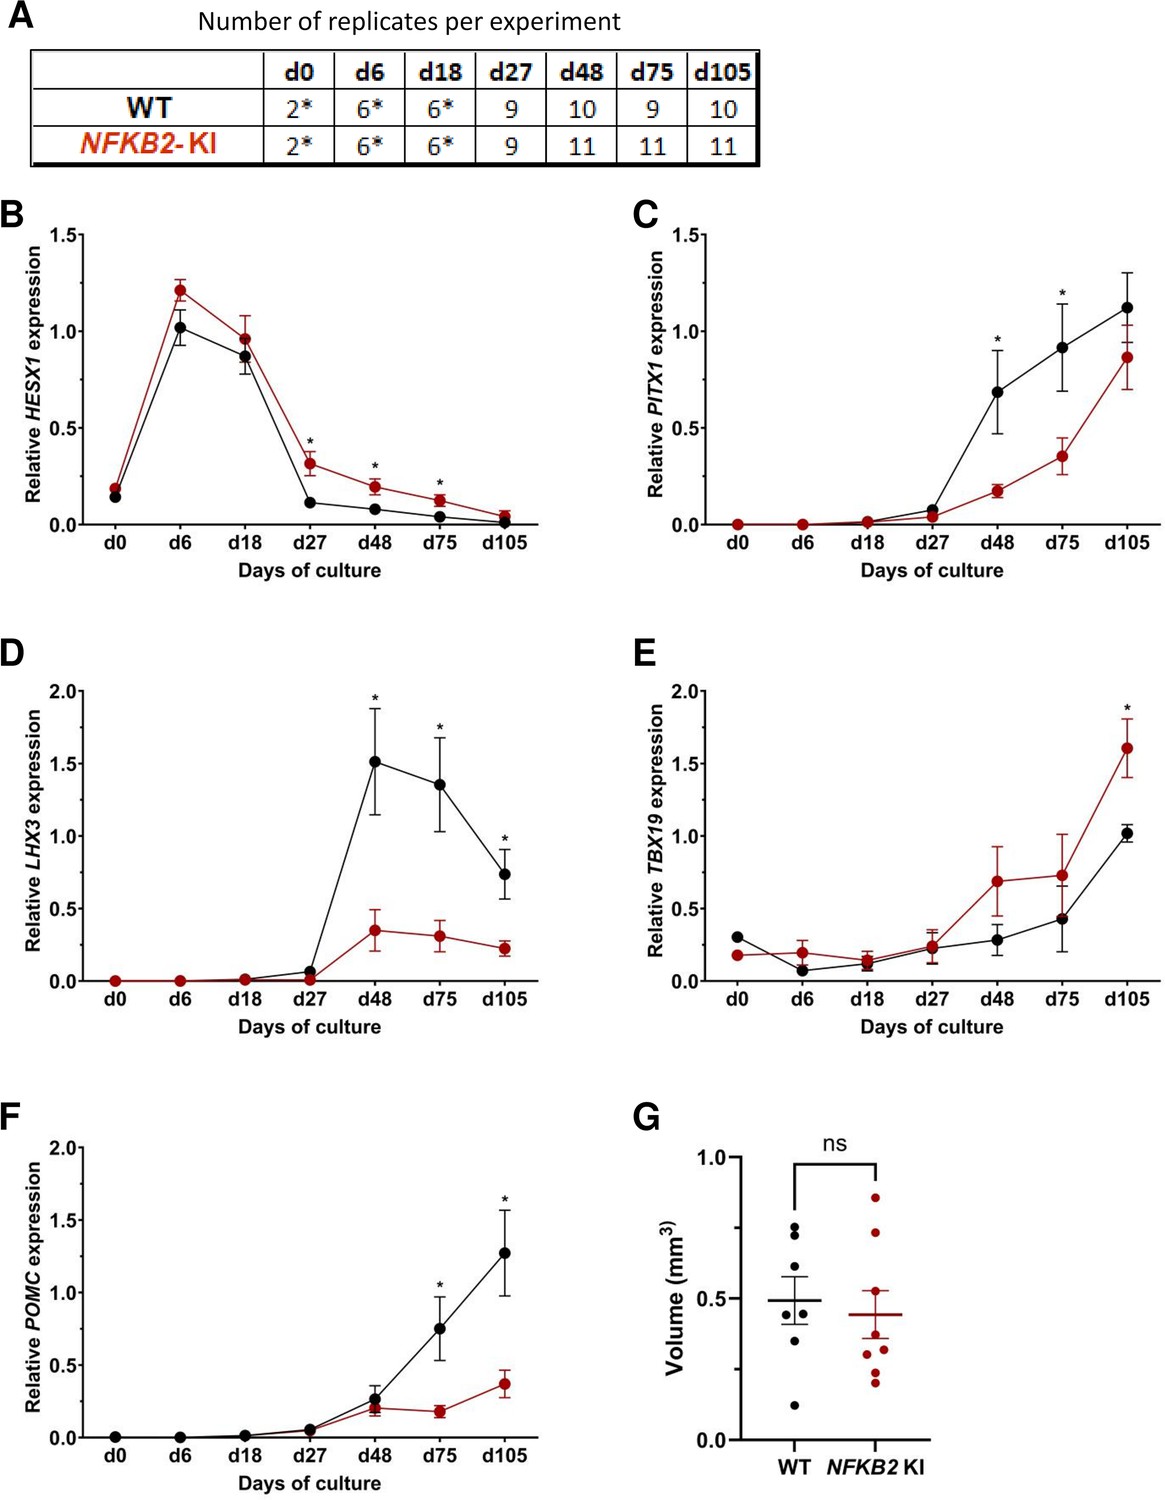
Time course of organoid growth and gene expression in wild-type (WT) and nuclear factor kappa-B subunit 2 (NFKB2) KI organoids.
(A) Number of replicates per time point and per genotype in experiments depicted in the following graphs. Asterisks indicate that 7–8 organoids were grouped for each sample. For other point, each sample consists of a single organoid. (B–F) Relative quantification (RQ) mRNA expression analysis for key markers of pituitary organoids during differentiation: WT (black line and dots) and NFKB2 KI organoids (red line and dots). Data show means ± standard error of the mean (SEM);. Mann-Whitney t-test (unpaired, two-tailed, nonparametric). p<0.05 (*), p<0.01 (**). (B) Relative quantification expression of HESX1, the earliest pituitary placode marker assessed. The expression of HESX1 was upregulated in NFKB2 KI organoids vs. WT between d27 and d75. (C) Pituitary progenitor marker PITX1 was significantly downregulated in NFKB2 KI organoids at d48 and d75. (D) Pituitary progenitor marker LHX3 was significantly lower in NFKB2 KI organoids as compared to WT from d48 onwards. (E) Relative quantification expression of TBX19, a corticotroph marker. TBX19 was significantly increased in NFKB2 KI organoids by d105. (F) Relative quantification expression of pro-opiomelanocortin (POMC), a corticotroph marker. POMC was significantly downregulated in NFKB2 KI organoids from d75. (G) Volume of organoids (mm3) on d105, calculated using Imaris software (see in methods). There was no significant difference in volume between WT and NFKB2 KI organoids (p=0.6126). Data show means ± SEM; n=7 in the WT group, n=8 in the mutant group. Mann-Whitney test (unpaired, two-tailed).
Figure 7
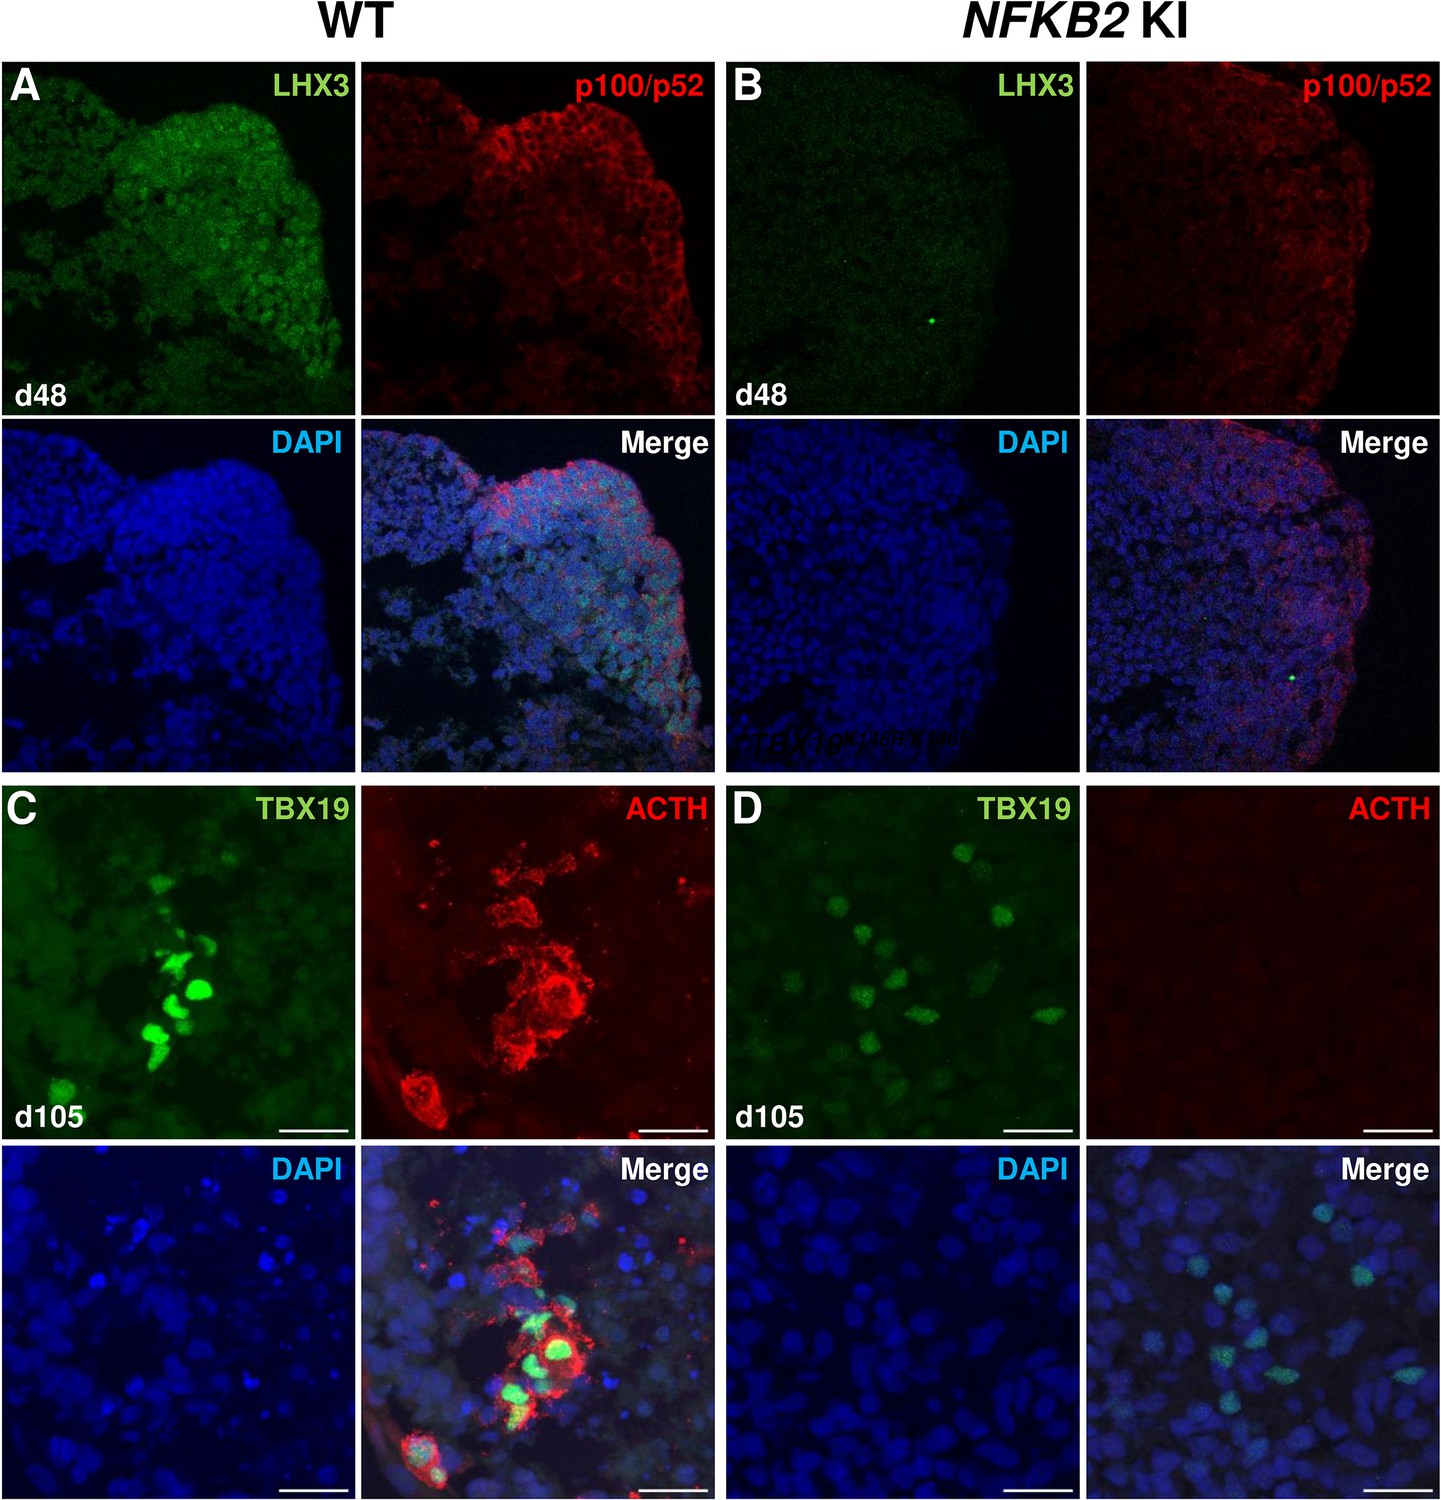
Impairment of pituitary development in nuclear factor kappa-B subunit 2 (NFKB2) KI organoids.
(A, B) Immunostaining for LHX3 (green) and p100/p52 (red) in the early pituitary-type epithelium was reduced in NFKB2 KI organoids vs wild-type (WT) on day 48 (n=10 organoids for each group). Stronger expression of p100/p52 was observed in pituitary progenitors, but expression in the hypothalamic part of the organoid cannot be excluded. Scale bar: 10 μm (C, D) by day 105, although nuclear TBX19 was detectable in both mutants, these cells failed to co-express ACTH in NFKB2 KI organoids (n=10 organoids for each group). Scale bars: 10 μm.
Figure 8 with 2 supplements
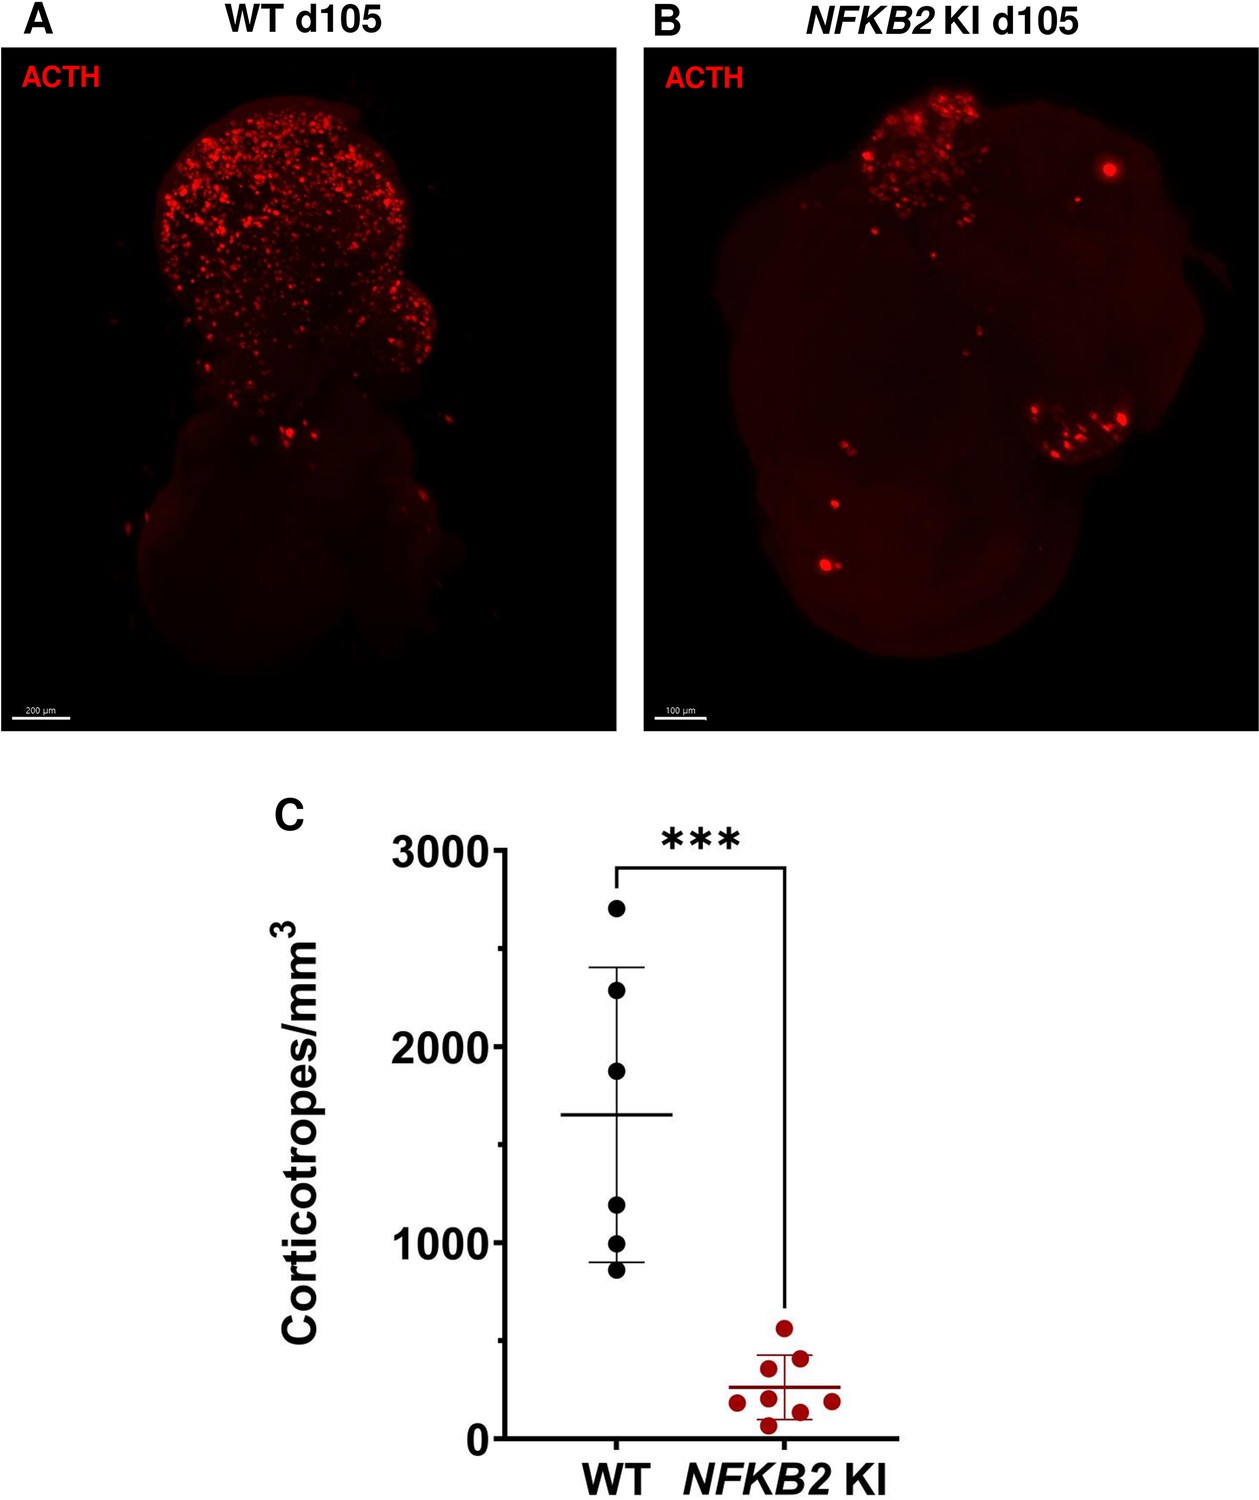
3D reconstruction of whole wild-type (WT) and nuclear factor kappa-B subunit 2 (NFKB2) KI organoids on day 105.
(A) A representative image of whole-mount immunostaining against adrenocorticotropic hormone (ACTH) in a cleared WT organoid on d105 using light-sheet microscopy. Scale bar: 200 μm. (B) A representative image of whole-mount immunostaining against ACTH in a cleared NFKB2 KI organoid on d105 as above, showing impaired corticotroph differentiation. Scale bar: 100 μm. (C) The number of corticotroph cells per mm3 was significantly decreased in NFKB2 KI organoids (*p=0.0007). Means ± SEM for n=6 organoids WT, n=8 NFKB2 KI organoids. Mann-Whitney test (unpaired, two-tailed, nonparametric).
Figure 8—video 1
3D animation of whole-mount d105 wild-type (WT) cleared organoid immunostained for TBX19 (green) and adrenocorticotropic hormone (ACTH) (red).
Scale bar: 200 μm.
Figure 8—video 2
3D animation of whole-mount d105 nuclear factor kappa-B subunit 2 (NFKB2) KI cleared organoid immunostained for TBX19 (green) and adrenocorticotropic hormone (ACTH) (red).
Scale bar: 200 μm.
Figure 9 with 2 supplements
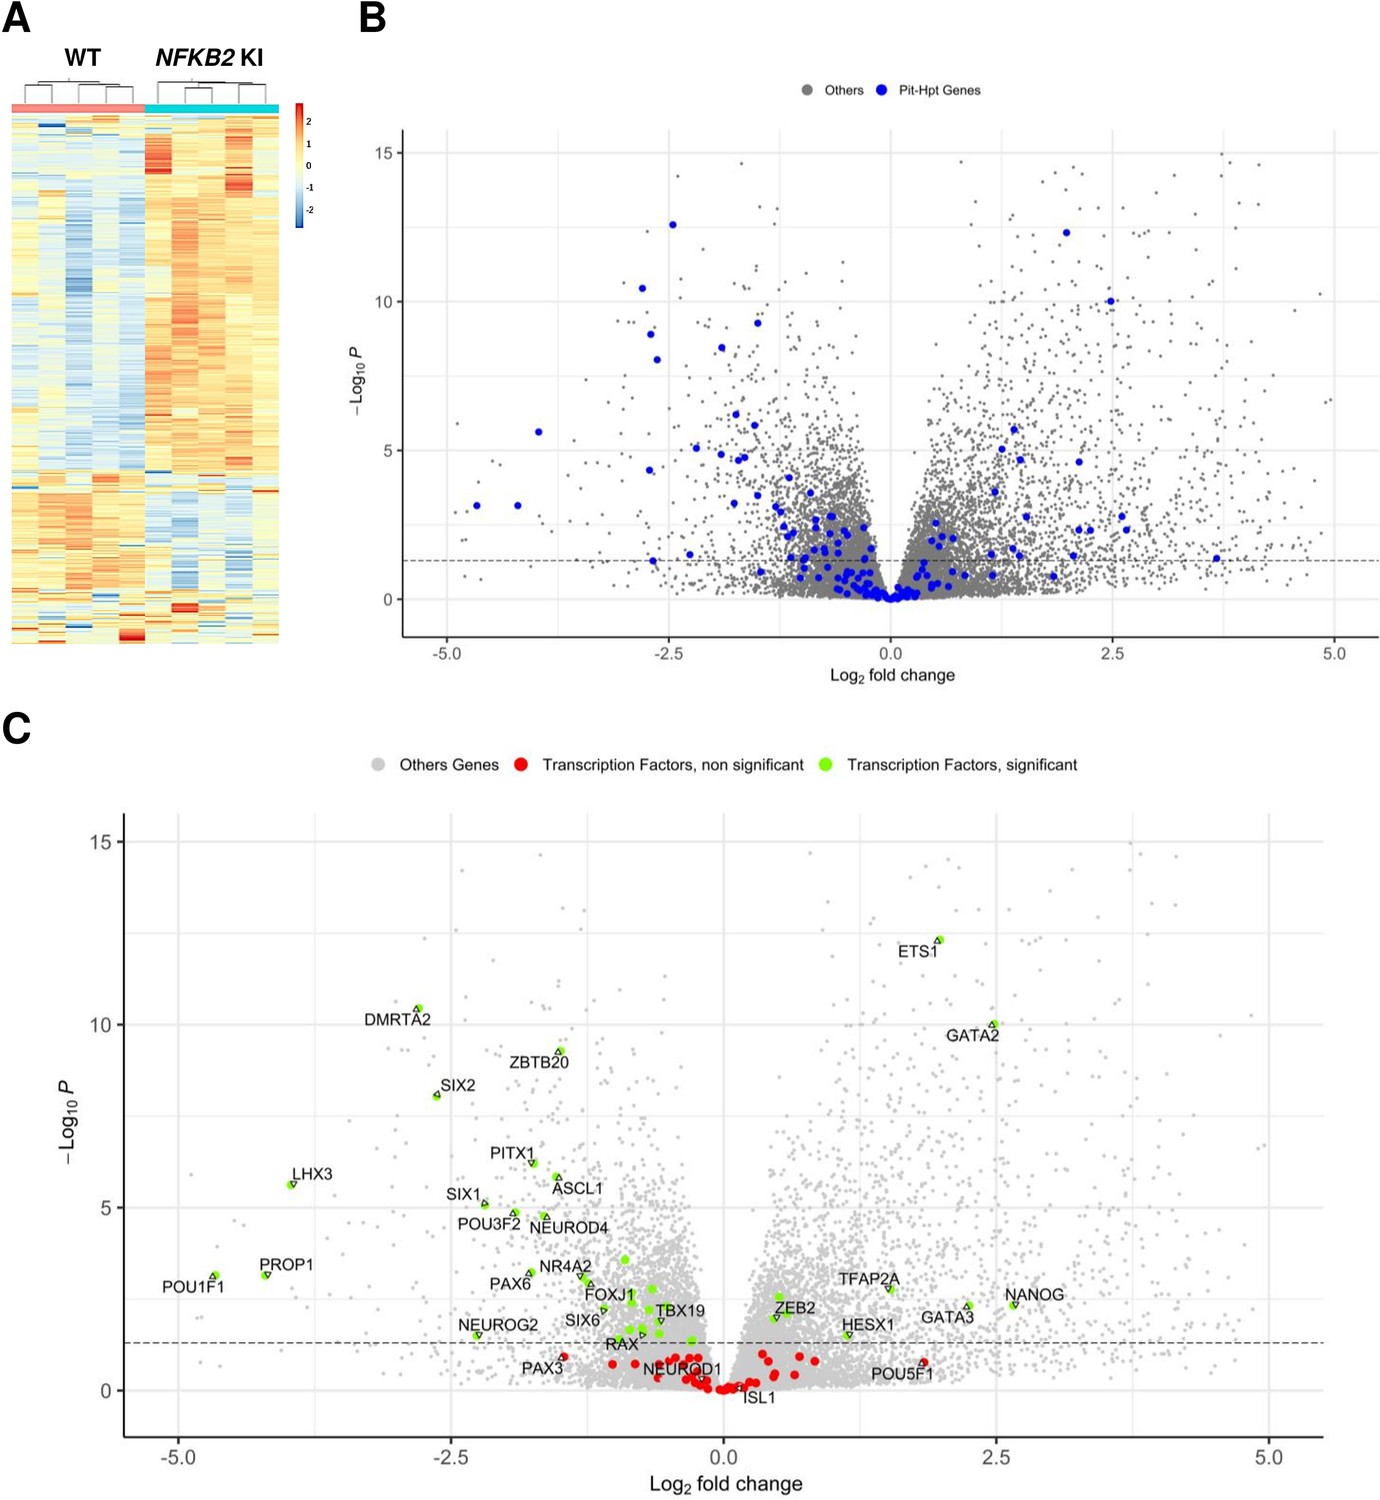
Whole-transcriptome profiles of wild-type (WT) vs nuclear factor kappa-B subunit 2 (NFKB2) knock-in (KI) organoids on day 48.
(A) Heat map showing global differential gene expression between WT vs NFKB2 KI organoids (n=5 for each group). (B) Volcano plot of genes showing differential gene expression between WT vs NFKB2 KI organoids (expressed in Log2 fold-change). Blue dots in the left panel indicate 144 genes involved in hypothalamic-pituitary development. Gray dots indicate all other genes detected in RNA-seq. (C) Volcano plot of genes showing differential gene expression between WT vs NFKB2 KI organoids. Green dots indicate genes coding for 39 key transcription factors whose expression is significantly changed (padj <0.05). Red dots indicate key transcription factors with non-significant changes (padj >0.05). Gray dots indicate all other genes detected in RNA-seq.
-
Figure 9—source data 1
Nuclear factor kappa-B subunit 2 (NFKB2) nock-in (KI) vs wild-type (WT) gene expression at d48 Excel spreadsheet showing NFKB2 KI vs WT expression ratios measured by RNA-seq (n=5 organoids of each genotype).
- https://cdn.elifesciences.org/articles/90875/elife-90875-fig9-data1-v1.xlsx
Figure 9—figure supplement 1
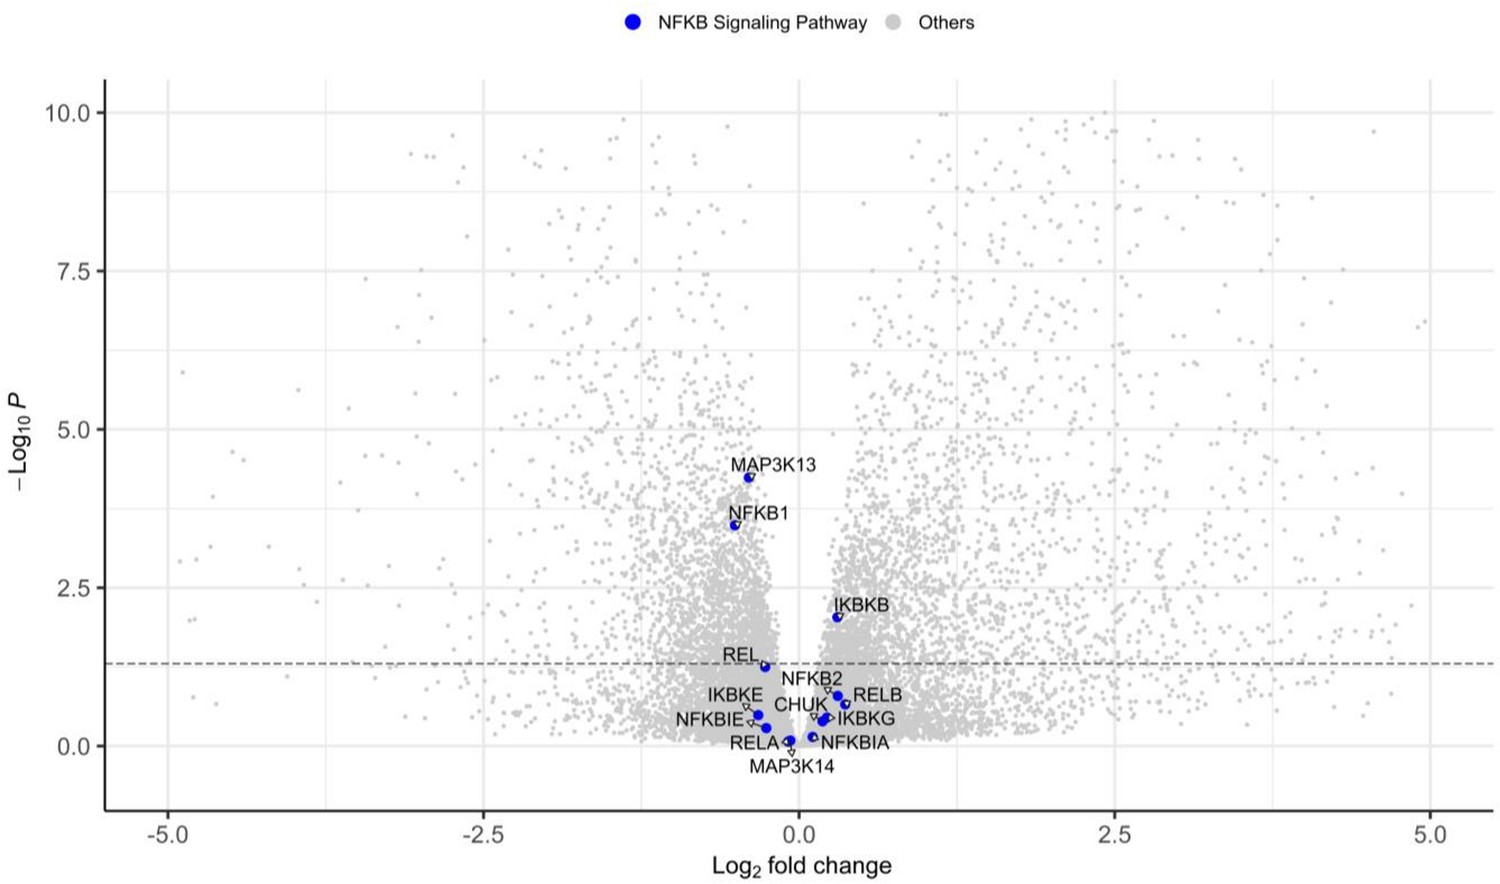
Volcano plot of genes showing differential gene expression between wild-type (WT) vs nuclear factor kappa-B subunit 2 (NFKB2)D865G/D865G organoids for genes involved in nuclear factor kappa B (NFKB) canonical and non-canonical pathways.
Figure 9—figure supplement 2
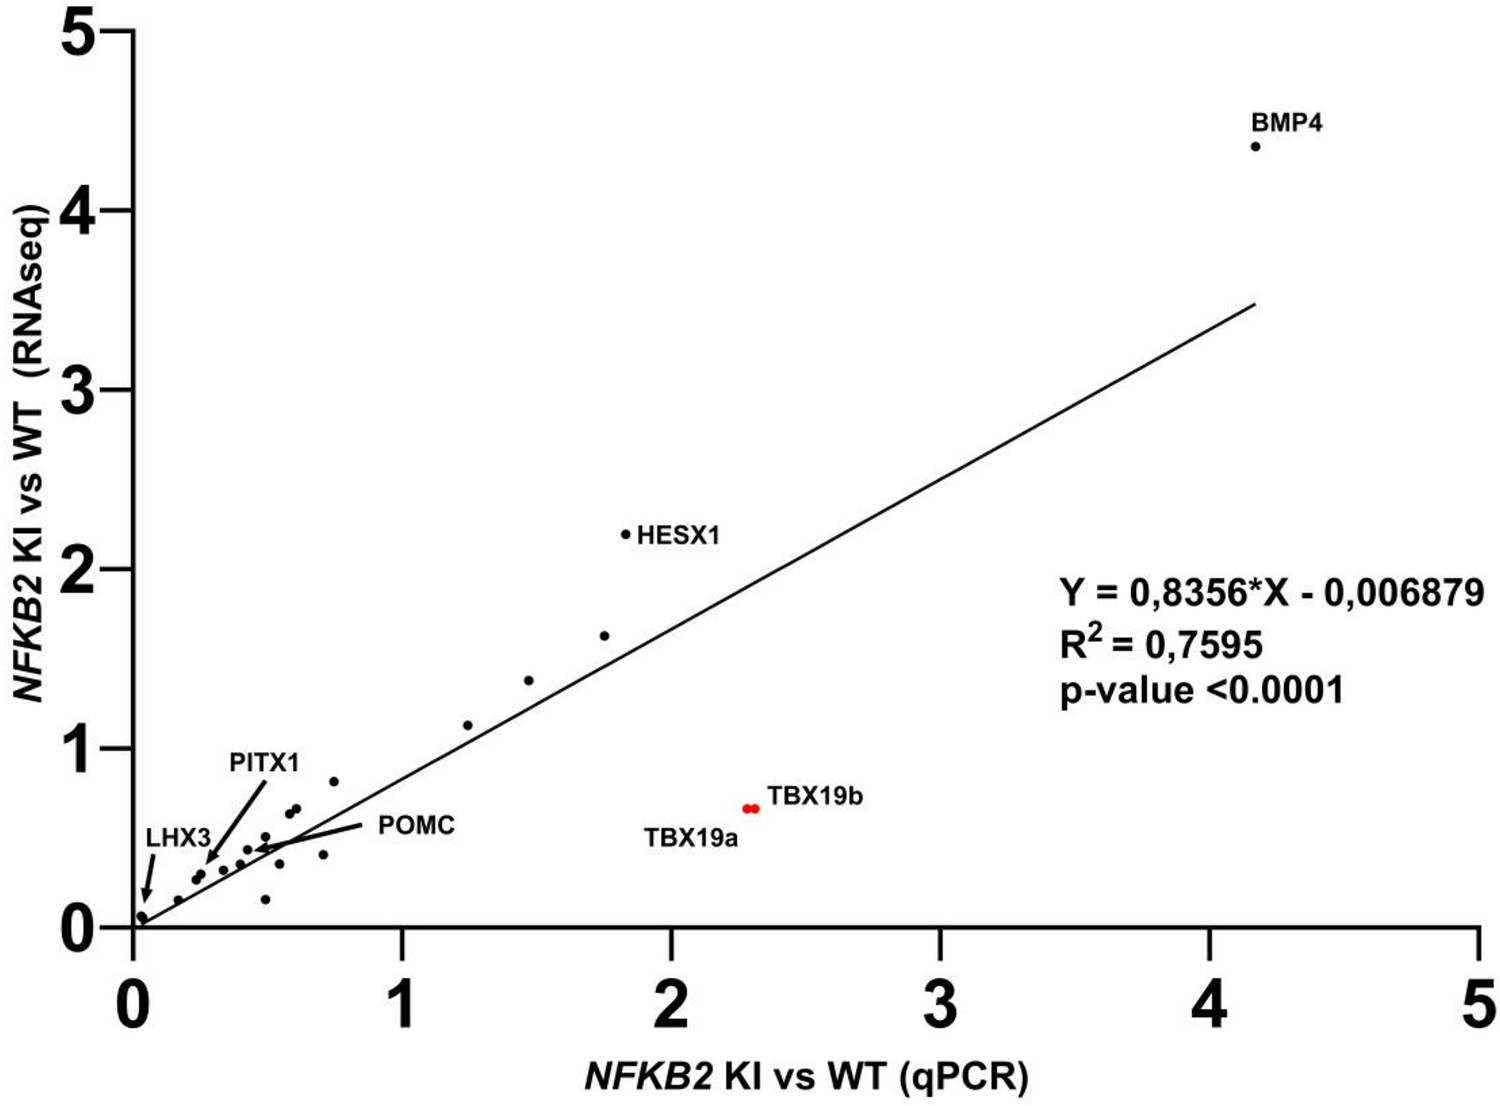
Correlation analysis of quantitative real-time PCR (qRT-PCR) and RNA-seq on same the samples.
Close correlation was found between ratios measured by RNA-seq and RT-qPCR when measured on the same samples. Only transcript levels measurement for TBX19 (red dots) where not correlated. The two red dots represent two different sets of primers used for TBX19 RT-qPCR.
Figure 10
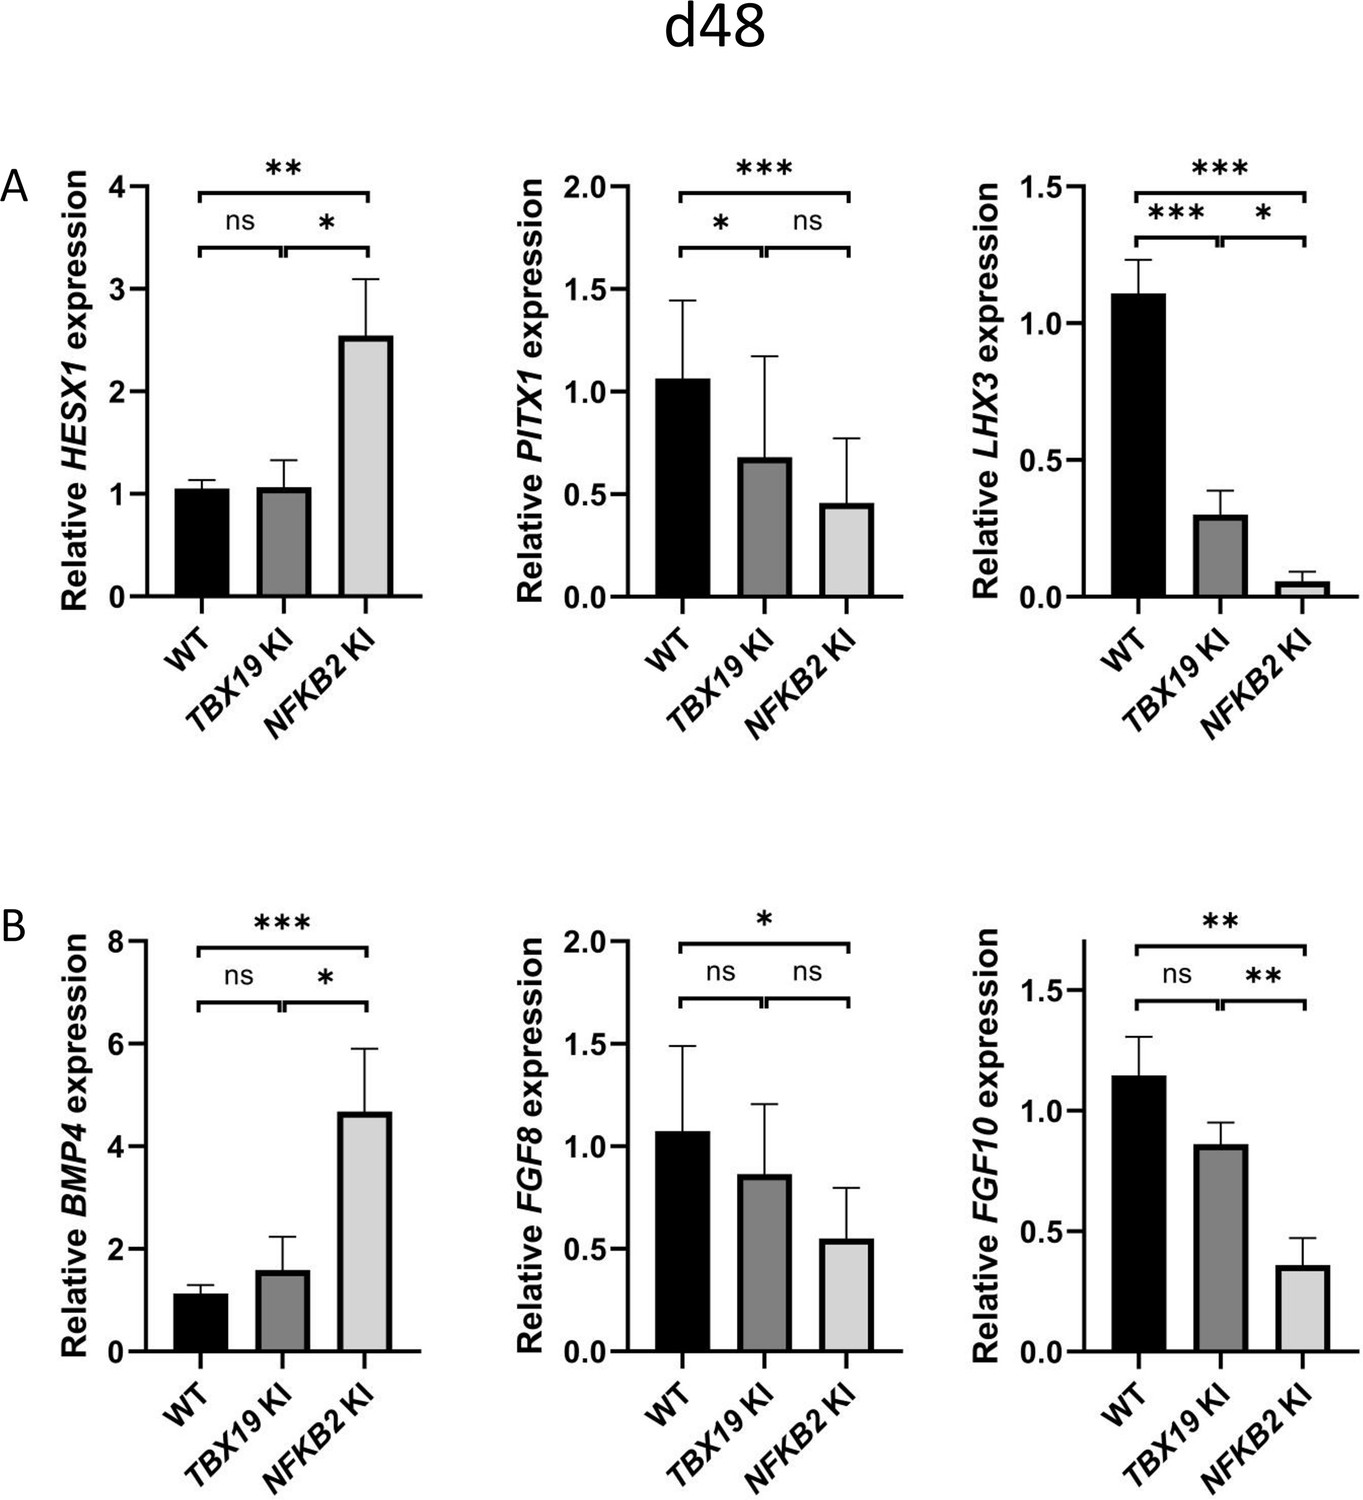
Impaired pituitary progenitor development is correlated with changes in growth factor expression in nuclear factor kappa-B subunit 2 (NFKB2) knock-in (KI) organoids.
(A) RT-qPCR experiments at d48 show that HESX1 expression is upregulated NFKB2 KI organoids, compared to wild-type (WT) and TBX19 KI, whereas PITX1 and LHX3 are downregulated in both mutants. (B) BMP4 expression is increased whereas, and FGF8 and FGF10 are decreased in NFKB2 mutants, but unchanged in TBX19 KI organoids. Data show means ± SEM; n=17, 12, and 11 for WT, TBX19 KI, and NFKB2 KI, respectively. Mann-Whitney t-test (unpaired, two-tailed, nonparametric). p<0.05 (*), p<0.01 (**), p<0.005 (***),.
Figure 11
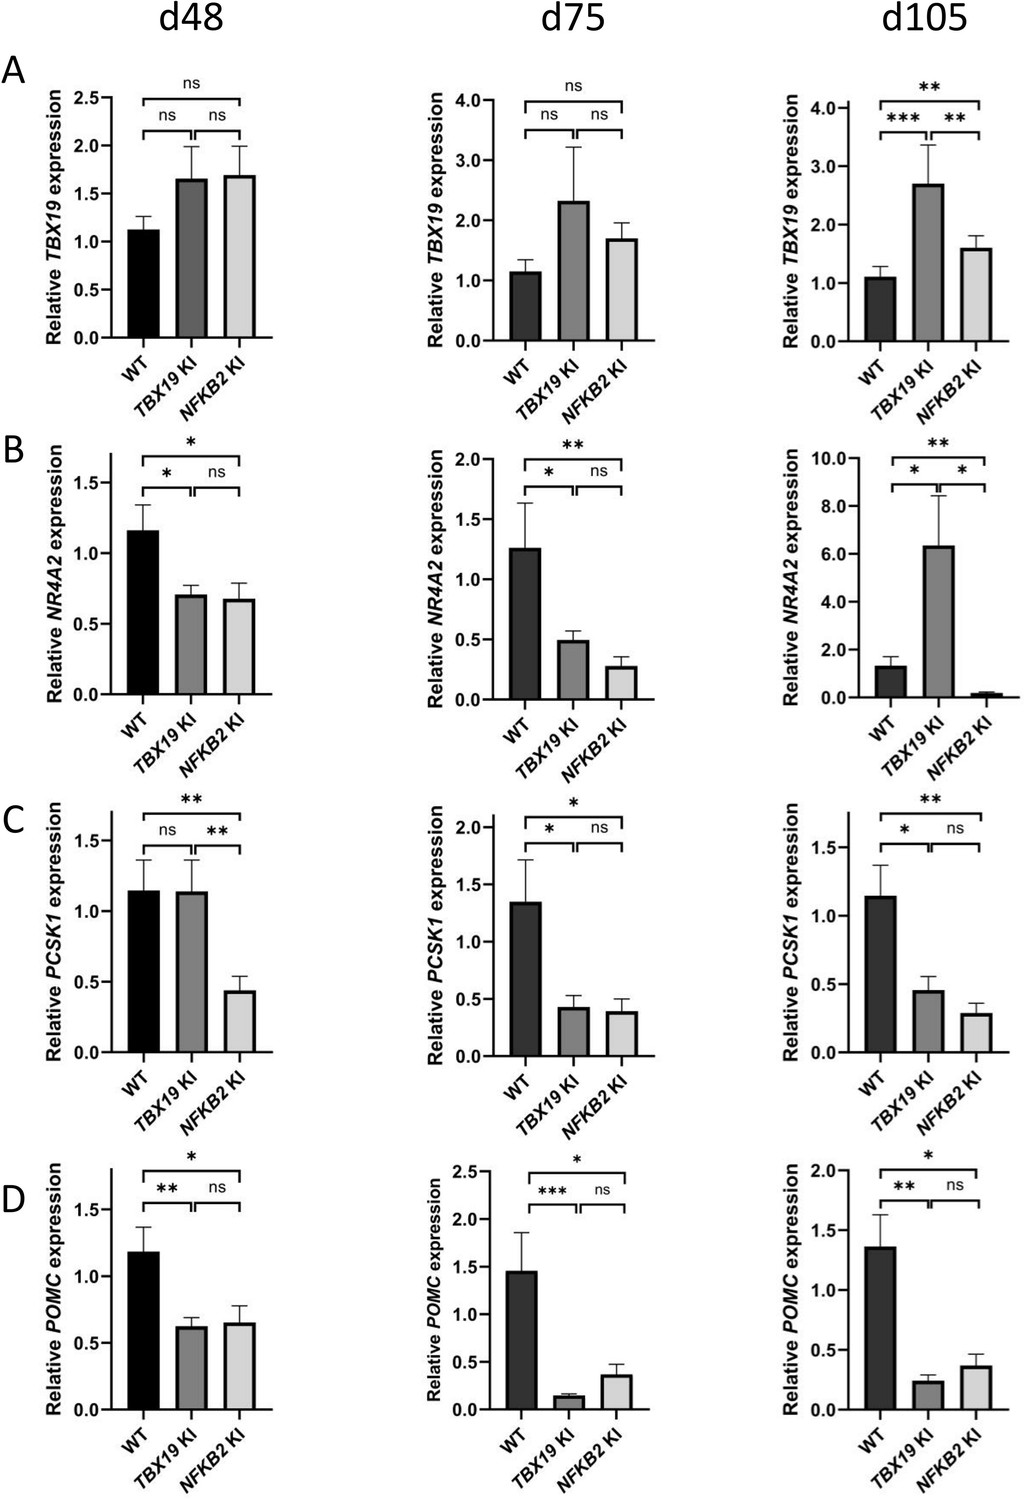
Impaired differentiation of corticotrophs in TBX19 KI and nuclear factor kappa-B subunit 2 (NFKB2) knock-in (KI) organoids.
(A) RT-qPCR measurements of TBX19 expression show a late (d105) increase in both mutants, with a stronger effect in TBX19 KI organoids. (B) Corticotroph terminal differentiation marker NR4A2 was decreased in both mutants at d48 and d75, but only in NFKB2 mutants at d105. (C) PCSK1 downregulation is only observed in NFKB2 KI at d48, and in both models at d75 and d102. (D) A decrease in pro-opiomelanocortin (POMC) expression is observed in both mutants from d48 onwards. Data show means ± SEM; d48: n=17, 12, and 11; d75, n=9, 7, and 6; d105: n=9, 5, and 5 for WT, TBX19 KI, and NFKB2 KI organoids, respectively. Mann-Whitney t-test (unpaired, two-tailed, nonparametric). p<0.05 (*), p<0.01 (**), p<0.005 (***).
Figure 12
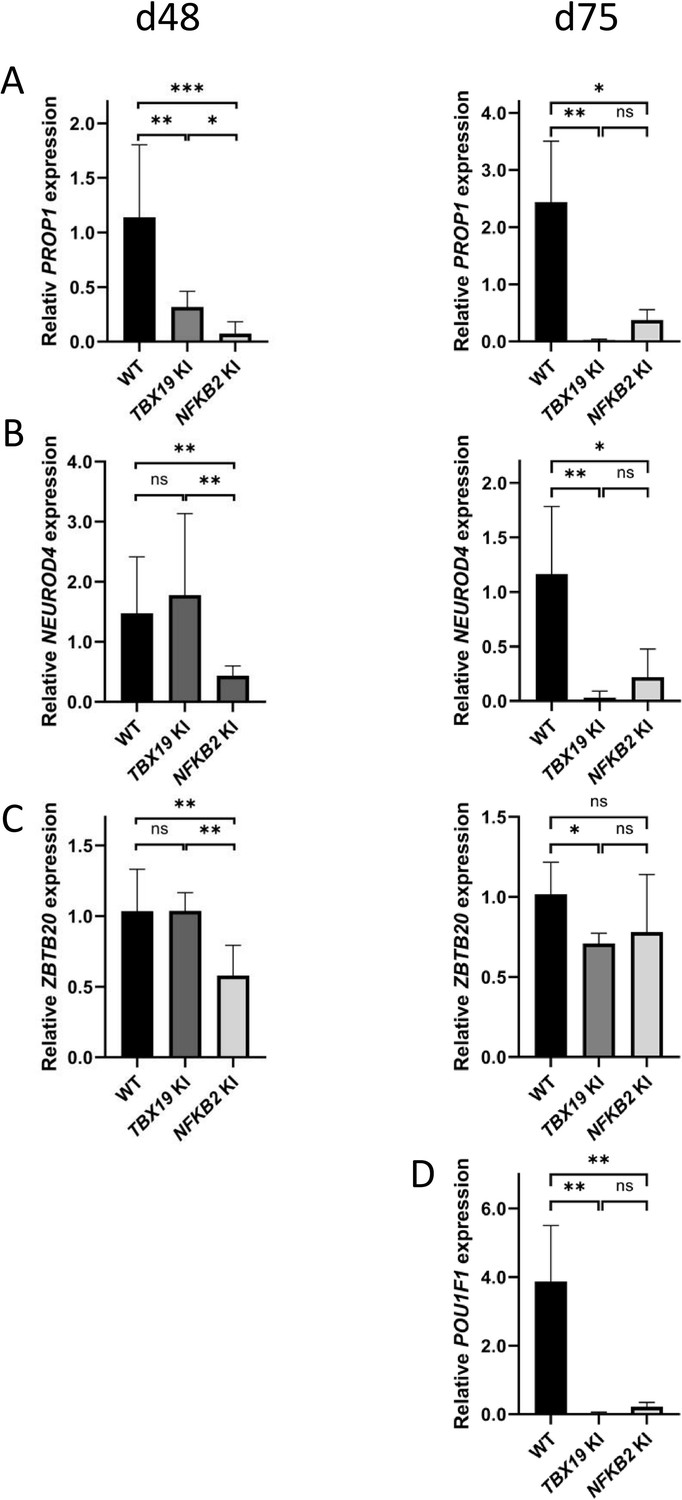
POU1F1-dependent lineages are affected in TBX19 KI and nuclear factor kappa-B subunit 2 (NFKB2) KI organoids.
(A) Strong downregulation of PROP1 expression is observed at d48 in both mutants and persists at d75. (B) Expression of POU1F1-dependant lineage progenitors and mature somatotrophs marker NEUROD4 is decreased at d48 inNFKB2 organoids, and in both models at d105. (C) ZBTB20, a marker for POU1F1-dependant lineage progenitors and mature lactotrophs, is less expressed in NFKB2 KI organoids at d48, but at normal levels by d75. In TBX19 KI mutants, its expression is normal at d48 but decreased by d75. (D) On d75, POU1F1 expression is barely detectable in either model. Data show means ± SEM; d48: n=17, 12, and 11; d75: n=9, 7, and 6 for WT, TBX19 KI and NFKB2 KI organoids, respectively. Mann-Whitney t-test (unpaired, two-tailed, nonparametric). p<0.05 (*), p<0.01 (**), p<0.005 (***).
Figure 13
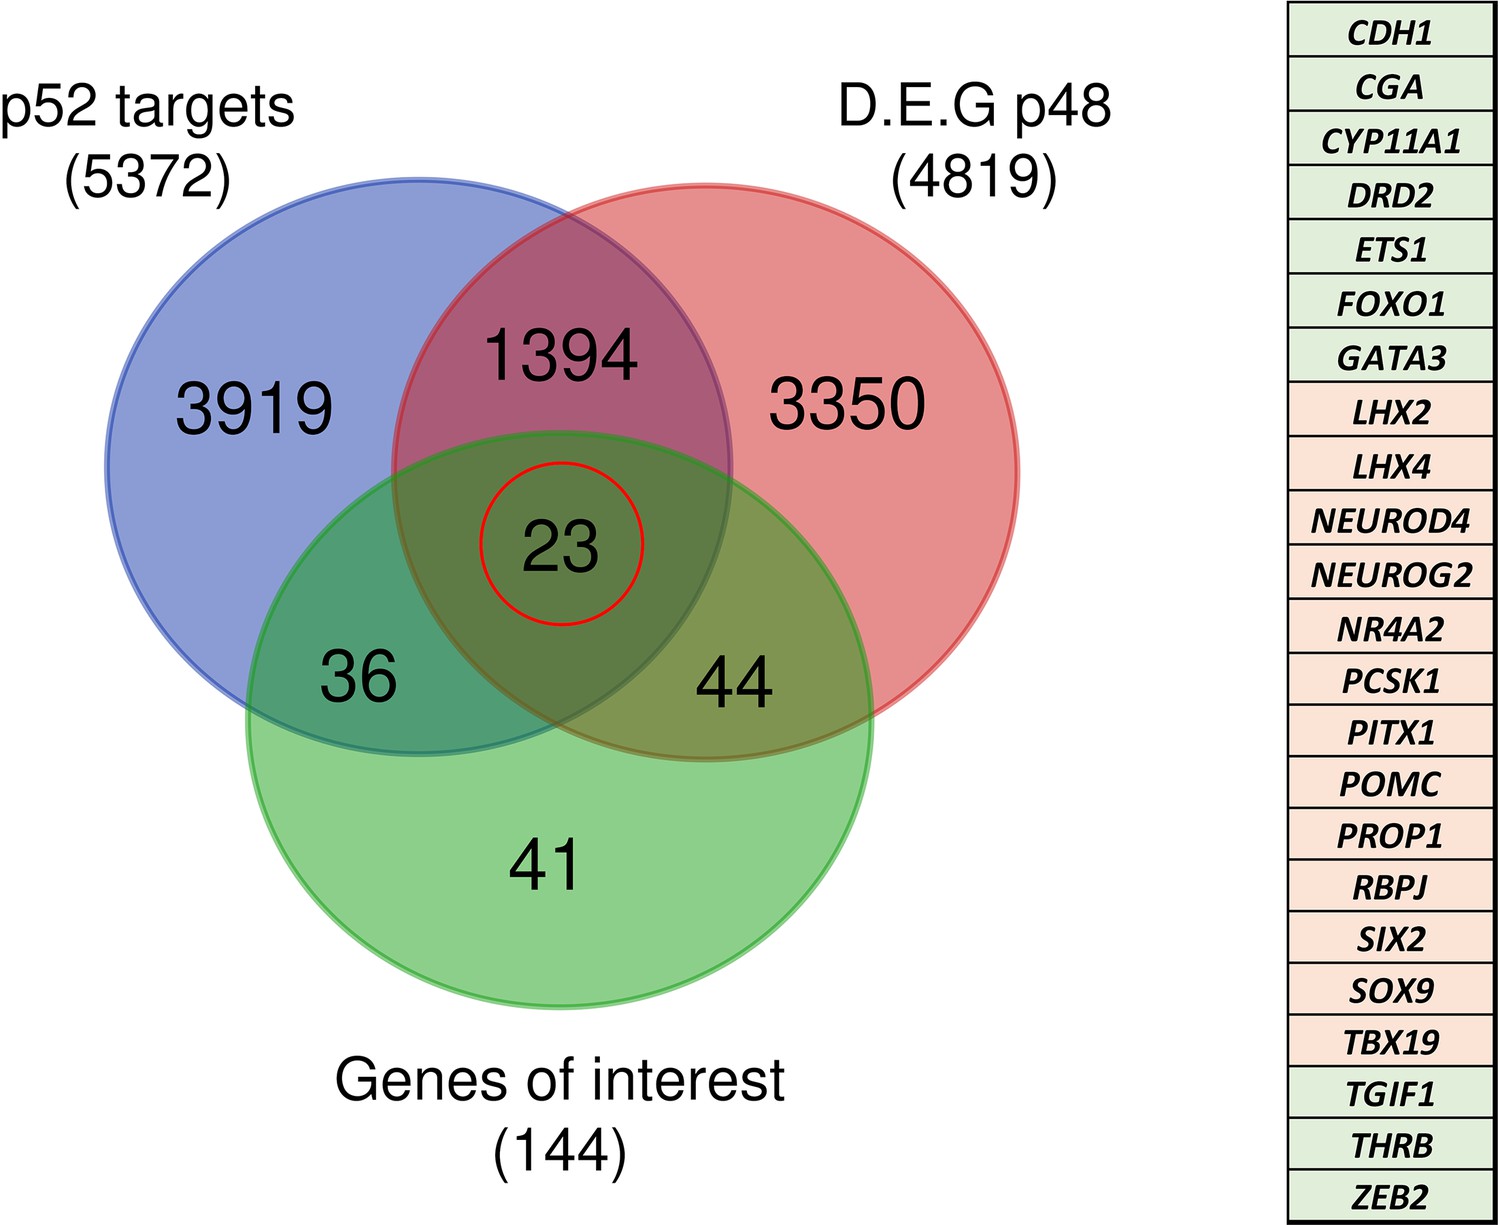
Identification of genes potentially under direct p52 regulation.
Venn diagram showing the total number and intersections of genes identified as p52 targets, genes differentially expressed at d48 between wild-type (WT) and nuclear factor kappa-B subunit 2 (NFKB2) KI organoids, and a literature-curated list of genes particularly implicated in hypothalamus-pituitary development. The table on the right shows the identity of the 23 genes (circled in red), with color code indicating whether they are upregulated (green) or downregulated (pink) in NFKB2 KI mutants at d48.
Figure 14
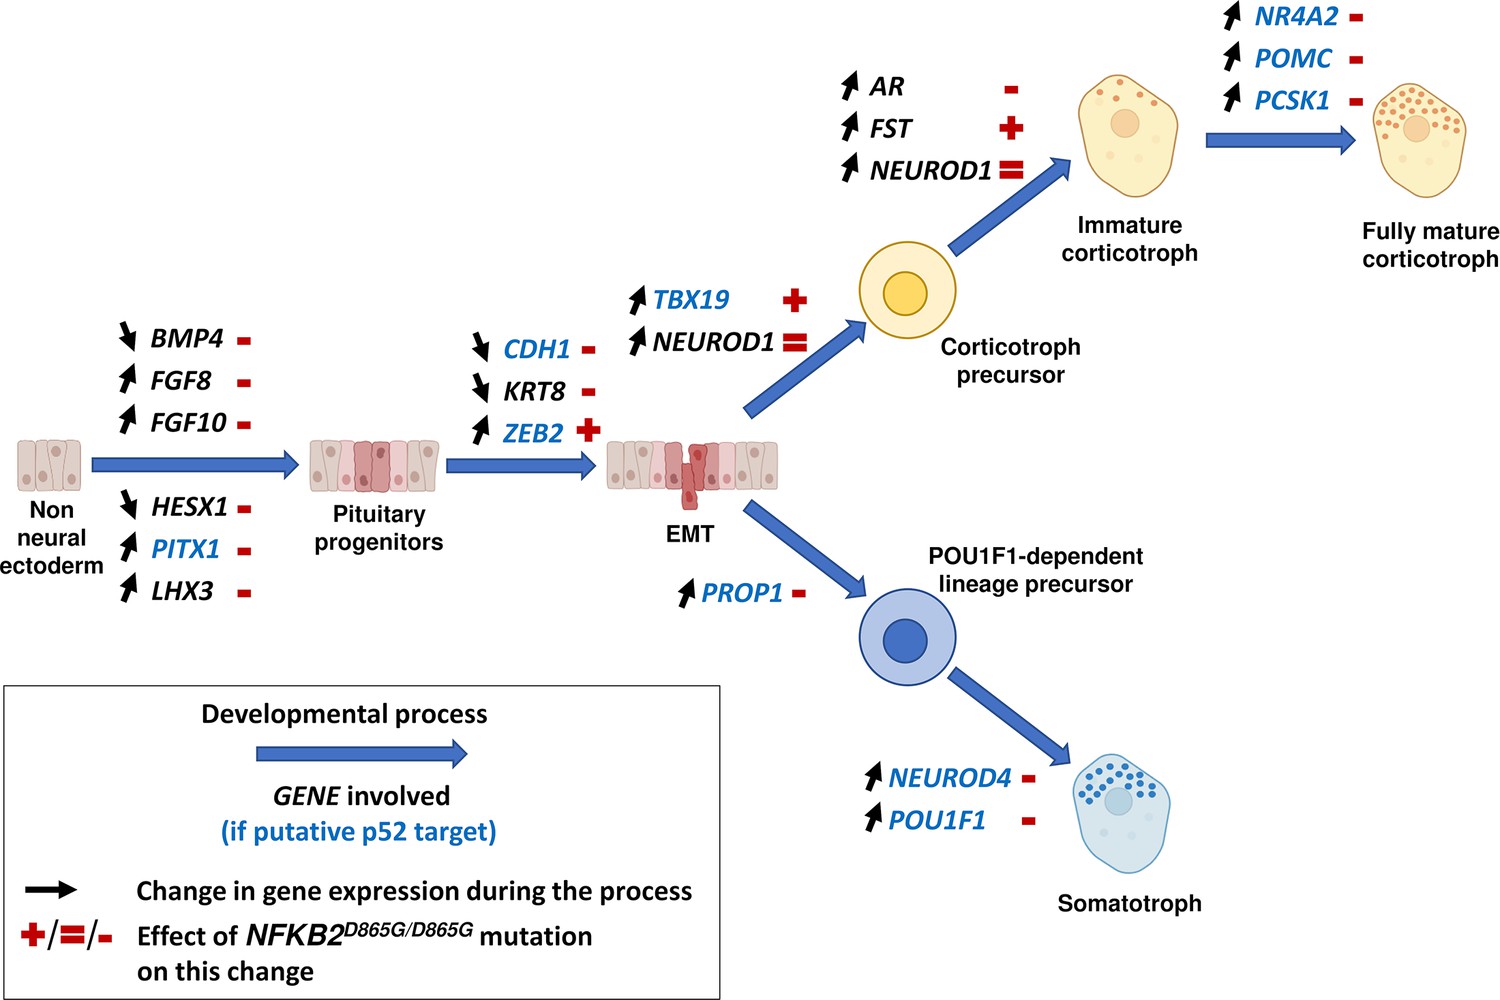
Changes in gene expression induced by nuclear factor kappa-B subunit 2 (NFKB2)D865G/D865G mutation during hypothalamic-pituitary organoid development.
Diagram illustrating changes in gene expression (black arrows) associated with different stages of normal hypothalamic-pituitary organoids development and cell differentiation (large blue arrows). The NFKB2D865G/D865G mutation perturbs these changes (+/=/- signs in red), possibly through direct transcriptional control for genes indicated in blue.
Tables
Table 1
RNA-seq expression data for a list of 144 genes known from the literature to have a functional influence on pituitary-hypothalamic development.
Differentially expressed genes (padj <0.05) in nuclear factor kappa-B subunit 2 (NFKB2) KI organoids are highlighted in green when upregulated and in orange when downregulated. FC; Fold change.
| Gene name | FC | padj | Gene name | FC | padj | Gene name | FC | padj |
|---|---|---|---|---|---|---|---|---|
| ADCYAP1 | 0,447 | 0,00789 | GLI3 | 1,279 | 0,10094 | PITX2 | 1,072 | 0,86688 |
| AIP | 0,898 | 0,53442 | GNAS | 1,058 | 0,39519 | POLR3A | 1,014 | 0,90718 |
| ALDH1A1 | 0,153 | 1,3E-09 | GNRHR | 0,453 | 8,3E-05 | POMC | 0,434 | 0,0036 |
| ALDH1A2 | 0,152 | 4,6E-05 | GNRHR2 | 0,698 | 0,23938 | POU1F1 | 0,039 | 0,00072 |
| ALDH1A3 | 0,182 | 2,6E-13 | GPR101 | 1,209 | 0,83045 | POU3F1 | 1,374 | 0,42093 |
| AR | 0,634 | 0,00168 | GREB1 | 1,007 | 0,97784 | POU3F2 | 0,266 | 1,4E-05 |
| ARNT2 | 0,534 | 0,00027 | GSX1 | 0,659 | 0,45012 | POU5F1 | 3,573 | 0,17018 |
| ASCL1 | 0,345 | 1,4E-06 | HES1 | 0,663 | 0,02805 | PROKR2 | 1,056 | 0,97365 |
| AXIN2 | 1,296 | 0,05889 | HESX1 | 2,193 | 0,03121 | PROP1 | 0,054 | 0,00071 |
| BMP2 | 0,750 | 0,34278 | HEY1 | 0,804 | 0,13046 | RAX | 0,599 | 0,02697 |
| BMP4 | 4,357 | 2,4E-05 | HMGA2 | 0,775 | 0,19471 | RBPJ | 0,814 | 0,04665 |
| BMPR1A | 1,019 | 0,91991 | INHBB | 0,458 | 0,03974 | S100B | 0,304 | 2,2E-05 |
| BRAF | 0,892 | 0,48183 | ISL1 | 1,097 | 0,75812 | SALL1 | 1,106 | 0,76122 |
| CDH1 | 1,626 | 0,009 | KRT8 | 2,617 | 2E-06 | SHH | 0,786 | 0,51179 |
| CGA | 12,756 | 0,04234 | LATS1 | 0,857 | 0,01997 | SIX1 | 0,219 | 8,4E-06 |
| CREB1 | 0,850 | 0,12901 | LATS2 | 1,460 | 0,01663 | SIX2 | 0,161 | 9E-09 |
| CRH | 4,347 | 0,00469 | LHX2 | 0,622 | 0,00625 | SIX3 | 0,859 | 0,69976 |
| CRHR1 | 0,156 | 0,05131 | LHX3 | 0,064 | 2,4E-06 | SIX6 | 0,467 | 0,00586 |
| CRHR2 | 0,823 | 0,73602 | LHX4 | 0,557 | 0,00398 | SLC15A2 | 0,624 | 0,00164 |
| CTNNB1 | 1,009 | 0,95542 | MEN1 | 1,030 | 0,80309 | SLC6A3 | 2,215 | 0,15797 |
| CYP11A1 | 6,086 | 0,00166 | MSX1 | 0,904 | 0,90909 | SMO | 0,957 | 0,70401 |
| DIO2 | 1,114 | 0,71885 | NANOG | 6,301 | 0,00472 | SMOC2 | 4,163 | 0,03488 |
| DISP1 | 1,142 | 0,47708 | NEUROD1 | 0,883 | 0,50966 | SOX11 | 0,736 | 0,12757 |
| DLK1 | 0,594 | 0,01988 | NEUROD2 | 1,137 | 0,84178 | SOX2 | 0,815 | 0,42151 |
| DMRTA2 | 0,144 | 3,6E-11 | NEUROD4 | 0,320 | 1,7E-05 | SOX3 | 0,787 | 0,50152 |
| DRD2 | 2,753 | 2E-05 | NEUROG1 | 0,493 | 0,19209 | SOX9 | 0,557 | 0,00214 |
| DUOX2 | 2,595 | 0,01961 | NEUROG2 | 0,208 | 0,03165 | SRD5A1 | 0,961 | 0,79794 |
| DZIP1 | 0,818 | 0,04264 | NFKB2 | 1,236 | 0,16144 | SST | 0,994 | 0,9921 |
| EGR1 | 1,784 | 0,15768 | NKX2-1 | 0,707 | 0,15518 | SSTR1 | 0,509 | 0,09008 |
| EPCAM | 1,128 | 0,72728 | NKX2-2 | 1,569 | 0,37322 | SSTR2 | 0,769 | 0,43599 |
| ETS1 | 3,947 | 4,8E-13 | NOG | 1,376 | 0,31897 | TAZ | 0,967 | 0,85318 |
| EYA1 | 0,514 | 0,03962 | NOTCH1 | 1,006 | 0,98289 | TBX19 | 0,663 | 0,01294 |
| FGF10 | 0,267 | 3,5E-09 | NOTCH2 | 0,937 | 0,60691 | TBX3 | 0,997 | 0,98911 |
| FGF2 | 1,224 | 0,18237 | NR0B1 | 1,062 | 0,92893 | TCF4 | 1,015 | 0,95769 |
| FGF3 | 0,611 | 0,08445 | NR3C1 | 0,846 | 0,30279 | TCF7L2 | 1,178 | 0,58844 |
| FGF8 | 0,506 | 0,04827 | NR4A1 | 1,227 | 0,62126 | TFAP2A | 2,887 | 0,00173 |
| FOLR1 | 2,729 | 0,03443 | NR4A2 | 0,407 | 0,00078 | TGIF1 | 1,422 | 0,00278 |
| FOXA1 | 0,550 | 0,02193 | NR5A1 | 0,834 | 0,61396 | THRA | 0,714 | 0,00712 |
| FOXC1 | 1,619 | 0,11818 | NUPR1 | 1,384 | 0,3477 | THRB | 2,260 | 0,00025 |
| FOXJ1 | 0,424 | 0,00117 | OLFM1 | 0,830 | 0,29166 | TIPRL | 0,810 | 0,00393 |
| FOXO1 | 1,494 | 0,00782 | OTP | 0,663 | 0,19349 | TLE5 | 0,695 | 0,00502 |
| FST | 2,384 | 9,1E-06 | OTX1 | 0,863 | 0,72226 | TSHR | 0,998 | 0,99753 |
| GATA2 | 5,579 | 9,7E-11 | OTX2 | 0,976 | 0,94713 | USP39 | 1,035 | 0,7908 |
| GATA3 | 4,758 | 0,00483 | PAX3 | 0,362 | 0,11963 | WNT4 | 0,712 | 0,11665 |
| GHRH | 0,712 | 0,65053 | PAX6 | 0,294 | 0,00059 | WNT5A | 1,442 | 0,29543 |
| GHRHR | 0,672 | 0,48512 | PAX7 | 0,570 | 0,1882 | YAP1 | 1,091 | 0,56585 |
| GLI1 | 1,050 | 0,84104 | PCSK1 | 0,354 | 0,00033 | ZBTB20 | 0,354 | 5,3E-10 |
| GLI2 | 1,328 | 0,1593 | PITX1 | 0,299 | 6,3E-07 | ZEB2 | 1,378 | 0,01078 |
Table 2
Differential expression analysis for genes associated with different stages of epithelial to mesenchymal transition in nuclear factor kappa-B subunit 2 (NFKB2)D865G/D865G vs wild-type (WT) organoids.
Significantly decreased and increased expressions are highlighted in orange and green, respectively. FC, Fold change.
| Stemness markers | Epithelial markers | Mesenchymal markers | ||||||
|---|---|---|---|---|---|---|---|---|
| Gene name | FC | padj | Gene name | FC | padj | Gene name | FC | padj |
| SOX2 | 0,815 | 0,4215 | CDH1 | 1,626 | 0,0090 | CDH2 | 0,616 | 0,0003 |
| SOX4 | 0,784 | 0,0245 | EPCAM | 1,128 | 0,7273 | SNAI1 | 3,379 | 7,14E-06 |
| SOX9 | 0,557 | 0,0021 | KRT8 | 2,617 | 1,98E-06 | VIM | 0,663 | 0,0366 |
| NOTCH2 | 0,937 | 0,6069 | CLDN4 | 1,203 | 0,3140 | COL2A1 | 1,662 | 0,0849 |
| HES1 | 0,663 | 0,0280 | GRHL2 | 1,360 | 0,1920 | COL1A1 | 10,939 | 7,76E-06 |
Key resources table
| Reagent type (species) or resource | Designation | Source or reference | Identifiers | Additional information |
|---|---|---|---|---|
| Cell line (Homo sapiens) | Human induced pluripotent stem cells | MaSC Platform, MMG UMR1251, INSERM-AMU | 10742 L | Reprogrammed from fibroblasts (Coriell, female, 82yo) |
| Other | Synthemax II-SC Substrate | Corning | #3335 | Cell culture matrix |
| Other | StemMACS hiPSC-Brew XF human medium | MACS Miltenyi Biotec | #130-104-368 | Cell culture medium |
| Other | Knockout Serum Replacement | Thermo Fisher Scientific | #10828028 | Cell culture reagent |
| Recombinant protein | Human BMP-4 | Peprotech | #AF-120-05ET | |
| Drug | Smoothened Agonist | Sigma-Aldrich/Merck | #SML 1314 | |
| Peptide | AlbumiNZ Bovine Albumin Low IgG | MP Biomedicals | #0219989790 | |
| Sequence-based reagent | ligonucleotides used for CRISPR/Cas9 experiments to target TBX19K146R | This paper | TBX19 sgRNA | AAGCTGACCAACAAGCTCAA |
| Sequence-based reagent | ligonucleotides used for CRISPR/Cas9 experiments to target TBX19K146R | This paper | TBX19 sgRNA oligo up | 5’-CACCGAAGCTGACCAACAAGCTCAA-3’ |
| Sequence-based reagent | ligonucleotides used for CRISPR/Cas9 experiments to target TBX19K146R | This paper | TBX19 sgRNA oligo down | 5’-AAACTTGAGCTTGTTGGTCAGCTTC-3’ |
| Sequence-based reagent | ligonucleotides used for CRISPR/Cas9 experiments to target TBX19K146R | This paper | TBX19 ssODN | TGGATGAAAGCTCCCATCTCCTTCAG CAAAGTGAGGCTGACCAACAAGTTaAA TGGAGGCGGGCAGGTACGAATGAGG CGGGCAGGCCTGGCCACCCGCT |
| Sequence-based reagent | primers used for PCR analyses, CAPS assay, and Sanger Sequencing | This paper | TBX19 fwd | CCCCTGGACAAGGTGAGAGTT |
| Sequence-based reagent | primers used for PCR analyses, CAPS assay, and Sanger Sequencing | This paper | TBX19 rev | GACTCCCGGGAATAATTGGCTTC |
| Sequence-based reagent | ligonucleotides used for CRISPR/Cas9 experiments to target NFKB2D865G | This paper | NFKB2 sgRNA | GTGAAGGAAGACAGTGCGTA |
| Sequence-based reagent | ligonucleotides used for CRISPR/Cas9 experiments to target NFKB2D865G | This paper | NFKB2 sgRNA oligo up | 5’-CACCGTGAAGGAAGACAGTGCGTA-3’ |
| Sequence-based reagent | ligonucleotides used for CRISPR/Cas9 experiments to target NFKB2D865G | This paper | NFKB2 sgRNA oligo down | 5’-AAACTACGCACTGTCTTCCTTCAC-3’ |
| Sequence-based reagent | ligonucleotides used for CRISPR/Cas9 experiments to target NFKB2D865G | This paper | NFKB2 ssODN | TCCCATTCCTGTCCCCATTTACCCCC AGCAGAGGTGAAGGAAGGCAGTGCC TACGGGAGCCAGTCAGTGGAGCAGG AGGCAGAGAAGCTGGGCCCACCCC |
| Sequence-based reagent | primers used for PCR analyses, CAPS assay, and Sanger Sequencing | This paper | NFKB2 fwd | CCCTAACCATGACTCAGACCTCA |
| Sequence-based reagent | primers used for PCR analyses, CAPS assay, and Sanger Sequencing | This paper | NFKB2 rev | CCTCCCCTTCCCATGAGAATCC |
| Antibody | Anti-human NFKB2 (p100/p52) Rabbit polyclonal | Sigma, | HPA008422 RRID:AB_1854434 | (1/500) |
| Antibody | Anti-human LHX3 Mouse monoclonal | DSHB | 67.4E12 RRID:AB_2135805 | (1/500) |
| Antibody | Anti-human TBX19 Rabbit polyclonal | Sigma, | HPA072686 RRID:AB_2732209 | (1/300) |
| Antibody | Anti-human ACTH Guinea pig polyclonal | NIDDK | (1/2000) | |
| Antibody | Anti-human E-human cadherin Rat monoclonal | Millipore, | MABT26 RRID:AB_10807576 | (1/500) |
| Antibody | Anti-human NKX2.1 Mouse monoclonal | Millipore, | MAB5460 RRID:AB_571072 | (1/500) |
| Antibody | Anti-human PITX1 Rabbit polyclonal | Sigma, | HPA008743 RRID:AB_1855413 | (1/500) |
Additional files
-
Supplementary file 1
Detailed lists of cell lines, oligonucleotides, PCR settings and antibodies used in this article.
(a) hiPSC control line used in the study. (b) List of oligonucleotides used for CRISPR/Cas9 experiments to target TBX19K146R. (c) List of oligonucleotides used for CRISPR/Cas9 experiments to target NFKB2D865G. (d) List of primers used for PCR analyses, CAPS assay, and Sanger Sequencing. (e) PCR settings for TBX19. (f) PCR settings for NFKB2. (g) List of primers used for qRT-PCR. (h) List of primary antibodies used for immunostainings.
- https://cdn.elifesciences.org/articles/90875/elife-90875-supp1-v1.docx
-
MDAR checklist
- https://cdn.elifesciences.org/articles/90875/elife-90875-mdarchecklist1-v1.docx
Download links
A two-part list of links to download the article, or parts of the article, in various formats.
Downloads (link to download the article as PDF)
Open citations (links to open the citations from this article in various online reference manager services)
Cite this article (links to download the citations from this article in formats compatible with various reference manager tools)
Modeling corticotroph deficiency with pituitary organoids supports the functional role of NFKB2 in human pituitary differentiation
eLife 12:RP90875.
https://doi.org/10.7554/eLife.90875.3


