Tissue-specific O-GlcNAcylation profiling identifies substrates in translational machinery in Drosophila mushroom body contributing to olfactory learning
- Hunan Key Laboratory of Molecular Precision Medicine, Department of Oncology, Xiangya Hospital & Center for Medical Genetics, School of Life Sciences, Central South University, China
- Life Sciences Institute, Zhejiang University, Hangzhou, China
- State Key Laboratory of Chemo/Biosensing and Chemometrics, College of Biology, Hunan University, China
- National Clinical Research Center for Geriatric Disorders, Xiangya Hospital, Central South University, China
- Department of Molecular Biology and Genetics, University of Aarhus, Denmark
- The Biobank of Xiangya Hospital, Central South University, China
Figures
Figure 1 with 1 supplement
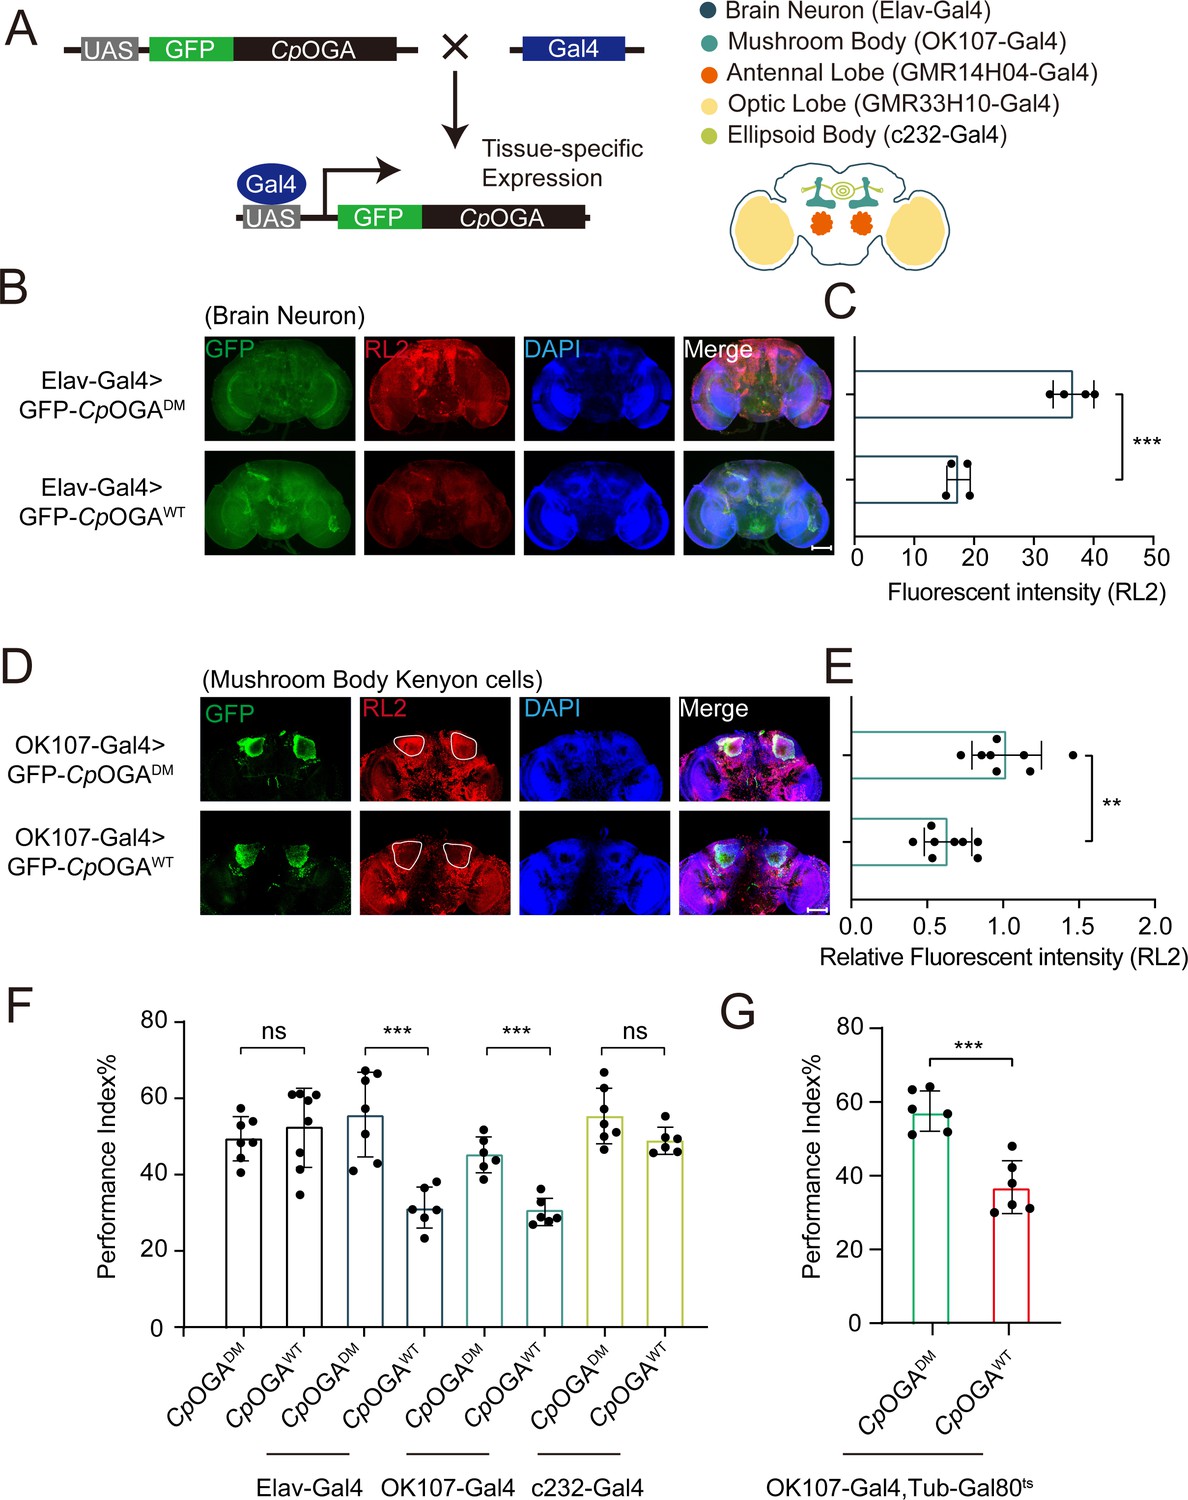
Downregulation of protein O-GlcNAcylation level in brain or mushroom body neurons affects olfactory learning of adult flies.
(A) Scheme for expression of CpOGAWT or CpOGADM in various Drosophila brain structures using different Gal4 drivers. (B) Immunostaining of adult Drosophila brains. Brains were stained with anti-O-GlcNAc antibody RL2 (red) to assess O-GlcNAcylation level, and anti-GFP (green) antibody to validate tissue-specific expression of CpOGA. Nuclei were stained with DAPI (blue). Scale bar: 100 μm. (C) Quantification of fluorescent intensity of O-GlcNAc staining in CpOGAWT or CpOGADM expressed brains. n = 4. (D) Immunostaining of adult Drosophila brains. Outlined areas indicate the cell bodies of Kenyon cells in mushroom body. Scale bar: 100 μm. (E) Quantification of relative fluorescent intensity of O-GlcNAc staining in CpOGAWT or CpOGADM expressed brain structures. n = 8. (F) A compilation of performance index in learning test of the indicated flies expressing either CpOGAWT or CpOGADM. n = 6-8. (G) A compilation of learning performance index of flies expressing CpOGAWT or CpOGADM only in the mushroom body at adult stage. n = 6. Each datapoint represents an independent experiment with approximately 200 flies. p-values were determined by unpaired t-test, and the stars indicate significant differences (***p<0.001, **p<0.01 and ns, not significant, p≥0.05). Error bars represent SD.
-
Figure 1—source data 1
Excel spreadsheet containing source data used to generate Figure 1C–G.
- https://cdn.elifesciences.org/articles/91269/elife-91269-fig1-data1-v2.zip
Figure 1—figure supplement 1

Impacts of reduction of O-GlcNAcylation in different brain structures on odor acuity towards 4-methylcyclohexanol (MCH) or octanol (OCT).
(A–B) Bar graphs showing the odor acuity performance index of flies expressing CpOGAWT or CpOGADM in the indicated brain regions. n = 6-8. p values were determined by unpaired t-test, the stars indicate significant differences (***p<0.001, **p<0.01, *p<0.05, and ns, not significant, p≥0.05). Error bars represent SD. (C) Schematic of Drosophila learning test. Black spots represent flies. In one trial, about 100 flies were trained to associate one of the two aversive odors (MCH or OCT) with electric shock on the upper part of a T-maze, and tested for odor preference on the lower part of the T-maze. Each independent experiment consisted of two trials with different odors coupled to the electric shock. The mean PI was calculated and plotted as one datapoint. (D) Temperature shifting scheme for Gal80ts restricted expression of Clostridium perfringens OGA (CpOGA) till adulthood.
-
Figure 1—figure supplement 1—source data 1
Excel spreadsheet containing source data used to generate Figure 1—figure supplement 1A–B.
- https://cdn.elifesciences.org/articles/91269/elife-91269-fig1-figsupp1-data1-v2.zip
Figure 2 with 1 supplement
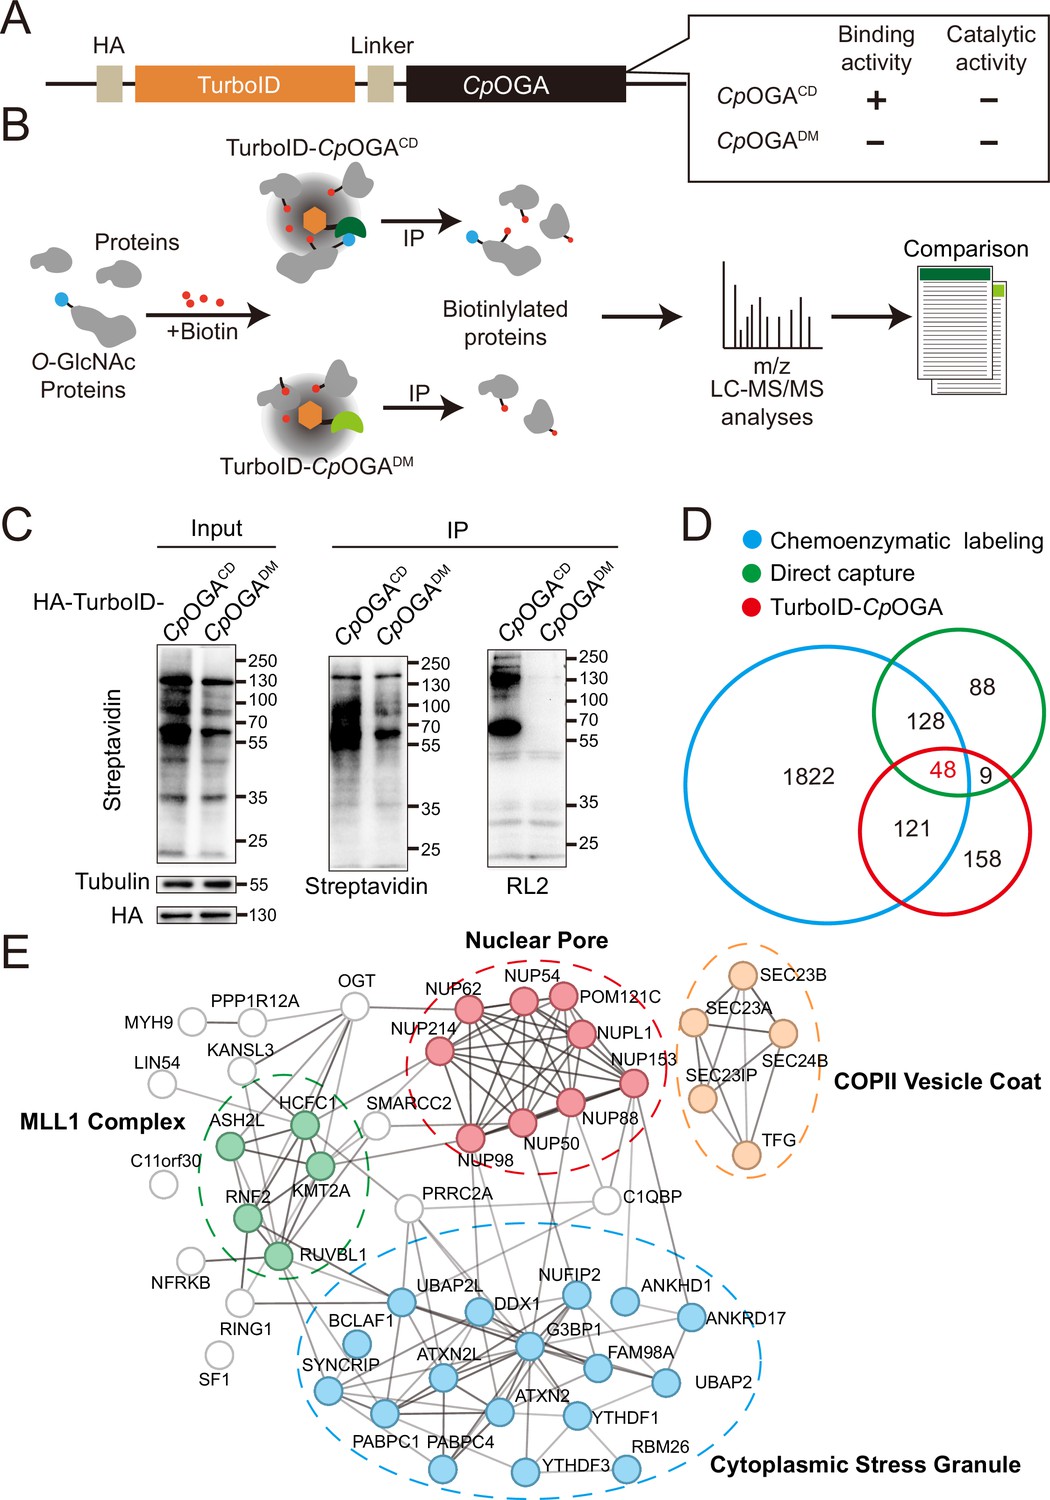
TurboID-CpOGACD mediated proximity labeling of O-GlcNAc substrates in HEK293T cells.
(A) Diagram of the constructs used for the expression of TurboID-CpOGACD/DM. (B) Schematic representation of TurboID-CpOGACD based profiling strategy. In the presence of biotin, TurboID biotinylates the CpOGACD-bound O-GlcNAc proteins, which can be further purified by streptavidin pull-down for mass spectrometry (MS) identification. TurboID-CpOGADM is used as a negative control for O-GlcNAc-independent protein-protein interactions. (C) Immunoprecipitation of biotinylated proteins from HEK293T cell lysates using streptavidin-magnetic beads. Biotinylation was detected by immunoblotting with streptavidin-HRP, and O-GlcNAcylation with anti-O-GlcNAc antibody (RL2). The expression of TurboID-CpOGACD/DM was verified by anti-HA immunoblotting. (D) Venn diagram showing the overlap of potentially O-GlcNAcylated proteins identified with TurboID-CpOGA versus that with another two commonly used methods. (E) STRING visualization of protein-protein interaction network of the 48 highly-confident O-GlcNAc substrates in HEK293T cells.
-
Figure 2—source data 1
Raw data of all western blots for Figure 2.
- https://cdn.elifesciences.org/articles/91269/elife-91269-fig2-data1-v2.zip
-
Figure 2—source data 2
Complete and uncropped membranes of all western blots for Figure 2.
- https://cdn.elifesciences.org/articles/91269/elife-91269-fig2-data2-v2.zip
-
Figure 2—source data 3
Excel spreadsheet containing source data used to generate Figure 2C.
- https://cdn.elifesciences.org/articles/91269/elife-91269-fig2-data3-v2.zip
Figure 2—figure supplement 1

Validation and optimization of TurboID-CpOGACD mediated intracellular labeling.
(A–B) Determination of the optimal biotin concentration and incubation time for TurboID-CpOGACD labeling in HEK293T cells. Biotinylated proteins were detected by immunoblotting with streptavidin-HRP. (C–D) Immunoblotting of cells treated with Thiamet-G or OSMI-1 using anti-O-GlcNAc antibody (RL2) or streptavidin-HRP. The expression of TurboID-CpOGACD/DM was detected by anti-HA immunoblotting. (E) Bubble plot showing the Gene Ontology (GO) enrichment analysis of candidate O-GlcNAcylated substrates identified by the indicated methods. Bubble color indicates the -log10 (p-value), and bubble size represents the ratio of genes in each category.
-
Figure 2—figure supplement 1—source data 1
Raw data of all western blots for Figure 2—figure supplement 1.
- https://cdn.elifesciences.org/articles/91269/elife-91269-fig2-figsupp1-data1-v2.zip
-
Figure 2—figure supplement 1—source data 2
Complete and uncropped membranes of all western blots for Figure 2—figure supplement 1.
- https://cdn.elifesciences.org/articles/91269/elife-91269-fig2-figsupp1-data2-v2.zip
-
Figure 2—figure supplement 1—source data 3
Excel spreadsheet containing source data used to generate Figure 2—figure supplement 1A–E.
- https://cdn.elifesciences.org/articles/91269/elife-91269-fig2-figsupp1-data3-v2.zip
Figure 3 with 1 supplement
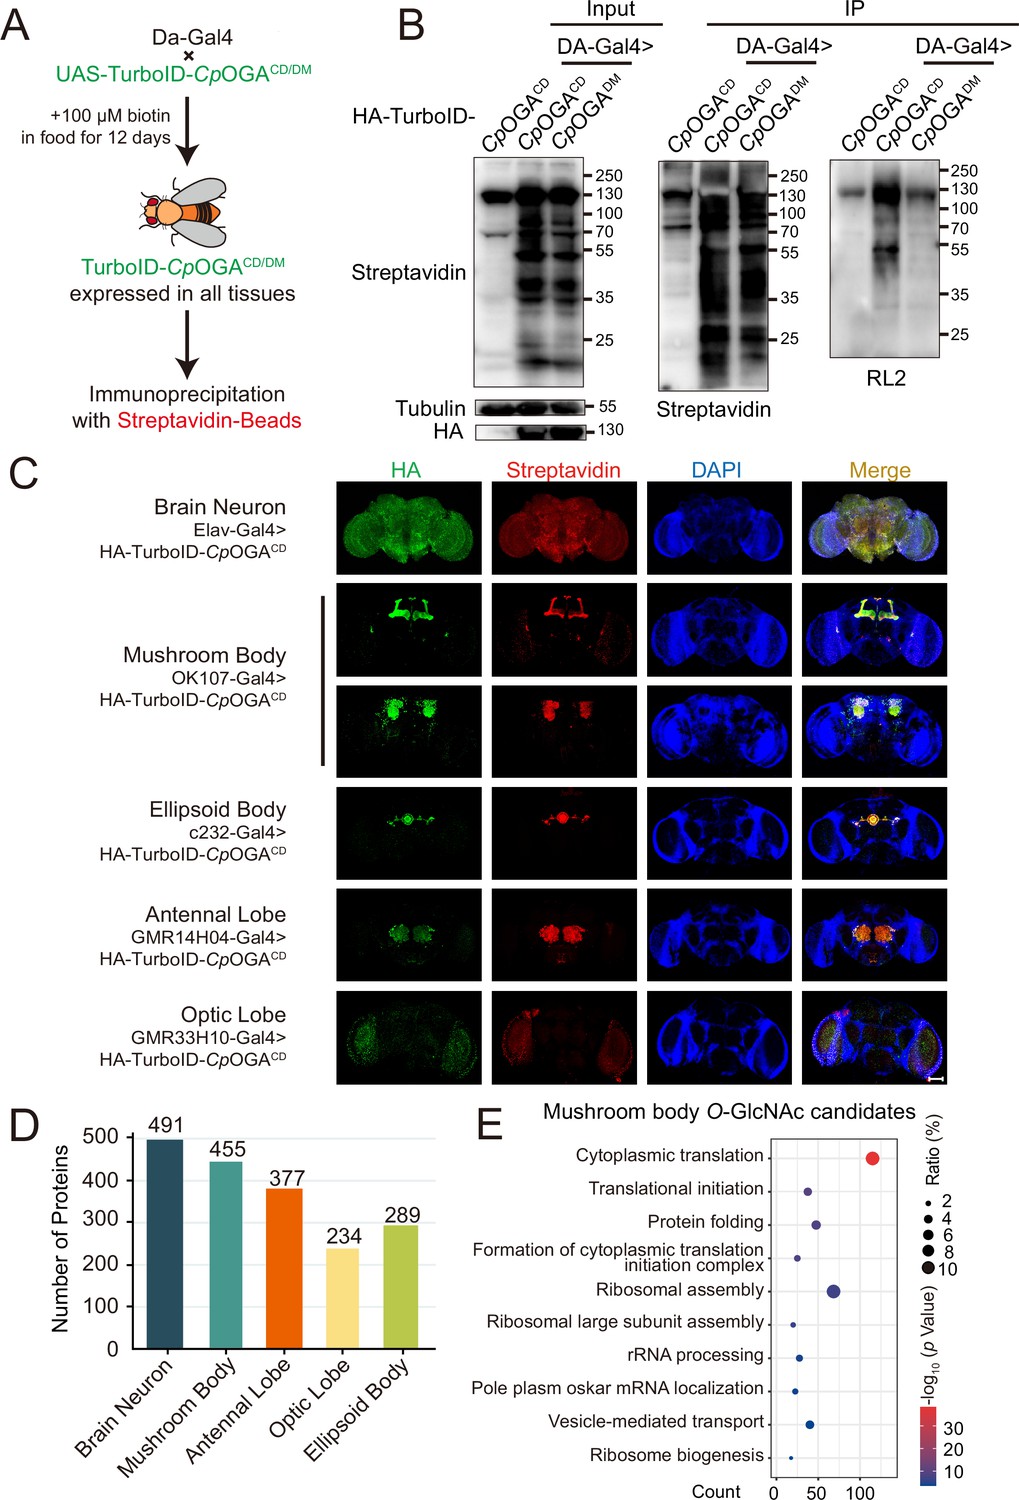
Identification of O-GlcNAc candidate substrates in different Drosophila brain structures using TurboID-Clostridium perfringens OGA (CpOGA).
(A) Scheme for validating TurboID-CpOGACD/DM in flies. (B) Immunoprecipitation of biotinylated proteins from flies. Biotinylation was detected by immunoblotting with streptavidin-HRP, and O-GlcNAcylation with anti-O-GlcNAc antibody (RL2). The expression of TurboID-CpOGACD/DM was validated by anti-HA immunoblotting. (C) Immunostaining of Drosophila brains expressing TurboID-CpOGACD in different brain structures. Biotinylated proteins were stained with streptavidin-Cy3 (red), and TurboID-CpOGACD with anti-HA antibody. Nuclei were visualized by DAPI (blue). Scale bar: 100 μm. (D) Bar graph showing the number of O-GlcNAcylated protein candidates identified from different brain structures of Drosophila. (E) Gene Ontology (GO) enrichment analysis of O-GlcNAcylated protein candidates detected in the mushroom body. Bubble color indicates the -log10 (p-value), and bubble size represents the ratio of genes in each category.
-
Figure 3—source data 1
Raw data of all western blots for Figure 3.
- https://cdn.elifesciences.org/articles/91269/elife-91269-fig3-data1-v2.zip
-
Figure 3—source data 2
Complete and uncropped membranes of all western blots for Figure 3.
- https://cdn.elifesciences.org/articles/91269/elife-91269-fig3-data2-v2.zip
-
Figure 3—source data 3
Excel spreadsheet containing source data used to generate Figure 3B–E.
- https://cdn.elifesciences.org/articles/91269/elife-91269-fig3-data3-v2.zip
Figure 3—figure supplement 1
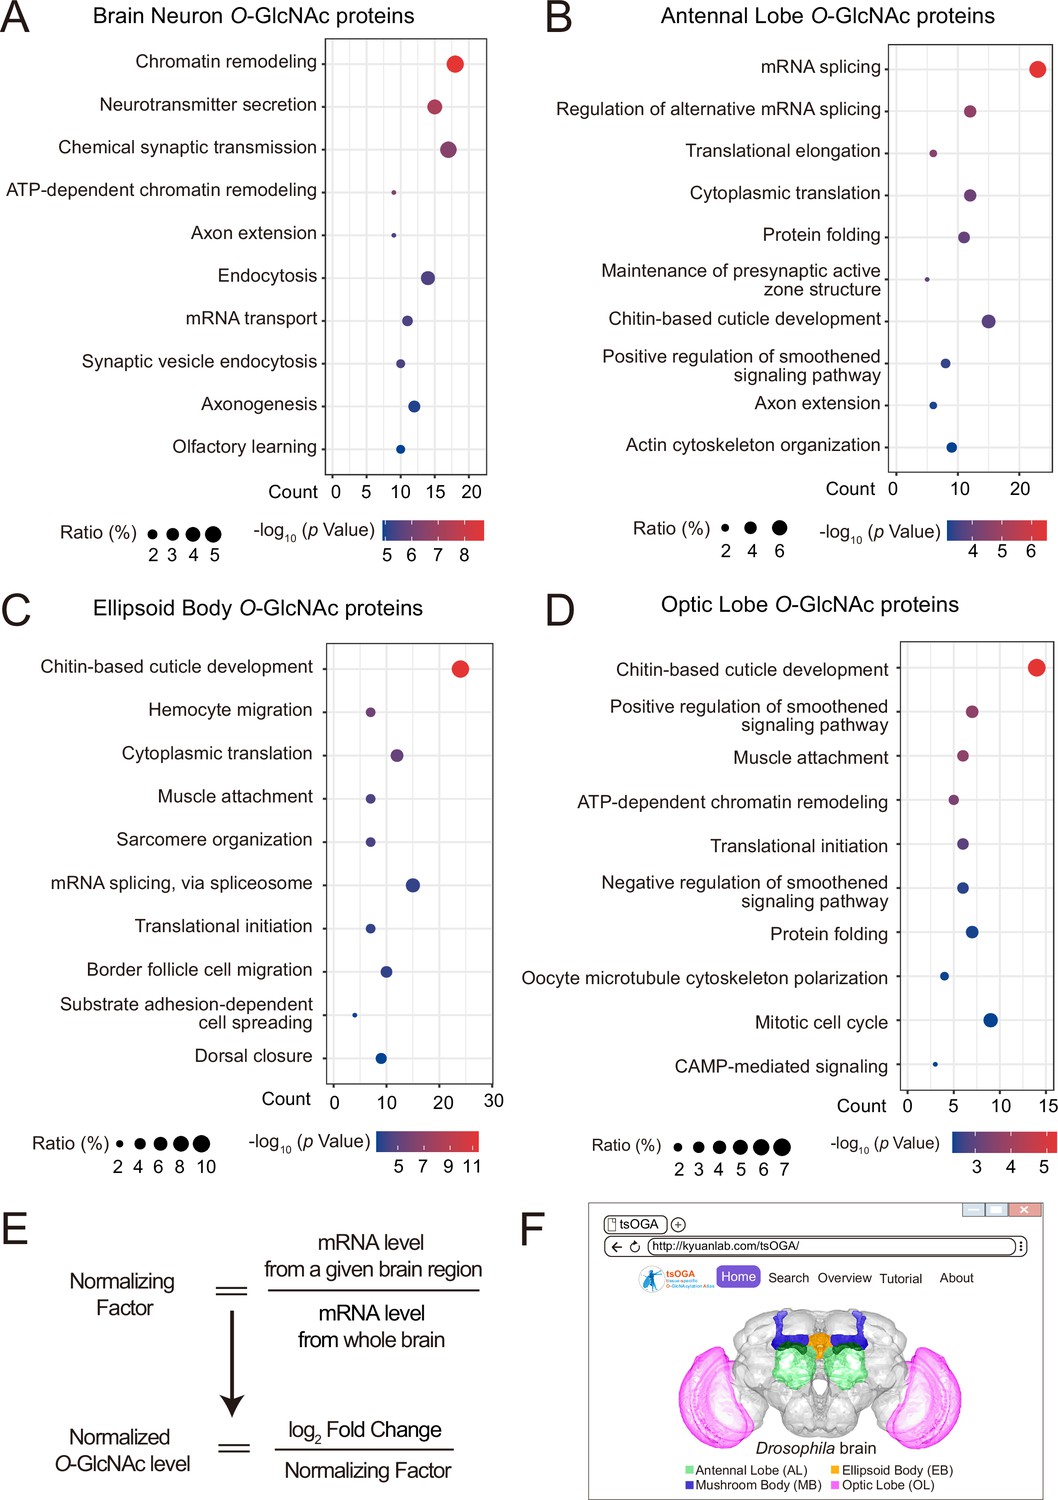
GO analysis of candidate O-GlcNAc substrates from different brain regions of Drosophila.
(A–D) Gene Ontology (GO) enrichment analysis of potentially O-GlcNAcylated proteins in whole brain neurons (A), antennal lobe (B), ellipsoid body (C), and optic lobe (D). Bubble color indicates the -log10 (p-value), and bubble size represents the ratio of genes in each category. (E) Strategy to normalize the O-GlcNAcylated protein level with expression level for each candidate substrate in different brain regions. A normalizing factor for each substrate in a given brain region was calculated using single-cell RNA-seq expression data, and the adjusted O-GlcNAc level was determined as the log2 FC divided by its normalizing factor. (F) The front-page of the tsOGA (tissue-specific O-GlcNAcylation Atlas of Drosophila brain) website.
-
Figure 3—figure supplement 1—source data 1
Excel spreadsheet containing source data used to generate Figure 3—figure supplement 1A–D.
- https://cdn.elifesciences.org/articles/91269/elife-91269-fig3-figsupp1-data1-v2.zip
Figure 4 with 1 supplement
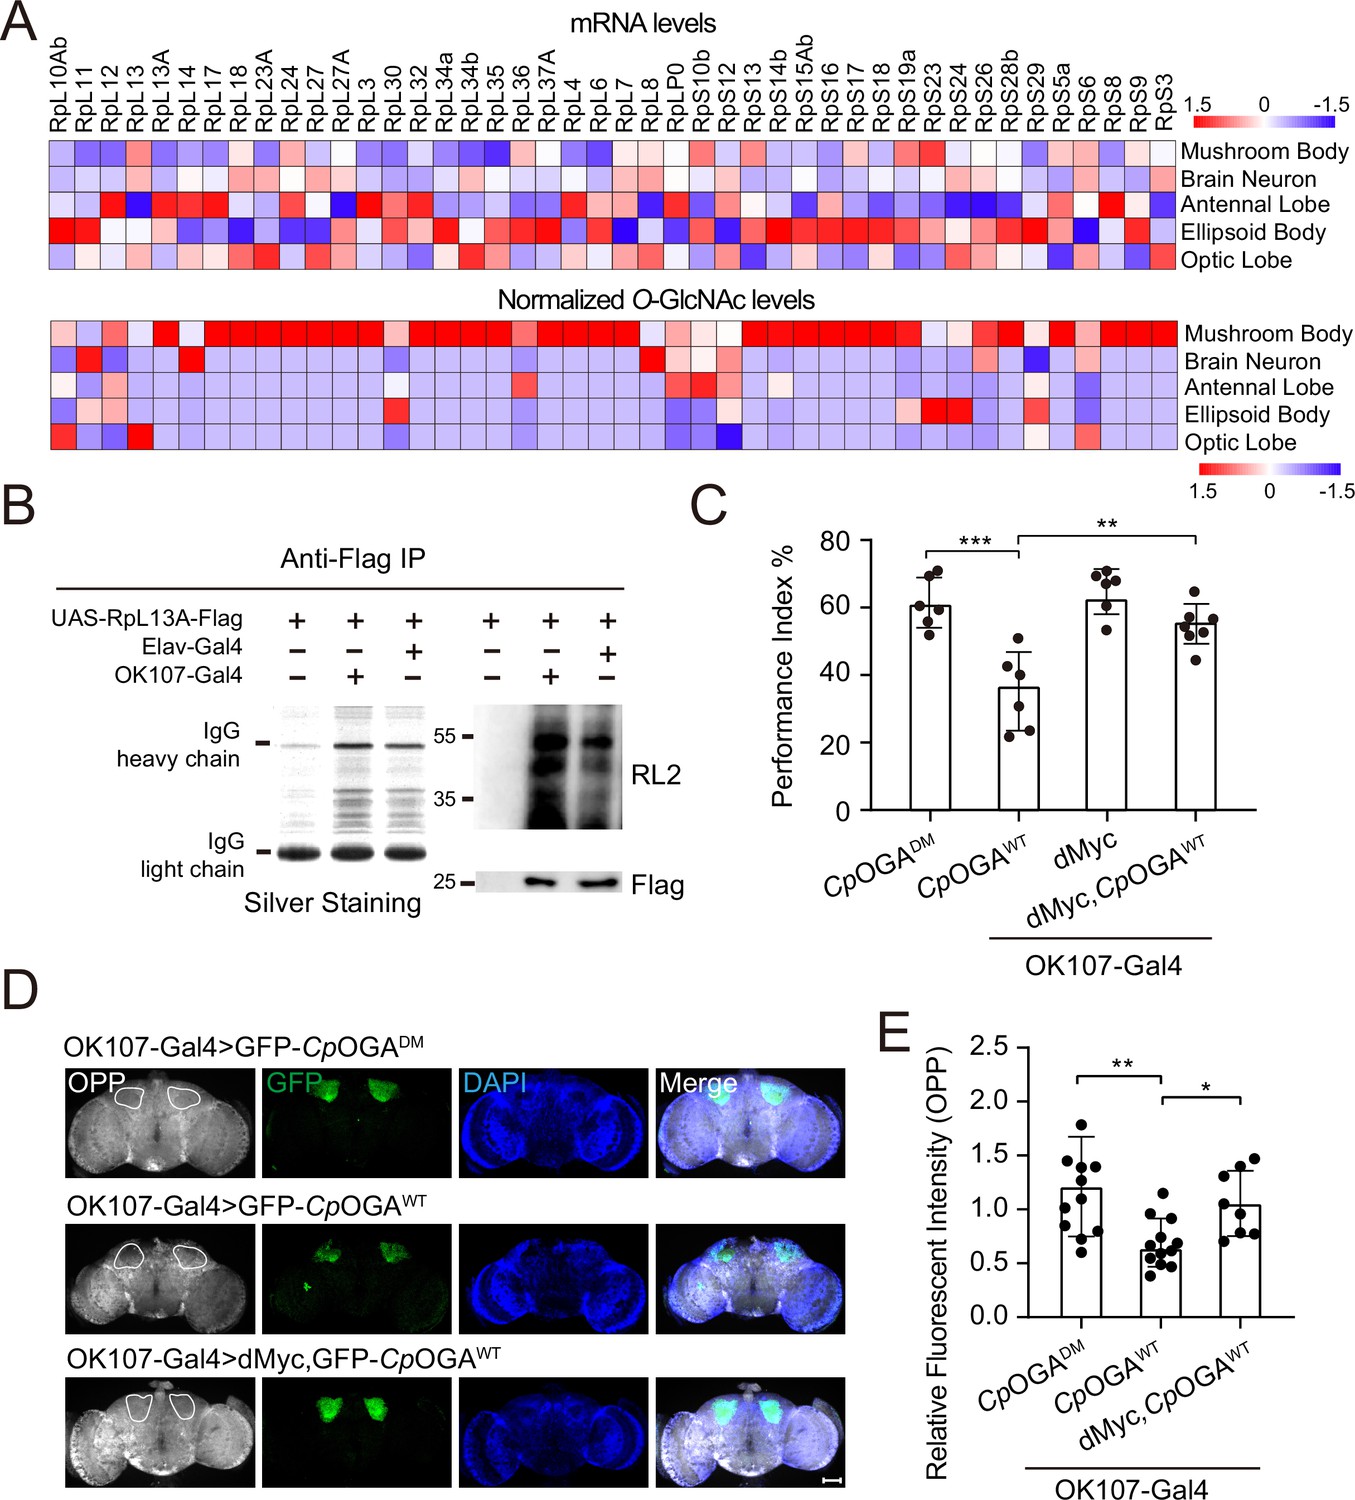
O-GlcNAcylation is required for proper protein synthesis activity and olfactory learning.
(A) Heatmaps showing the mRNA levels (upper) and the normalized O-GlcNAc levels (lower) of the identified ribosomal candidates in different brain regions. (B) Immunoprecipitation of ribosomes using FLAG-tagged RpL13A. The expression of RpL13A-FLAG was validated by immunoblotting with anti-FLAG antibody. Ribosomal proteins were visualized using silver staining, and O-GlcNAcylation of ribosomes was analyzed by immunoblotting with anti-O-GlcNAc antibody RL2. (C) A compilation of the performance index of the indicated flies in the learning test. Learning defect of flies expressing CpOGAWT was corrected by selective expression of dMyc in mushroom body. n = 6-7. Each datapoint represents an independent experiment with approximately 200 flies. (D) Ex vivo measurement of protein synthesis in mushroom body using the O-propargyl-puromycin (OPP) assay. Brains from the indicated flies were stained with anti-GFP (green) antibody to validate CpOGA expression, and OPP (gray) to quantify protein synthesis. Nuclei were visualized with DAPI (blue). Outlined areas indicate the cell bodies of Kenyon cells of mushroom body. Scale bar: 100 μm. (E) Quantification of relative OPP fluorescent intensity in mushroom body regions. n = 8-12. p-values were determined by unpaired t-test, the stars indicate significant differences (***p<0.001, **p<0.01, *p<0.05). Error bars represent SD.
-
Figure 4—source data 1
Raw data of all western blots for Figure 4.
- https://cdn.elifesciences.org/articles/91269/elife-91269-fig4-data1-v2.zip
-
Figure 4—source data 2
Complete and uncropped membranes of all western blots for Figure 4.
- https://cdn.elifesciences.org/articles/91269/elife-91269-fig4-data2-v2.zip
-
Figure 4—source data 3
Excel spreadsheet containing source data used to generate Figure 4A–E.
- https://cdn.elifesciences.org/articles/91269/elife-91269-fig4-data3-v2.zip
Figure 4—figure supplement 1
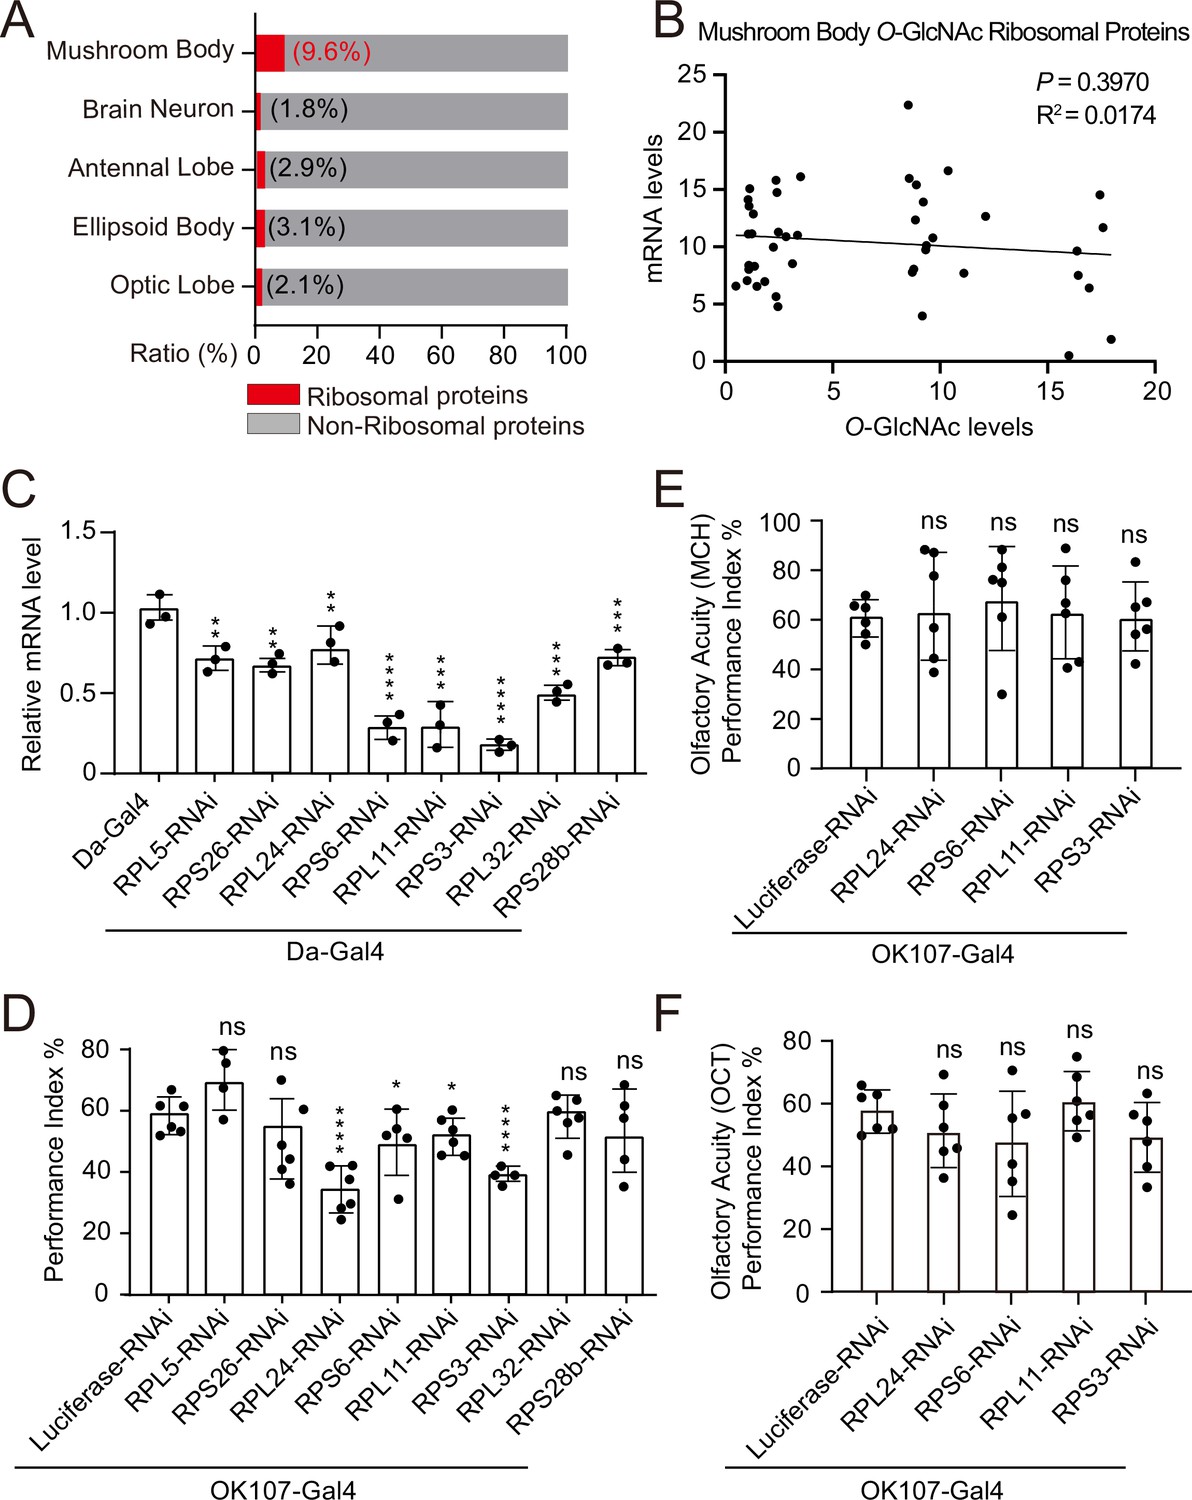
Weakened ribosomal activity in mushroom body impacts olfactory learning.
(A) Bar chart representing the proportion of ribosomal proteins in the O-GlcNAcome of different brain structures identified by TurboID-CpOGA. (B) Correlation analysis between mRNA levels and O-GlcNAc levels of candidate ribosomal substrates in mushroom body. Linear regression analysis was performed and no significance was noted (p≥0.05). (C) qPCR analysis of the indicated ribosomal components expression after shRNA-mediated knockdown. n = 3. (D) A compilation of the performance index of the control and ribosomal subunits knockdown flies in the learning test. n = 4-6. Each datapoint represents an independent experiment with approximately 200 flies. (E–F) Bar graphs showing the odor acuity performance index of the control and ribosomal subunits knockdown flies. n = 6. p values were determined by unpaired t-test, the stars indicate significant differences (***p<0.001, **p<0.01, *p<0.05, and ns, not significant, p≥0.05). Error bars represent SD.
-
Figure 4—figure supplement 1—source data 1
Excel spreadsheet containing source data used to generate Figure 4—figure supplement 1A–F.
- https://cdn.elifesciences.org/articles/91269/elife-91269-fig4-figsupp1-data1-v2.zip
Author response image 1

Schematic of the domain structures of human OGA, Drosophila OGA, and CpOGA.
The O-GlcNAcase activity resides in the GH domain (blue). The C-terminal of Drosophila OGA harbors a putative histone acetyltransferase domain (HAT-like). Residues 31–618 of CpOGA (corresponding to the GH domain plus an additional C-terminal) are used in this study.
Tables
Appendix 1—key resources table
| Reagent type (species) or resource | Designation | Source or reference | Identifiers | Additional information |
|---|---|---|---|---|
| Genetic reagent (Drosophila melanogaster) | UAS-HA-TurboID-CpOGACD | This paper | Expresses HA-TurboID-CpOGACD under the control of UAS. | |
| Genetic reagent (Drosophila melanogaster) | UAS-HA-TurboID-CpOGADM | This paper | Expresses HA-TurboID-CpOGADM under the control of UAS. | |
| Genetic reagent (Drosophila melanogaster) | UAS-GFP-CpOGAWT | This paper | Expresses GFP-CpOGAWT under the control of UAS. | |
| Genetic reagent (Drosophila melanogaster) | UAS-GFP-CpOGADM | This paper | Expresses GFP-CpOGADM under the control of UAS. | |
| Genetic reagent (Drosophila melanogaster) | Da-Gal4 | Bloomington Drosophila Stock Center | BDSC, #95282 | w[*]; P{w[+mW.hs]=GAL4 da.G32}2; P{w[+mW.hs]=GAL4 da.G32}UH1 |
| Genetic reagent (Drosophila melanogaster) | Elav-Gal4 | Bloomington Drosophila Stock Center | BDSC, #8765 | P{w[+mC]=GAL4 elav.L}2/CyO |
| Genetic reagent (Drosophila melanogaster) | OK107-Gal4 | Bloomington Drosophila Stock Center | BDSC, #854 | w[*]; P{w[+mW.hs]=GawB}OK107 ey[OK107]/In(4)ci[D], ci[D] pan[ciD] sv[spa-pol] |
| Genetic reagent (Drosophila melanogaster) | 201Y-Gal4 | Bloomington Drosophila Stock Center | BDSC, #4440 | w[1118]; P{w[+mW.hs]=GawB}Tab2[201Y] |
| Genetic reagent (Drosophila melanogaster) | C232-Gal4 | Bloomington Drosophila Stock Center | BDSC, #30828 | w[*]; P{w[+mW.hs]=GawB}Alp4[c232] |
| Genetic reagent (Drosophila melanogaster) | GMR14H04-Gal4 | Bloomington Drosophila Stock Center | BDSC, #48655 | w[1118]; P{y[+t7.7] w[+mC]=GMR14 H04-GAL4}attP2 |
| Genetic reagent (Drosophila melanogaster) | GMR33H10-Gal4 | Bloomington Drosophila Stock Center | BDSC, #49762 | w[1118]; P{y[+t7.7] w[+mC]=GMR33 H10-GAL4}attP2 |
| Genetic reagent (Drosophila melanogaster) | uas-RPL13A-FLAG | Bloomington Drosophila Stock Center | BDSC, #83684 | w[*]; P{w[+mC]=UAS-RpL13A.FLAG}3 |
| Genetic reagent (Drosophila melanogaster) | uas-dMyc | Bloomington Drosophila Stock Center | BDSC, #9674 | w[1118]; P{w[+mC]=UAS Myc.Z}132 |
| Genetic reagent (Drosophila melanogaster) | uas-shLuciferase | Bloomington Drosophila Stock Center | BDSC, #31603 | y[1] v[1]; P{y[+t7.7] v[+t1.8]=TRiP.JF01355}attP2 |
| Genetic reagent (Drosophila melanogaster) | uas-shRPL5 | TsingHua Fly Center (THFC) | THU0670 | |
| Genetic reagent (Drosophila melanogaster) | uas-shRPs26 | TsingHua Fly Center (THFC) | THU0747 | |
| Genetic reagent (Drosophila melanogaster) | uas-shRPL24 | TsingHua Fly Center (THFC) | THU1411 | |
| Genetic reagent (Drosophila melanogaster) | uas-shRPS6 | TsingHua Fly Center (THFC) | THU0864 | |
| Genetic reagent (Drosophila melanogaster) | uas-shRPL11 | TsingHua Fly Center (THFC) | TH201500769.S | |
| Genetic reagent (Drosophila melanogaster) | uas-shRPS3 | TsingHua Fly Center (THFC) | THU1958 | |
| Genetic reagent (Drosophila melanogaster) | uas-shRPL32 | TsingHua Fly Center (THFC) | TH201500773.S | |
| Genetic reagent (Drosophila melanogaster) | uas-shRPS28b | TsingHua Fly Center (THFC) | THU1037 | |
| Cell line (Homo sapiens) | HEK293T cells | Meisen CTCC | Cat# CTCC-001–0188 | Procured from ATCC (CRL-3216) |
| Antibody | Anti-O-Linked N-Acetylglucosamine Antibody, Mouse Monoclonal, RL2 | Abcam | Cat# ab2739, RRID: AB_30326 | WB (1:1000) IF (1:200) |
| Other | Cyanine3 Streptavidin | BioLegend | Cat# 405215 | IF (1:200) |
| Other | Streptavidin HRP | GenScript | Cat# M00091 | WB (1:2000) |
| Antibody | Anti-HA-Tag Rabbit Monoclonal Antibody (C29F4) | Cell Signaling Technology | Cat# 3724, RRID: AB_1549585 | WB (1:3000) IF (1:200) |
| Antibody | Anti-GFP Mouse Monoclonal Antibody (4B10) | Cell Signaling Technology | Cat# 2955, RRID: AB_1196614 | WB (1:1000) IF (1:200) |
| Antibody | DYKDDDDK Tag (D6W5B) Rabbit Monoclonal (Anti-FLAG M2 Antibody) | Cell Signaling Technology | Cat# 14793, RRID: AB_2572291 | WB (1:3000) |
| Antibody | Anti-α-Tubulin, Mouse Monoclonal, HRP Conjugate (DM1A) | Cell Signaling Technology | Cat# 12351 S, RRID: AB_2797891 | WB (1:3000) |
| Antibody | Goat Anti-Rabbit IgG (H+L) Secondary Antibody, Polyclonal secondary, Alexa Fluor-488 | Thermo Fisher Scientific | Cat# A-31565, RRID: AB_2536178 | IF (1:200) |
| Antibody | Goat Anti-Mouse IgG (H+L) Secondary Antibody, Polyclonal secondary, Alexa Fluor-488 | Thermo Fisher Scientific | Cat# A32723, RRID: AB_2633275 | IF (1:200) |
| Antibody | Goat Anti-Mouse IgG (H+L) Secondary Antibody, Polyclonal secondary, Alexa Fluor-546 | Thermo Fisher Scientific | Cat# A-11030, RRID: AB_2534089 | IF (1:200) |
| Antibody | Goat anti-Mouse IgG (H+L) Secondary Antibody, Polyclonal secondary | Thermo Fisher Scientific | Cat# 31160, RRID: AB_228297 | WB (1:5000) |
| Antibody | Goat anti-Rabbit IgG (H+L) Secondary Antibody, Polyclonal secondary | Thermo Fisher Scientific | Cat# A16098, RRID: AB_2534772 | WB (1:5000) |
| Commercial assay or kit | Click-iT Plus OPP Alexa Fluor 594 Protein Synthesis Assay Kit | Thermo Fisher Scientific | Cat# C10457 | |
| Commercial assay or kit | cDNA using RevertAid First Strand cDNA Synthesis Kit | Thermo Fisher Scientific | Cat# K1621 | |
| Commercial assay or kit | Fast Silver Stain Kit | Beyotime | Cat# P0017S | |
| Chemical compound, drug | DAPI | Sigma | Cat# D9542 | |
| Chemical compound, drug | Biotin | Merck | Cat# B4501 | |
| Chemical compound, drug | 3-Octanol (OCT) | Sigma | Cat# 218405 | |
| Chemical compound, drug | trans-4-Methylcyclohexanol (MCH) | Sigma | Cat# 104191 | |
| Chemical compound, drug | Protease Inhibitor Cocktail | Sigma | Cat# P8340 | |
| Chemical compound, drug | Phenylmethanesulfonyl fluoride (PMSF) | Sigma | Cat# P7626 | |
| Chemical compound, drug | Thiamet-G | Selleck | Cat# s7213 | |
| Chemical compound, drug | OSMI-1 | Sigma | Cat# SML1621 | |
| Chemical compound, drug | Streptavidin Magnetic Beads | MCE | Cat# HY-K0208 | |
| Chemical compound, drug | Anti-FLAG Affinity Gel | Sigma | Cat# A2220 | |
| Chemical compound, drug | SYBR Green qPCR Master Mix | SolomonBio | Cat# QST-100 | |
| Chemical compound, drug | Sequencing-grade modified trypsin | Promega | Cat# V5111 | |
| Chemical compound, drug | α-Iodoacetamide (IAA) | Merck | Cat# I6125 | |
| Software, algorithm | MaxQuant | Max Planck Institute of Biochemistry | https://www.maxquant.org | |
| Software, algorithm | Perseus | Max Planck Institute of Biochemistry | https://maxquant.net/perseus/ | |
| Software, algorithm | GraphPad Prism 8 | GraphPad Software | https://www.graphpad.com/scientificsoftware/prism/ | |
| Software, algorithm | Fiji | ImageJ | http://fiji.sc/ | |
| Software, algorithm | Python | N/A | https://www.python.org/ | |
| Software, algorithm | Illustrator | Adobe | https://www.adobe.com/uk/products/illustrator.html | |
| Software, algorithm | Zeiss ZEN 2.3 (blue edition) | Carl Zeiss Microscopy GmbH | https://www.zeiss.com/microscopy/int/products/microscopesoftware/zen.html |
Additional files
-
Supplementary file 1
O-GlcNAcylated proteins identified by TurboID-CpOGACD from HEK293T cells.
- https://cdn.elifesciences.org/articles/91269/elife-91269-supp1-v2.xlsx
-
Supplementary file 2
Previously identified O-GlcNAcylated proteins from HEK293T cells, related to Figure 2D and Figure 2—figure supplement 1E.
- https://cdn.elifesciences.org/articles/91269/elife-91269-supp2-v2.xlsx
-
Supplementary file 3
48 proteins shared among the three datasets, related to Figure 2D and Figure 2—figure supplement 1E.
- https://cdn.elifesciences.org/articles/91269/elife-91269-supp3-v2.xlsx
-
Supplementary file 4
O-GlcNAcylated proteins identified by TurboID-CpOGACD from brain neuron of Drosophila.
- https://cdn.elifesciences.org/articles/91269/elife-91269-supp4-v2.xlsx
-
Supplementary file 5
O-GlcNAcylated proteins identified by TurboID-CpOGACD from mushroom body of Drosophila.
- https://cdn.elifesciences.org/articles/91269/elife-91269-supp5-v2.xlsx
-
Supplementary file 6
O-GlcNAcylated proteins identified by TurboID-CpOGACD from antennal lobe of Drosophila.
- https://cdn.elifesciences.org/articles/91269/elife-91269-supp6-v2.xlsx
-
Supplementary file 7
O-GlcNAcylated proteins identified by TurboID-CpOGACD from ellipsoid body of Drosophila.
- https://cdn.elifesciences.org/articles/91269/elife-91269-supp7-v2.xlsx
-
Supplementary file 8
O-GlcNAcylated proteins identified by TurboID-CpOGACD from optic lobe of Drosophila.
- https://cdn.elifesciences.org/articles/91269/elife-91269-supp8-v2.xlsx
-
Supplementary file 9
Sequences of all the primers used in this study.
- https://cdn.elifesciences.org/articles/91269/elife-91269-supp9-v2.xlsx
-
Supplementary file 10
Cell clusters in different brain regions generated from single-cell transcriptomic data.
- https://cdn.elifesciences.org/articles/91269/elife-91269-supp10-v2.xlsx
-
Supplementary file 11
The normalized O-GlcNAc levels of O-GlcNAcylated proteins in different brain regions.
- https://cdn.elifesciences.org/articles/91269/elife-91269-supp11-v2.xlsx
-
MDAR checklist
- https://cdn.elifesciences.org/articles/91269/elife-91269-mdarchecklist1-v2.docx
Download links
A two-part list of links to download the article, or parts of the article, in various formats.
Downloads (link to download the article as PDF)
Open citations (links to open the citations from this article in various online reference manager services)
Cite this article (links to download the citations from this article in formats compatible with various reference manager tools)
Tissue-specific O-GlcNAcylation profiling identifies substrates in translational machinery in Drosophila mushroom body contributing to olfactory learning
eLife 13:e91269.
https://doi.org/10.7554/eLife.91269


