Dynamics of transcriptional programs and chromatin accessibility in mouse spermatogonial cells from early postnatal to adult life
- Laboratory of Neuroepigenetics, Brain Research Institute, Medical Faculty of the University of Zurich and Institute for Neuroscience, Department of Health Science and Technology of the ETH Zurich, Switzerland
- Center for Neuroscience Zurich, ETH and University Zurich, Switzerland
- ADLIN Science, Pépinière «Genopole Entreprises», France
Figures
Figure 1 with 3 supplements
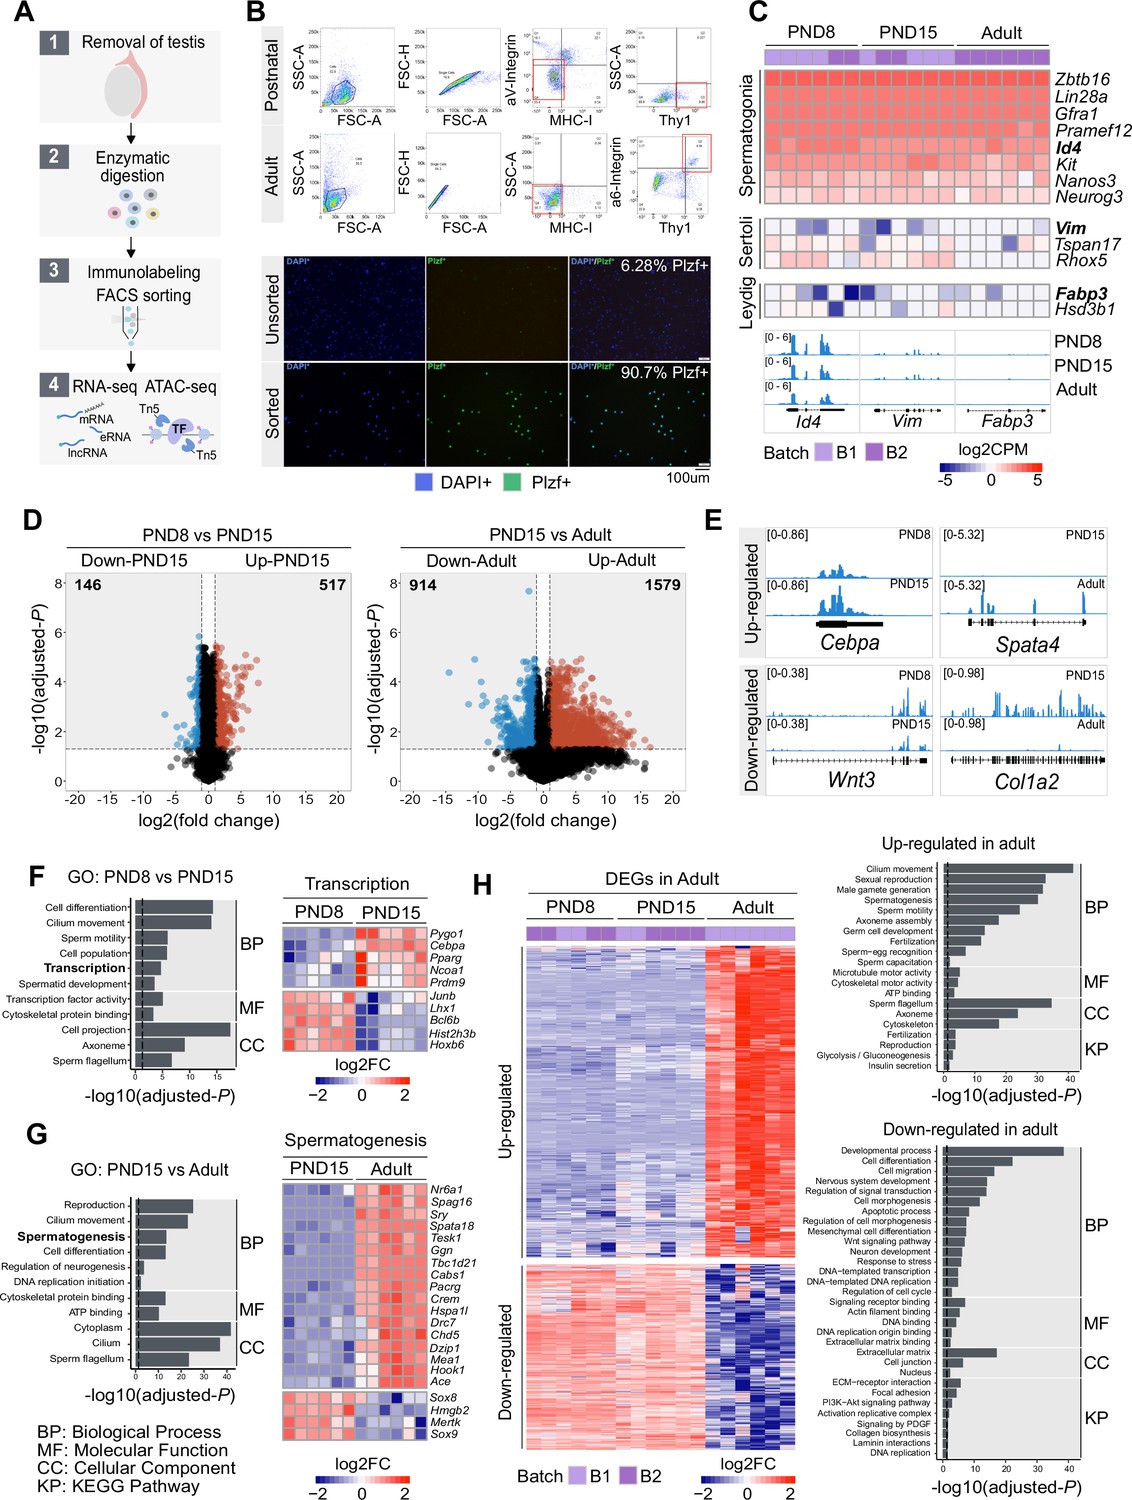
Transcriptome dynamics between early postnatal and adult SPGs.
(A) Schematic representation of the experimental strategy to isolate and analyse SPGs from postnatal or adult male mice. (B) Upper panel: Representative dot plots of the sorting strategy for enrichment of postnatal and adult SPGs. Gating based on side scatter/forward scatter (SSC-A/FSC-A) and forward scatter (height/forward scatter) (FSC-H/FSC-A) area was conducted to exclude cell debris and clumps. Lower panel: Representative immunocytochemistry on unsorted and sorted PND15 cells with anti-PLZF antibody and DAPI (nuclei) showing enrichment of PLZF + cells after FACS. (C) Heatmap of expression profile of selected markers of SPGs and different testicular somatic cells extracted from total RNA-seq data on PND8, PND15 and adult samples (n=6 for each group). Key genes for stem cell potential, stem and progenitor spermatogonia and Leydig and Sertoli cells were chosen to assess the enrichment of SPGs in the sorted cell populations. Each row in the heatmap represents a biological replicate from two experimental batches (B1 and B2). At the bottom Integrative Genomics Viewer (IGV), tracks are shown for aggregated RNA-seq signal for PND8, PND15 and adult over key genes used as markers. Gene expression is represented as Log2CPM (counts per million). (D) Volcano plot of differentially expressed genes (DEGs) (adjusted-p ≤0.05 and absolute Log2FC ≥ 1) between PND8 and PND15 (left) and PND15 and adult (right). The numbers in the grey boxes indicate the number of down- and up-regulated DEGs in each comparison. (E) Genomic IGV snapshots of exemplary DEGs showing aggregated RNA-seq signal for PND8, PND15 and adult SPGs. (F) Left: Bar-plot of GO categories enriched in DEGs between PND8 and PND15 (adjusted-p ≤0.05). Dotted line indicates threshold value for significance of 0.05. Right: Heatmap of DEGs between PND8 and PND15 belonging to the GO category ‘Transcription’. Each row represents a biological replicate from two experimental batches. Shown are Log2FC with respect to average at PND8. (G) Left: Bar-plot of GO categories enriched in DEGs between PND15 and adult (adjusted-p ≤0.05). Dotted line indicates threshold value for significance of adjusted-p=0.05. Right: Heatmap of DEGs between PND8 and PND15 belonging to the GO category ‘Spermatogenesis’. Each row represents a biological replicate from two experimental batches. Shown are Log2FC with respect to average at PND8. (H) Left: Heatmap of all DEGs specific to adult SPGs. Each row represents a biological replicate from two experimental batches (B1 and B2). Log2FC with respect to average at PND8 is shown. Right: Bar-plots of GO categories enriched in up-regulated (adjusted-p ≤0.05) (top) or down-regulated (adjusted-p ≤0.05) (bottom) genes in adult SPGs. Dotted line indicates threshold value for significance of adjusted-p=0.05.
Figure 1—figure supplement 1
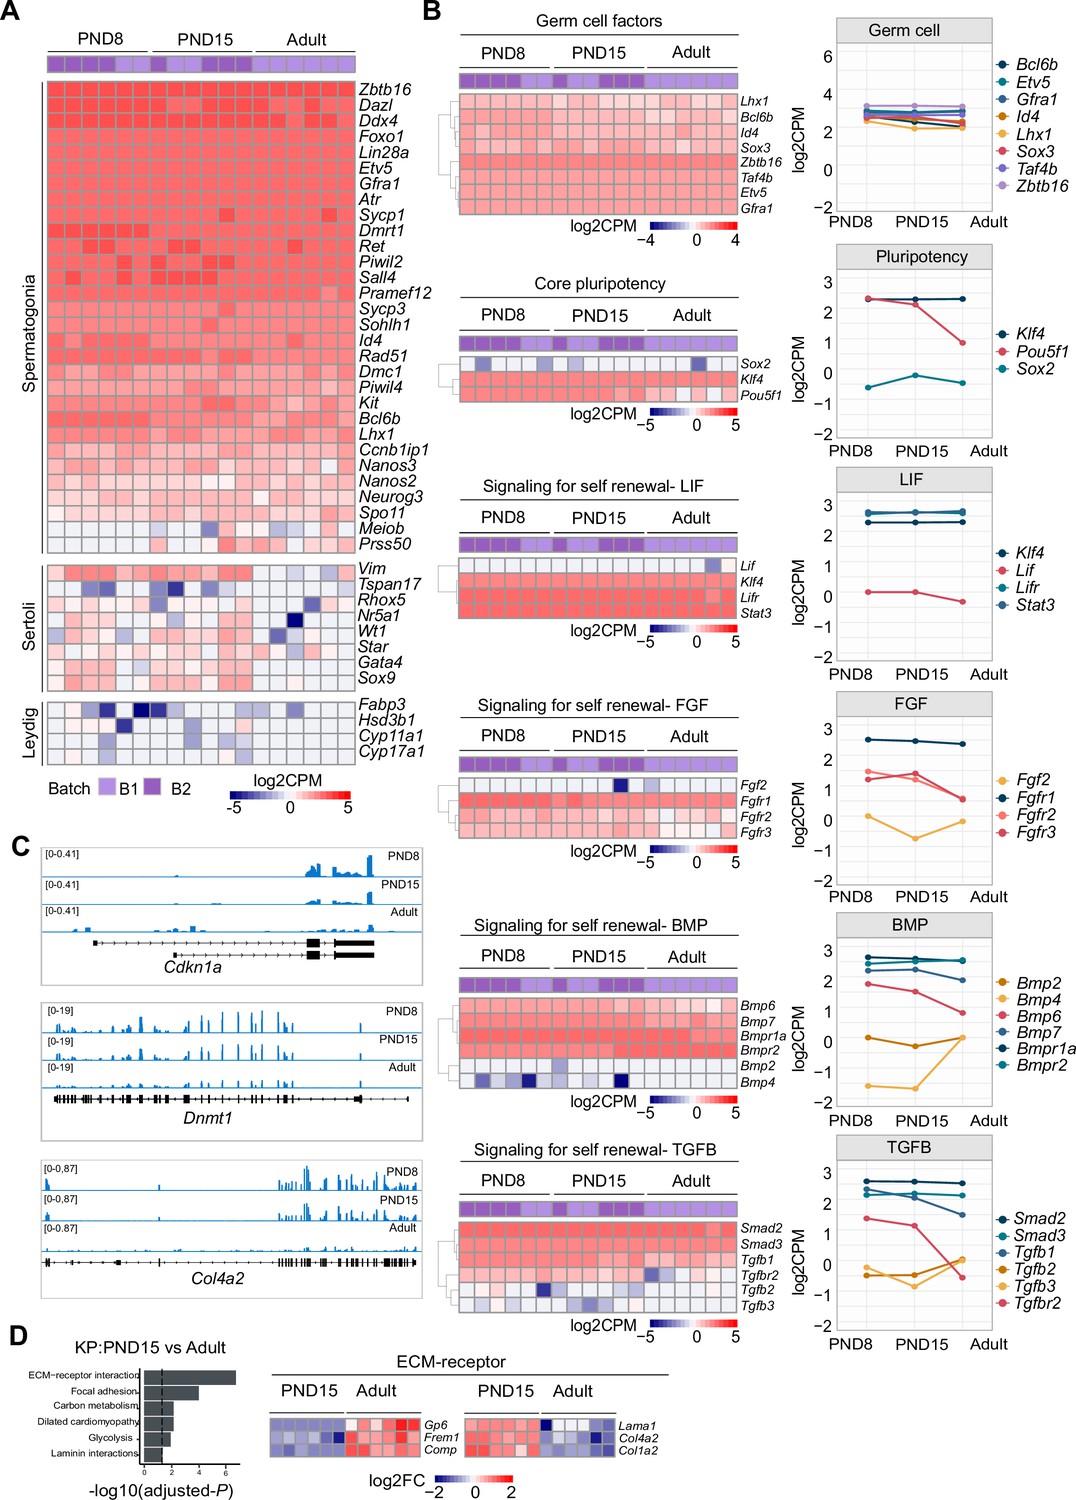
Expression of SPGs markers and their dynamics between early postnatal and adult stage.
(A) Heatmap of the expression profile of an extended list of selected markers of spermatogonial and different testicular somatic cells extracted from total RNA-seq data on PND8, PND15 and adult samples (n=6 for each group). Each row in the heatmap represents a biological replicate from two experimental batches. Gene names in bold correspond to cellular markers presented in Figure 1C. Gene expression is represented as Log2CPM (counts per million). (B) Left: Heatmap of the expression profile of genes involved in germ-cell maintenance, pluripotency and signalling as reported by Hammoud et al., 2015. Each row in the heatmap represents a biological replicate from two experimental batches. Unsupervised hierarchical clustering was applied to each of the rows of the heatmaps and a dendrogram indicating similarity of expression profiles among genes in each biological category is shown for each heatmap. Right: line-plots of the average expression of each gene displayed in the heatmaps showing the dynamics and breadth of gene expression across SPGs postnatal development. (C) Genomic snapshots from IVG of exemplary DEGs showing aggregated RNA-seq signal from PND8, PND15 and adult stages. (D) Left: bar-plot of GO KEGG pathways categories enriched in DEGs between PND15 and adult SPGs (adjusted-p ≤0.05). Dotted line indicates a threshold value for adjusted-p=0.05. Right: heatmap of DEGs between PND15 and adult belonging to the GO category ‘ECM-receptor interaction’. Each row in the heatmap represents a biological replicate from two experimental batches. Log2FC is shown with respect to the average of PND15.
Figure 1—figure supplement 2
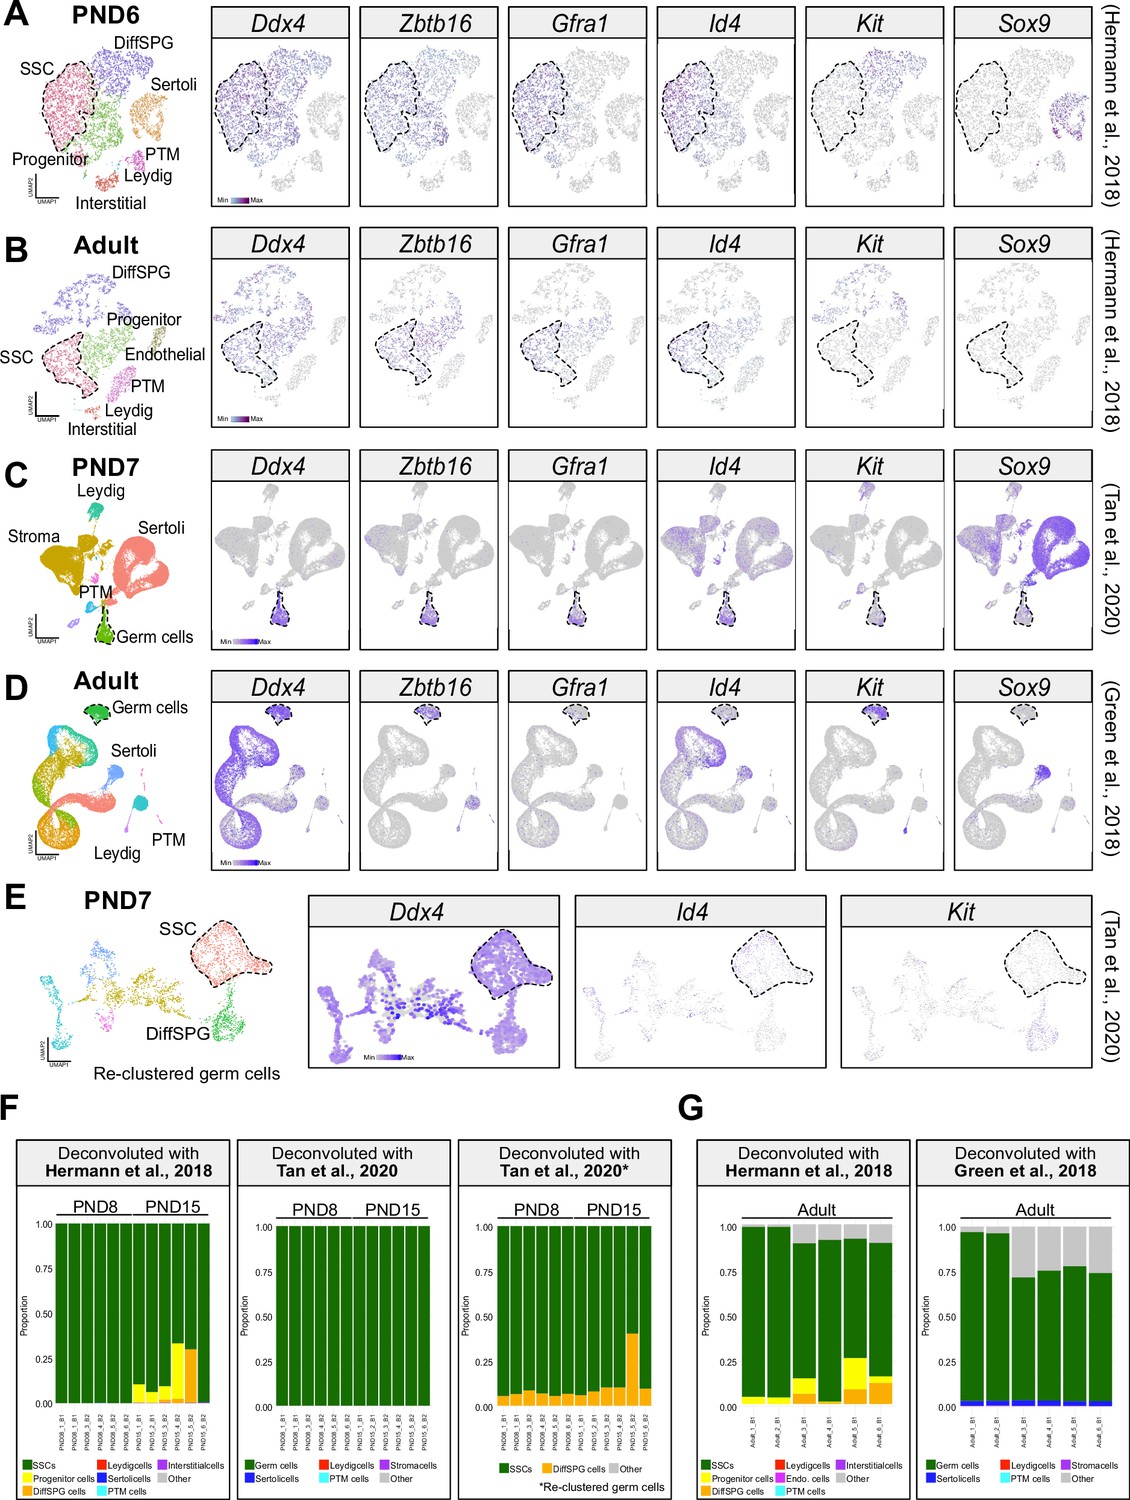
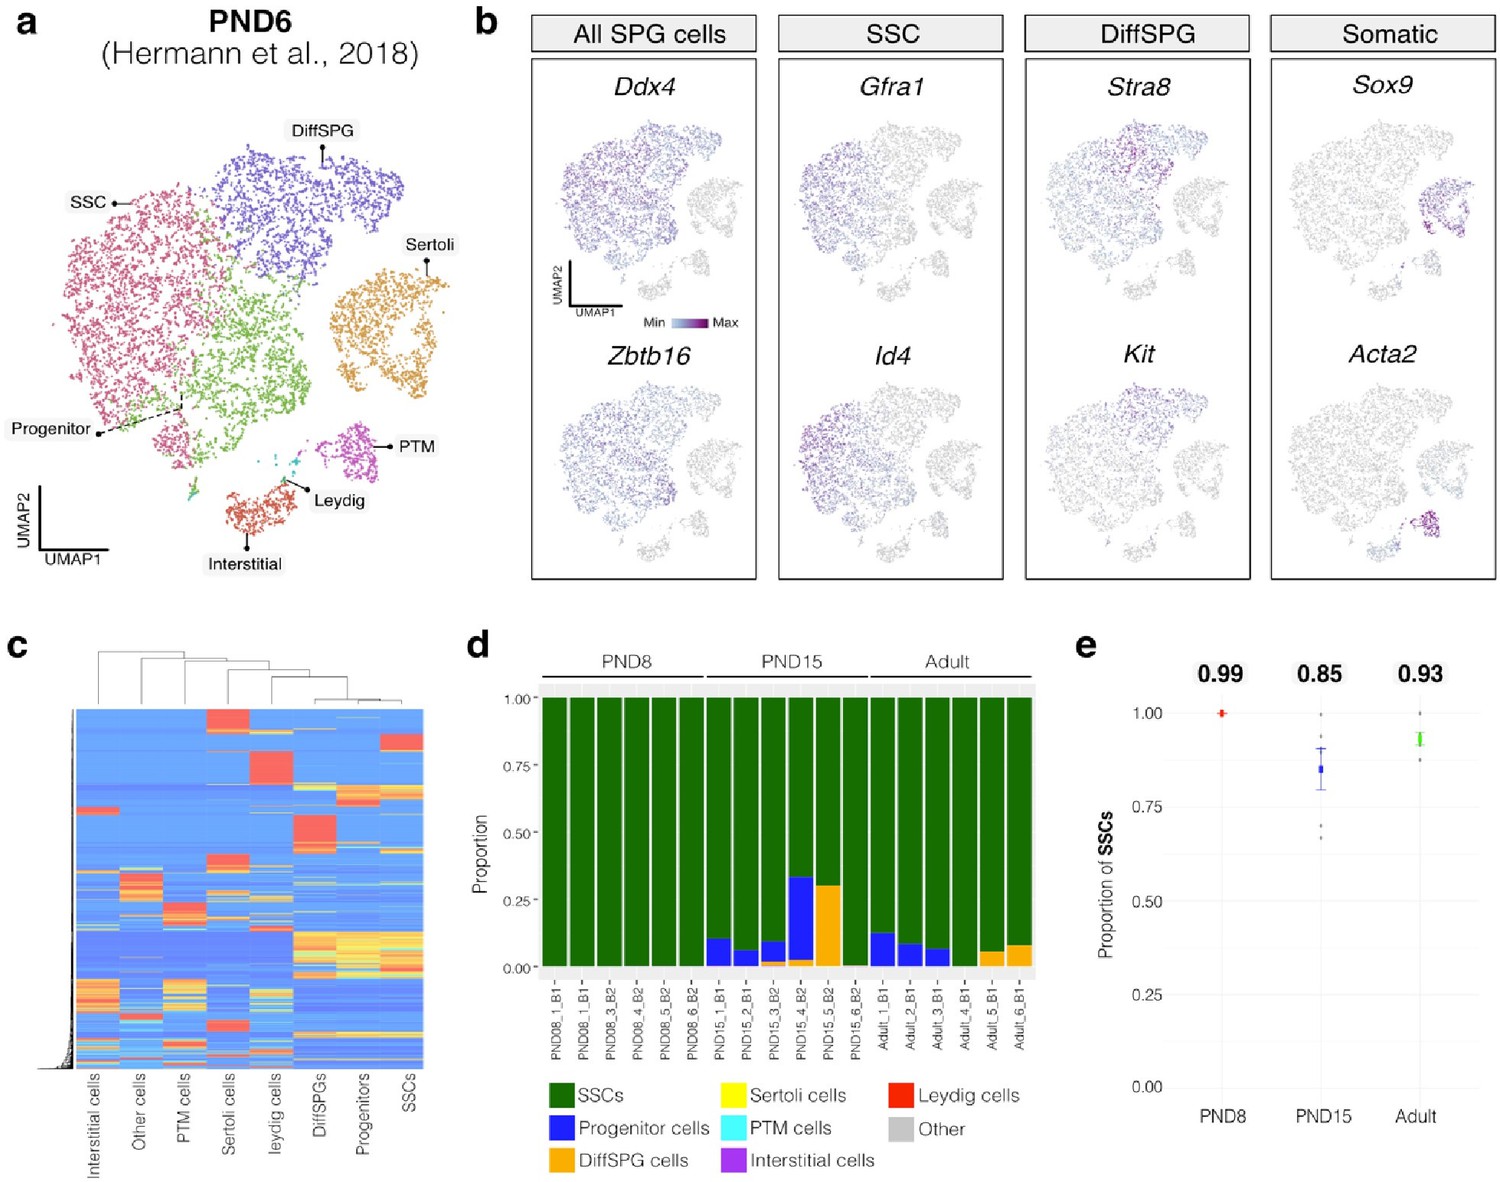
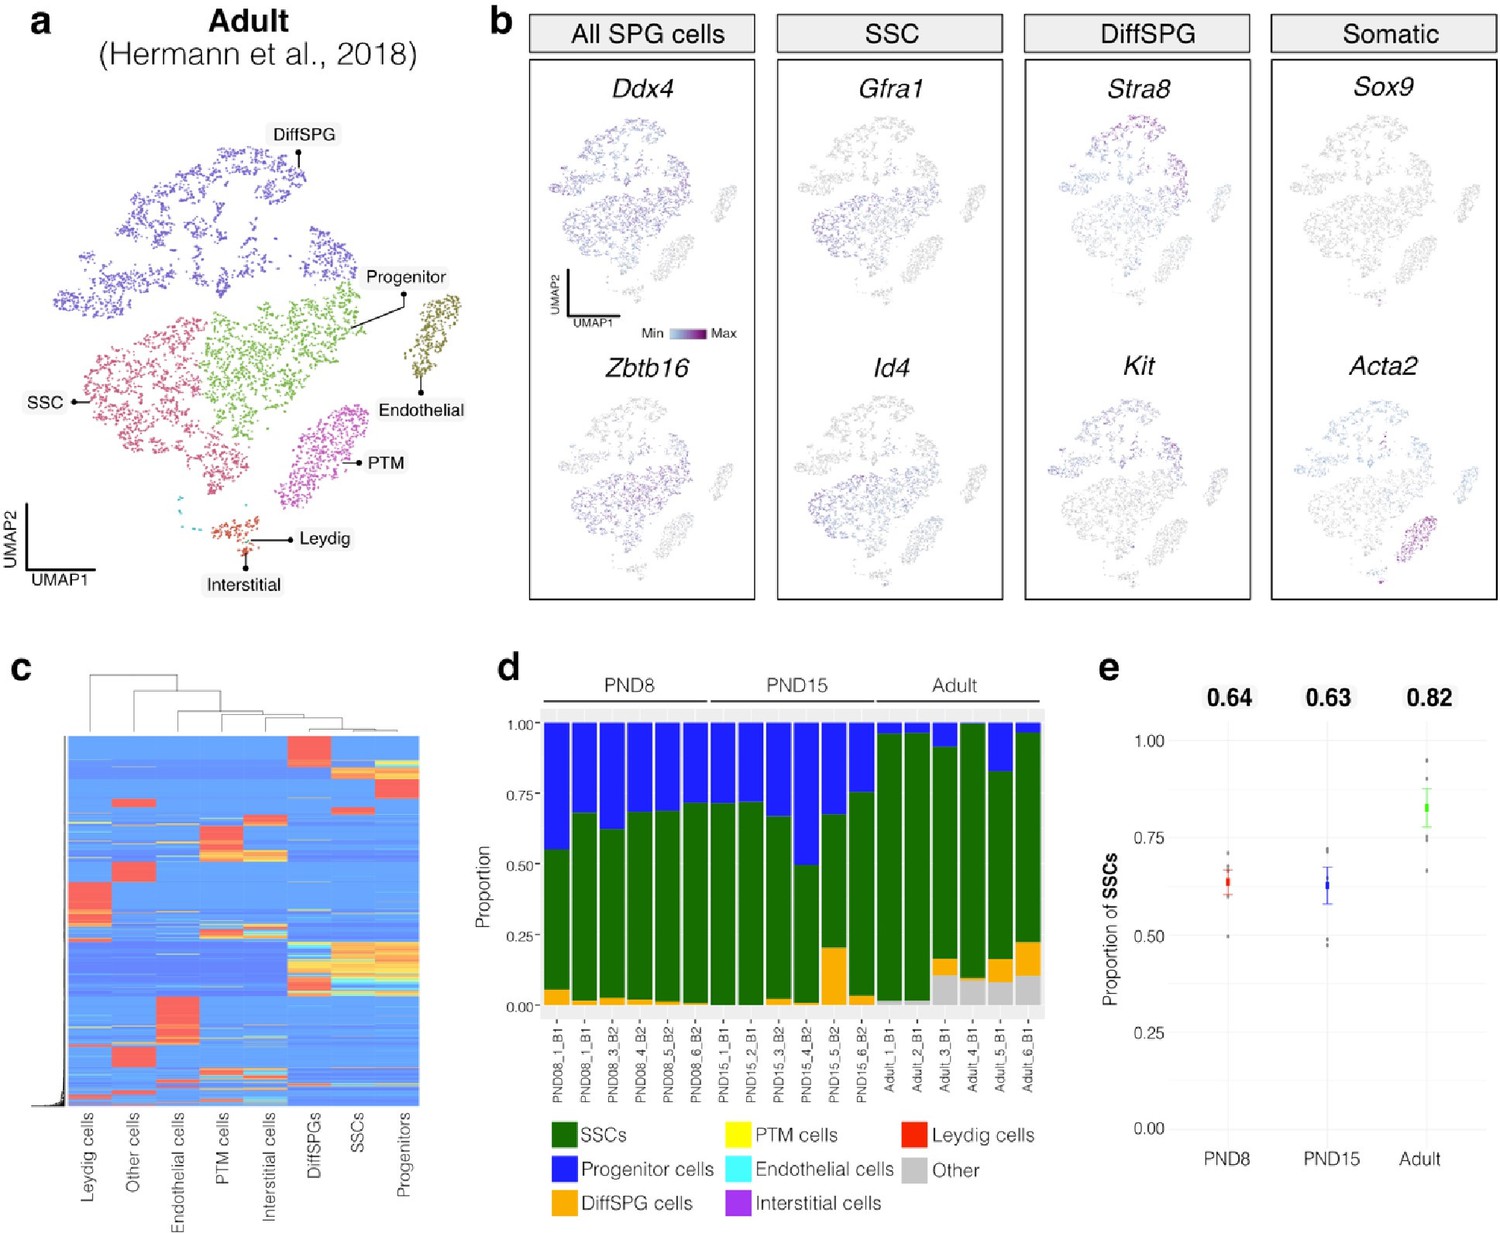
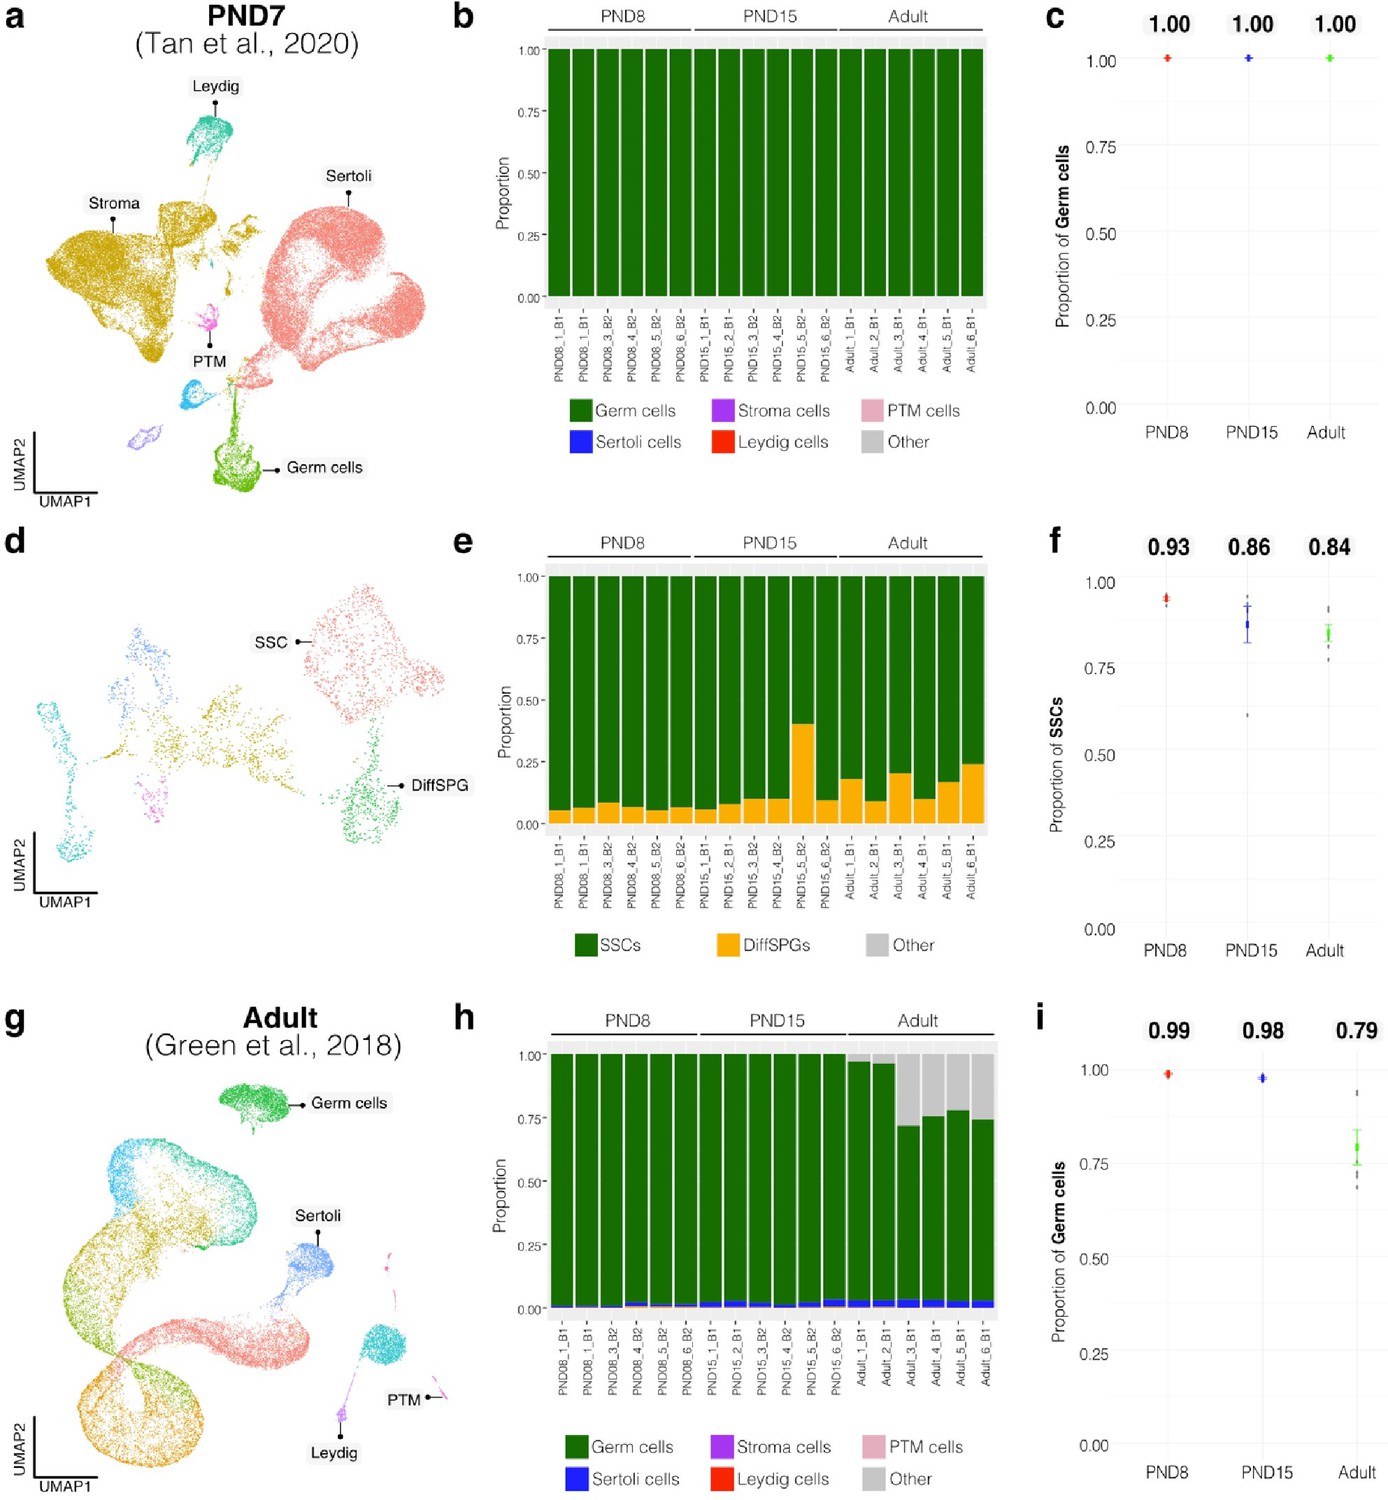
Deconvolution analyses.
(A) Seurat clusters from PND6 single-cell RNA-seq (Hermann et al., 2018) and feature maps of gene expression for markers of SPGs and somatic cells. (B) Seurat clusters from adult single-cell RNA-seq (Hermann et al., 2018) and feature maps of gene expression for markers of SPGs and somatic cells. (C) Seurat clusters from PND7 single-cell RNA-seq (Tan et al., 2020) and feature maps of gene expression for markers of SPGs and somatic cells. (D) Seurat clusters from adult single-cell RNA-seq (Green et al., 2018) and feature maps of gene expression for markers of SPGs and somatic cells. (E) Seurat clusters from re-clustering of the germ cell cluster in (C) and feature maps of gene expression for Ddx4, Id4 and Kit. (F) Bar-plot of estimated cellular proportions for all postnatal bulk RNA-seq libraries reported in this study (PND8 and PND15). Cellular representation was estimated using deconvolution analysis and specific single-cell RNA-seq datasets as references. (G) Bar-plot of estimated cellular proportions for all adult bulk RNA-seq libraries reported in this study.
Figure 1—figure supplement 3
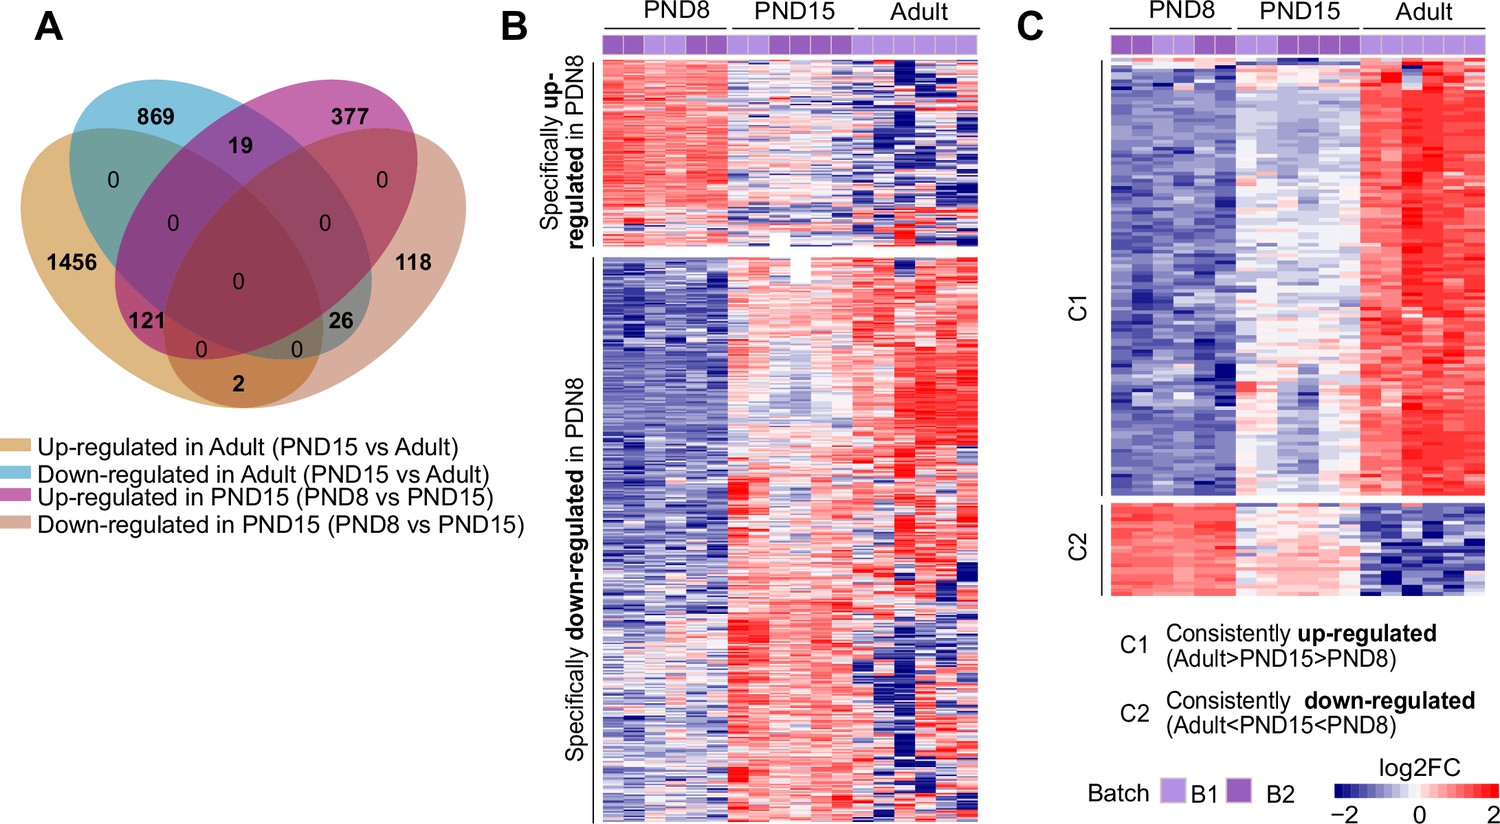
Specific transcriptional programs between postnatal and adult SPGs.
(A) Four-way Venn diagram of DEGs detected between PND8-PND15 and PND15-Adult comparisons. (B) Heatmap of all DEGs specific to PND8 stage. Each row represents a biological replicate from two experimental batches. Log2FC is shown with respect to the average of PND8. (C) Heatmap of all DEGs with significant changes across the three developmental time points. Each row represents a biological replicate from two experimental batches. Log2FC is shown with respect to the average of PND8. C1, cluster of DEGs consistently up-regulated from PND8 to Adult. C2, cluster of DEGs consistently down-regulated from PND8 to Adult.
Figure 2 with 1 supplement
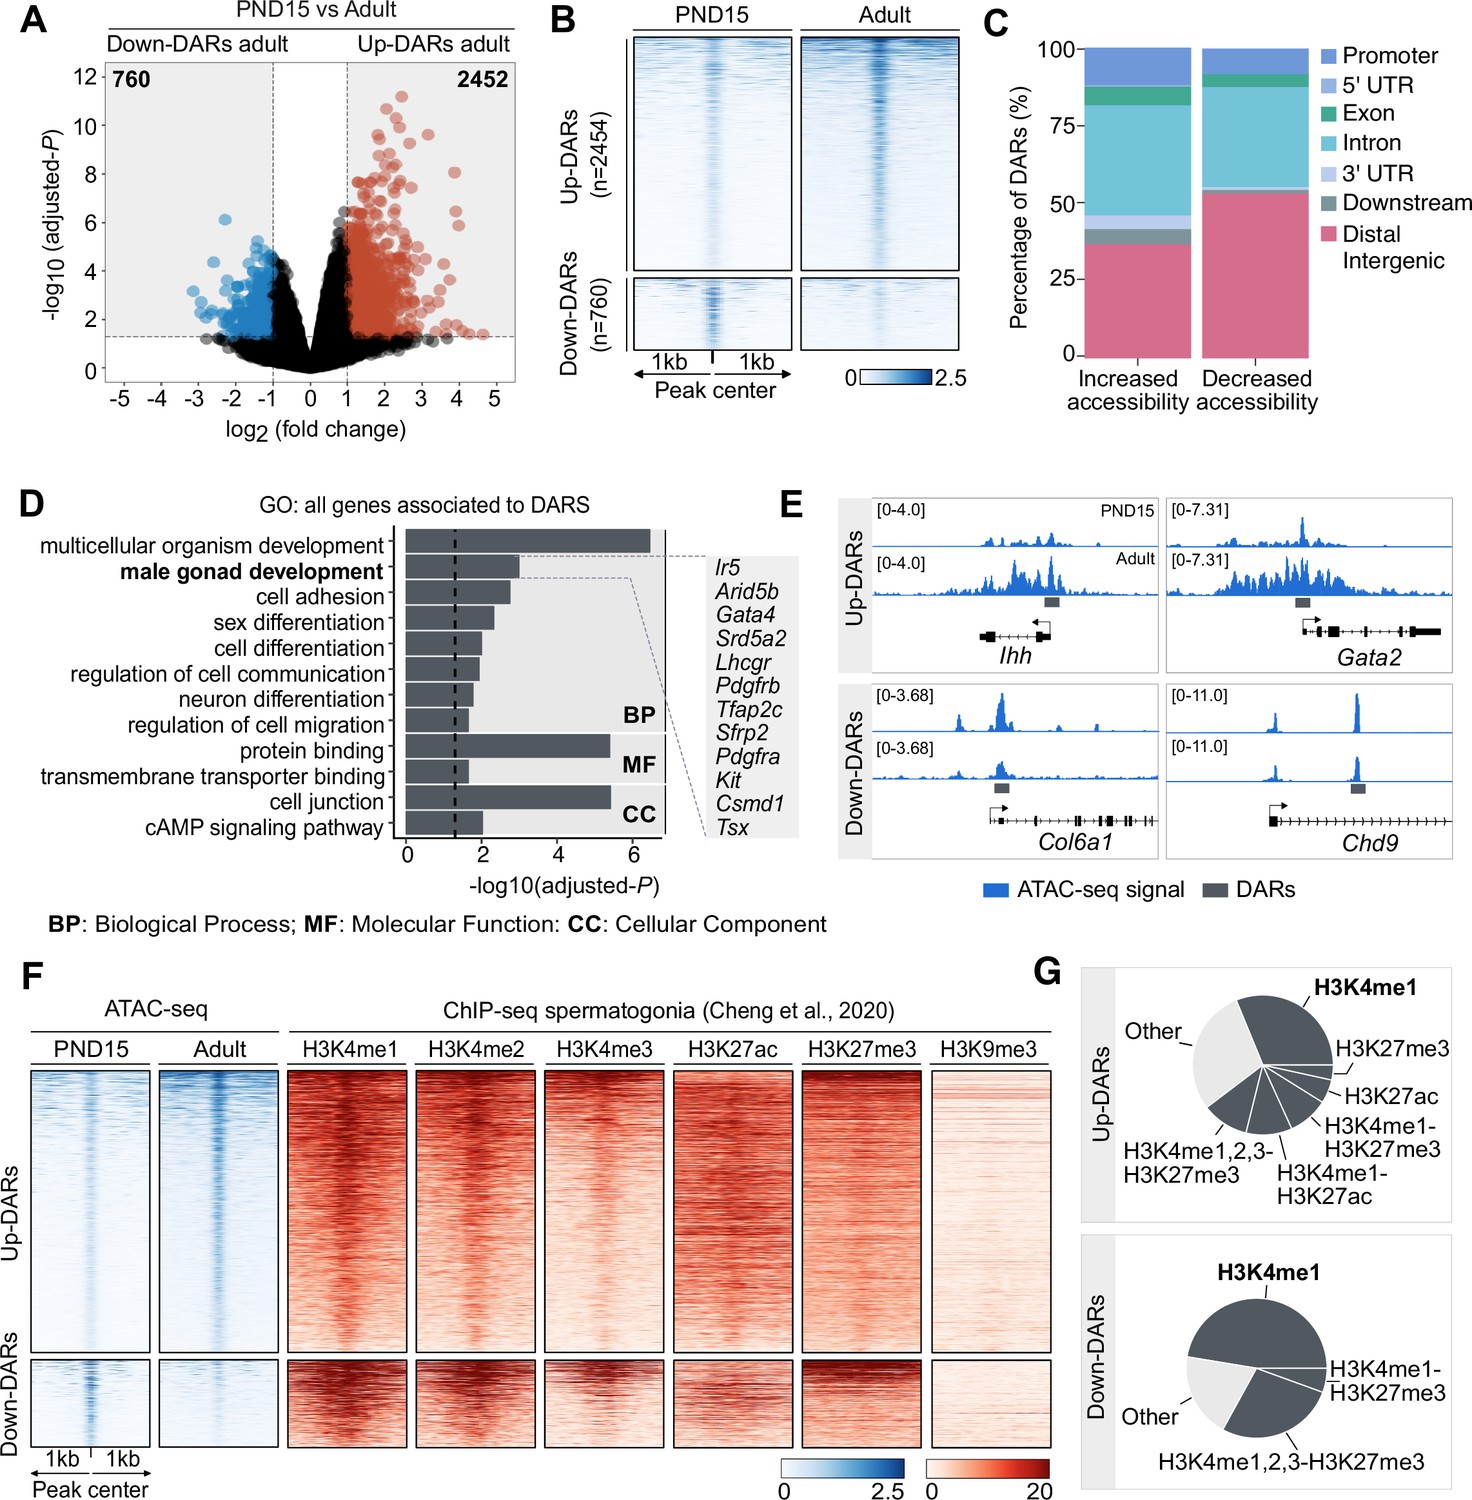
Dynamics of chromatin accessibility of SPGs during the transition from postnatal to adult stage.
(A) Volcano plot of DARs obtained by ATAC-seq (adjusted-p ≤0.05 and absolute Log2FC ≥1) between PND15 and adult SPGs. The numbers in the grey boxes indicate the number of DARs with decreased (Down) or increased (Up) chromatin accessibility in PND15 compared to adult SPGs. (B) Heatmaps showing normalized ATAC-seq signal for all identified DARs comparing PND15 and adult stages. Each row represents a 2 kb genomic region extended 1 kb down- and upstream from the centre of each identified DAR (as shown in A). Rows are ordered in a decreasing level of mean accessibility. (C) Bar plot illustrating the genomic distribution of DARs between PND15 and adult SPGs. (D) Bar plot of GO categories for associated genes assigned by proximity to all DARs. Dotted line indicates threshold value for significance of adjusted-p=0.05. (E) IGV tracks for ATAC-seq signal for PND15 and adult SPGs showing DARs (grey box) located at promoters and intergenic regions. (F) Heatmaps showing normalized ChIP-seq signal for different histone marks in adult SPGs (public data derived from Cheng et al., 2020) at all identified ATAC-seq peaks from PND15 and adult stages. Each row represents a 2 kb genomic region extended 1 kb down- and up-stream from the centre of each identified peak. Shown data correspond to non-regenerative SPGs as stated in Cheng et al., 2020. (G) Pie charts showing the overlap of all identified DARs with genomic regions significantly enriched for different histone marks in adult SPGs (public data derived from Cheng et al., 2020).
Figure 2—figure supplement 1
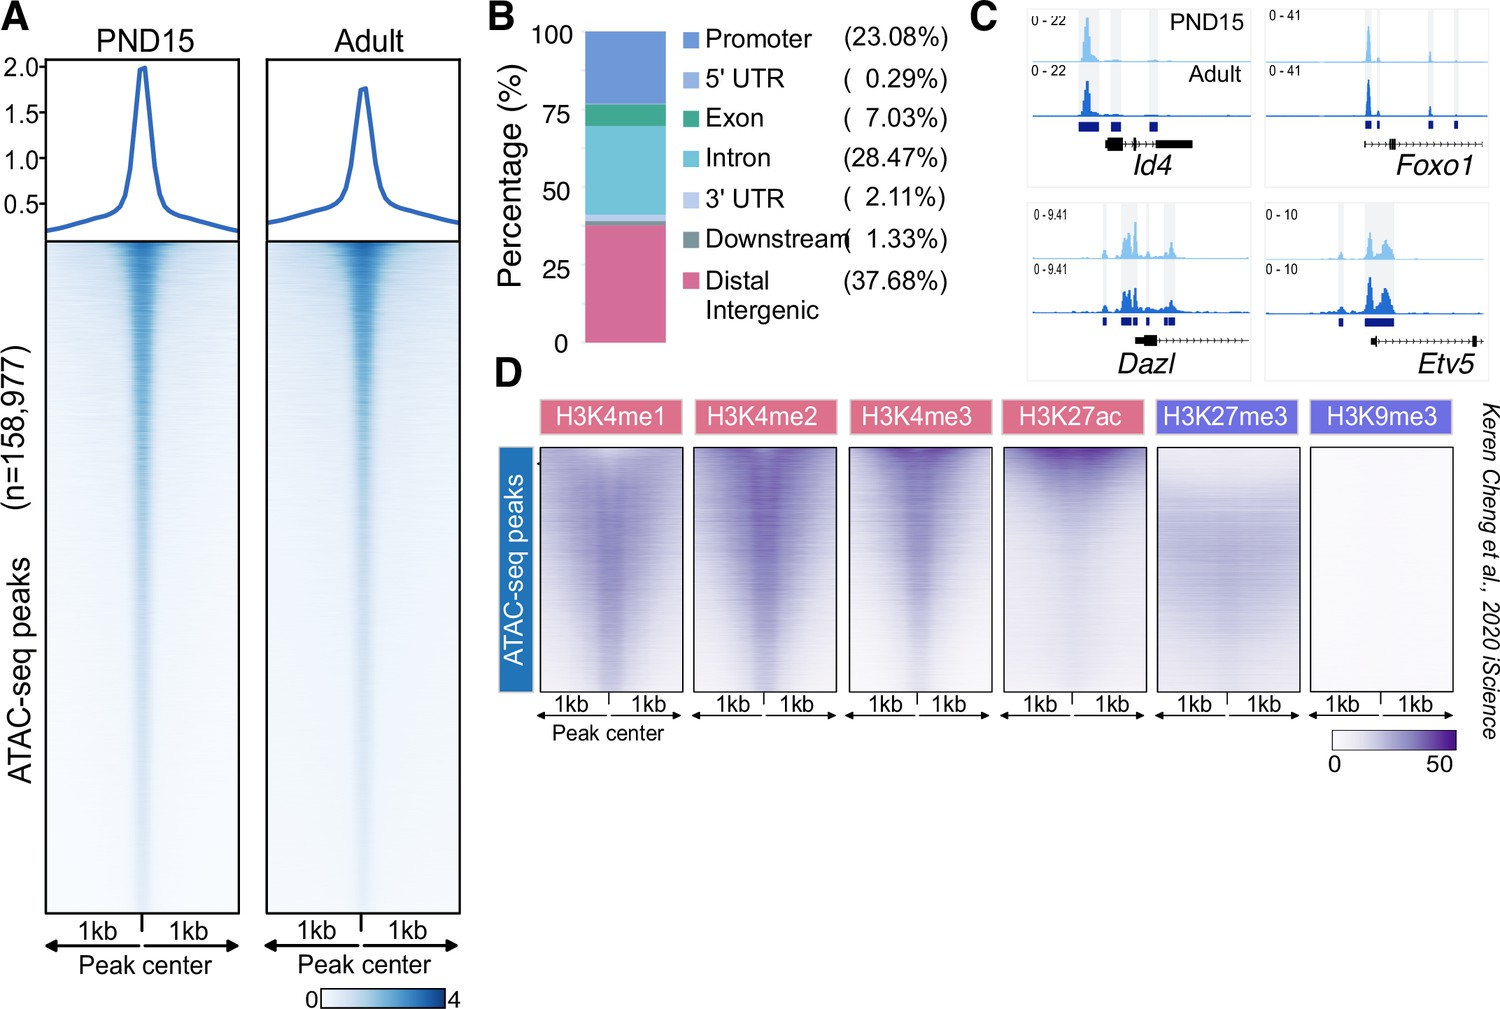
Chromatin accessibility landscape of SPGs from PND15 to adult stage.
(A) Heatmaps showing normalized ATAC-seq signal for all identified ATAC-seq peaks from PND15 and adult stages. Each row represents a 2 kb genomic region extended 1 kb down- and upstream from the center of each identified peak. Each row is ordered in a decreasing level of average accessibility. Top: plot of the signal profile over all ATAC-seq peaks and their extended genomic region. (B) Bar plot of the genomic distribution of all identified ATAC-seq peaks from PND15 and adult stages. (C) IGV tracks for ATAC-seq signal for PND15 and adult SPGs showing ATAC-seq peaks located at promoters and intragenic regions of genes with important functions in SPGs. Highlighted genomic segments correspond to ATAC-seq peaks. (D) Heatmaps showing normalized ChIP-seq signal for different histone marks in adult SSCs (public data derived from Cheng et al., 2020) at DARs. Each row represents a 2 kb genomic region extended 1 kb down- and upstream from the centre of each identified peak. Shown data corresponds to non-regenerative SPGs as stated in Cheng et al., 2020.
Figure 3
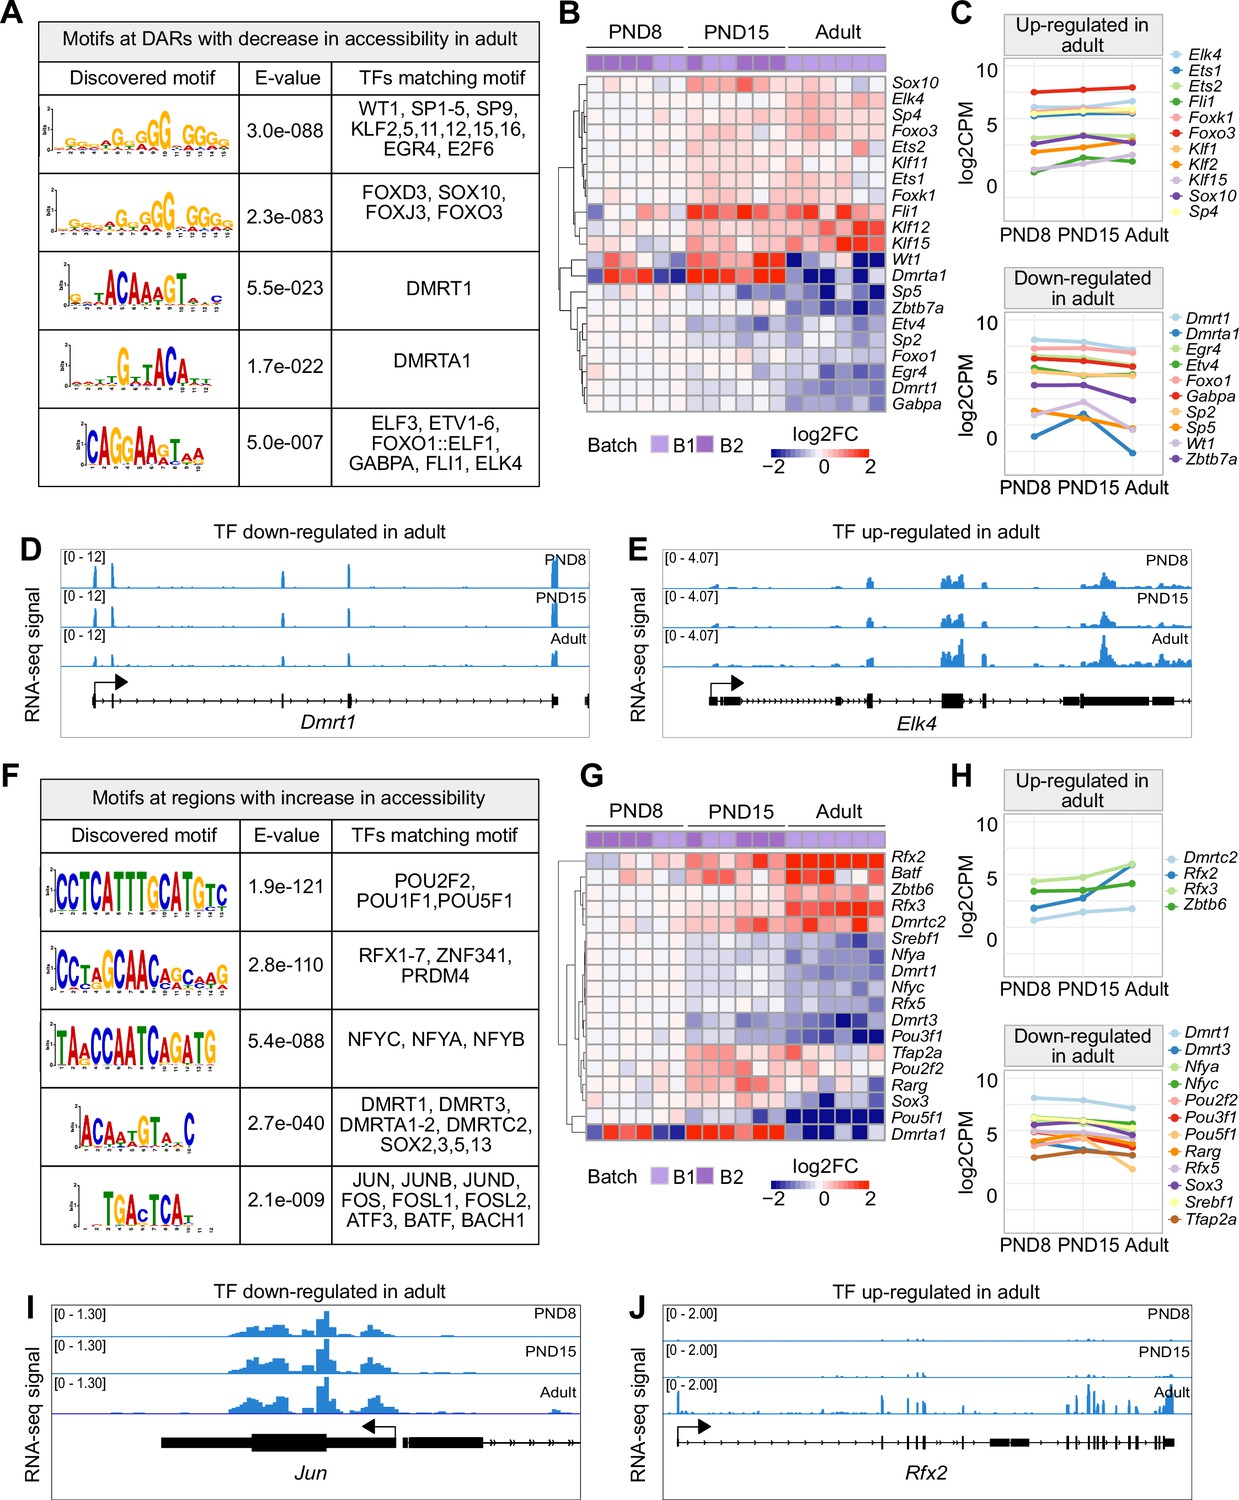
TF binding motifs at DARs and their transcriptional dynamics during the transition from postnatal to adult SPGs.
(A) Table of top five enriched motifs in genomic regions with decrease in chromatin accessibility in adult SPGs and TF matching motifs. A full list of TF motifs is provided in Supplementary file 4. (B) Heatmap of expression profiles of TFs with motifs in genomic regions with decreased chromatin accessibility shown in (A). Each row represents a biological replicate from two experimental batches. Unsupervised hierarchical clustering was applied to each row and a dendrogram indicating similarity of expression profiles among genes is shown. Log2FC is shown with respect to average of PND8 SPGs. (C) Line-plots of average expression of each gene displayed in the heatmap in (B) showing the dynamics of gene expression across PND8, PND15 and adult SPGs. (D, E) Genomic snapshot from IGV showing aggregated RNA-seq signal from PND8, PND15 and adult SPGs for the TFs (D) Dmrt1 and (E) Elk4. (F) Table of top five enriched motifs in genomic regions with increase in chromatin accessibility in adult SPGs and TF matching motifs. A full list of TF motifs is provided in Supplementary file 4. (G) Heatmap of expression profile of TFs with motifs in genomic regions with increase in chromatin accessibility shown in (F). Log2FC is shown with respect to the average of PND8 SPGs. (H) Line-plots of average expression of each gene displayed in the heatmap in (G) showing the dynamics of gene expression across SPGs development. (I, J) Genomic snapshot from IGV showing the aggregated RNA-seq signal from PND8, PND15 and adult SPGs for the TFs (I) Jun and (J) Rfx2.
Figure 4
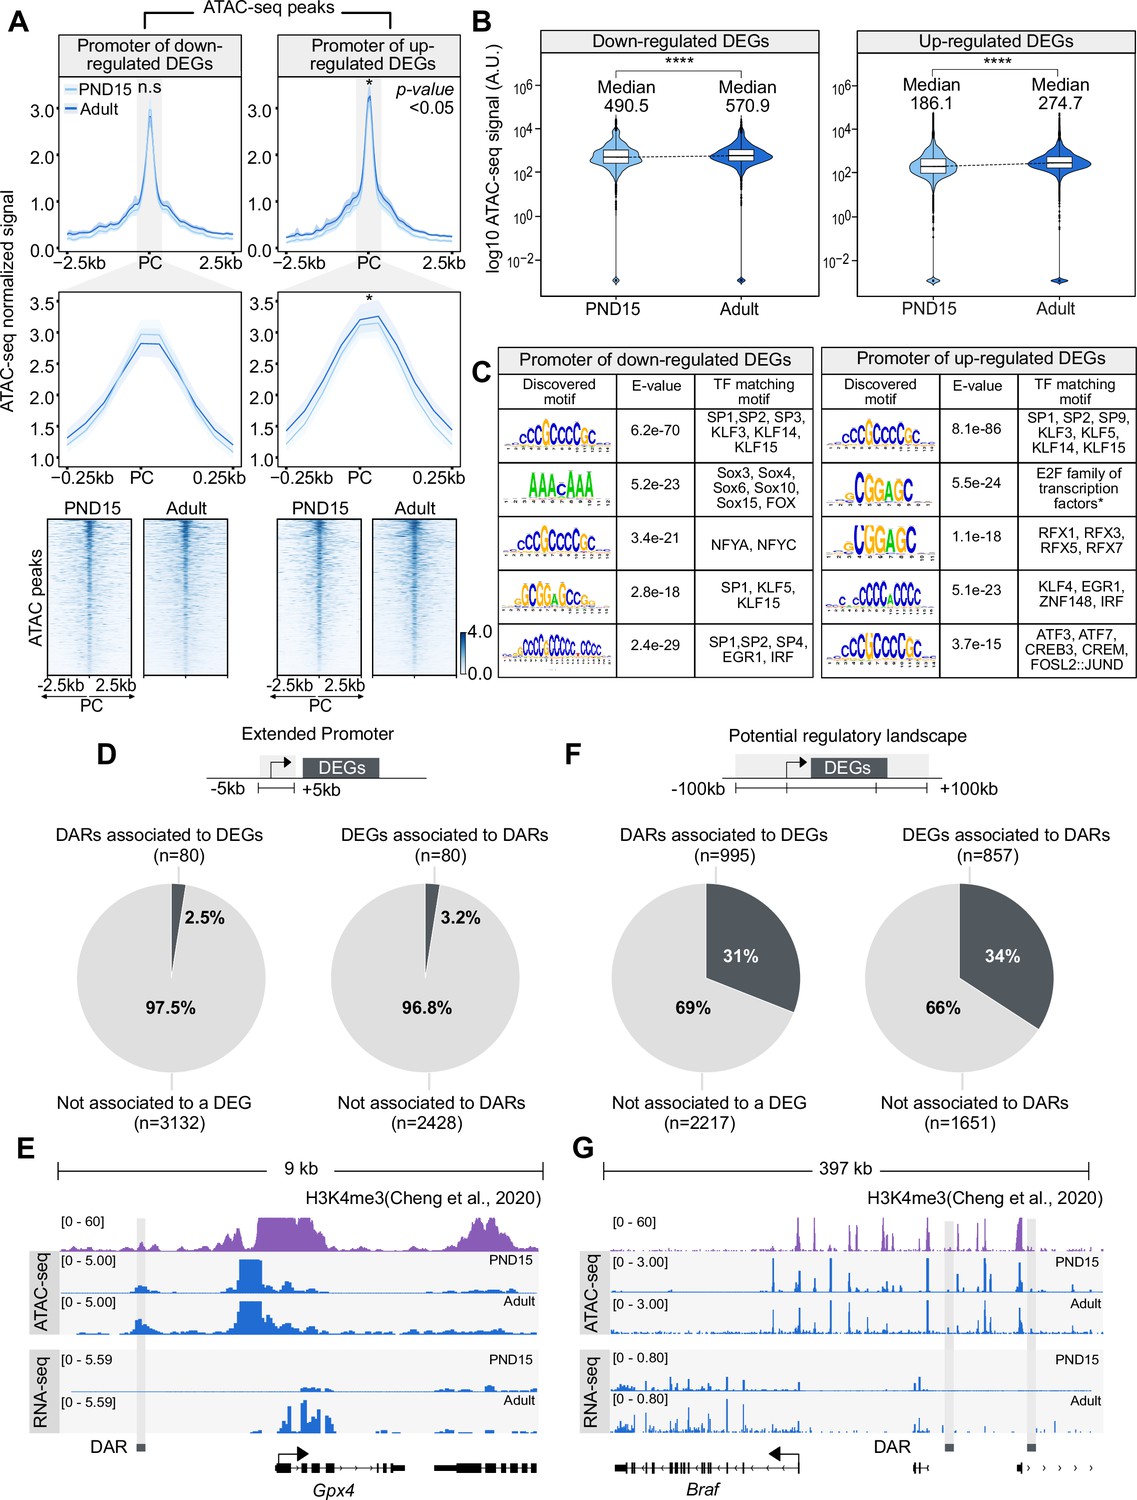
Chromatin accessibility dynamics at DEGs during the transition from postnatal to adult SPGs.
(A) Top: profile plots of ATAC-seq signal from PND15 and adult SPGs over all ATAC-seq peaks located within a genomic region of 5 kb surrounding the TSS of DEGs. Mean (line) and bootstrap confidence interval (area, shadow lines) computed over all non-overlapping 50 bp genomic regions. n.s, non-significant differences at TSS region. *, significant difference in signal between PND15 and adult at p<0.05. PC, peak center from ATAC-seq data. Profile plots for all ATAC-seq peaks surrounding the TSS of down-regulated (top left) or up-regulated (top right) DEGs. Middle: profile plots of ATAC-seq signal from PND15 and adult SPGs over all ATAC-seq peaks located within a genomic region of 500 bp surrounding the TSS of DEGs. Bottom: heatmaps showing normalized ATAC-seq signal from PND15 and adult for all ATAC-seq peaks surrounding the TSS of all down-regulated (left) or up-regulated (right) DEGs. Each row represents a 2 kb genomic region extended 1 kb down- and up-stream from the center of each identified peak. Rows are ordered in a decreasing level of mean accessibility taking PND15 as reference. (B) Violin plots of average ATAC-seq signal for PND15 and adult SPGs over gene body of down-regulated (left) or up-regulated (right) DEGs. ****p<0.0001. (C) TF motif enrichment analysis for all ATAC-seq peaks surrounding the TSS of all down-regulated (left) or up-regulated (right) DEGs. (D) Left: pie chart of percentage of DARs overlapping the extended promoter of DEGs (+/-5 kb from TSS). Right: pie chart of percentage of DEGs associated with a DAR. (E) IGV tracks for an example of DAR associated to the extended promoter (+/-5 kb from TSS) of a DEG. Tracks for RNA-seq and ATAC-seq signal (blue) are shown for PND15 and adult SPGs generated in this study and signal track for H3K4me3 (purple) from SPGs derived from public ChIP-seq data (Cheng et al., 2020). (F) Left: pie chart of percentage of DARs overlapping potential regulatory sequences of DEGs (+/-100 kb from start and end of gene). Right: pie chart of the percentage of DEGs associated with a DAR. (G) IGV tracks for an example of DAR associated with potential regulatory sequences (+/-100 kb from start and end of gene) of a DEG. Tracks for RNA-seq and ATAC-seq signal (blue) are shown for PND15 and adult SPGs generated in this study and signal track for H3K4me3 (purple) from SPGs derived from public ChIP-seq data (Cheng et al., 2020).
Figure 5
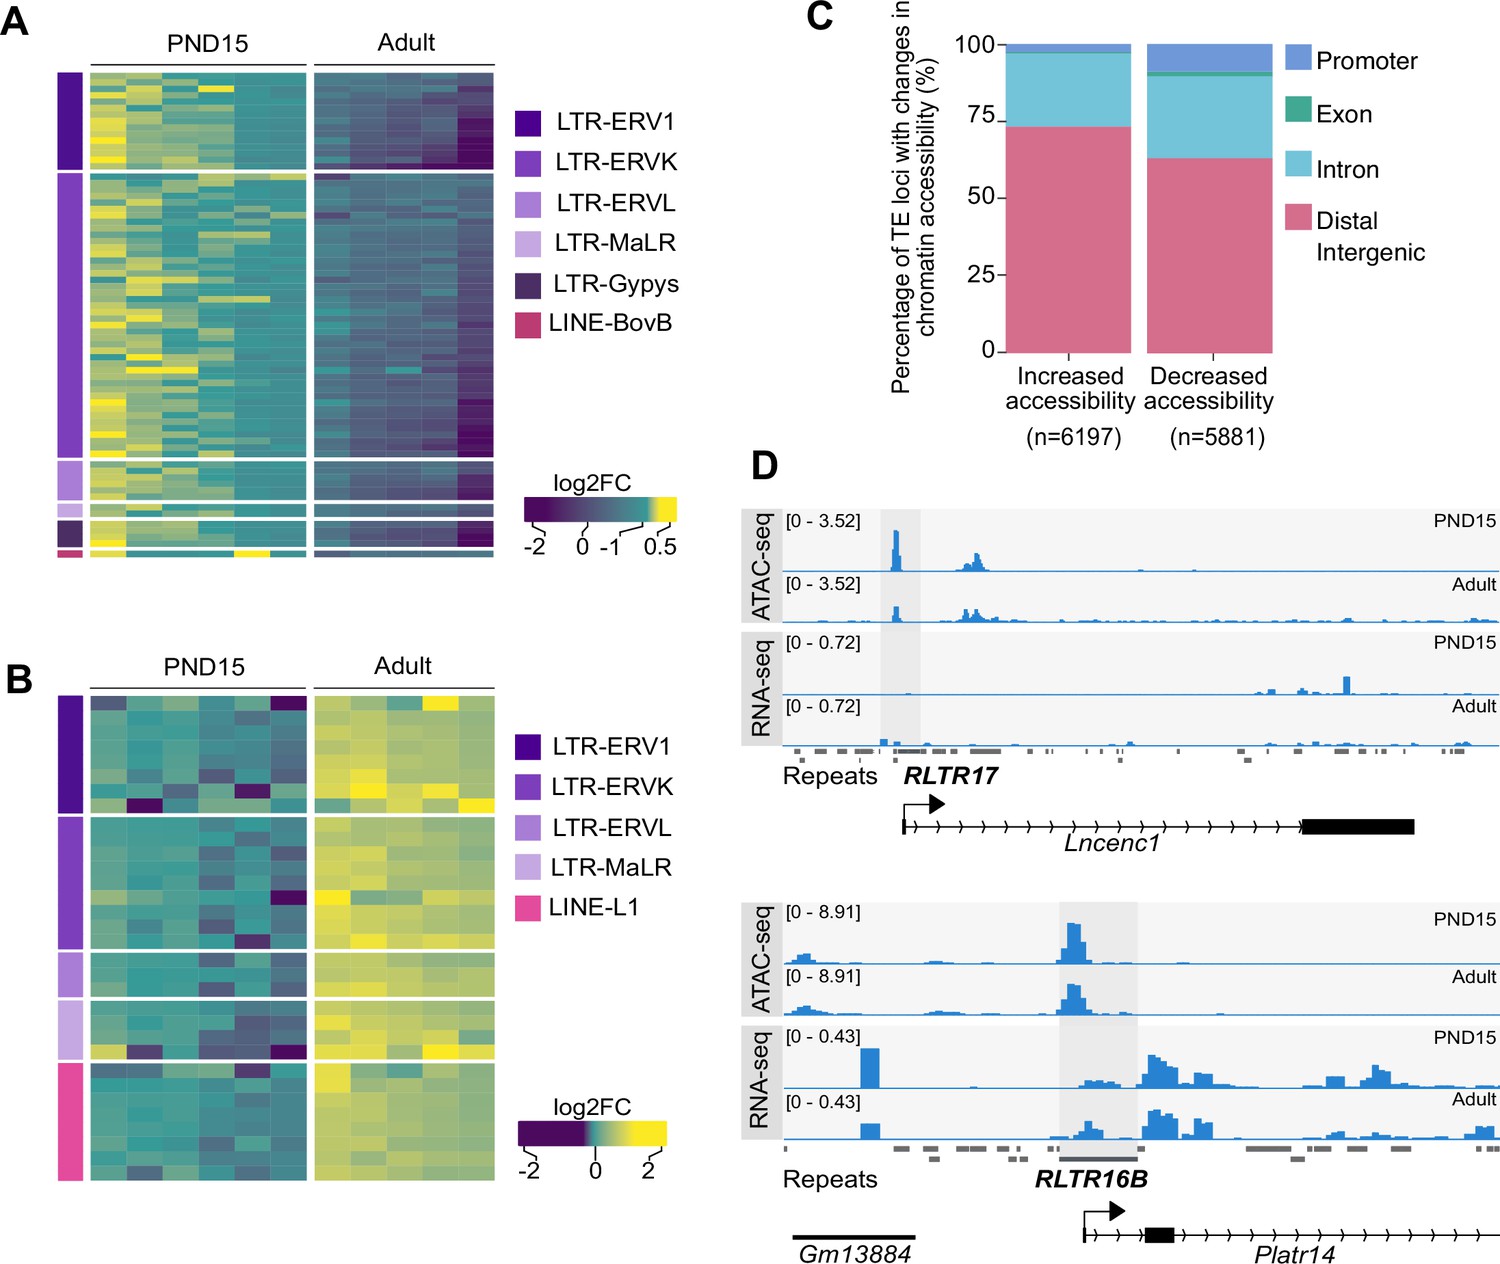
Differential chromatin accessibility at TEs in PND15 and adult SPGs.
(A) Heatmap of LTR and LINE subtypes with decreased accessibility between PND15 and adult SPGs extracted from Omni-ATAC data (adjusted-p ≤0.05 and Log2FC ≥0.5). (B) Heatmap of LTR and LINE subtypes with increased accessibility between PND15 and adult SPGs extracted from Omni-ATAC data (adjusted-p ≤0.05 and Log2FC ≥0.5). Expression changes of these subtypes between adult and PND15 SPGs RNA-seq from literature are represented as Log2FC. (C) Bar plot illustrating the genomic distribution of DARs between PND15 and adult SPGs. (D) Genomic snapshot from IVG showing aggregated ATAC-seq and RNA-seq signal from PND15 and adult SPGs for Lncenc1 and Platr14. The RepeatMasker track for the mouse genome is shown below signal tracks (‘Repeats’), and TEs with changes in chromatin accessibility are highlighted.
Author response image 1
Deconvolution analysis of bulk RNA-seq samples using PND6 single-cell RNA seq from Hermann et al, 2018.
a.Seurat clusters from PND6 single-cell RNA-seq. b. Feature maps of gene expression for markers of SPGs and somatic cells. c. Gene expression signature matrix from PND6 single-cell RNA-seq datasets. d. Barplot of estimated cellular proportions for all bulk RNA-seq libraries reported in this study. e. Dotplot of the average estimated proportion of SSCs in all bulk RNA-seq libraries reported in this study.
Author response image 2
Deconvolution analysis of bulk RNA-seq samples using Adult single-cell RNA seq (Hermann et al, 2018).
(a) Seurat clusters from Adult single-cell RNA-seq.
Author response image 3
Deconvolution analysis of bulk RNA-seq samples with additional single-cell datasets.
Seurat clusters from PND7 single-cell RNA-seq (Tang 2020). b. Barplot of estimated cellular proportions for all bulk RNA-seq libraries reported in this study. c. Dotplot of the average estimated proportion of germ cells in all bulk RNA-seq libraries reported in this study. d. Re-clustering of germ cell cluster shown in a. e. Barplot of estimated cellular proportions for all bulk RNA-seq libraries reported in this study. f. Dotplot of the average estimated proportion of SSCs in all bulk RNA-seq libraries reported in this study. g. Seurat clusters from adult single-cell RNA-seq (Green et al., 2018). h. Barplot of estimated cellular proportions for all bulk RNA-seq libraries reported in this study. i. Dotplot of the average estimated proportion of germ cells in all bulk RNA-seq libraries reported in this study.
Author response image 4

Deconvolution analysis of Sertoli bulk RNA-seq samples.
Barplots of estimated cellular proportions for bulk RNAseq libraries reported in Thumfart et al., 2022. Expression matrices were derived from the analysis of single-cell RNA-seq datasets used to asses cellular composition of the SPGs bulk libraries.
Author response image 5

Id4 and Kit are transcribed in SSCs.
Seurat clusters from PND6 single-cell RNA-seq (left) and feature maps of gene expression for Id4 (center) and Kit (right). Zoom in into SSCs (red).
Author response image 6
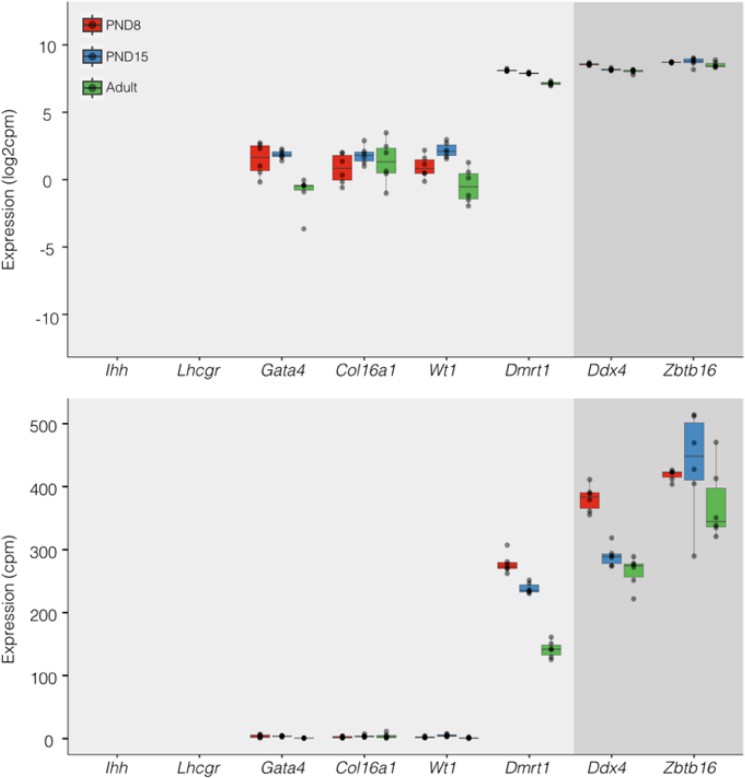
Expression of germ and somatic cell markers in our RNA-seq datasets.
Boxplots of log2(CPM) (Top) and CPM (Bottom) values for selected genes from our RNAseq datasets. Each point in boxplots represent the expression value of a biological replicate.
Author response image 7

Expression of germ and somatic cell markers in publicly available single-cell RNA-seq datasets.
Seurat clusters from all analyzed single-cell RNA-seq datasets (first column from left) and feature maps of gene expression for Zbtb16, Dmrt1 and Wt1.
Author response image 8

Expression of Wt1 in publicly available single-cell RNA-seq datasets.
Feature maps of gene expression for Wt1. In dashed boxes, a zoom-in into germ cells cluster that show expression of Wt1 at some of these cells.
Author response image 9

Chromatin accessibility profiles at specific loci differ between SPG cells and other cell types.
Genome-browser tracks for Ihh, Wt1, Col16a1 and Zbtb16. For each gene, an extended locus view is presented with RNA-seq data (this study) and normalized ATAC-seq tracks from our study and public sources (SPG Id4; GSE131657; Sertoli; GSM3346484; HSC; ENCFF204JEE). Public ATAC-seq datasets were generated enrichment methods similar to the one employed in our study.
Author response image 10
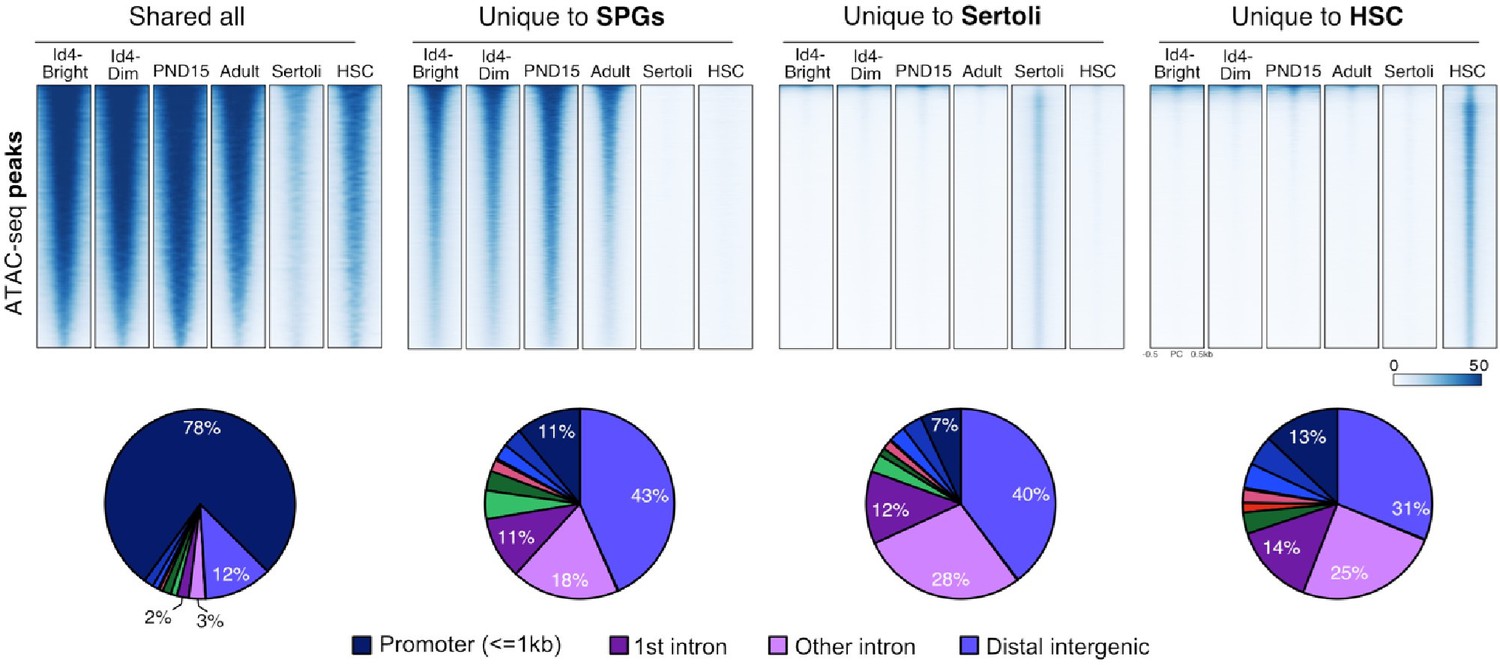
Shared and cell-type specific ATAC-seq peaks among SPGs, Sertoli and HSC.
Author response image 11

Single-cell expression of Ddx4 and Zbtb16.
Seurat clusters from all analyzed single-cell RNA-seq datasets (a,c,e,g,i) and feature maps of gene expression for Ddx4 and Zbtb16 (b,d,f,j, h).
Author response image 12

Pearson correlation at the peak level among different ATAC-seq datasets.
a) Our ATAC-seq libraries and ATAC-seq libraries from b) Cheng et al., 2020 and c) Maezawa et al., 2020. Thy1-1 and cKit libraries correspond to undifferentiated and differentiating SPGs, respectively. PS, pachytene spermatocytes and RS, round spermatids. Correlation analysis was done using Deeptools.
Tables
Appendix 1—key resources table
| Reagent type (species) or resource | Designation | Source or reference | Identifiers | Additional information |
|---|---|---|---|---|
| Strain, strain background (M. musculus) | C57BL/6JRj (M. musculus) | Janvier Laboratories | Non applicable | - |
| Biological sample (M. musculus) | Primary spermatogonia (SPGs) | C57BL/6JRj males | Non applicable | Freshly isolated from pups and adult males |
| Antibody | BV421-conjugated anti-mouse B2 microglobulin (B2M; S19.8; Mouse monoclonal) | BD Biosciences | Cat# 744802 | Cell enrichment from pups and adult testes |
| Antibody | Biotin Rat Anti-Mouse CD90.2 (Thy-1.2; 53–2.1; Rat monoclonal) | BD Biosciences | Cat# 553002 | Cell enrichment from pups testes |
| Antibody | PE Rat Anti-mouse CD51 (integrin a5; Clone RMV-7; Rat monoclonal) | BD Biosciences | Cat#: 551187 | Cell enrichment from pups testes |
| Antibody | Streptavidin Alexa Fluor 488 conjugate | Invitrogen | Cat#: S32354 | Cell enrichment from pups and adult testes |
| Antibody | Rat Anti-Human CD49f (integrin a6; GoH3; Rat monoclonal) | BD Biosciences | Cat#: 555734 | Cell enrichment from adult testes |
| Antibody | PE Rat Anti-Mouse CD90.2 (Thy-1.2; Clone 30-H12; Rat monoclonal) | BD Biosciences | Cat#: 553014 | Cell enrichment from adult testes |
| Antibody | Biotin Mouse Anti-Rat IgG1/2 a (Clone G28-5; Mouse monoclonal) | BD Biosciences | Cat#: 553880 | Cell enrichment from adult testes |
| Antibody | PLZF (2A9; Mouse monoclonal) | Active Motif | Cat#: 39988 | Immunocytochemistry |
| Chemical compound, drug | Propidium iodide | Sigma-Aldrich | Cat#:537060 | FACS |
| Peptide, recombinant protein | Collagenase type IV | Sigma-Aldrich | Cat#: C4-28-100MG | Cell enrichment from pups and adult testes |
| Commercial assay or kit | AllPrep DNA/RNA Micro Kit | Qiagen | Cat#: 80284 | RNA extraction |
| Commercial assay or kit | SMARTer Stranded Total RNA-seq Kit v3 | Takara Bio USA, Inc | Cat#: 634485 | RNA-seq library preparation |
| Commercial assay or kit | SMARTer RNA Unique Dual Index Kit | Takara Bio USA, Inc | Cat#: 634451 | RNA-seq library preparation |
| Commercial assay or kit | Tn5 transposase | Illumina | Cat#:15027916 | ATAC-seq library |
| Commercial assay or kit | Nextera XT Index Kit 24-indexes | Illumina | Cat#:15055293 | ATAC-seq library |
| Commercial assay or kit | MinElute Reaction Cleanup Kit | Qiagen | Cat#:28204 | ATAC-seq library |
| Commercial assay or kit | NEBNext High-Fidelity 2 X PCR Master Mix | New England Biolabs | Cat#:M0541S | ATAC-seq library |
| Other | AMPure XP reagent | Beckman Coulter Life Sciences | Cat#: A63880 | Library purification and clean-up |
| Software | Salmon | Salmon/Bioconda | Version 0.9.1 | RNA-seq analysis |
| Software | edgeR | edgeR/Bioconductor | Version 3.28.1 | RNA-seq analysis/ATAC-seq analysis |
| Software | limma | Limma/Bioconductor | Version 3.42.2 | RNA-seq analysis |
| Software | G:Profiler | https://biit.cs.ut.ee/gprofiler/gost | Do not apply | RNA-seq and ATAC-seq analysis |
| Software | CIBERSORTx | https://cibersortx.stanford.edu/ | Do not apply | RNA-seq deconvolution analysis |
| Software | Bowtie2 | Bowtie2/Bioconda | Version 2.3.5 | RNA-seq and ATAC-seq analysis |
| Software | deepTools | https://deeptools.readthedocs.io/en/develop/content/installation.html | Version 3.4.3 | RNA-seq and ATAC-seq analysis |
| Software | MACS2 | MACS2/Bioconda | Version 2.2.7.1 | ATAC-seq analysis |
| Software | ChIPpeakAnno | ChIPpeakAnno/Bioconductor | Version 4.4 | ATAC-seq analysis |
| Software | MEME | MEME/Bioconductor | Version 5.4.1 | ATAC-seq analysis |
| Software | Rsubread | Rsubread/Bioconductor | Version 2.0.1 | ATAC-seq analysis |
| Software | csaw | csaw/Bioconductor | Version 1.20.0 | ATAC-seq analysis |
| Software | HOMER | http://homer.ucsd.edu/homer/introduction/install.html | Version 4.11.1 | ATAC-seq analysis |
Additional files
-
MDAR checklist
- https://cdn.elifesciences.org/articles/91528/elife-91528-mdarchecklist1-v1.pdf
-
Supplementary file 1
Differentially expressed genes (DEGs).
- https://cdn.elifesciences.org/articles/91528/elife-91528-supp1-v1.xls
-
Supplementary file 2
Gene ontology analysis of DEGs.
- https://cdn.elifesciences.org/articles/91528/elife-91528-supp2-v1.xls
-
Supplementary file 3
Differentially accessible regions (DARs).
- https://cdn.elifesciences.org/articles/91528/elife-91528-supp3-v1.xls
-
Supplementary file 4
TF motif analysis of DARs.
- https://cdn.elifesciences.org/articles/91528/elife-91528-supp4-v1.xls
-
Supplementary file 5
DARs of repeat sequences.
- https://cdn.elifesciences.org/articles/91528/elife-91528-supp5-v1.xls
Download links
A two-part list of links to download the article, or parts of the article, in various formats.
Downloads (link to download the article as PDF)
Open citations (links to open the citations from this article in various online reference manager services)
Cite this article (links to download the citations from this article in formats compatible with various reference manager tools)
Dynamics of transcriptional programs and chromatin accessibility in mouse spermatogonial cells from early postnatal to adult life
eLife 12:RP91528.
https://doi.org/10.7554/eLife.91528.3


