A kidney-hypothalamus axis promotes compensatory glucose production in response to glycosuria
- Department of Medicine, Division of Endocrinology, Diabetes, and Metabolism, University of Rochester Medical Center, United States
- Department of Cellular and Molecular Physiology, Yale University, United States
- Department of Neuroscience and Pharmacology, University of Iowa Carver College of Medicine, United States
- Department of Anesthesiology, University of Rochester Medical Center, United States
Figures
Figure 1
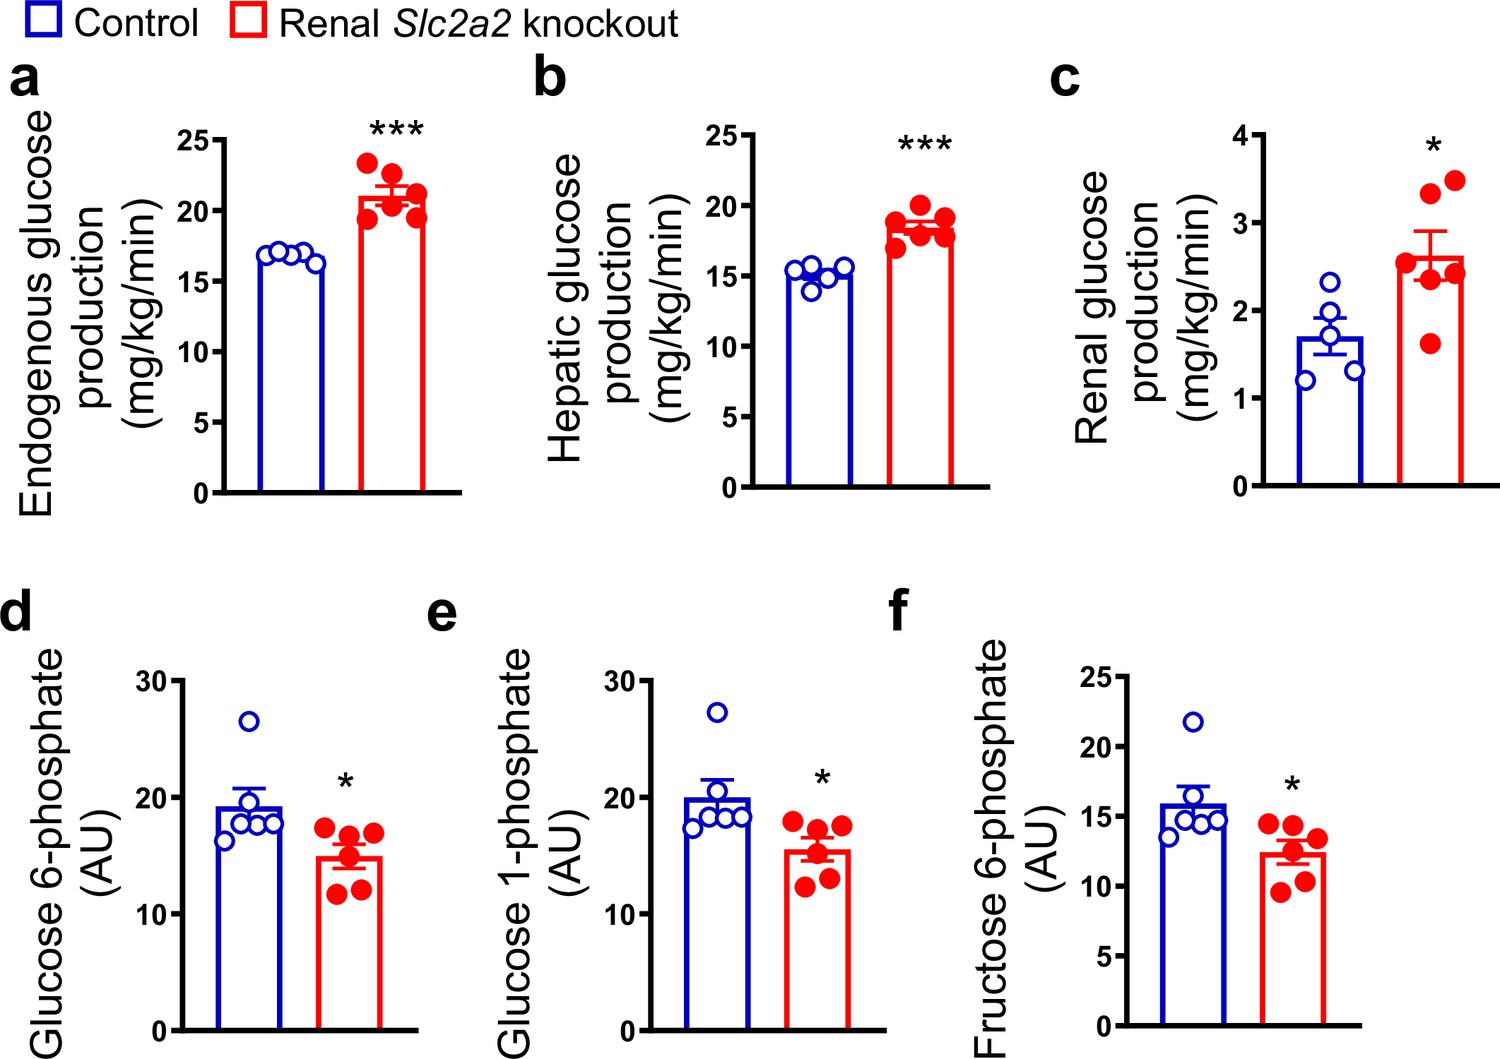
Renal Slc2a2 knockout mice exhibit increased glucose production.
In vivo increase in total (a), hepatic (b), and renal (c) glucose production through gluconeogenesis with pyruvate as a substrate in 28-week-old male renal Slc2a2 knockout mice. Decreased hepatic glucose 6-phosphate (d), glucose 1-phosphate (e), and fructose 6-phosphate (f) in renal Slc2a2 knockout mice 12 weeks after inducing the Slc2a2 deficiency. *p<0.05, ***p<0.001, unpaired two-tailed Student’s t-test. Data are presented as mean ± SEM.
-
Figure 1—source data 1
List of measured metabolites in the liver of renal Slc2a2 knockout male mice.
- https://cdn.elifesciences.org/articles/91540/elife-91540-fig1-data1-v1.xlsx
Figure 2
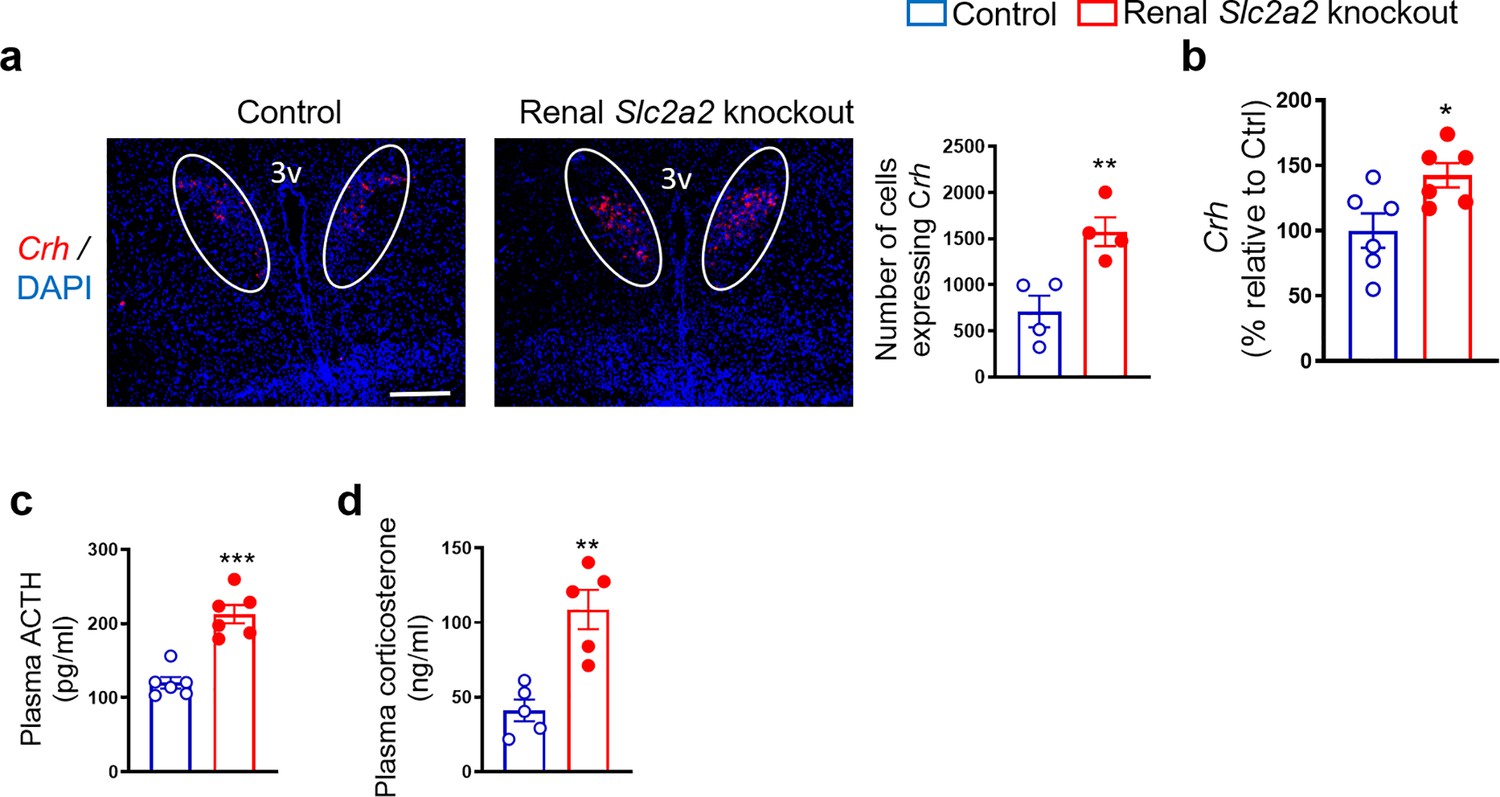
Enhanced activity of hypothalamic-pituitary-adrenal axis in renal Slc2a2 knockout mice.
Representative images from fluorescence RNA in situ hybridization showing an increase in expression of corticotropin-releasing hormone (Crh) in the paraventricular nucleus of the hypothalamus (which is identified here using a white oval shape) in 28 weeks old male renal Slc2a2 knockout mice (a). Scale, 100 µm. For the quantification shown next to the images, four sections per mouse and three areas of interest per section were analyzed in four mice. qRT-PCR analysis showing an increase in hypothalamic Crh (b), data from ELISA demonstrating an increase in plasma adrenocorticotropic hormone (ACTH) (c) and corticosterone (d) in 12 weeks old male renal Slc2a2 knockout mice 12 weeks after inducing the Slc2a2 deficiency. *p<0.05, **p<0.01, ***p<0.001, unpaired two-tailed Student’s t-test. Data are presented as mean ± SEM.
Figure 3 with 1 supplement
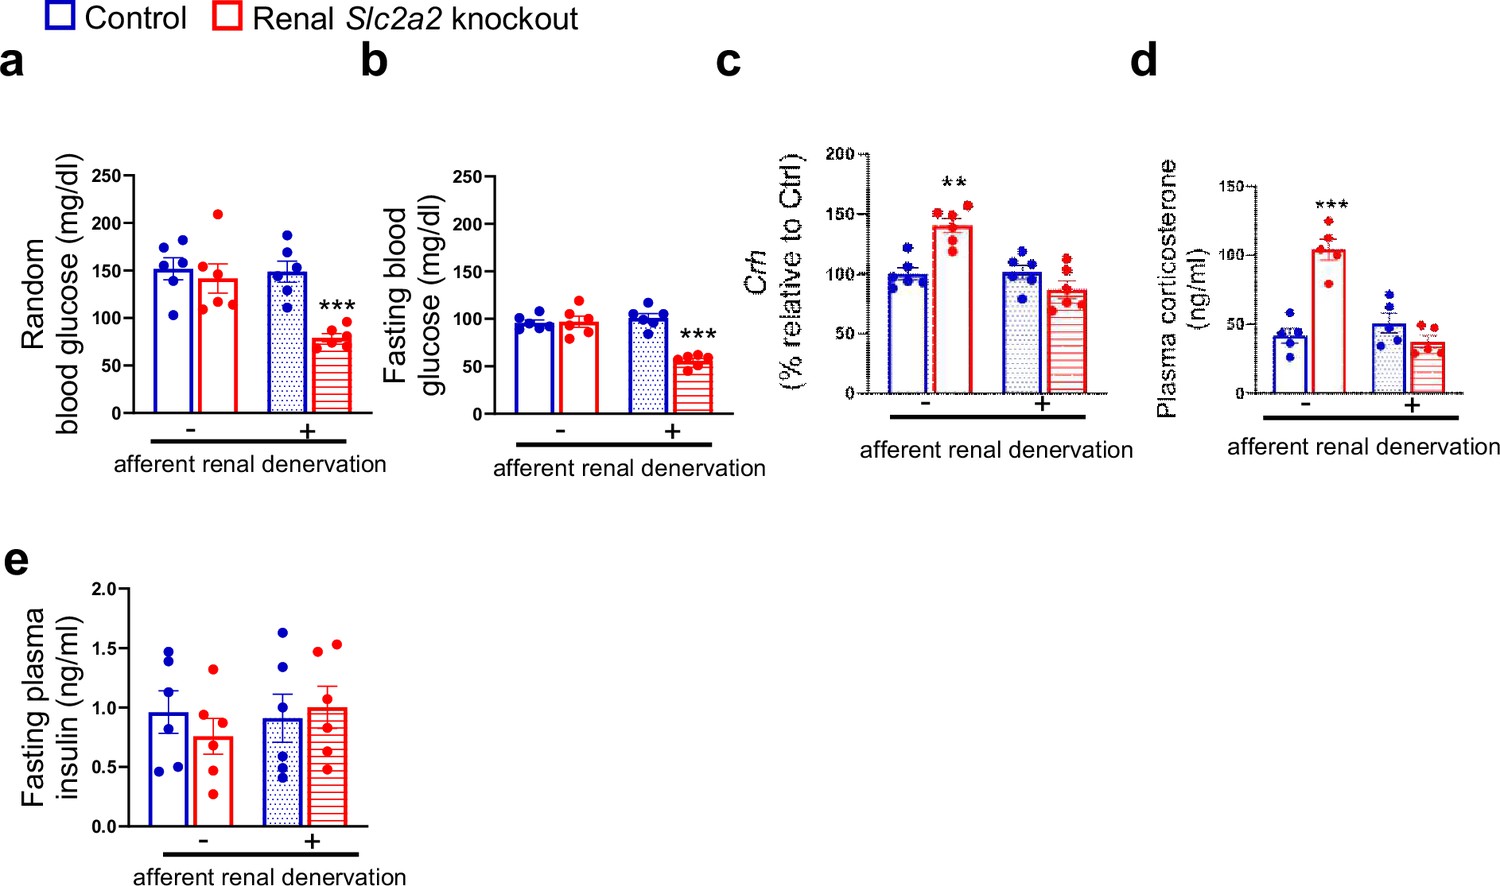
Effects of afferent renal denervation on blood glucose levels and hypothalamic-pituitary-adrenal axis in renal Slc2a2 knockout female mice.
Afferent renal denervation decreases fed (random) and fasting (overnight, 6:00 pm – 9:00 am) blood glucose levels (a, b), restores expression of hypothalamic corticotropin-releasing hormone (Crh) (c) measured using RT-qPCR, and plasma corticosterone (d) without affecting plasma insulin levels (e) in 30 weeks old female renal Slc2a2 knockout mice 16 weeks after inducing the Slc2a2 deficiency. **p0.01, ***p<0.001, two-way ANOVA followed by a Tukey’s post hoc multiple comparison test. Data are presented as mean ± SEM.
Figure 3—figure supplement 1
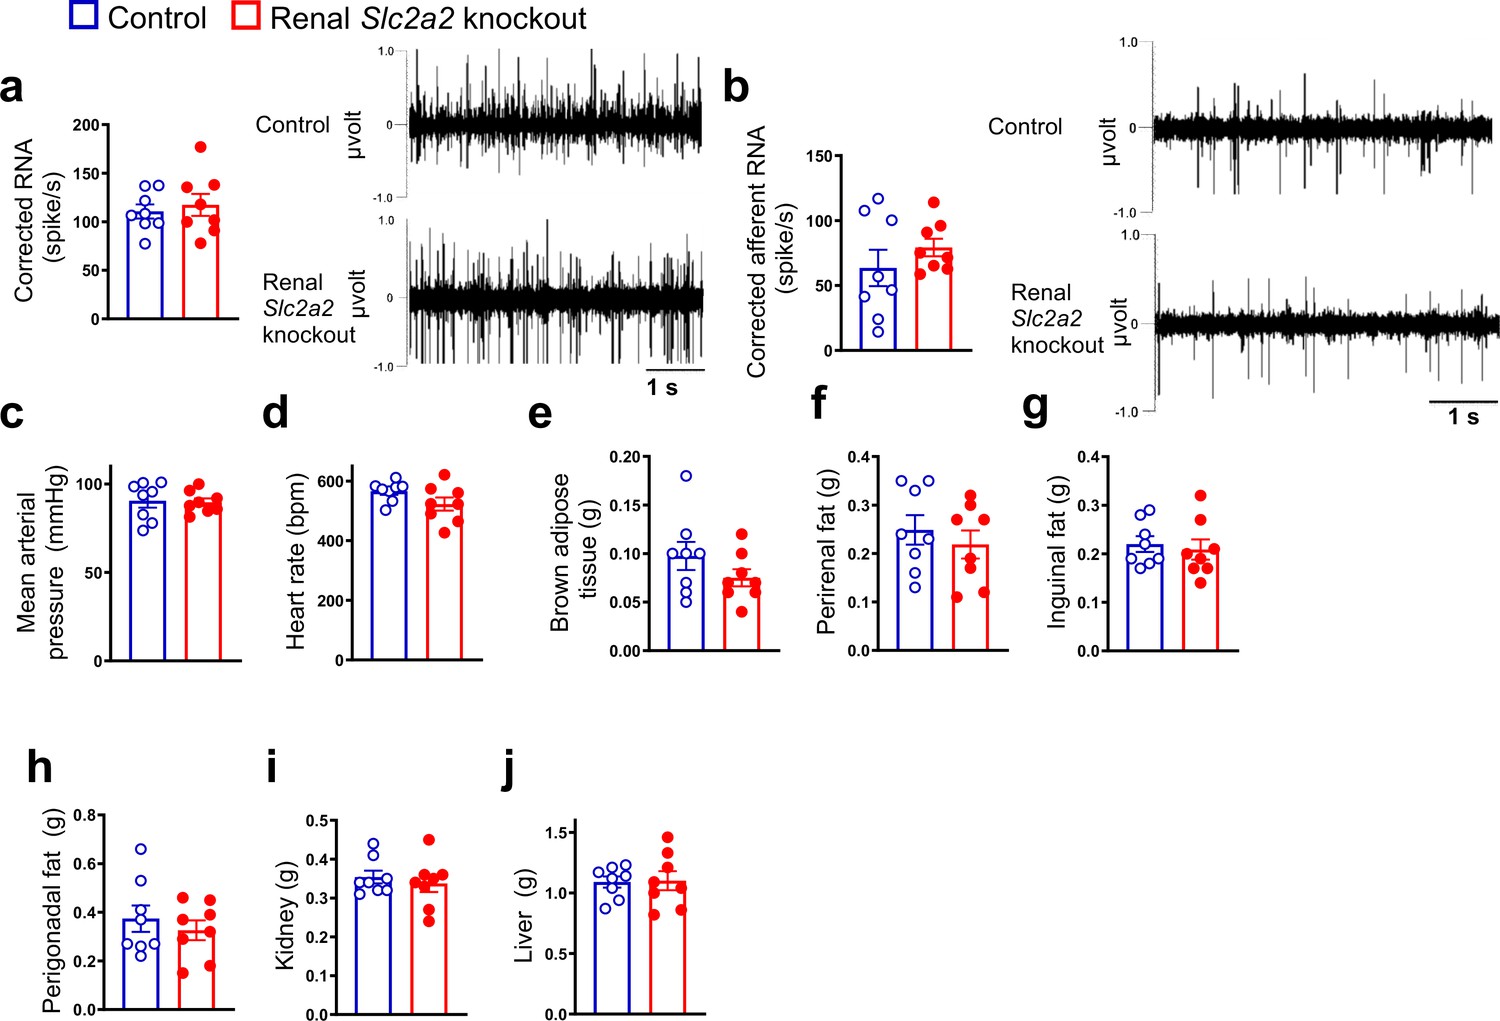
No change in renal nerve activities and tissue weights between renal Slc2a2 knockout mice and their littermate controls.
Total and afferent renal nerve activity including the representative traces (a, b), mean arterial pressure and heart rate (c, d), weights of brown (e) and regional white (f–h) adipose tissues, kidney (i), and liver (j), in 30 weeks old female renal Slc2a2 knockout and their littermate control mice 16 weeks after inducing the Slc2a2 deficiency.
Figure 4 with 1 supplement
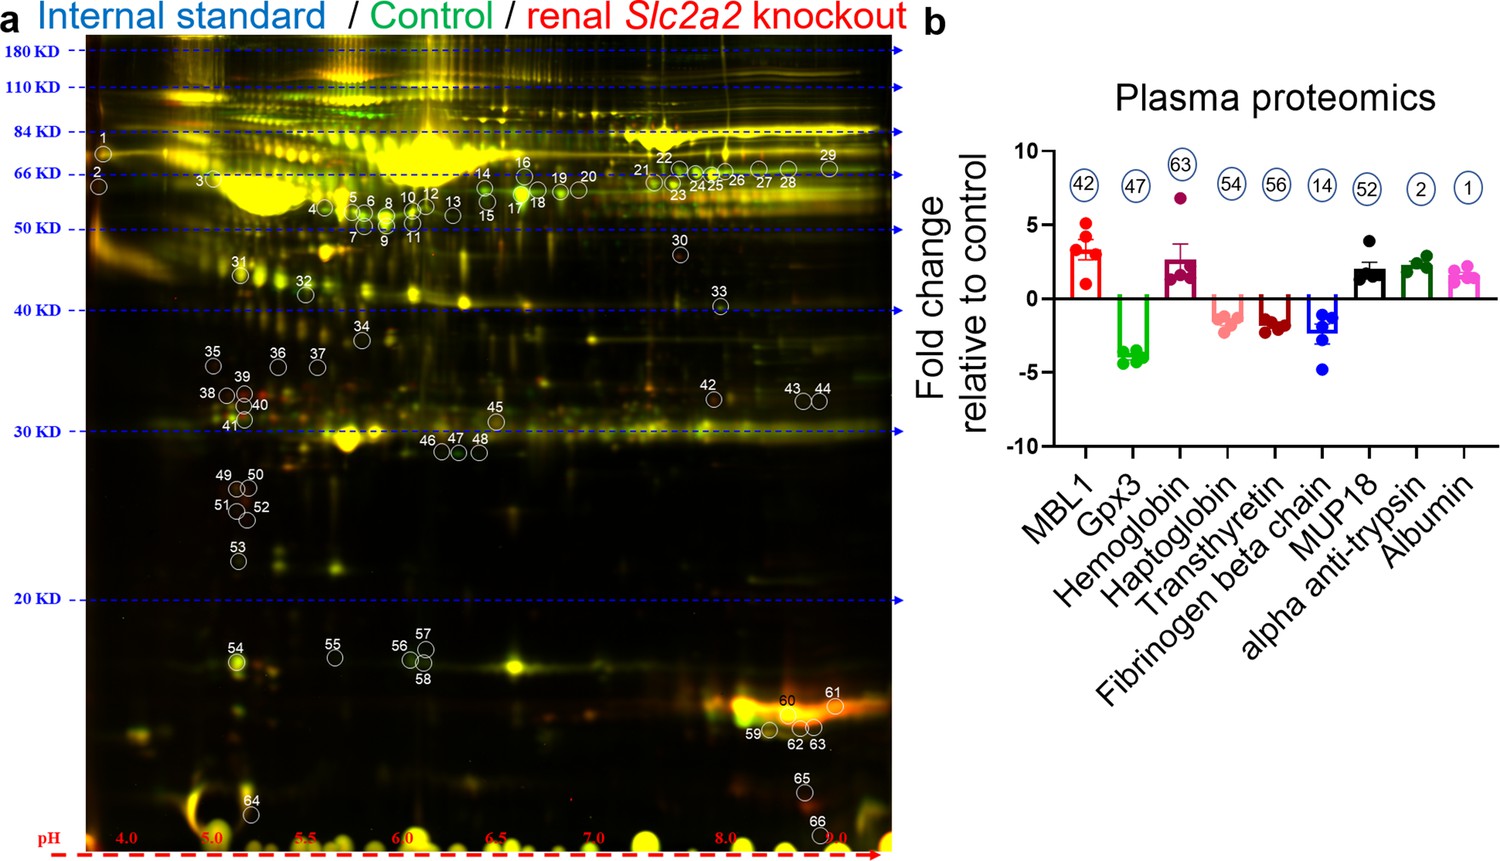
Changes in levels of plasma proteins in renal Slc2a2 knockout male mice 12 weeks after inducing the Slc2a2 deficiency.
Representative image of two-dimensional difference gel electrophoresis with numbered protein spots of interest is shown in (a). Internal standard was prepared using equal amounts of protein of each plasma sample as a quality control (Cy2 labeled, pseudo blue), plasma proteins from control group were labeled using Cy3 dye (shown in pseudo green), and plasma proteins from renal Slc2a2 knockout mice were labeled using Cy5 dye (shown in pseudo red). The identified proteins and their fold change in 28-week-old male renal Slc2a2 knockout mice compared to the control group are shown in (b). The number on each bar graph in (b) represents the corresponding protein spot on the gel shown in (a). MBL1, mannose binding lectin 1; Gpx3, glutathione peroxidase 3; MUP18, major urinary protein 18.
-
Figure 4—source data 1
List of identified proteins in the plasma of renal Slc2a2 knockout male mice.
- https://cdn.elifesciences.org/articles/91540/elife-91540-fig4-data1-v1.xls
Figure 4—figure supplement 1
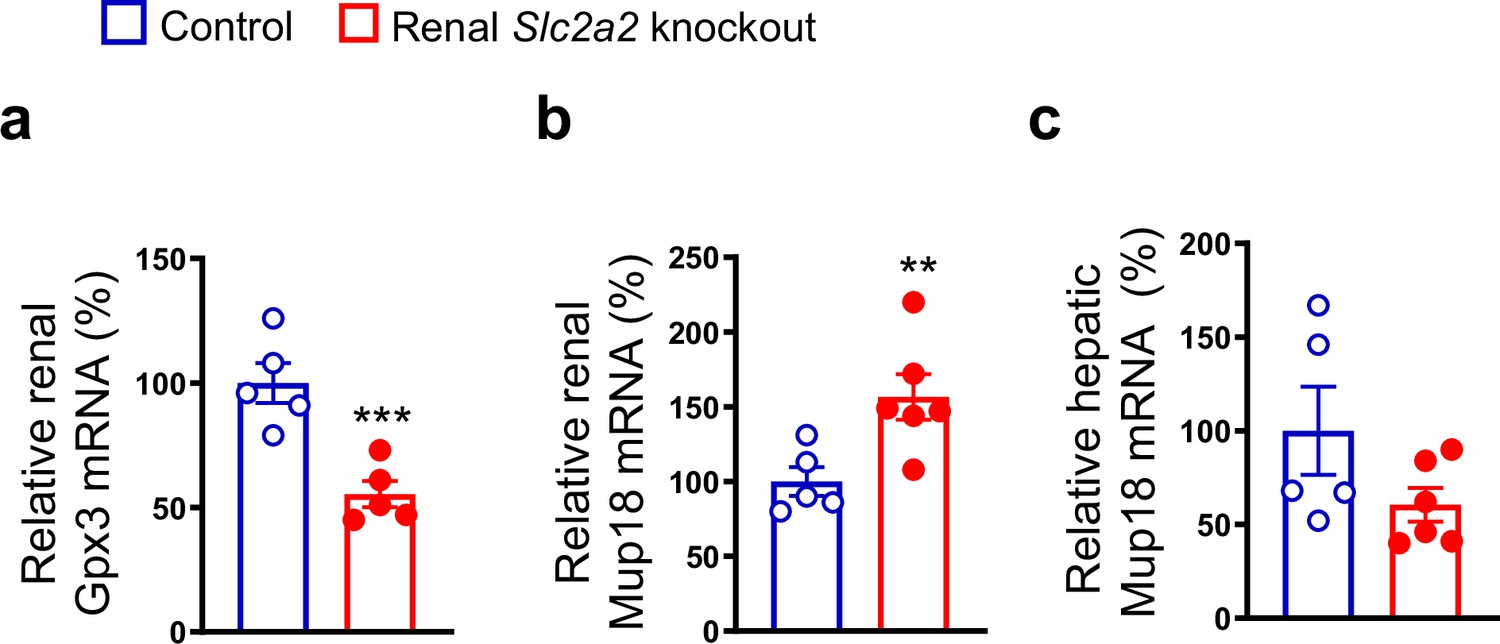
Gene expression analyses in renal Slc2a2 knockout mice.
Renal Slc2a2 knockout male mice (28 weeks old) have reduced expression of glutathione peroxidase 3 (Gpx3) (a) and major urinary protein 18 (Mup18) (b) in the kidneys without affecting hepatic Mup18 (c) measured by RT-qPCR 12 weeks after inducing the Slc2a2 deficiency. **p<0.01, ***p<0.001, unpaired two-tailed Student’s t-test. Data are presented as mean ± SEM.
Download links
A two-part list of links to download the article, or parts of the article, in various formats.
Downloads (link to download the article as PDF)
Open citations (links to open the citations from this article in various online reference manager services)
Cite this article (links to download the citations from this article in formats compatible with various reference manager tools)
A kidney-hypothalamus axis promotes compensatory glucose production in response to glycosuria
eLife 12:RP91540.
https://doi.org/10.7554/eLife.91540.4


