High-risk Escherichia coli clones that cause neonatal meningitis and association with recrudescent infection
- Institute for Molecular Bioscience (IMB), The University of Queensland, Australia
- School of Chemistry and Molecular Biosciences, The University of Queensland, Australia
- Australian Infectious Diseases Research Centre, The University of Queensland, Australia
- University of Queensland Centre for Clinical Research, The University of Queensland, Australia
- Genome Innovation Hub, The University of Queensland, Australia
- Cambodia Oxford Medical Research Unit, Angkor Hospital for Children, Cambodia
- Pathology Queensland, Queensland Health, Australia
- Q-PHIRE Genomics and Public Health Microbiology, Forensic and Scientific Services, Coopers Plains, Australia
- Centre for Tropical Medicine and Global Health, Nuffield Department of Medicine, University of Oxford, United Kingdom
- Department of Microbiology, Tumor and Cell Biology, Division of Clinical Microbiology, Karolinska Institutet and Karolinska University Hospital, Sweden
- Molecular and Integrative Biosciences Research Programme, University of Helsinki, Finland
- Infection Management Prevention Service, Queensland Children's Hospital, Australia
Figures
Figure 1 with 4 supplements
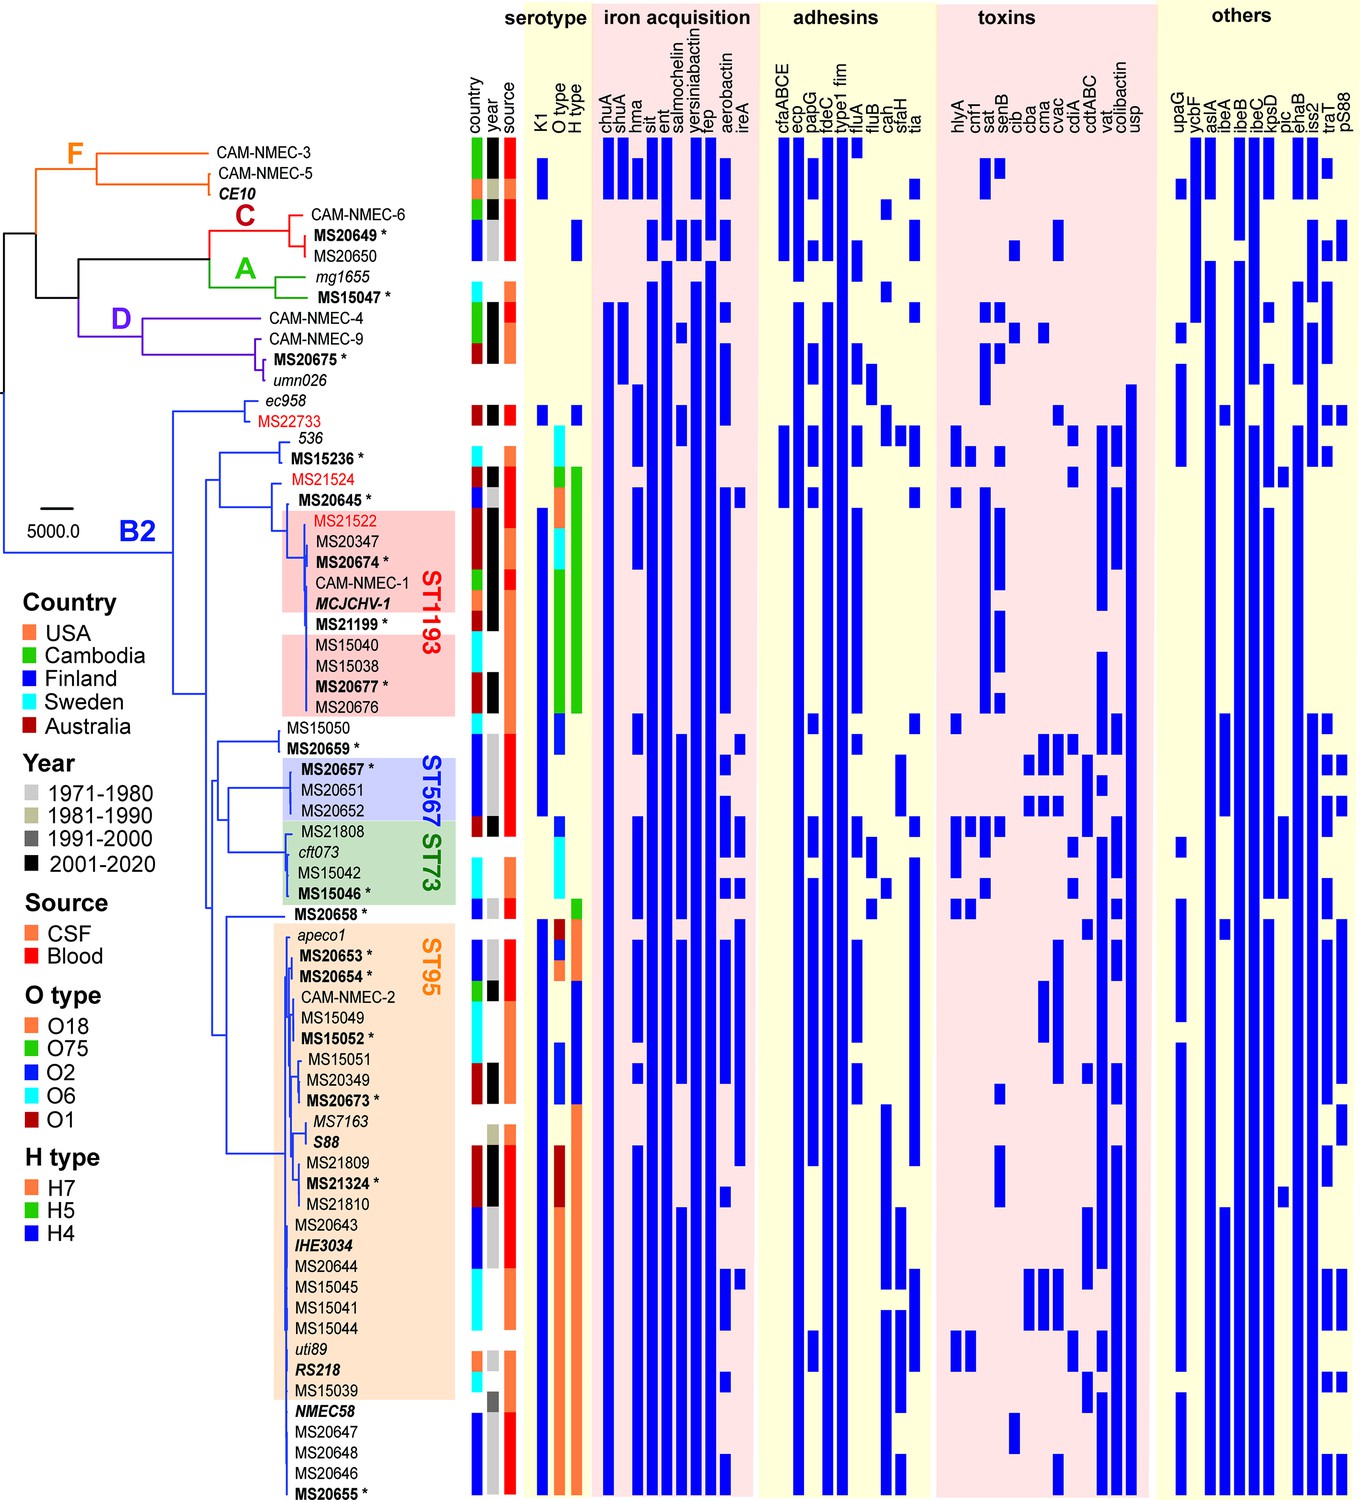
Maximum likelihood phylogram displaying the relationship of the NMEC isolates with their associated serotype and virulence factor profile.
Non-NMEC isolates used in the analysis for referencing are italicised. The phylogram was built and recombination regions removed employing Parsnp, using 185,911 core single-nucleotide polymorphisms (SNPs) and NMEC strain IHE3034 as the reference. The scale bar indicates branch lengths in numbers of SNPs. NMEC isolates with available complete genomes are bold-italicised, while NMEC isolates that were completely sequenced in this study are indicated in bold and marked with an asterisk. The NMEC isolates that caused recrudescent invasive infection in this study are indicated in red. Branches are coloured according to phylogroups: orange, phylogroup F; red, phylogroup C; green, phylogroup A; violet, phylogroup D; and blue, phylogroup B2. The presence of specific virulence factors is indicated in dark blue. The phylogeny can be viewed interactively at https://microreact.org/project/oNfA4v16h3tQbqREoYtCXj-high-risk-escherichia-coli-clones-that-cause-neonatal-meningitis.
Figure 1—figure supplement 1

Number of human-derived E. coli strains from ST95, ST1193, ST38, ST131, ST73, ST10, and ST69 available in the Enterobase database.
Strains were stratified based on their year of isolation, spanning the periods before 2000, 2001–2005, 2006–2010, 2011–2015, and 2016–2022.
Figure 1—figure supplement 2

Antibiotic resistance gene profile of NMEC strains in the collection.
The presence of each resistance gene is denoted by black shading.
Figure 1—figure supplement 3
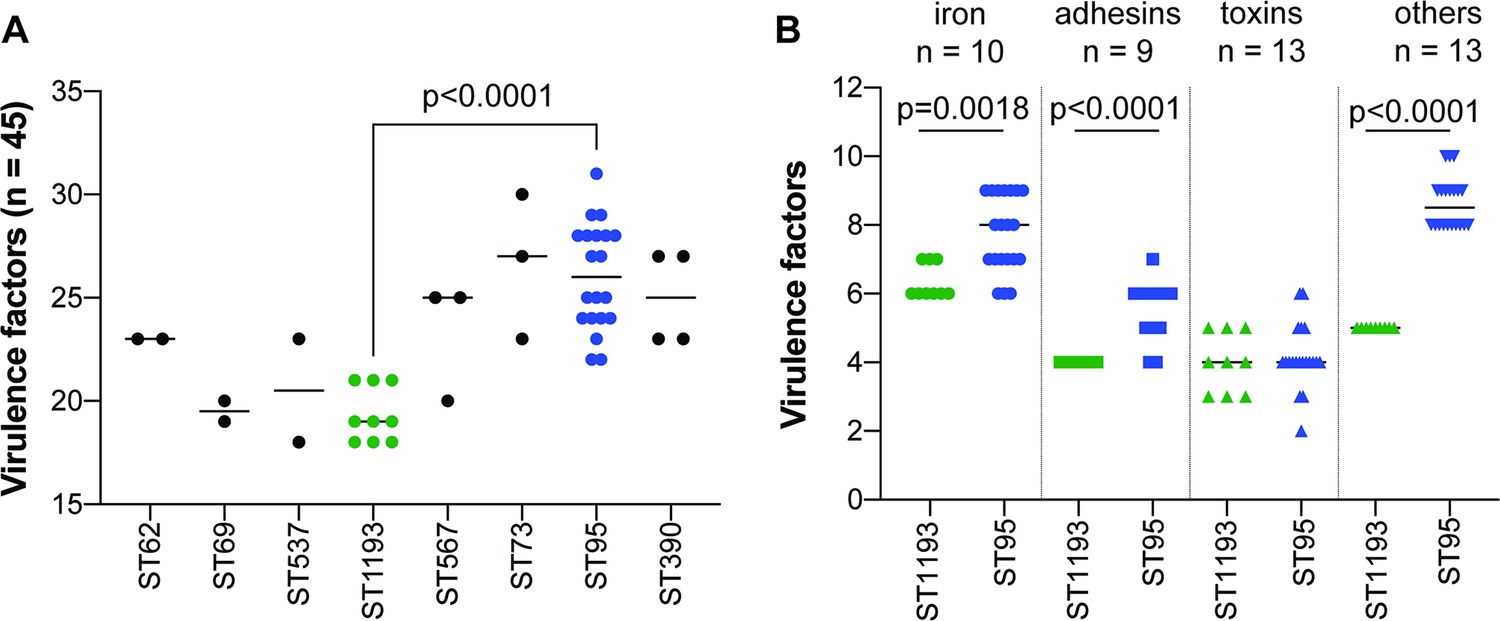
ST95 NMEC strains contain more virulence factors than ST1193 NMEC strains.
(A) The number of virulence genes (grouped as in Figure 1) for each strain within each sequence type (ST). (B) The number of virulence genes grouped by their functions in ST95 versus ST1193 strains. p-value was calculated using Mann–Whitney two-tailed unpaired test.
Figure 1—figure supplement 4
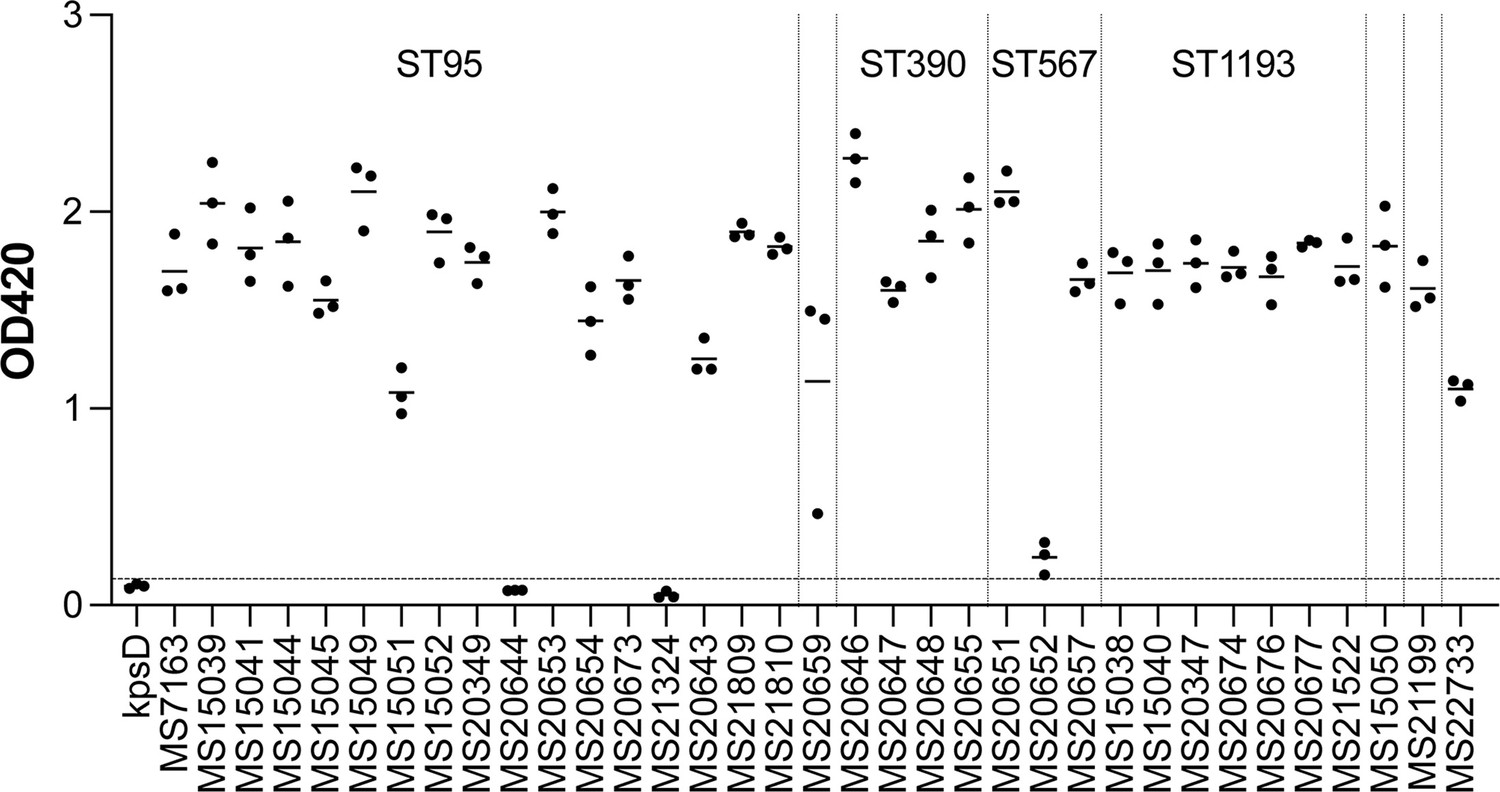
K1 capsule production in NMEC.
K1 capsule production was detected by ELISA using a monoclonal antibody specific for polysialic acid. Strains with an OD420 >0.133 (mean + 3 standard deviations of a negative control kpsD mutant; dashed line) were considered positive for K1 capsule production. Data points represent independent biological replicates with horizontal lines as the mean.
Figure 2
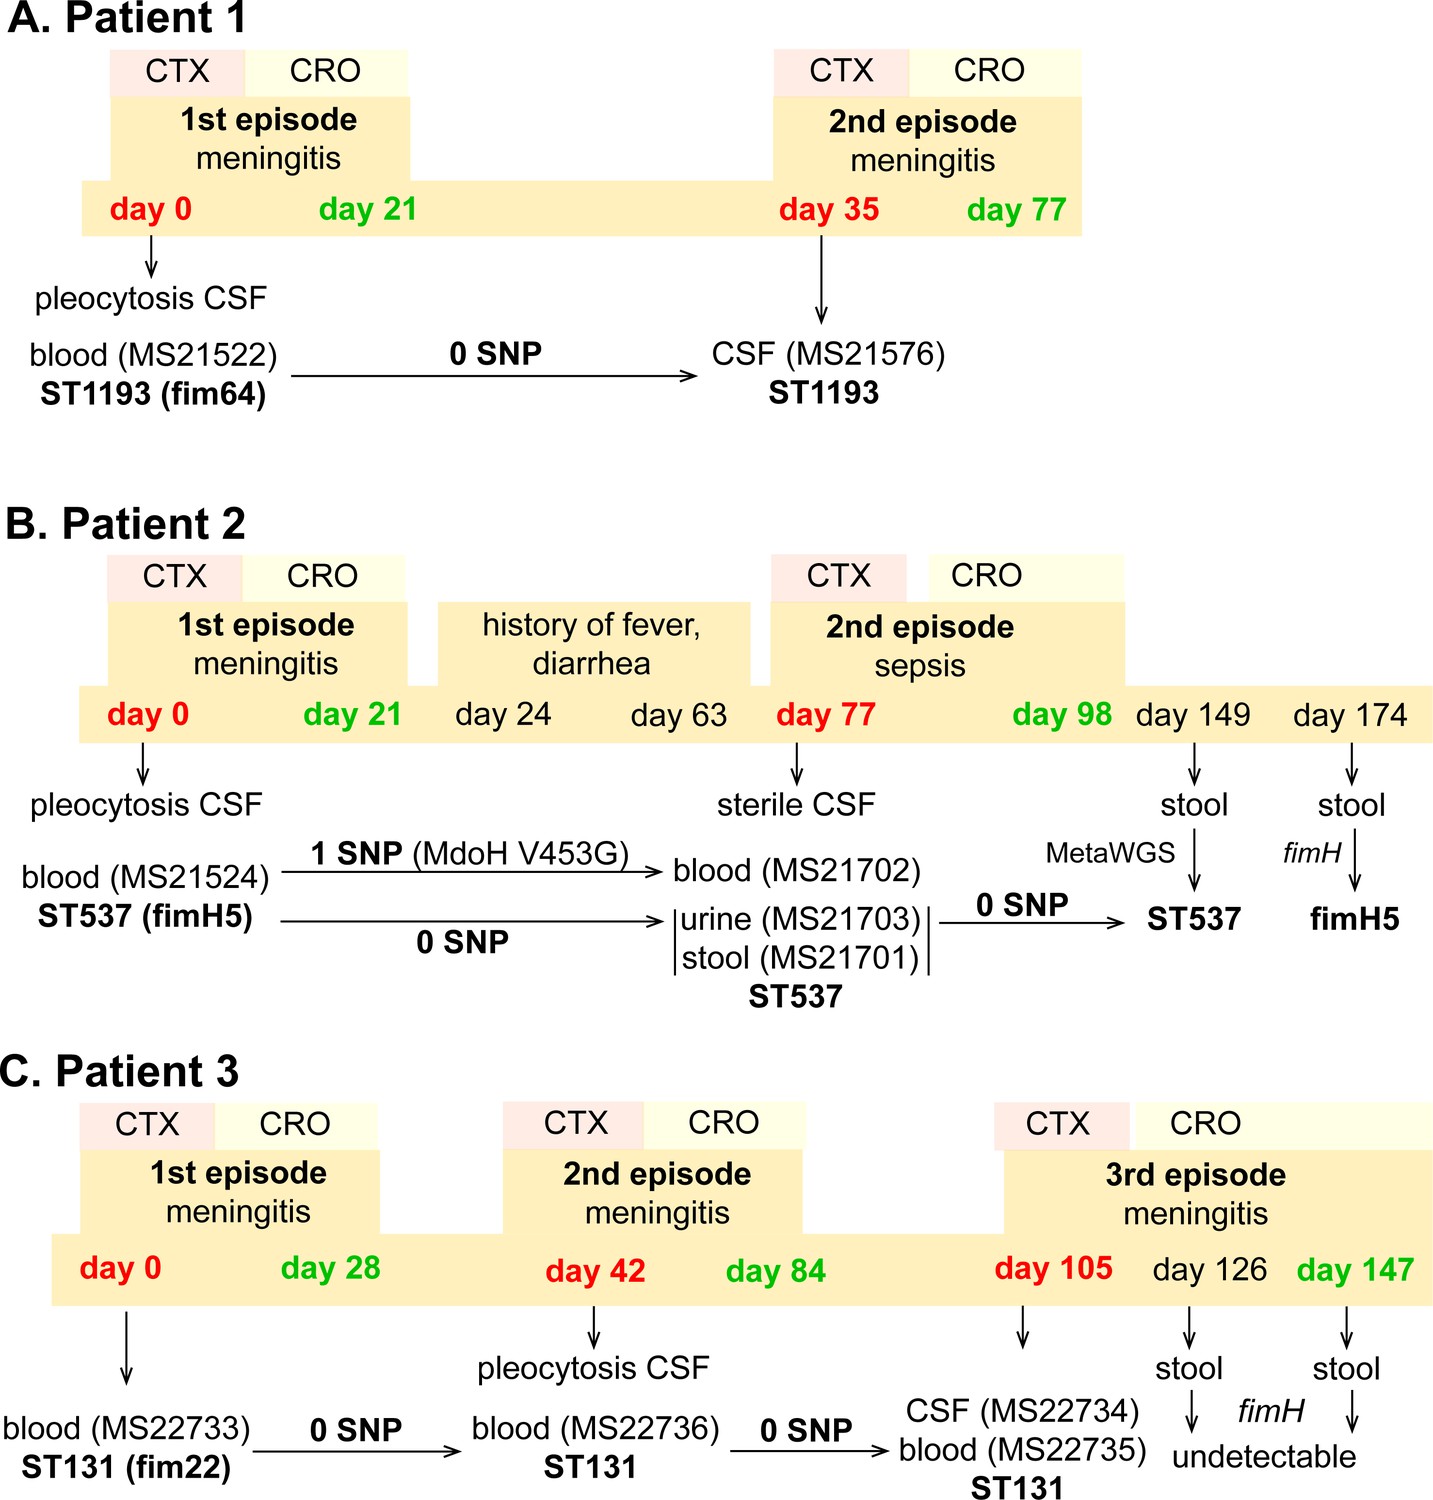
Infection and treatment profile of patients suffering NM and recrudescent invasive infection.
Indicated is the hospital admission history of patients, together with the timeline of sample collection, identified E. coli isolates and their infection source, and isolate identification based on whole-genome sequencing, metagenomic sequencing (MetaWGS), or fimH amplicon sequencing. Genomic relatedness is indicated based on the number of single-nucleotide polymorphisms (SNPs). The time of admission for the initial episode is indicated as day 0, with subsequent timepoints indicated as days post initial admission. Admission and discharge days are indicated in red and green, respectively.
Figure 3
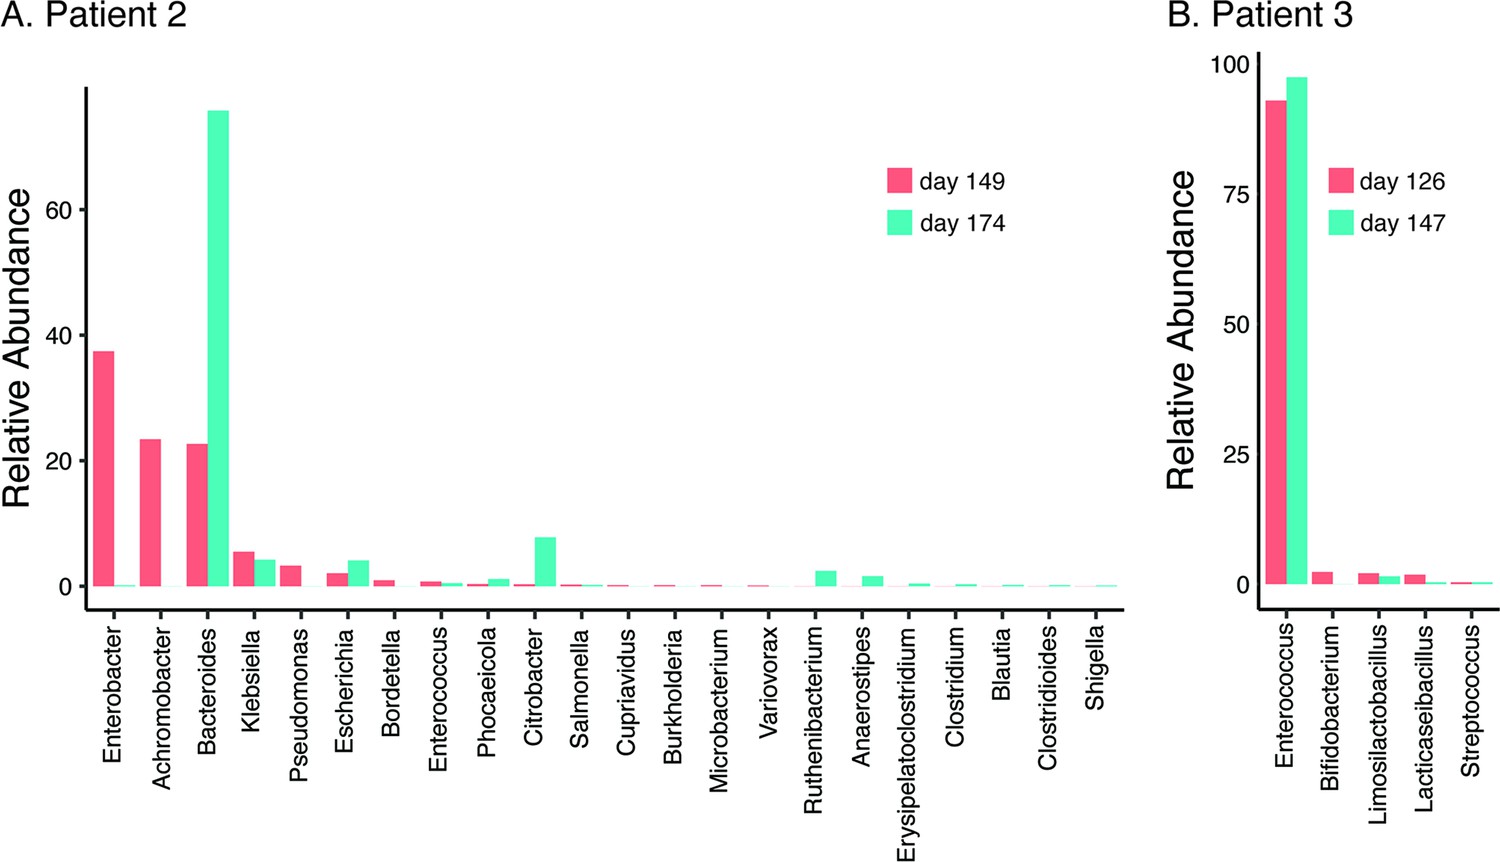
Relative abundance of bacterial genera (≥0.01%) in the gut microbiome of patient 2 at 8- and 12-week follow-up post relapsed infection (days 149 and 174 after initial admission) (A) and patient 3 during treatment and at discharge after the third episode (days 126 and 147 after initial admission) (B).
Figure 4
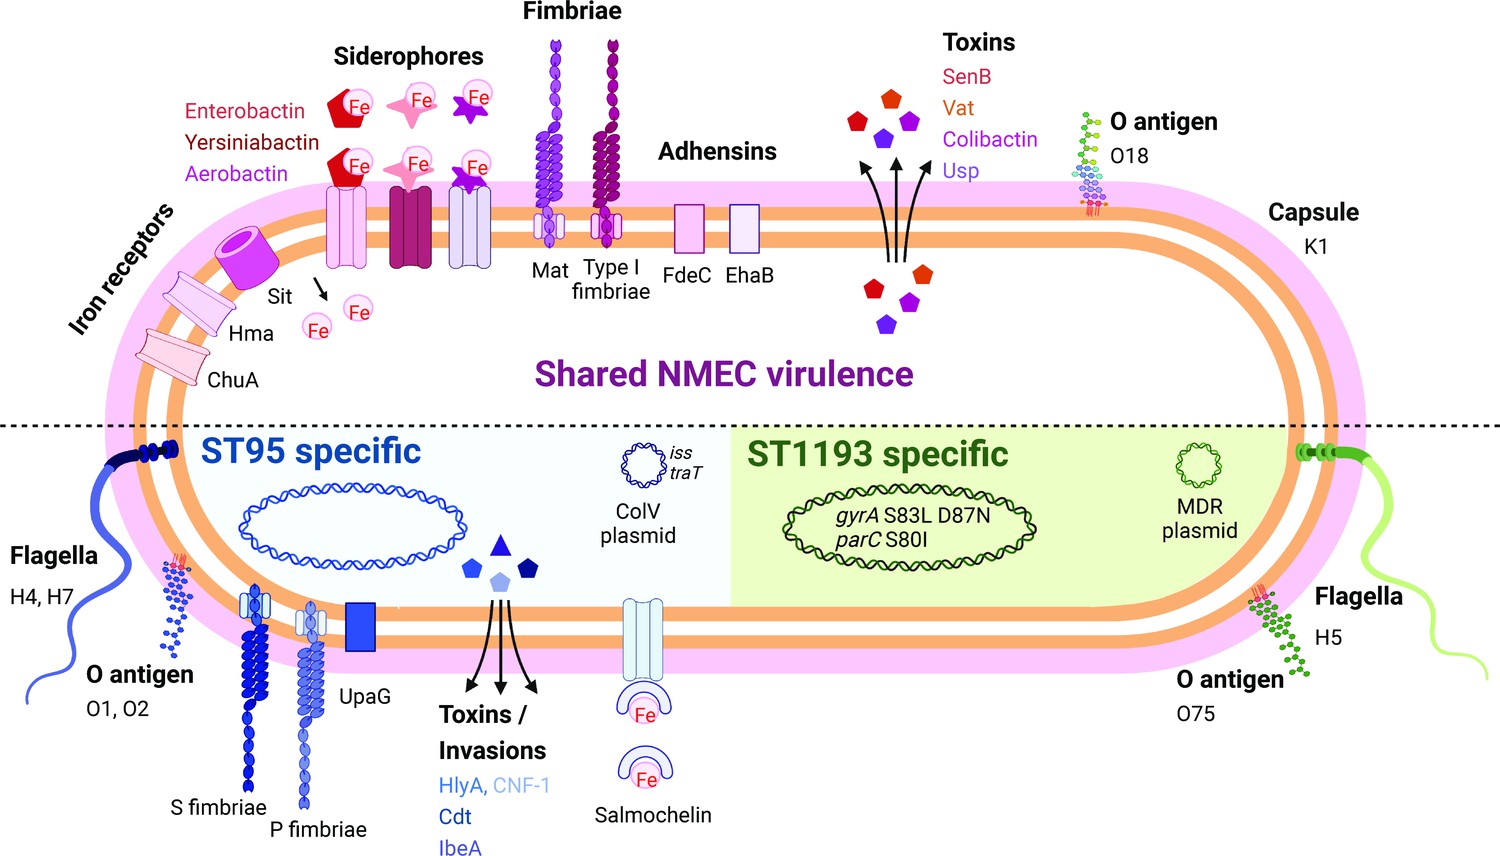
Summary of key NMEC virulence genes based on genome profiling performed in this study.
Shown are shared virulence genes common to most NMEC, as well as ST95- and ST1193-specific NMEC virulence genes.
© 2024, BioRender Inc. Figure 4 was created using BioRender, and is published under a CC BY-NC-ND 4.0 license. Further reproductions must adhere to the terms of this license.
Additional files
-
Supplementary file 1
Isolates used in this study.
- https://cdn.elifesciences.org/articles/91853/elife-91853-supp1-v1.xlsx
-
Supplementary file 2
Completely sequenced NMEC isolates.
- https://cdn.elifesciences.org/articles/91853/elife-91853-supp2-v1.xlsx
-
Supplementary file 3
Metagenomic sequence analysis.
- https://cdn.elifesciences.org/articles/91853/elife-91853-supp3-v1.xlsx
-
Supplementary file 4
Accession numbers of strains sequenced in the study.
- https://cdn.elifesciences.org/articles/91853/elife-91853-supp4-v1.xlsx
Download links
A two-part list of links to download the article, or parts of the article, in various formats.
Downloads (link to download the article as PDF)
Open citations (links to open the citations from this article in various online reference manager services)
Cite this article (links to download the citations from this article in formats compatible with various reference manager tools)
High-risk Escherichia coli clones that cause neonatal meningitis and association with recrudescent infection
eLife 12:RP91853.
https://doi.org/10.7554/eLife.91853.3


