Phosphorylation bar-coding of free fatty acid receptor 2 is generated in a tissue-specific manner
- Centre for Translational Pharmacology, School of Molecular Biosciences, College of Medical, Veterinary and Life Sciences, University of Glasgow, United Kingdom
- 7TM Antibodies GmbH, Germany
- Institute of Pharmacology and Toxicology, University Hospital Jena, Germany
Figures
Figure 1
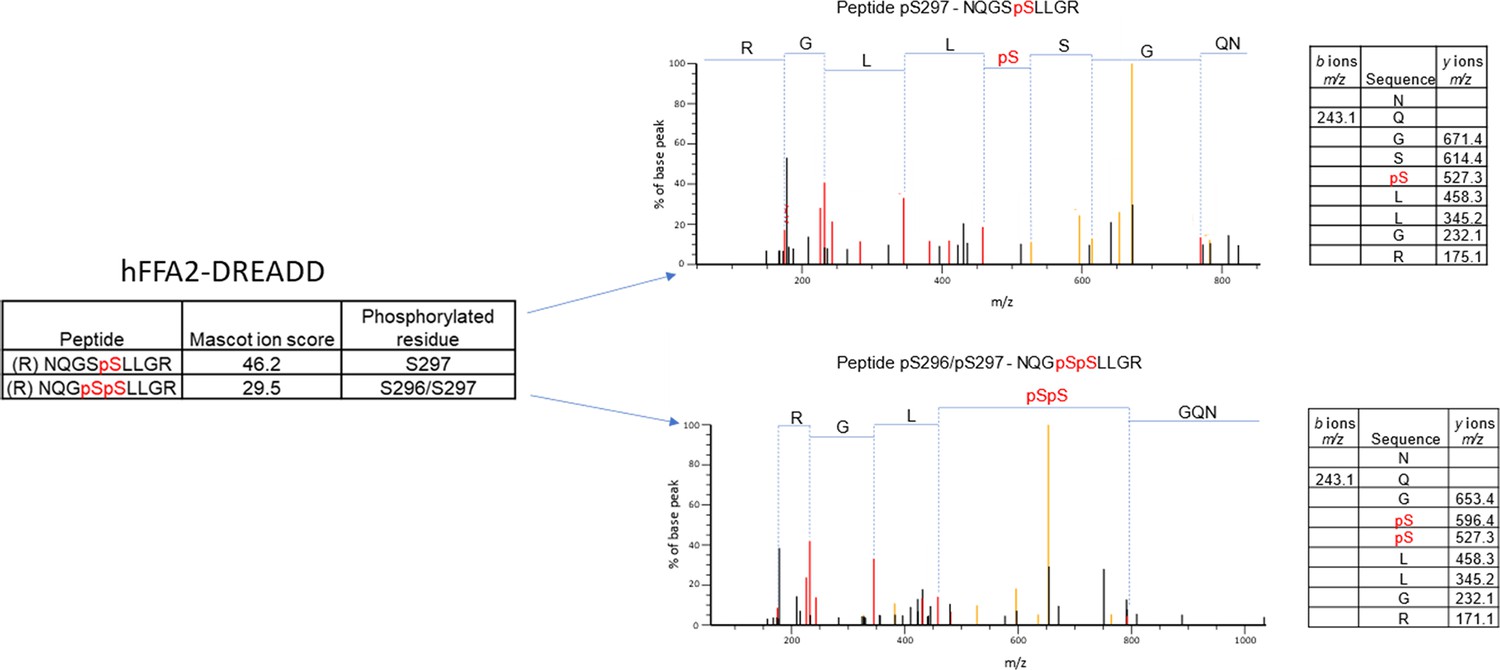
Mass spectrometry analysis of hFFAR2-DREADD-eYFP identifies basal phosphorylation of Ser297 and agonist-promoted phosphorylation of Ser296.
Mass spectrometry analysis was conducted on samples isolated from Flp-In T-REx 293 cells in which expression of hFFAR2-DREADD-eYFP had been induced. Experiments were performed on vehicle and 4-methoxy-3-methyl-benzoic acid (MOMBA)-treated (100 μM, 5 min) cells as detailed in Materials and methods. LC-MS/MS identified Ser297 as being phosphorylated constitutively, and Ser296/297 as being phosphorylated by sorbic acid or MOMBA. Composite outcomes of a series of independent experiments are combined. Fragmentation tables associated with phosphorylated peptides are shown. Phosphorylated residues are highlighted in red.
Figure 2
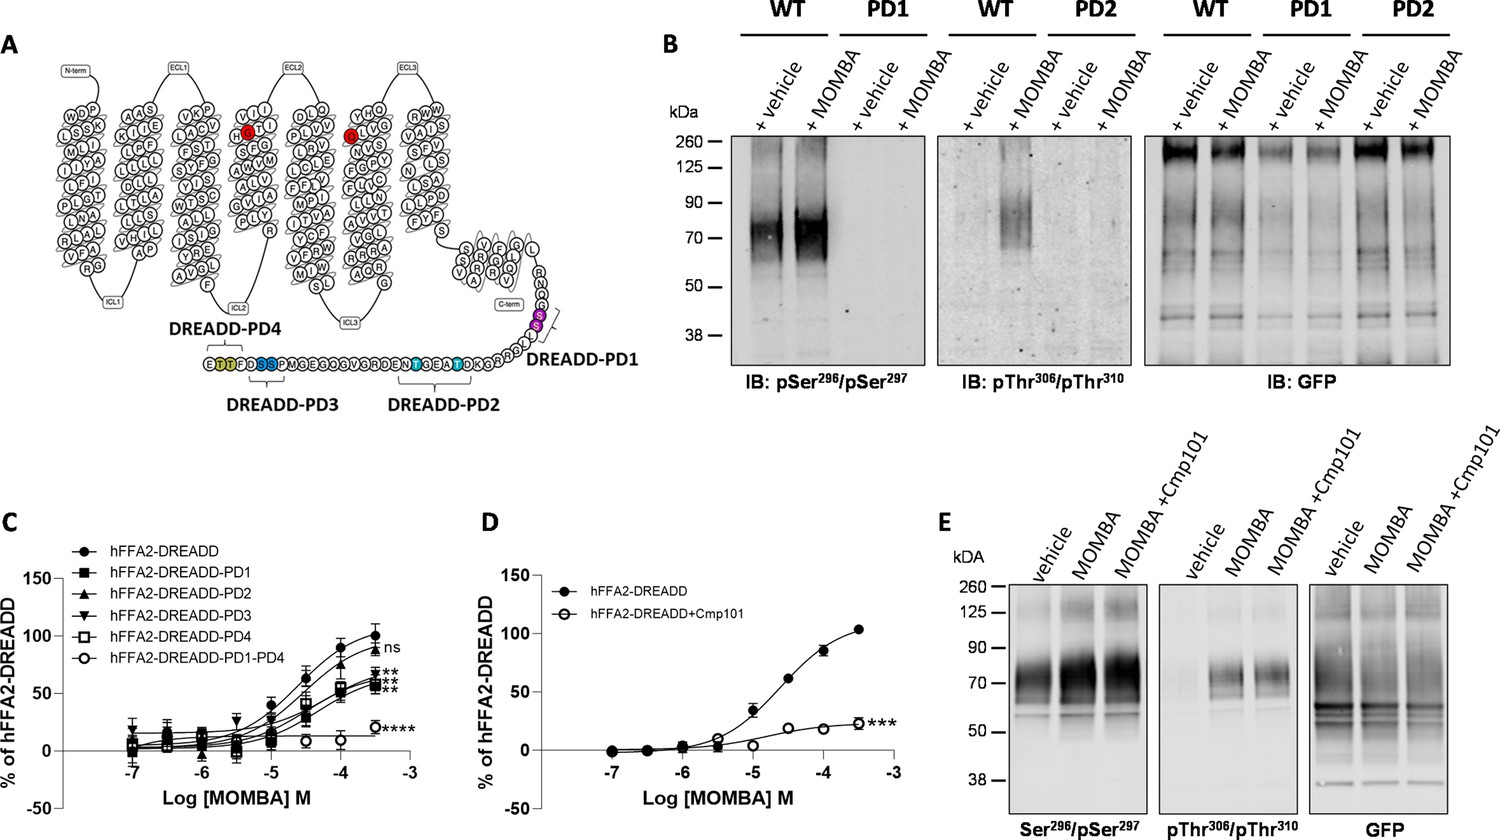
Characteristics of putative pSer296/pSer297 and pThr306/pThr310 hFFAR2-antisera and the effect of potential phospho-acceptor site mutations on agonist-induced arrestin-3 interactions.
The primary amino acid sequence of hFFAR2 is shown (A). Residues altered to generate the DREADD variant are in red (Cys141Gly, His242Gln). Phospho-deficient (PD) hFFAR2-DREADD variants were generated by replacing serine 296 and serine 297 (purple, hFFAR2-DREADD-PD1), threonine 306 and threonine 310 (light blue, hFFAR2-DREADD-PD2), serine 324 and serine 325 (dark blue, hFFAR2-DREADD-PD3) or threonine 328 and 329 (yellow, hFFAR2-DREADD-PD4) with alanine. In addition, hFFAR2-DREADD-PD1-4 was generated by combining all these alterations. (B) The ability of putative pSer296/pSer297 and pThr306/Thr310 antisera to identify wild-type and either PD1 or PD2 forms of hFFAR2-DREADD with and without treatment of cells expressing the various forms with 4-methoxy-3-methyl-benzoic acid (MOMBA) is shown and, as a control, anti-GFP immunoblotting of equivalent samples is illustrated. (C) The ability of varying concentrations of MOMBA to promote interaction of arrestin-3 with hFFAR2-DREADD and each of the DREADD-PD mutants is illustrated. Each of the DREADD-PD variants, except hFFAR2-DREADD-PD2 (ns), were less effective in promoting interactions in response to MOMBA (**p<0.01, ****p<0.0001). (D) The effect of the GRK2/3 inhibitor compound 101 on the capacity of MOMBA to promote recruitment of arrestin-3 to wild-type hFFAR2-DREADD is shown (***p<0.001). Significance in C and D were assessed by one-way ANOVA followed by Dunnett’s multiple comparisons test. (E) The effect of compound 101 on detection of hFFAR2-DREADD-eYFP by each of pSer296/pSer297, pThr306/Thr310, and anti-GFP antisera is shown. Data are representative (B, E) or show means ± SEM (C, D) of at least three independent experiments.
-
Figure 2—source data 1
The ability of putative pSer296/pSer297 antisera to identify wild-type and PD1 forms of hFFAR2-DREADD.
- https://cdn.elifesciences.org/articles/91861/elife-91861-fig2-data1-v1.zip
-
Figure 2—source data 2
The ability of putative and pThr306/Thr310 antisera to identify wild-type and PD2 forms of hFFAR2-DREADD.
- https://cdn.elifesciences.org/articles/91861/elife-91861-fig2-data2-v1.zip
-
Figure 2—source data 3
GFP control for phosphor-antisera to identify wild-type and mutant forms of hFFAR2-DREADD.
- https://cdn.elifesciences.org/articles/91861/elife-91861-fig2-data3-v1.zip
-
Figure 2—source data 4
4-Methoxy-3-methyl-benzoic acid (MOMBA) promotes interaction of arrestin-3 with hFFAR2-DREADD and each of the DREADD-PD mutants.
- https://cdn.elifesciences.org/articles/91861/elife-91861-fig2-data4-v1.xlsx
-
Figure 2—source data 5
The effect of compound 101 on detection of hFFAR2-DREADD-eYFP by pSer296/pSer297.
- https://cdn.elifesciences.org/articles/91861/elife-91861-fig2-data5-v1.zip
-
Figure 2—source data 6
The effect of compound 101 on detection of hFFAR2-DREADD-eYFP by pThr306/Thr310.
- https://cdn.elifesciences.org/articles/91861/elife-91861-fig2-data6-v1.zip
-
Figure 2—source data 7
GFP control for phosphor-antisera to identify the effect of compound 101.
- https://cdn.elifesciences.org/articles/91861/elife-91861-fig2-data7-v1.zip
Figure 3

Agonist-induced detection of hFFAR2-DREADD with putative pSer296/pSer297 and pThr306/pThr310 antisera reflects receptor activation, receptor phosphorylation, and can be detected in situ.
The ability of the pSer296/pSer297, pThr306/pThr310 hFFAR2, and, as a control GFP, antisera to identify hFFAR2-DREADD-eYFP after induction to express the receptor construct and then treatment of cells with vehicle, 4-methoxy-3-methyl-benzoic acid (MOMBA), sorbic acid (each 100 µM), or propionate (C3) (2 mM) is shown. In the ‘-dox’ lanes receptor expression was not induced. (B) As in (A) except that after cell treatment with vehicle or MOMBA, immune-enriched samples were treated with lambda protein phosphatase (LPP) or, rather than treatment with MOMBA, cells were treated with a combination of MOMBA and the hFFAR2 inverse agonist ((S)-3-(2-3-chlorophenyl)acetamido)-4-(4-(trifluoromethyl)phenyl)butanoic acid (CATPB) (10 µM, 30 min pre-treatment). (C, D) Cells harboring hFFAR2-DREADD-eYFP and grown on glass coverslips were either untreated (- dox) or induced to express hFFAR2-DREADD-eYFP. The induced cell samples were then exposed to vehicle, MOMBA (100 µM), or a combination of MOMBA (100 µM) and CATPB (10 µM) for 5 min. Fixed cells were then treated with anti-pThr306/pThr310 (C) or anti-pSer296/pSer297 (D) (red, Alexa Fluor 647) or imaged to detect eYFP (green). DAPI was added to detect DNA and highlight cell nuclei (blue). Scale bar = 20 μm.
-
Figure 3—source data 1
Agonist-induced detection of hFFAR2-DREADD with pTHr306/pThr310antisera.
- https://cdn.elifesciences.org/articles/91861/elife-91861-fig3-data1-v1.zip
-
Figure 3—source data 2
Agonist-induced detection of hFFAR2-DREADD with pSer296/pSer297 antisera.
- https://cdn.elifesciences.org/articles/91861/elife-91861-fig3-data2-v1.zip
-
Figure 3—source data 3
GFP control for agonist-induced detection of hFFAR2-DREADD.
- https://cdn.elifesciences.org/articles/91861/elife-91861-fig3-data3-v1.zip
-
Figure 3—source data 4
Activation and inhibition of hFFAR2-DREADD with pThr306/pThr310 antisera.
- https://cdn.elifesciences.org/articles/91861/elife-91861-fig3-data4-v1.zip
-
Figure 3—source data 5
Activation and inhibition of hFFAR2-DREADD with pSer296/pSer297 antisera.
- https://cdn.elifesciences.org/articles/91861/elife-91861-fig3-data5-v1.zip
-
Figure 3—source data 6
GFP control for activation and inhibition of hFFAR2-DREADD.
- https://cdn.elifesciences.org/articles/91861/elife-91861-fig3-data6-v1.zip
Figure 4
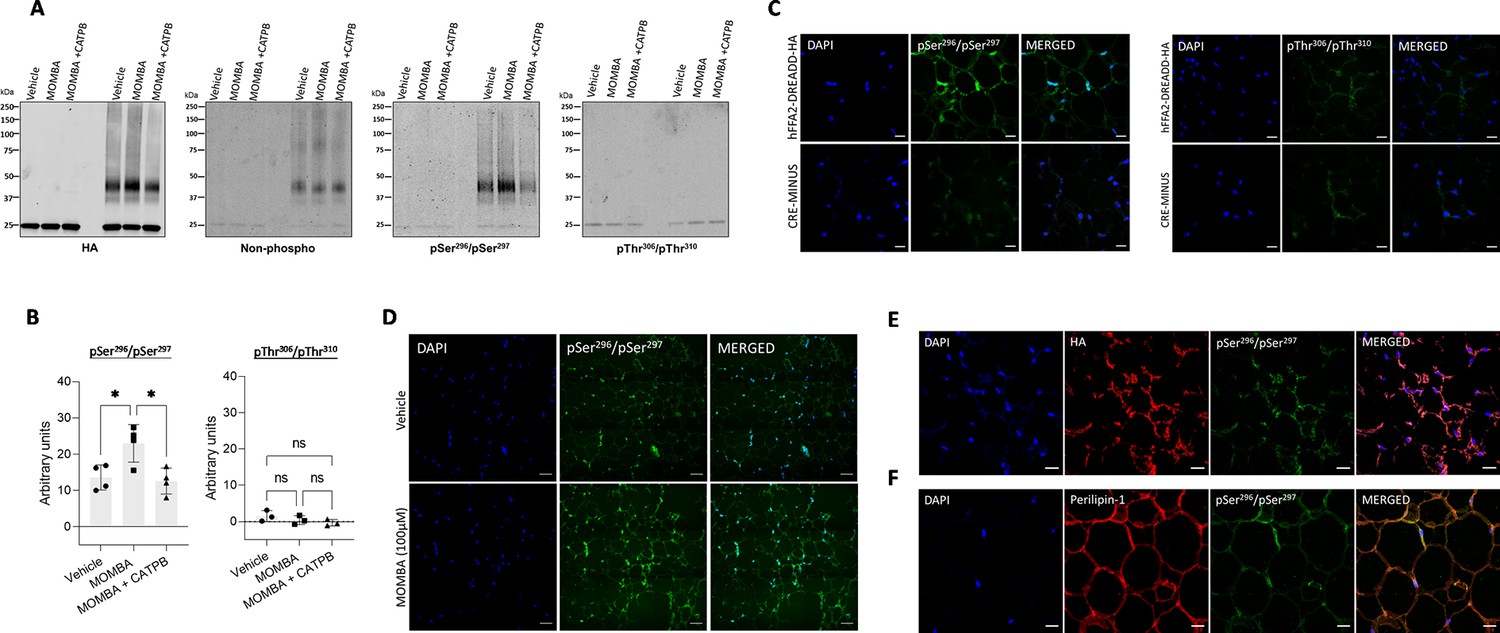
In white adipose tissue residues Ser296/Ser297 of hFFAR2-DREADD-HA but not Thr306/Thr310 become phosphorylated in response to 4-methoxy-3-methyl-benzoic acid (MOMBA).
White adipose tissue dissected from hFFAR2-DREADD-HA and CRE-MINUS mice was treated with either vehicle, 100 µM MOMBA, or 100 µM MOMBA+10 µM ((S)-3-(2-3-chlorophenyl)acetamido)-4-(4-(trifluoromethyl)phenyl)butanoic acid (CATPB). (A) Lysates were prepared and solubilised. hFFAR2-DREADD-HA was immunoprecipitated using an anti-HA monoclonal antibody and following SDS-PAGE immunoblotted to detect HA, non-phosphorylated hFFAR2-DREADD-HA, and pSer296/pSer297 or pThr306/pThr310hFFAR2-DREADD-HA. A representative experiment is shown. (B) Quantification of pSer296/pSer297 (left) and pThr306/pThr310 immunoblots (right) phosphorylation (means ± SEM) in experiments using tissue from different mice, *p<0.05, ns: not significant. Significance was assessed by one-way ANOVA, followed by Tukey’s multiple comparisons test (n=4). (C) Tissue samples from hFFAR2-DREADD-HA (top panel) and CRE-MINUS (bottom panel) mice that were treated with MOMBA were immunostained to detect pSer296/pSer297 (left panels), pThr306/pThr310 (right panels) and counterstained with DAPI (blue). Scale bars = 20 µm. (D) Comparison of pSer296/pSer297 staining of samples from hFFAR2-DREADD-HA-expressing mice vehicle treated (top panels) or treated with MOMBA (bottom panels) (scale bar = 50 µm). (E, F) Tissue sections from hFFAR2-DREADD-HA-expressing mice immunostained with pSer296/pSer297 (green) and anti-HA (red) (E) to detect the receptor expression or F with anti-perilipin-1 (red) to identify adipocytes. Merged images are shown to the right. Scale bars = 20 µm.
-
Figure 4—source data 1
hFFAR2-DREADD-HA expression in white adipose tissue.
- https://cdn.elifesciences.org/articles/91861/elife-91861-fig4-data1-v1.zip
-
Figure 4—source data 2
pSer296/pSer297 detects phosphorylation of hFFAR2-DREADD-HA in white adipose tissue.
- https://cdn.elifesciences.org/articles/91861/elife-91861-fig4-data2-v1.zip
-
Figure 4—source data 3
pThr306/pThr310 is not phosphorylated in white adipose tissue.
- https://cdn.elifesciences.org/articles/91861/elife-91861-fig4-data3-v1.zip
-
Figure 4—source data 4
Quantification of pSer296/pSer297 and pThr306/pThr310 immunoblots in white adipose tissue.
- https://cdn.elifesciences.org/articles/91861/elife-91861-fig4-data4-v1.xlsx
Figure 5 with 1 supplement

hFFAR2-DREADD-HA becomes phosphorylated at Thr306/Thr310 in addition to Ser296/Ser297 in immune cells from Peyer’s patches.
Peyer’s patches isolated from hFFAR2-DREADD-HA-expressing mice were immunostained with anti-HA (red) to detect receptor expression. Images were acquired with ×20 (left panel) and ×63 (right panel) objectives (scale bar = 200 µm) (A). Tissue sections were counterstained with (B) anti-CD11c as a marker of dendritic cells, monocytes, and/or macrophages or (C) RORγT to detect type-III innate lymphoid cells (scale bar = 20 µm). Isolated Peyer’s patches and mesenteric lymph nodes from CRE-MINUS and hFFAR2-DREADD-HA mice were exposed to either vehicle, 100 µM 4-methoxy-3-methyl-benzoic acid (MOMBA) or 100 µM MOMBA+10 µM ((S)-3-(2-3-chlorophenyl)acetamido)-4-(4-(trifluoromethyl)phenyl)butanoic acid (CATPB). (D) Following lysate preparation, immunoprecipitation and SDS-PAGE samples were probed to detect HA, pThr306/pThr310, or pSer296/pSer297. (E) Quantification of pThr306/pThr310 (left) and pSer296/pSer297 immunoblots (right) hFFAR2-DREADD-HA (means ± SEM), *p<0.05, **p<0.01. Significance was assessed by one-way ANOVA, followed by Tukey’s multiple comparisons test (n=3). (F) Treated tissue sections were also used in immunohistochemical studies, employing either pThr306/pThr310 (left panels) or pSer296/pSer297 (right panels) (scale bars = 100 µm).
-
Figure 5—source data 1
hFFAR2-DREADD-HA expression in Peyer’s patches.
- https://cdn.elifesciences.org/articles/91861/elife-91861-fig5-data1-v1.zip
-
Figure 5—source data 2
pThr306/pThr310 detects agonist-dependent phosphorylation in Peyer’s patches.
- https://cdn.elifesciences.org/articles/91861/elife-91861-fig5-data2-v1.zip
-
Figure 5—source data 3
pSer296/pSer297 detects both constitutive and agonist-dependent phosphorylation in Peyer’s patches.
- https://cdn.elifesciences.org/articles/91861/elife-91861-fig5-data3-v1.zip
-
Figure 5—source data 4
Quantification of pSer296/pSer297 and pThr306/pThr310 immunoblots in Peyer’s patches.
- https://cdn.elifesciences.org/articles/91861/elife-91861-fig5-data4-v1.xlsx
Figure 5—figure supplement 1
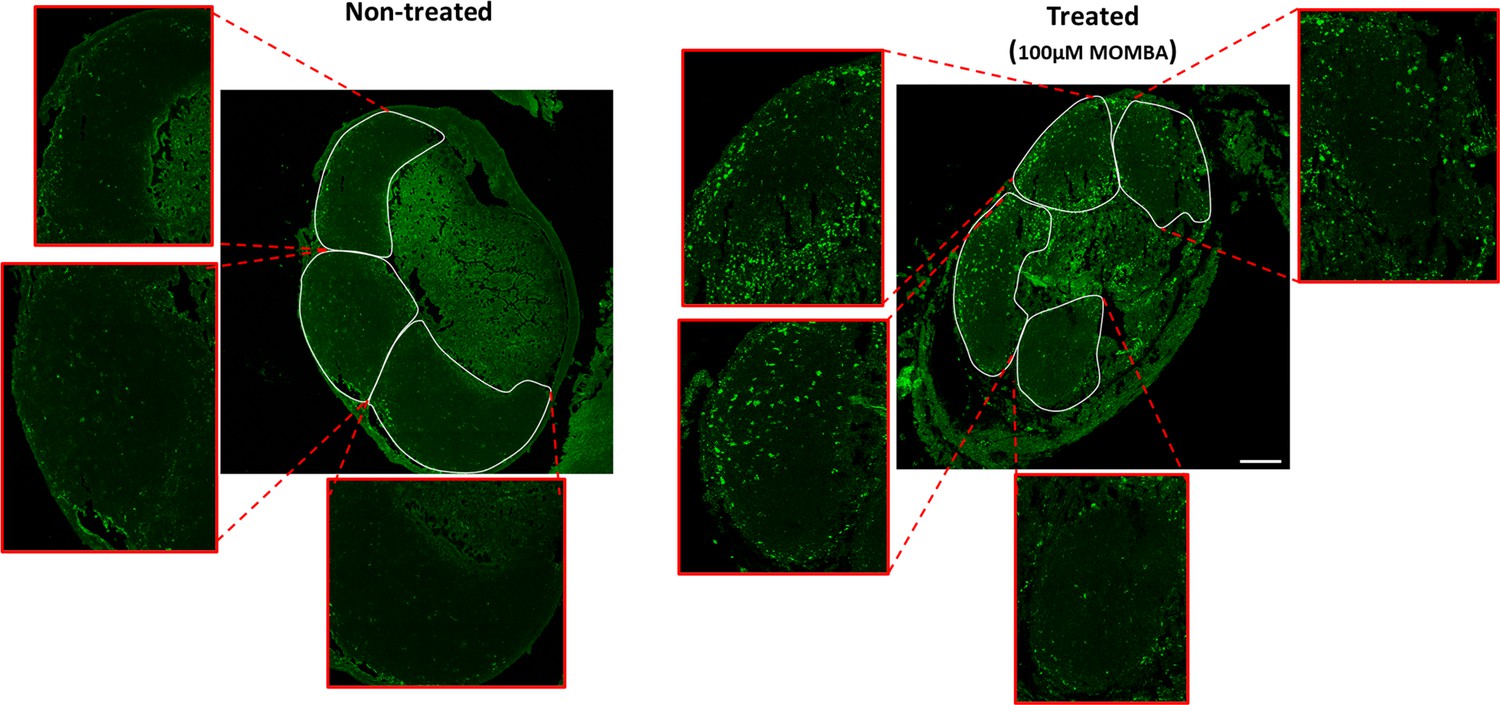
hFFAR2-DREADD-HA becomes phosphorylated at Thr306/Thr310 in immune cells within Peyer’s patches.
Experiments akin to those of Figure 5F were conducted using the pThr306/pThr310 hFFAR2 antiserum. The figure illustrates 4-methoxy-3-methyl-benzoic acid (MOMBA)-induced phosphorylation of pThr306/pThr310 in immune cells within Peyer’s patches of hFFAR2-DREADD-HA-expressing mice. Peyer’s patches were either treated with vehicle (left panel) or MOMBA (100 µM) (right panel). Each lymphoid nodule has been expanded to show detailed phosphorylation inside each nodule.
Figure 6
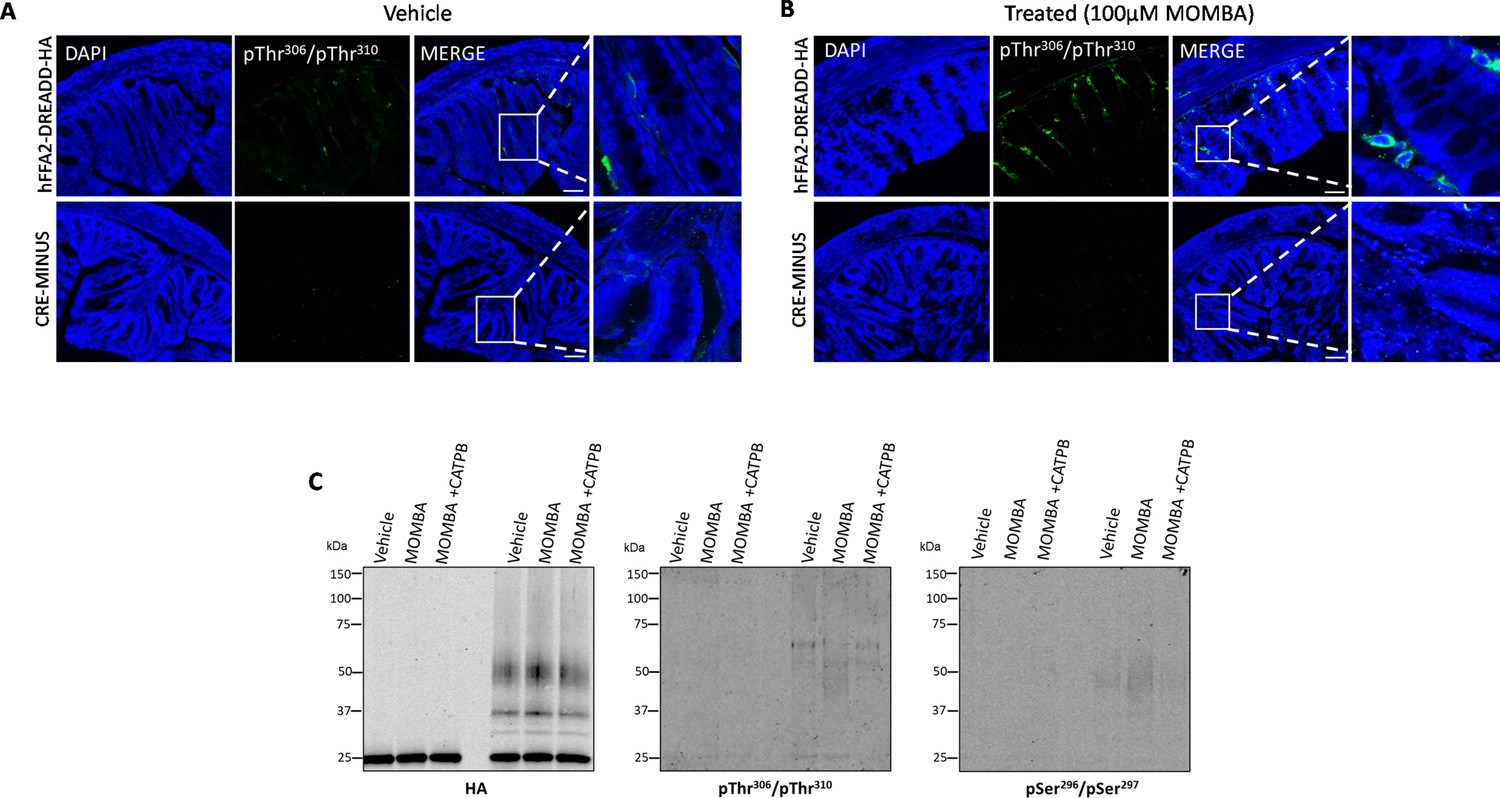
4-Methoxy-3-methyl-benzoic acid (MOMBA) promotes limited phosphorylation of both Ser296/Ser297 and Thr306/Thr310 in hFFAR2-DREADD-HA in lower gut enteroendocrine cells.
(A, B) Colonic tissue isolated from hFFAR2-DREADD-HA (top panels) or CRE-MINUS (bottom panels) mice treated with either vehicle (A) or 100 µM MOMBA (B). Following fixation tissue sections were immunostained with pThr306/pThr310 and counterstained with DAPI (scale bar = 100 µm). In the merged images, the box is expanded in the right-hand panels. (C) Lysates prepared from tissue samples treated as noted were analysed by probing immunoblots with anti-HA, anti-pThr306/pThr310, or anti-pSer296/pSer297. Representative examples are shown.
-
Figure 6—source data 1
hFFAR2-DREADD-HA expression in colonic epithelium.
- https://cdn.elifesciences.org/articles/91861/elife-91861-fig6-data1-v1.zip
-
Figure 6—source data 2
pThr306/pThr310 detects phosphorylation in colonic crypts.
- https://cdn.elifesciences.org/articles/91861/elife-91861-fig6-data2-v1.zip
-
Figure 6—source data 3
pSer296/pSer297 detects phosphorylation in colonic crypts.
- https://cdn.elifesciences.org/articles/91861/elife-91861-fig6-data3-v1.zip
Figure 7
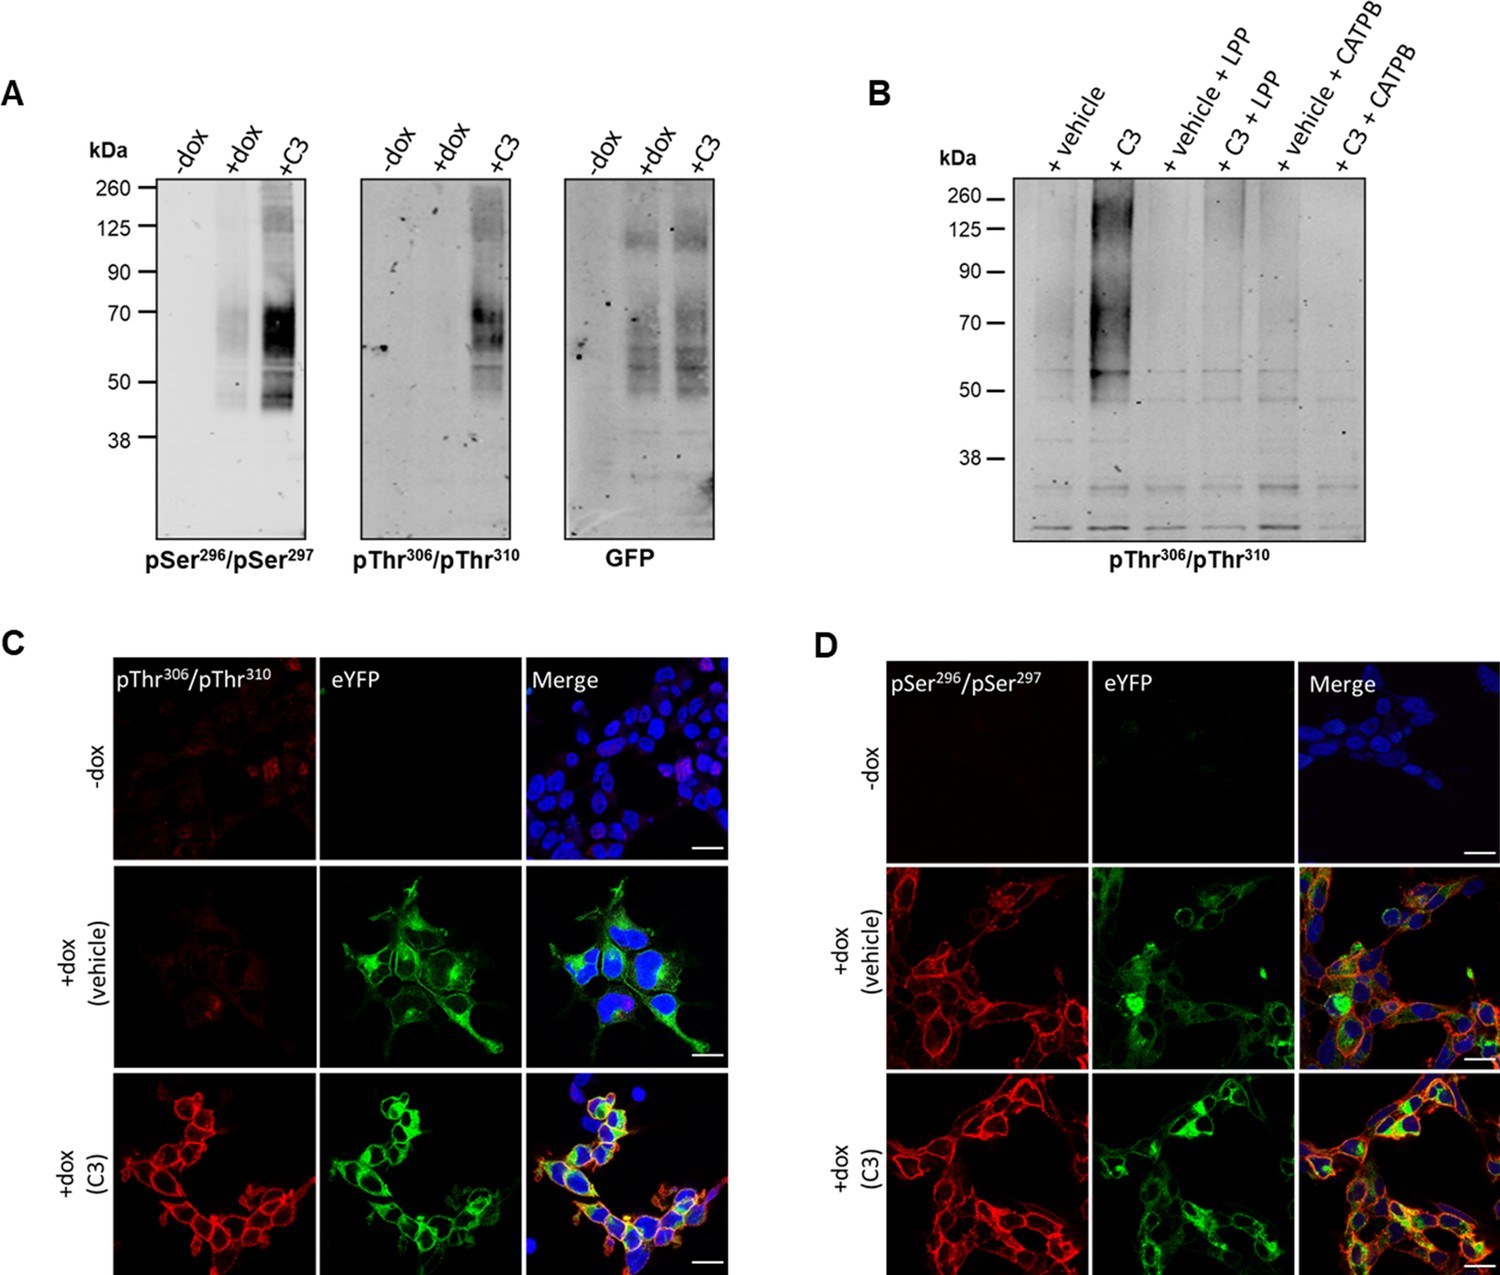
Propionate regulates phosphorylation of hFFAR2-eYFP: in vitro studies.
Flp-In T-REx 293 cells habouring hFFAR2-eYFP were induced to express the receptor construct (+dox) or not (-dox) and the induced cells were then treated with propionate (C3, 2 mM, 5 min) or vehicle. (A) Cell lysates were resolved by SDS-PAGE and then immunoblotted with anti-pSer296/pSer297 hFFAR2, anti-pThr306/pThr310 hFFAR2, or anti-GFP. (B) Cells induced to express hFFAR2-eYFP were treated with C3 (2 mM, 5 min) or vehicle. Where noted cells were pre-treated with the hFFAR2 antagonist (S)-3-(2-(3-chlorophenyl)acetamido)-4-(4-(trifluoromethyl)phenyl)butanoic acid (CATPB) (10 μM, 20 min before agonist addition). Lysates were then prepared and, where indicated, treated with lambda protein phosphatase (LPP). Following SDS-PAGE the samples were immunoblotted with anti-pThr306/pThr310 hFFAR2. (C, D) Cells were doxycycline induced (+dox) or not (-dox) and prepared for immunocytochemistry after treatment with C3 or vehicle and exposed to anti-pThr306/pThr310 hFFAR2 (C) or anti-pSer296/pSer297 hFFAR2 (D) (red) whilst direct imaging detected the presence of hFFAR2-eYFP (green). Merged images (right-hand panels) were also stained with DAPI (blue) to identify cell nuclei. Scale bars = 20 µm.
-
Figure 7—source data 1
The ability of putative pSer296/pSer297 antisera to identify phosphorylation of hFFAR2-eYFP.
- https://cdn.elifesciences.org/articles/91861/elife-91861-fig7-data1-v1.zip
-
Figure 7—source data 2
The ability of putative and pThr306/Thr310 antisera to phosphorylation of hFFAR2-eYFP.
- https://cdn.elifesciences.org/articles/91861/elife-91861-fig7-data2-v1.zip
-
Figure 7—source data 3
GFP control for phosphor-antisera to identify phosphorylation of hFFAR2-eYFP.
- https://cdn.elifesciences.org/articles/91861/elife-91861-fig7-data3-v1.zip
-
Figure 7—source data 4
The ability of pThr306/Thr310 antisera to detect phosphorylation and inhibition of hFFAR2-eYFP.
- https://cdn.elifesciences.org/articles/91861/elife-91861-fig7-data4-v1.zip
Figure 8 with 2 supplements

C3 induces phosphorylation of both pSer296/pSer297 and pThr306/pThr310 in Peyer’s patches from hFFAR2-HA-expressing mice.
Isolated Peyer’s patches and mesenteric lymph nodes from hFFAR2-HA and the corresponding CRE-MINUS mice were exposed to either vehicle or 10 mM C3 for 20 min. Tissue sections were used in immunohistochemical studies, employing either anti-pThr306/pThr310 (A) or anti-pSer296/pSer297 (B) (scale bars = 100 µm). (C) Lysates from Peyer’s patches isolated from hFFAR2-HA-expressing mice, or the corresponding CRE-MINUS mice, that had been treated with vehicle, C3 (10 mM, 20 min), or C3+(S)-3-(2-(3-chlorophenyl)acetamido)-4-(4-(trifluoromethyl)phenyl)butanoic acid (CATPB) (10 μM, 30 min before agonist) were immunoprecipitated with anti-HA as for the hFFAR2-DREADD-HA-expressing mice in Figure 5. Subsequent to SDS-PAGE samples such were probed to detect HA (C, left), anti-pThr306/pThr310(C, centre), or anti-pSer296/pSer297(C, right). hFFAR2-HA was detected as a broad smear of protein(s) with Mr centred close to 55 kDa. (D) Quantification of pThr306/pThr310 (left) and pSer296/pSer297 immunoblots (right) phosphorylation in experiments using tissue from three different mice (means ± SEM), *p<0.05, ns: not significant. Significance was assessed by one-way ANOVA, followed by Tukey’s multiple comparisons test (n=3).
-
Figure 8—source data 1
hFFAR2-HA expression in Peyer’s patches.
- https://cdn.elifesciences.org/articles/91861/elife-91861-fig8-data1-v1.zip
-
Figure 8—source data 2
pThr306/pThr310 detects agonist-dependent phosphorylation in hFFAR2-HA Peyer’s patches.
- https://cdn.elifesciences.org/articles/91861/elife-91861-fig8-data2-v1.zip
-
Figure 8—source data 3
pSer296/pSer297 detects agonist-dependent phosphorylation in hFFAR2-HA Peyer’s patches.
- https://cdn.elifesciences.org/articles/91861/elife-91861-fig8-data3-v1.zip
-
Figure 8—source data 4
Quantification of pSer296/pSer297 and pThr306/pThr310 immunoblots for hFFAR2-HA in Peyer’s patches.
- https://cdn.elifesciences.org/articles/91861/elife-91861-fig8-data4-v1.xlsx
Figure 8—figure supplement 1
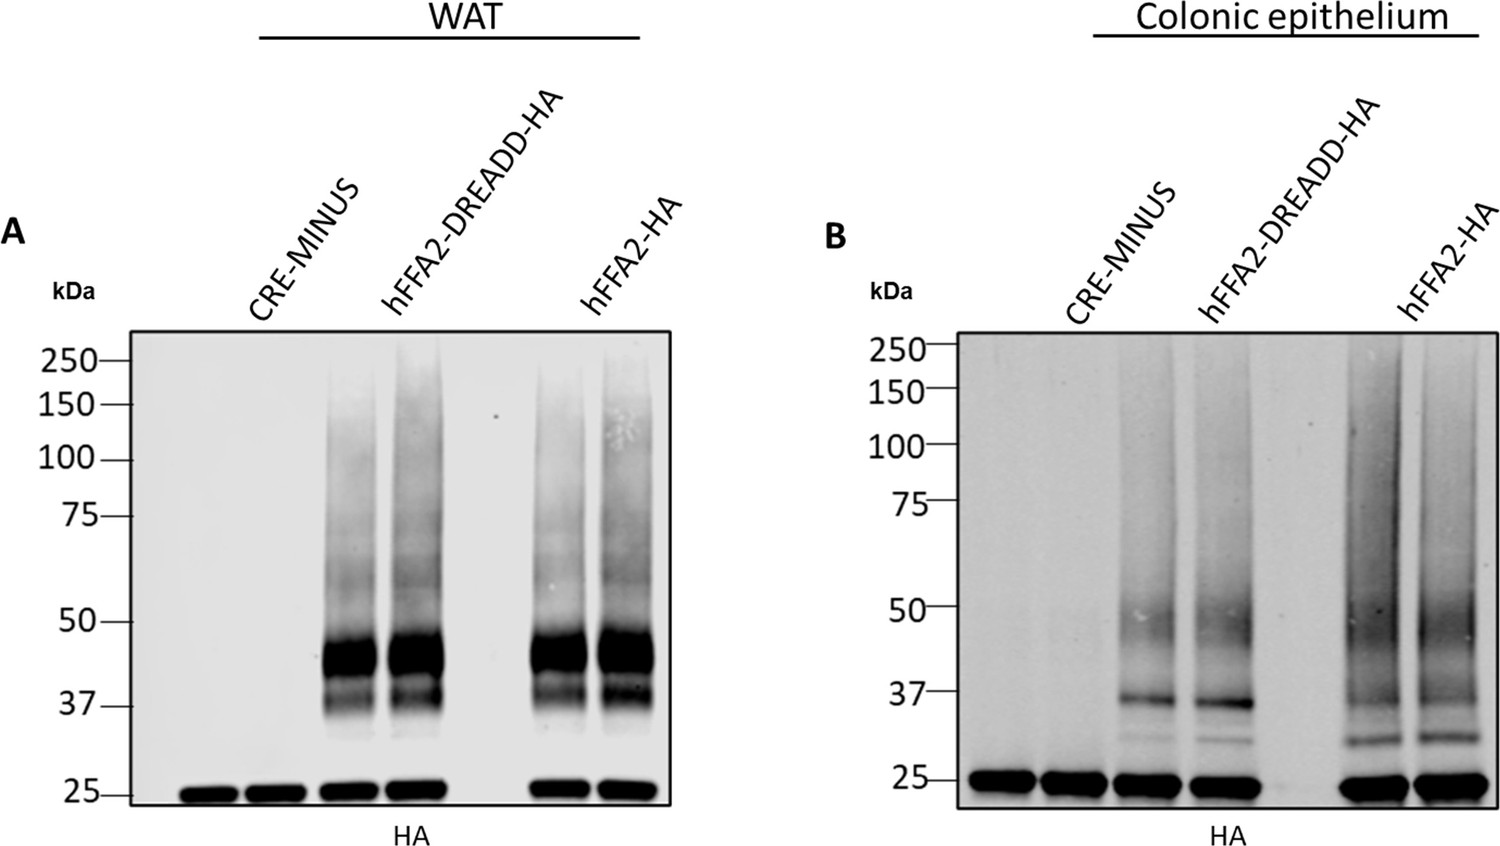
Tissues of transgenic mice express similar levels of hFFAR2-HA and hFFAR2-DREADD-HA.
White adipose (WAT) (left panel) and colonic epithelial (right panel) tissue was isolated from CRE-MINUS and both hFFAR2-DREADD-HA and hFFAR2-HA-expressing transgenic mice. Anti-HA immunoprecipitations were then performed, and samples resolved by SDS-PAGE followed by immunoblotting with anti-HA. For both tissues similar levels and patterns of the receptor proteins were detected from the hFFAR2-DREADD-HA and hFFAR2-HA-expressing mice, whilst these were absent in tissue from CRE-MINUS animals. A representative experiment of three is shown.
Figure 8—figure supplement 2
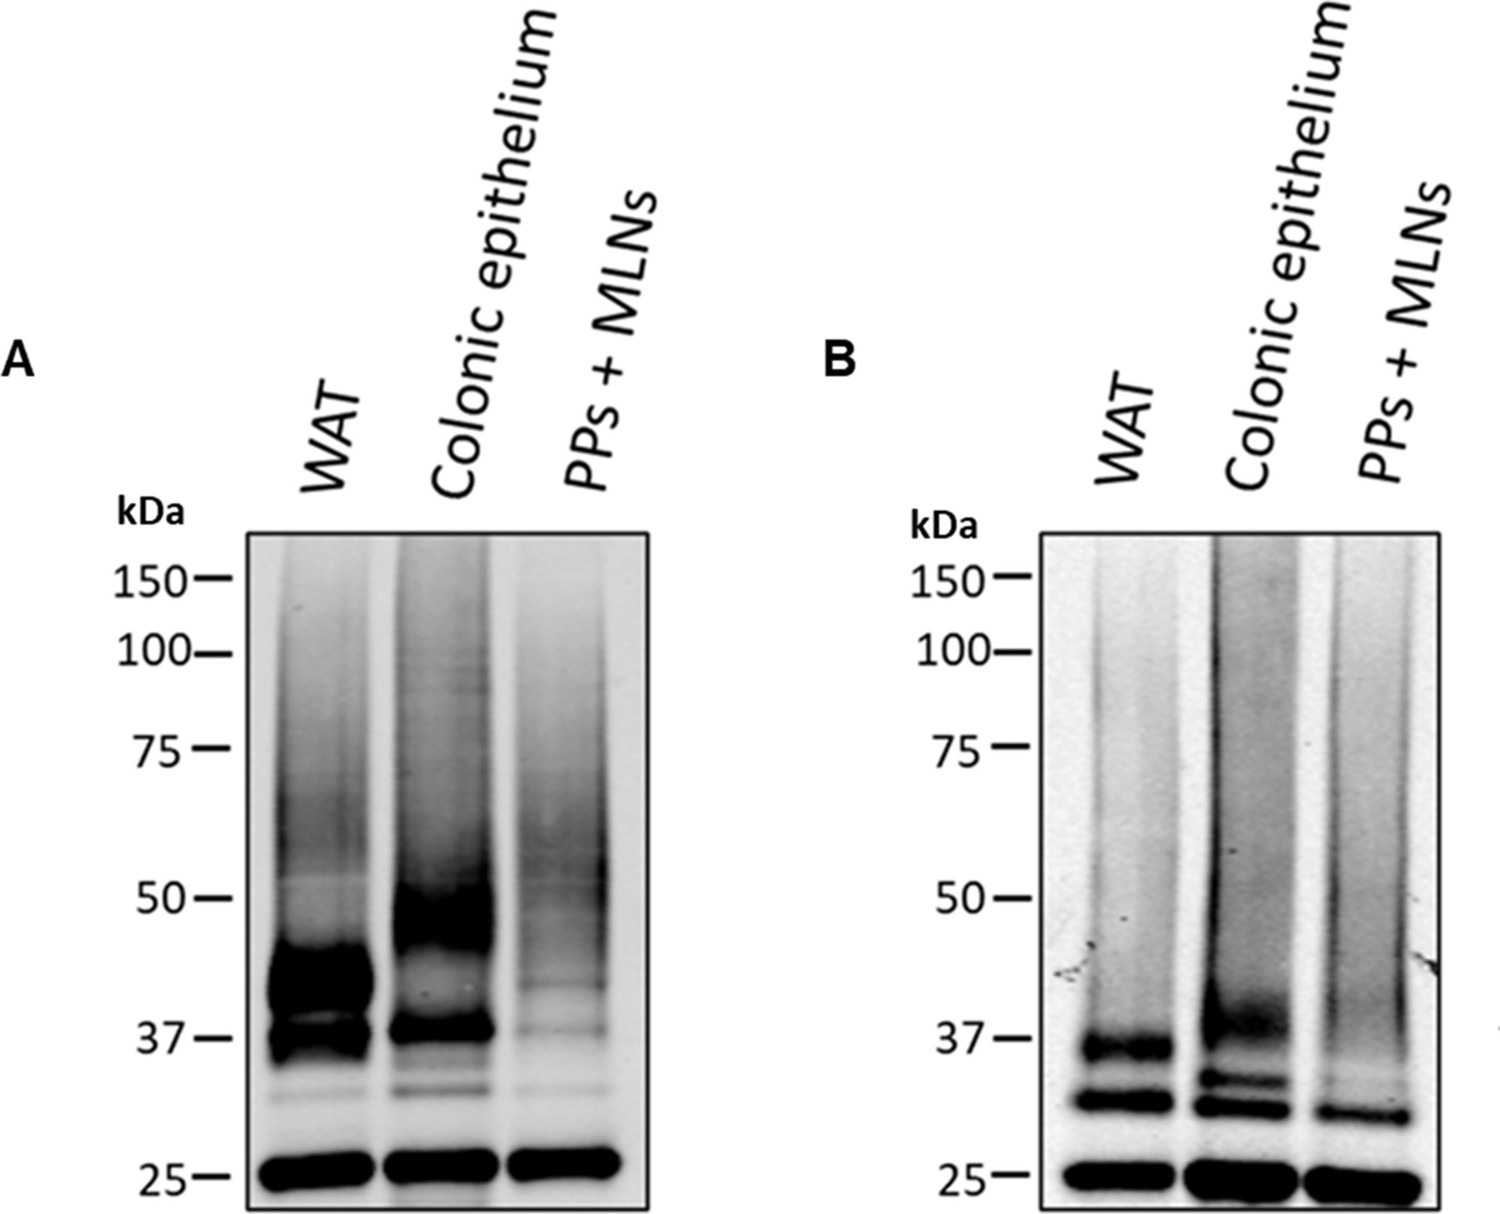
hFFAR2-DREADD-HA is present as multiple differentially N-glycosylated species in adipose tissue, immune, and colonic epithelial cells.
HA-immunoprecipitated samples from white adipose tissue (WAT), colonic epithelium, and Peyer’s patches and mesenteric lymph nodes (PP+MLNs) of hFFAR2-DREADD-HA-expressing mice were untreated (A) or treated with N-glycosidase F to remove N-linked carbohydrate (B). They were then resolved by SDS-PAGE and immunoblotted with anti-HA. A representative experiment of three is shown.
Additional files
Download links
A two-part list of links to download the article, or parts of the article, in various formats.
Downloads (link to download the article as PDF)
Open citations (links to open the citations from this article in various online reference manager services)
Cite this article (links to download the citations from this article in formats compatible with various reference manager tools)
Phosphorylation bar-coding of free fatty acid receptor 2 is generated in a tissue-specific manner
eLife 12:RP91861.
https://doi.org/10.7554/eLife.91861.3


