Replication of null results: Absence of evidence or evidence of absence?
- Epidemiology, Biostatistics and Prevention Institute, Center for Reproducible Science, University of Zurich, Switzerland
Figures
Figure 1
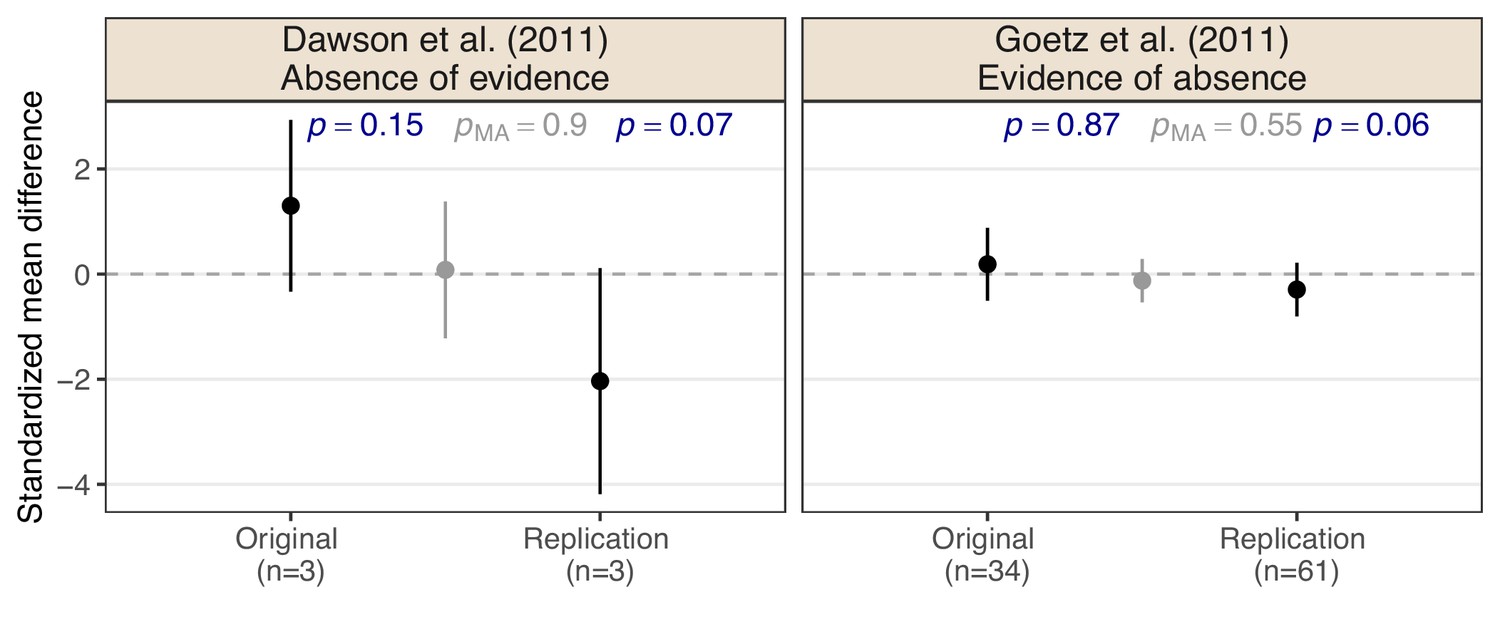
Two examples of original and replication study pairs which meet the non-significance replication success criterion from the Reproducibility Project: Cancer Biology (Errington et al., 2021).
Shown are standardized mean difference effect estimates with 95% confidence intervals, sample sizes n, and two-sided p-values p for the null hypothesis that the effect is absent. Effect estimate, 95% confidence interval, and p-value from a fixed-effect meta-analysis pMA of original and replication study are shown in gray.
Figure 2

Null hypothesis () and alternative hypothesis () for superiority and equivalence tests (with equivalence margin ).
Figure 3
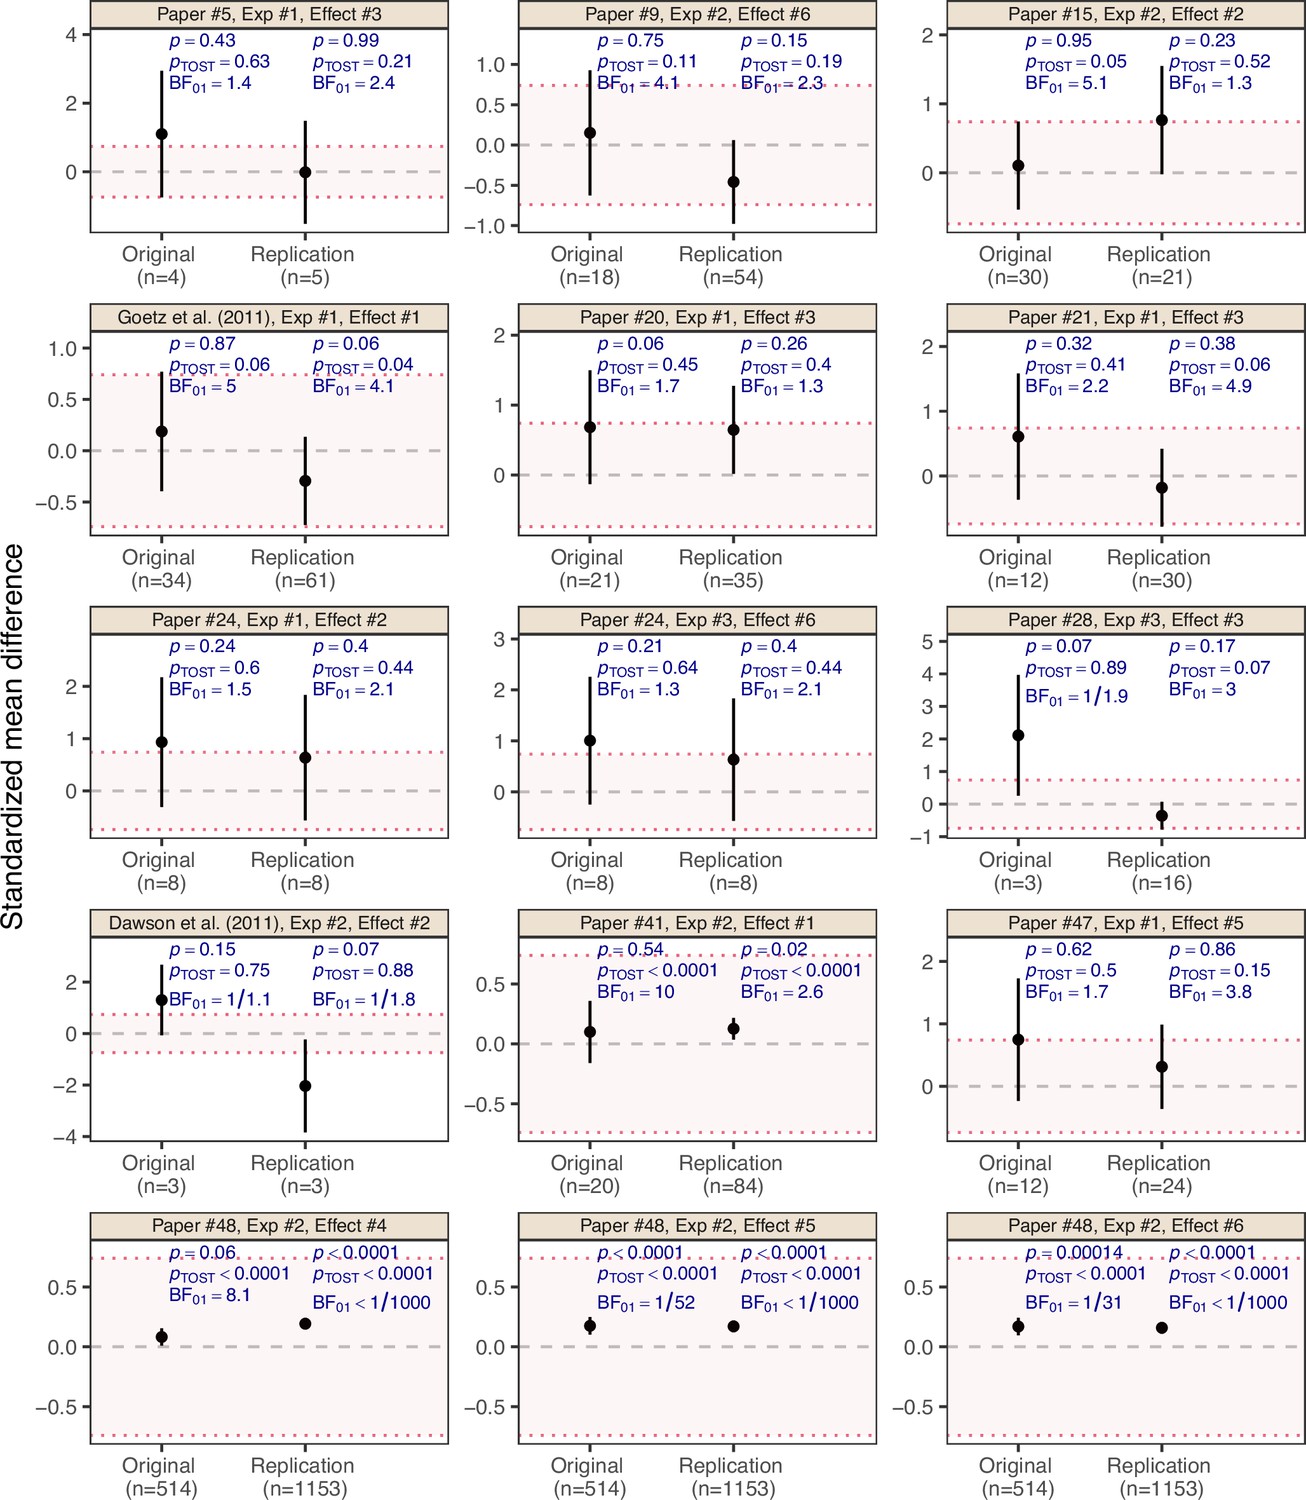
Effect estimates on the standardized mean difference (SMD) scale with 90% confidence interval for the 15 ‘null results’ and their replication studies from the Reproducibility Project: Cancer Biology (Errington et al., 2021).
The title above each plot indicates the original paper, experiment and effect numbers. Two original effect estimates from original paper 48 were statistically significant at , but were interpreted as null results by the original authors and, therefore, treated as null results by the RPCB. The two examples from Figure 1 are indicated in the plot titles. The dashed gray line represents the value of no effect (), while the dotted red lines represent the equivalence range with a margin of , classified as ‘liberal’ by Wellek, 2010, Table 1.1. The p-value is the maximum of the two one-sided p-values for the null hypotheses of the effect being greater/less than and , respectively. The Bayes factor quantifies the evidence for the null hypothesis against the alternative with normal unit-information prior assigned to the SMD under .
Appendix 1—figure 1
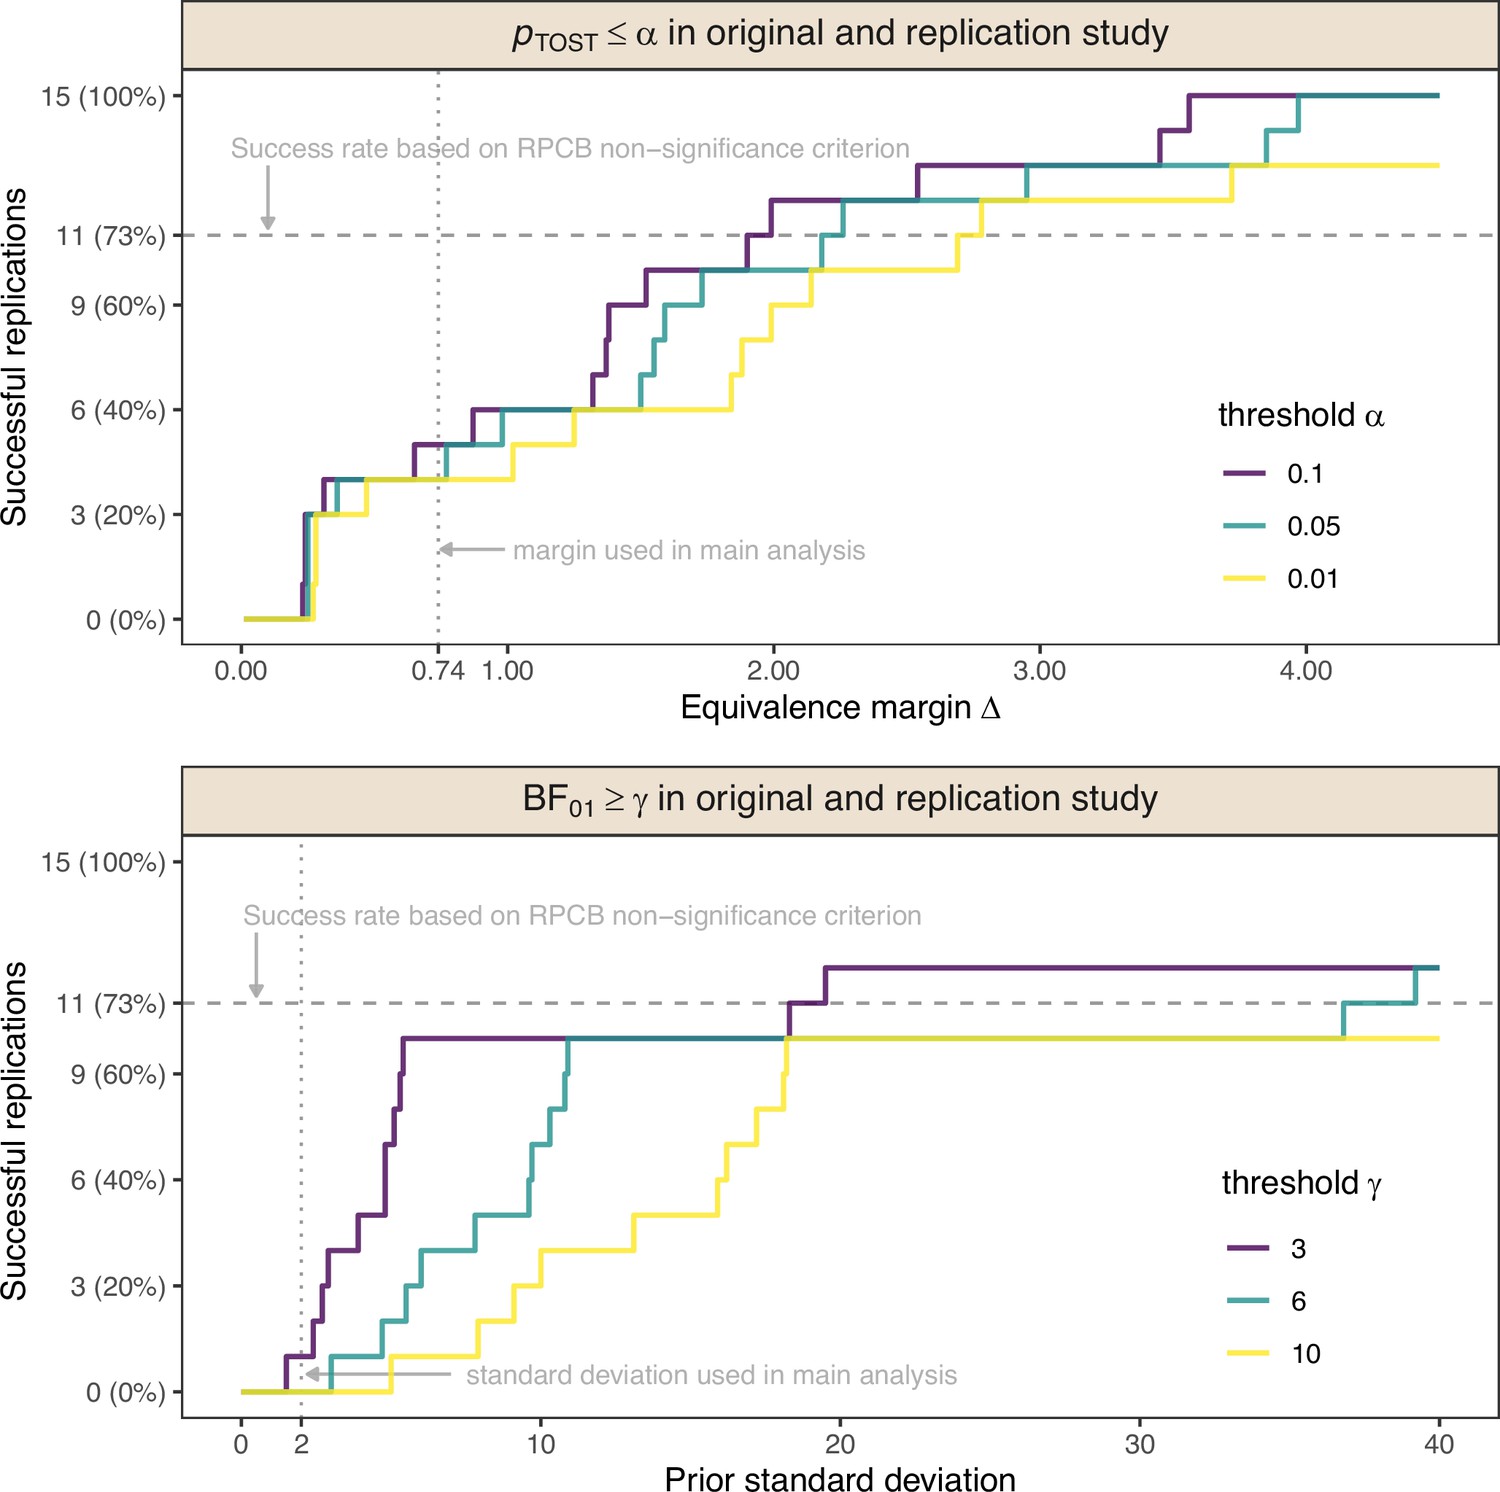
Number of successful replications of original null results in the Reproducibility Project: Cancer Biology (RPCB) as a function of the margin of the equivalence test ( in both studies for ) or the standard deviation of the zero-mean normal prior distribution for the standardized mean difference (SMD) effect size under the alternative H1 of the Bayes factor test ( in both studies for ).
Appendix 2—figure 1
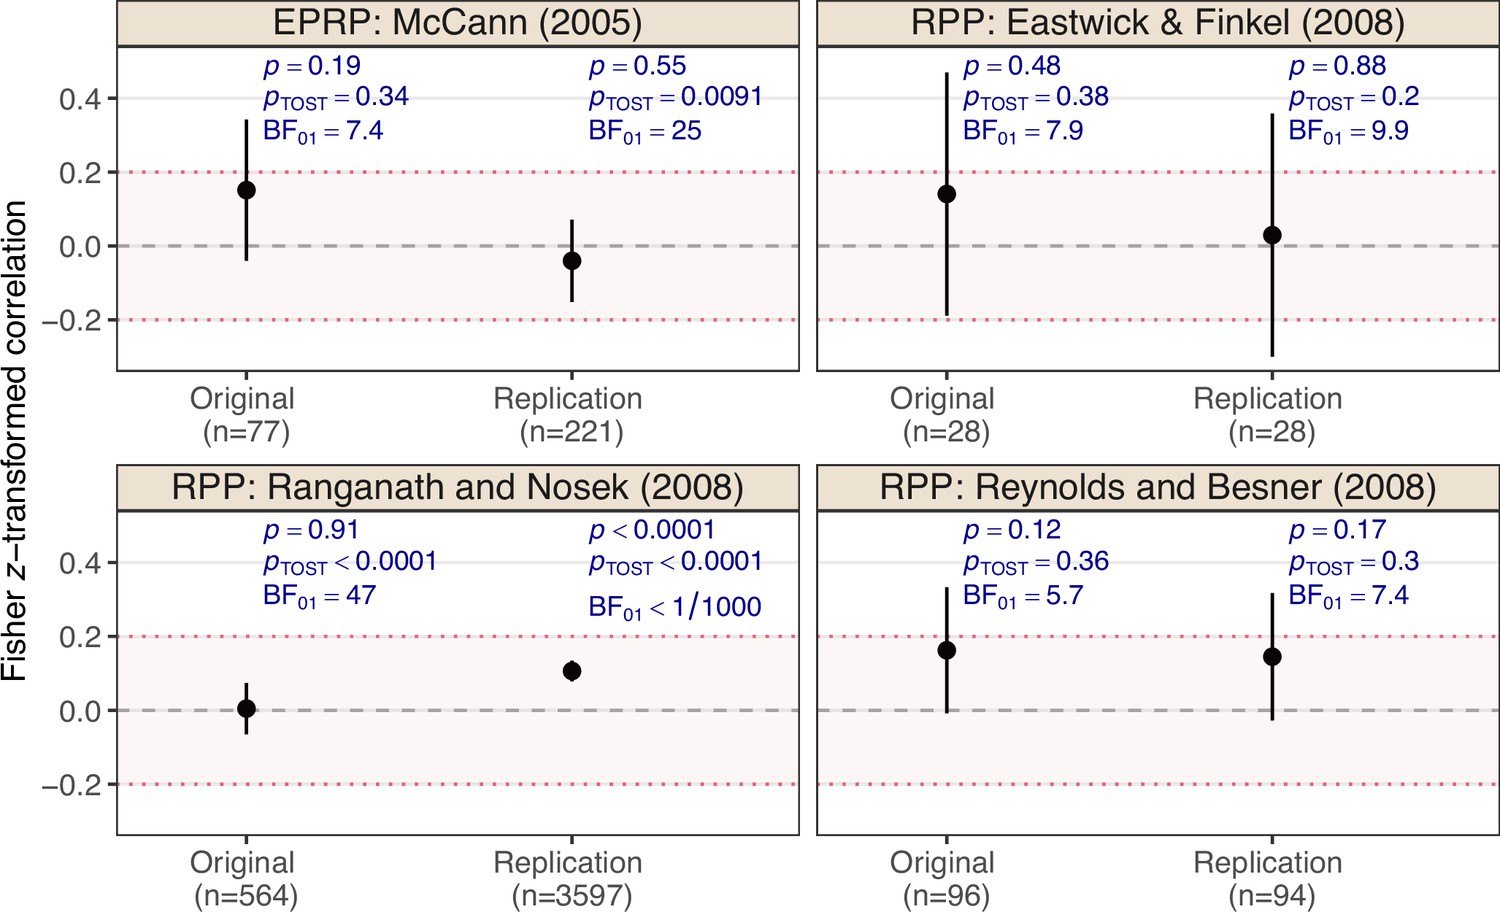
Effect estimates on Fisher z-transformed correlation scale with a 90% confidence interval for the ‘null results’ and their replication studies from the Reproducibility Project: Psychology (RPP, Open Science Collaboration, 2015) and the Experimental Philosophy Replicability Project (EPRP, Cova et al., 2021).
The dashed gray line represents the value of no effect (), while the dotted red lines represent the equivalence range with a margin of . The p-value is the maximum of the two one-sided p-values for the null hypotheses of the effect being greater/less than and , respectively. The Bayes factor quantifies the evidence for the null hypothesis against the alternative with normal prior centered around zero and standard deviation of 2 assigned to the effect size under .
Appendix 2—figure 2
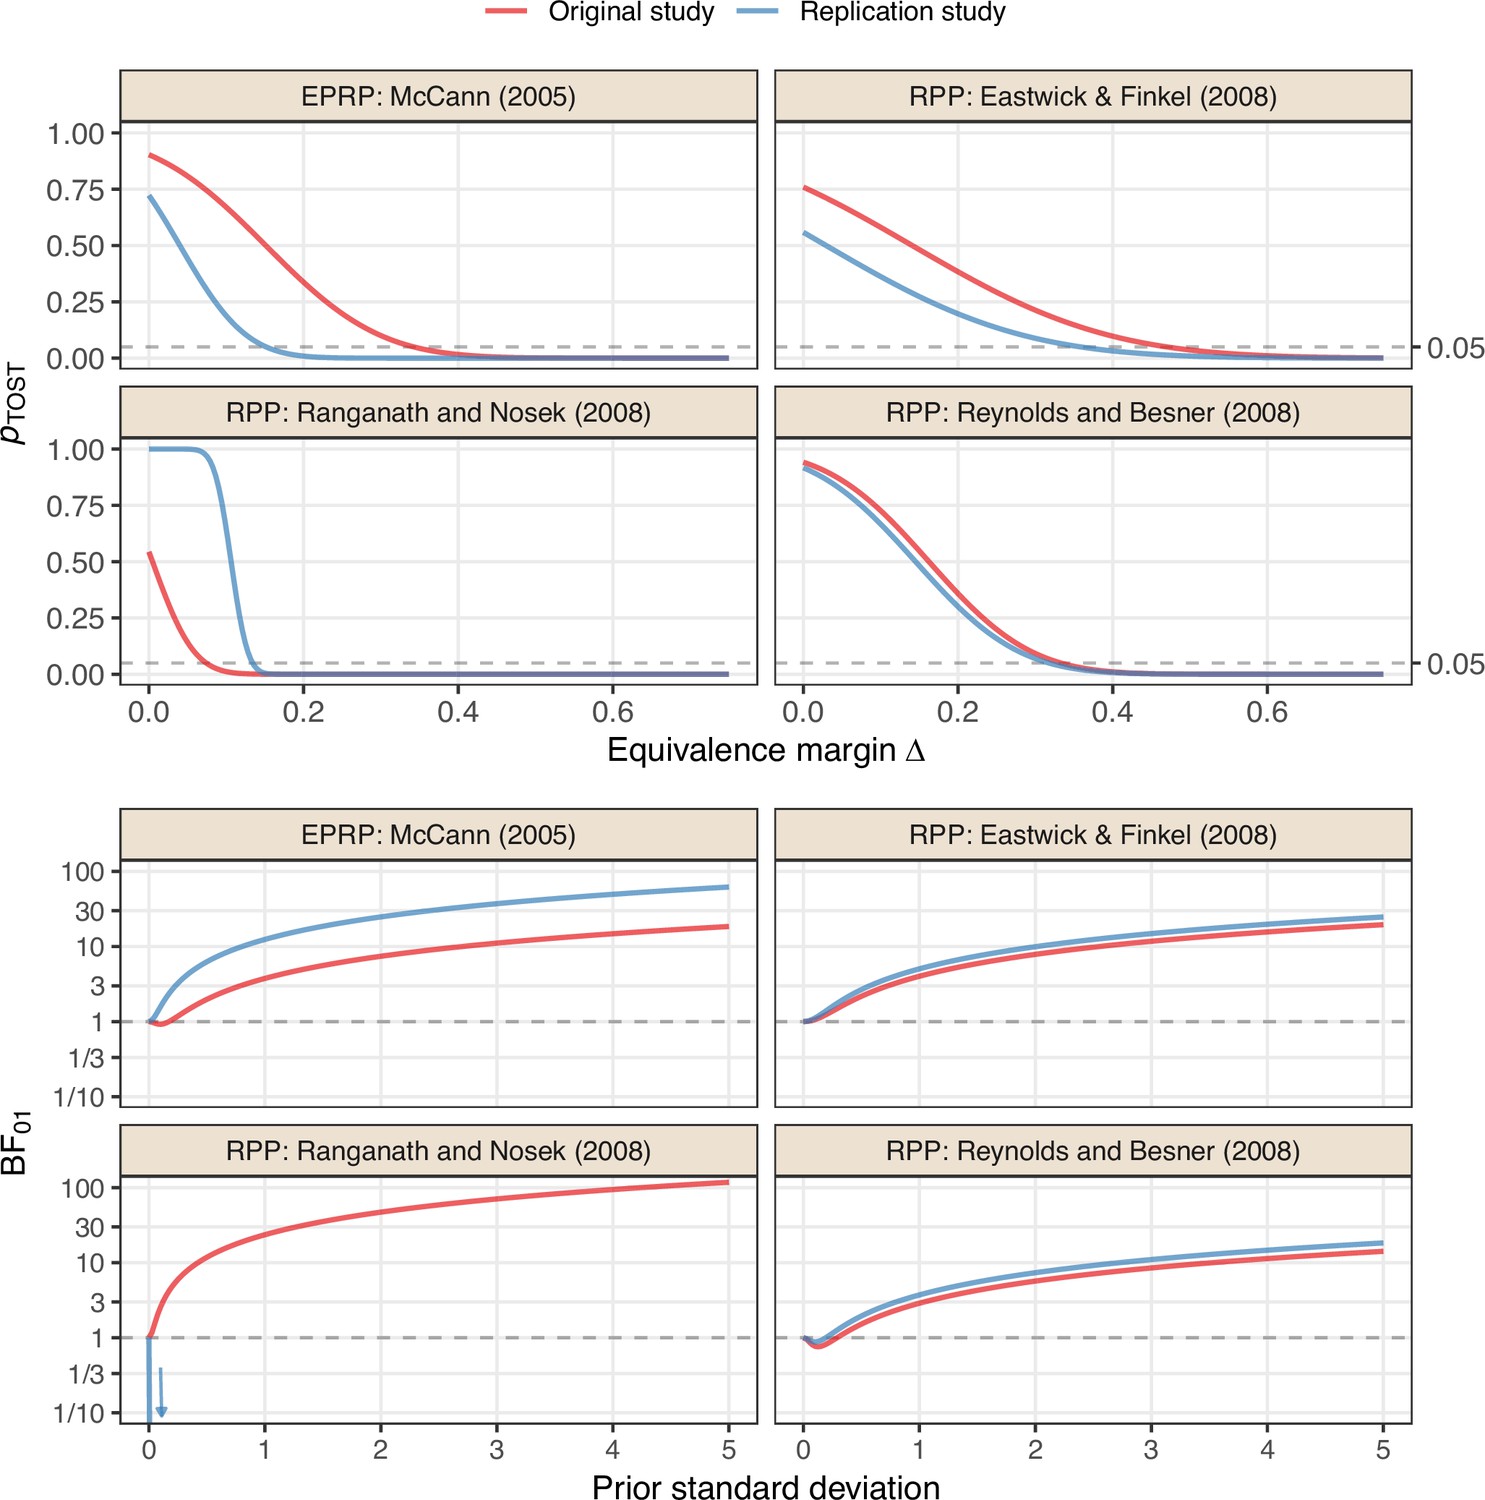
Sensitivity analyses for the ‘null results’ and their replication studies from the Reproducibility Project: Psychology (RPP, Open Science Collaboration, 2015) and the Experimental Philosophy Replicability Project (EPRP, Cova et al., 2021).
The Bayes factor of the replication of Ranganath and Nosek, 2008 decreases very quickly and is only shown for a limited range.
Additional files
Download links
A two-part list of links to download the article, or parts of the article, in various formats.
Downloads (link to download the article as PDF)
Open citations (links to open the citations from this article in various online reference manager services)
Cite this article (links to download the citations from this article in formats compatible with various reference manager tools)
Replication of null results: Absence of evidence or evidence of absence?
eLife 12:RP92311.
https://doi.org/10.7554/eLife.92311.3


