Caspase-1 activates gasdermin A in non-mammals
- Department of Integrative Immunobiology; Molecular Genetics and Microbiology; Pathology; and Cell Biology, Duke University School of Medicine, United States
- Department of Microbiology and Immunology, University of North Carolina at Chapel Hill, United States
- Critical Care Medicine Department, National Institutes of Health Clinical Center, United States
Figures
Figure 1 with 4 supplements
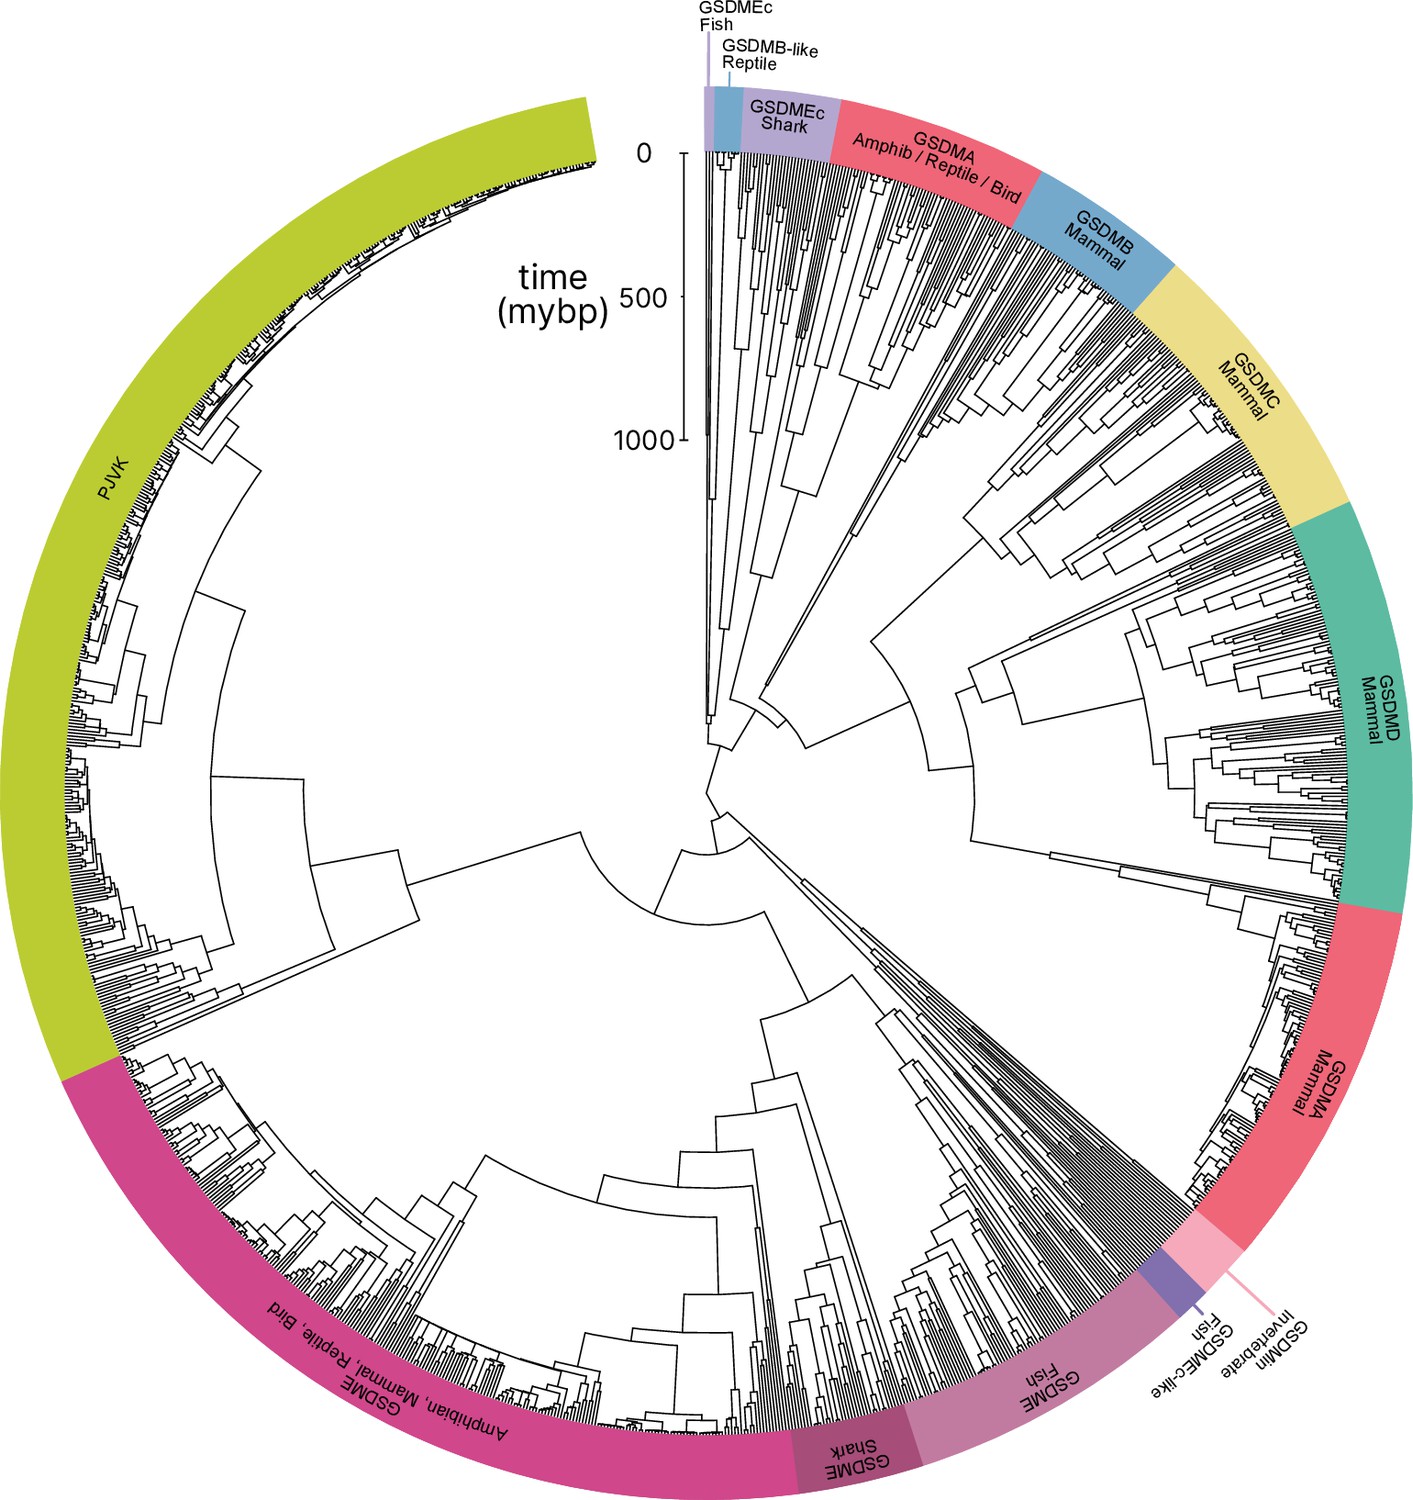
Phylogenetic analysis of GSDM proteins.
Time-calibrated maximum clade credibility coalescent Bayesian phylogenetic tree of all protein sequences in selected superphyla by hidden Markov model identification method. Tree was visualized using iTOL v6 (Letunic and Bork, 2021).
-
Figure 1—source data 1
Tree in .tre format.
- https://cdn.elifesciences.org/articles/92362/elife-92362-fig1-data1-v1.zip
-
Figure 1—source data 2
Alignment file of all sequences in nexus format.
- https://cdn.elifesciences.org/articles/92362/elife-92362-fig1-data2-v1.zip
Figure 1—figure supplement 1

Tree identical to Figure 1 with individual nodes labeled.
-
Figure 1—figure supplement 1—source data 1
Text file with all sequences with seqID and ID used in nexus alignment file.
- https://cdn.elifesciences.org/articles/92362/elife-92362-fig1-figsupp1-data1-v1.zip
Figure 1—figure supplement 2
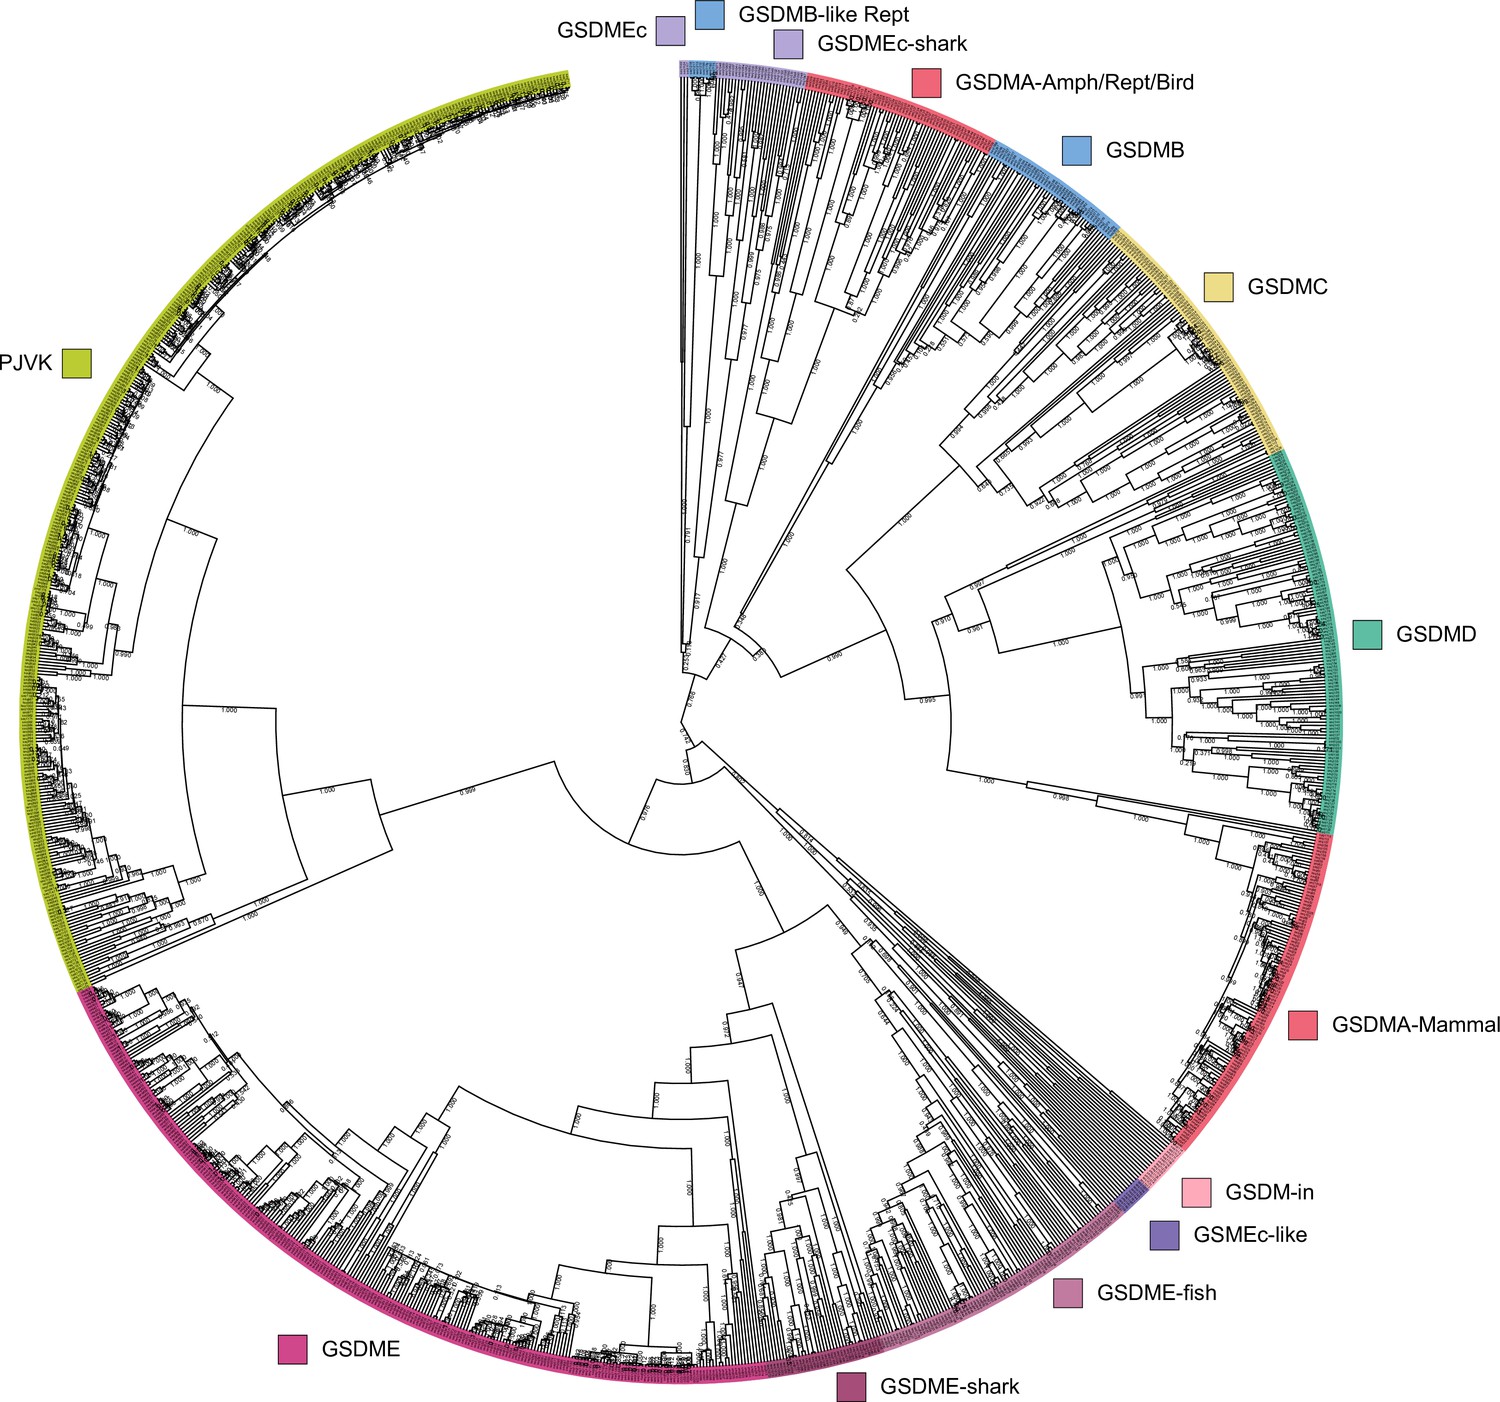
Tree identical to Figure 1 with individual nodes labeled and posterior probabilities displayed at the midpoint of each node.
Figure 1—figure supplement 3
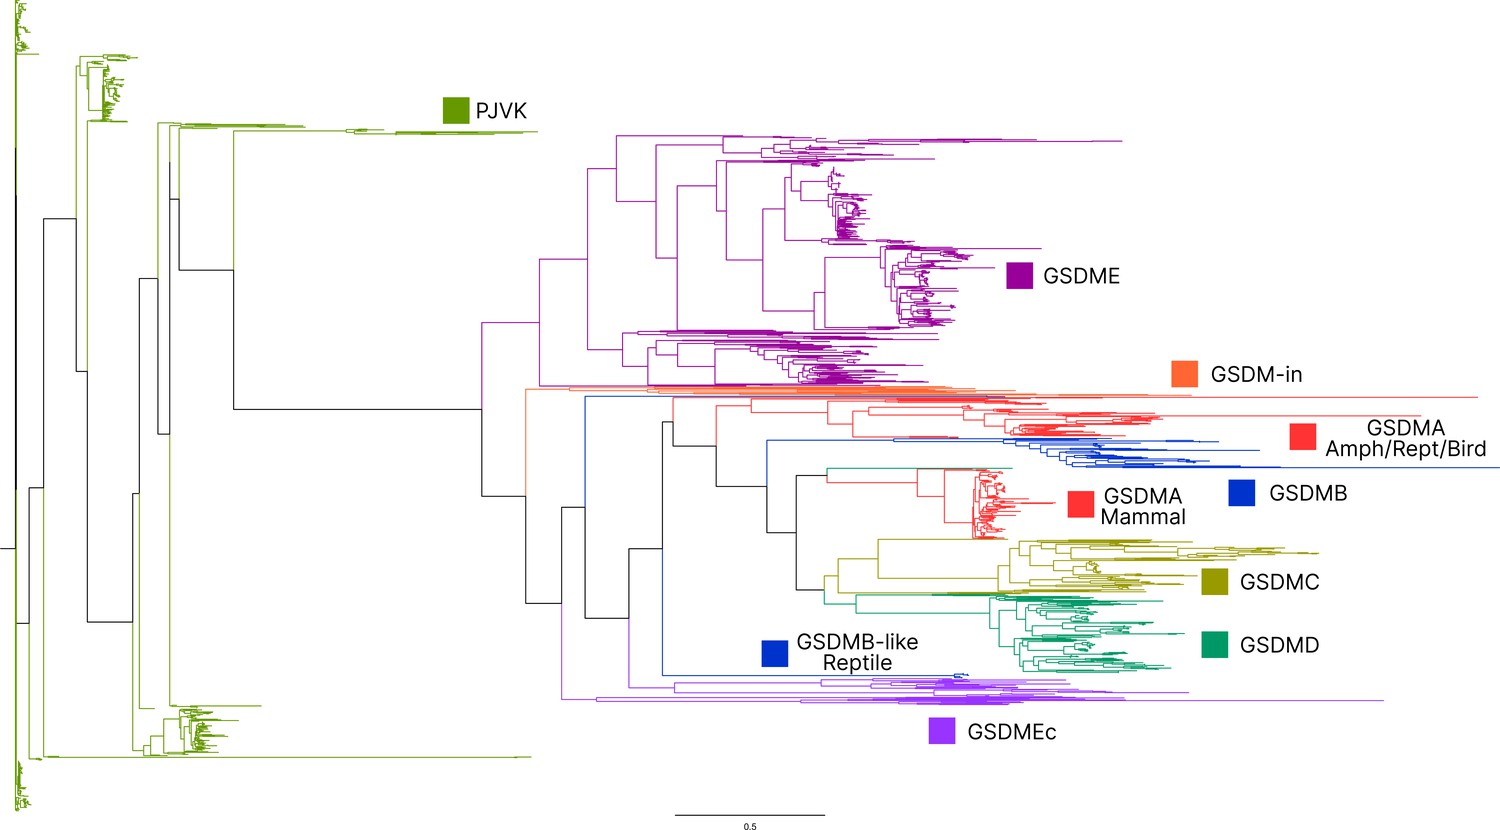
Maximum likelihood tree generated using the same sequences in Figure 1 Bayesian tree.
-
Figure 1—figure supplement 3—source data 1
Maximum likelihood tree in Newick format.
- https://cdn.elifesciences.org/articles/92362/elife-92362-fig1-figsupp3-data1-v1.zip
-
Figure 1—figure supplement 3—source data 2
Maximum likelihood tree with bootstrap values.
- https://cdn.elifesciences.org/articles/92362/elife-92362-fig1-figsupp3-data2-v1.pdf
-
Figure 1—figure supplement 3—source data 3
Maximum likelihood tree with node tips labeled.
- https://cdn.elifesciences.org/articles/92362/elife-92362-fig1-figsupp3-data3-v1.pdf
-
Figure 1—figure supplement 3—source data 4
Maximum likelihood tree with node tips labeled and bootstrap values.
- https://cdn.elifesciences.org/articles/92362/elife-92362-fig1-figsupp3-data4-v1.pdf
Figure 1—figure supplement 4
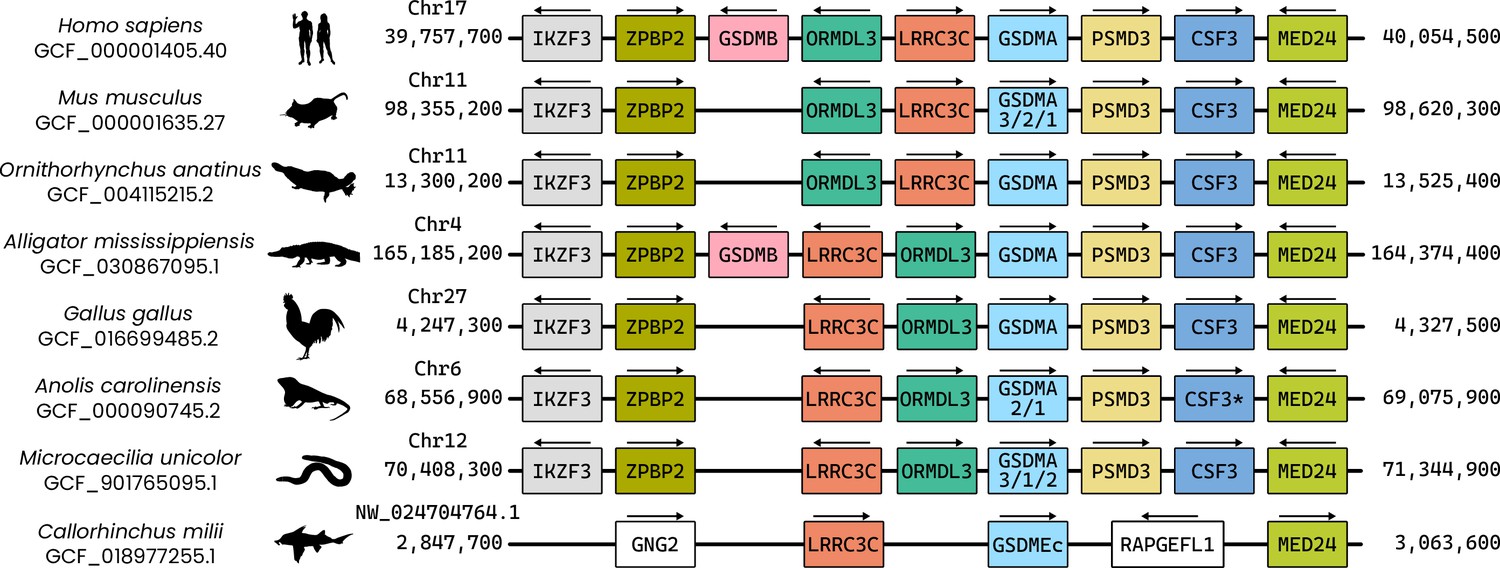
Visualization of the locus where GSDMA is found in the clades of animals that encode this gasdermin.
In tetrapods, the genes found in this region are identical, though ORMDL3 and LRRC3C are in opposing positions in some animals. Note that Microcaecilia unicolor (Tiny Cayenne caecilian) is an amphibian despite appearing morphologically similar to a snake. Duplications of GSDMA are indicated by numbers below GSDMA. Though not annotated as CSF3 in Anolis carolinensis (Carolina anole), the protein encoded by this sequence aligns with granulocyte colony-stimulating factor (encoded by CSF3) in mammals by BLASTp. It is colored and labeled as CSF3 here for ease of appreciating synteny. In fish that encode GSDMEc, like Callorhinchus milii (elephant shark), GSDMEc is found in a similar locus near LRRC3Ca and MED24. Gene labels are not to scale.
Figure 2
Analysis of bird GSDMA sequences suggests caspase-1 cleavage.
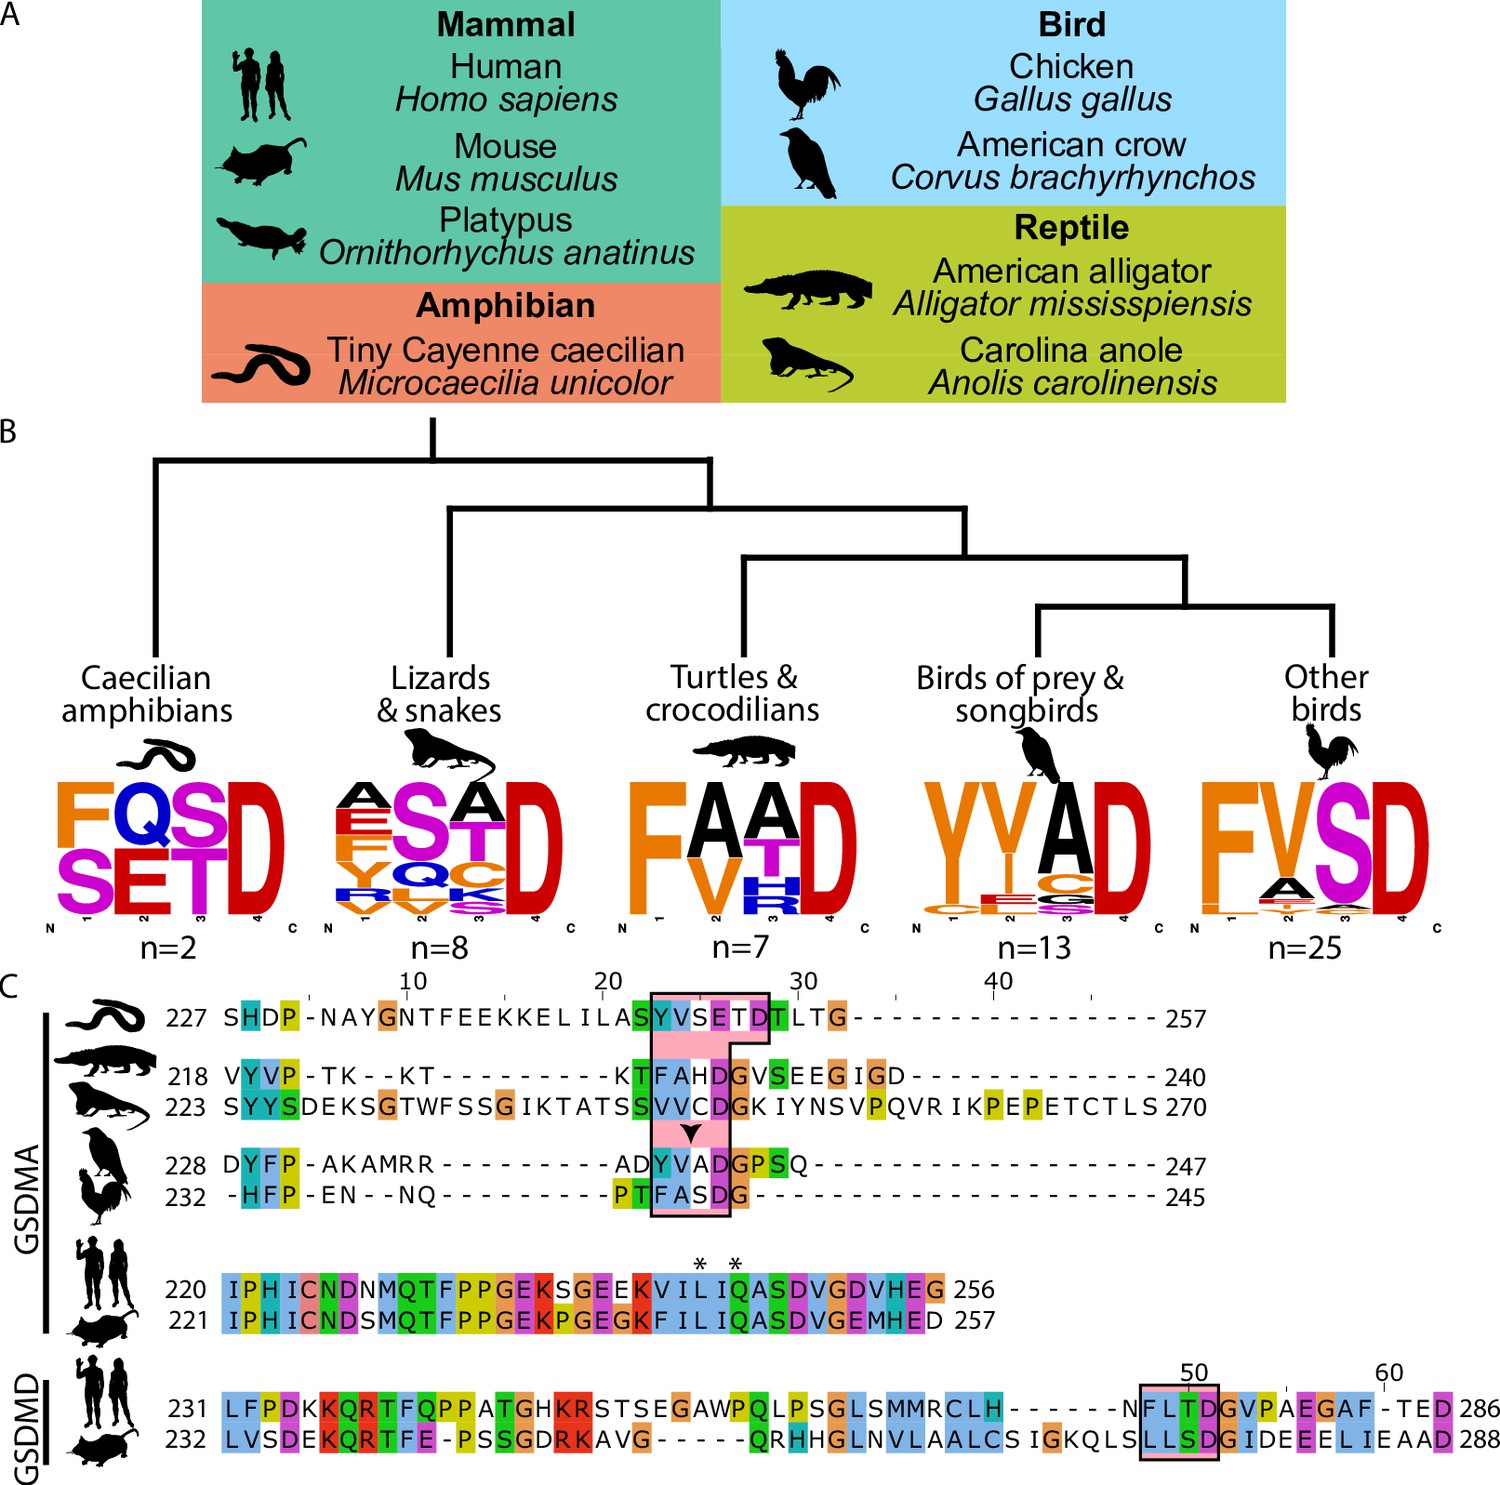
(A) Cartoons used in this study to represent organisms and their phylogenetic classification. Note that caecilian amphibians morphologically are similar to snakes in their lack of legs and elongated body, however, this is an example of convergent evolution as caecilians are amphibians and are thus more closely related to frogs and salamanders than snakes. (B) Sequence logo plots derived from the tetrapeptides found in amphibian, bird, and reptile GSDMA organized by evolutionary clades. Importantly, ‘Other birds’ is not a monophyletic group. Sequence logos display abundance of amino acids in each position before an aspartic acid in the linker region of each GSDMA protein using WebLogo (Crooks et al., 2004). When more than one aspartic acids were present, multiple tetrapeptides were listed. (C) Alignment of selected amphibian, reptile, bird, and mammal GSDM linker regions by MUSCLE. Linker defined as region between β11 and α5 by SWISS-MODEL. Outlined in a red box are tetrapeptide sequences that precede caspase-1 cleavage sites for mammal, or show similarity in amphibian, reptile, and bird sequences. The canonical caspase-1 cleavage site YVAD is emphasized with an arrowhead. ‘*’ denotes cleavage sites of SpeB for human and mouse GSDMA. Amino acids colorized using Clustal color scheme.
-
Figure 2—source data 1
FASTA file with sequences of all GSDMAs in this figure.
- https://cdn.elifesciences.org/articles/92362/elife-92362-fig2-data1-v1.zip
-
Figure 2—source data 2
FASTA file with sequences of tetrapeptides to generate sequence logos.
- https://cdn.elifesciences.org/articles/92362/elife-92362-fig2-data2-v1.zip
Figure 3 with 2 supplements
Chicken caspase-1 cleaves chicken GSDMA and mammal GSDMD.
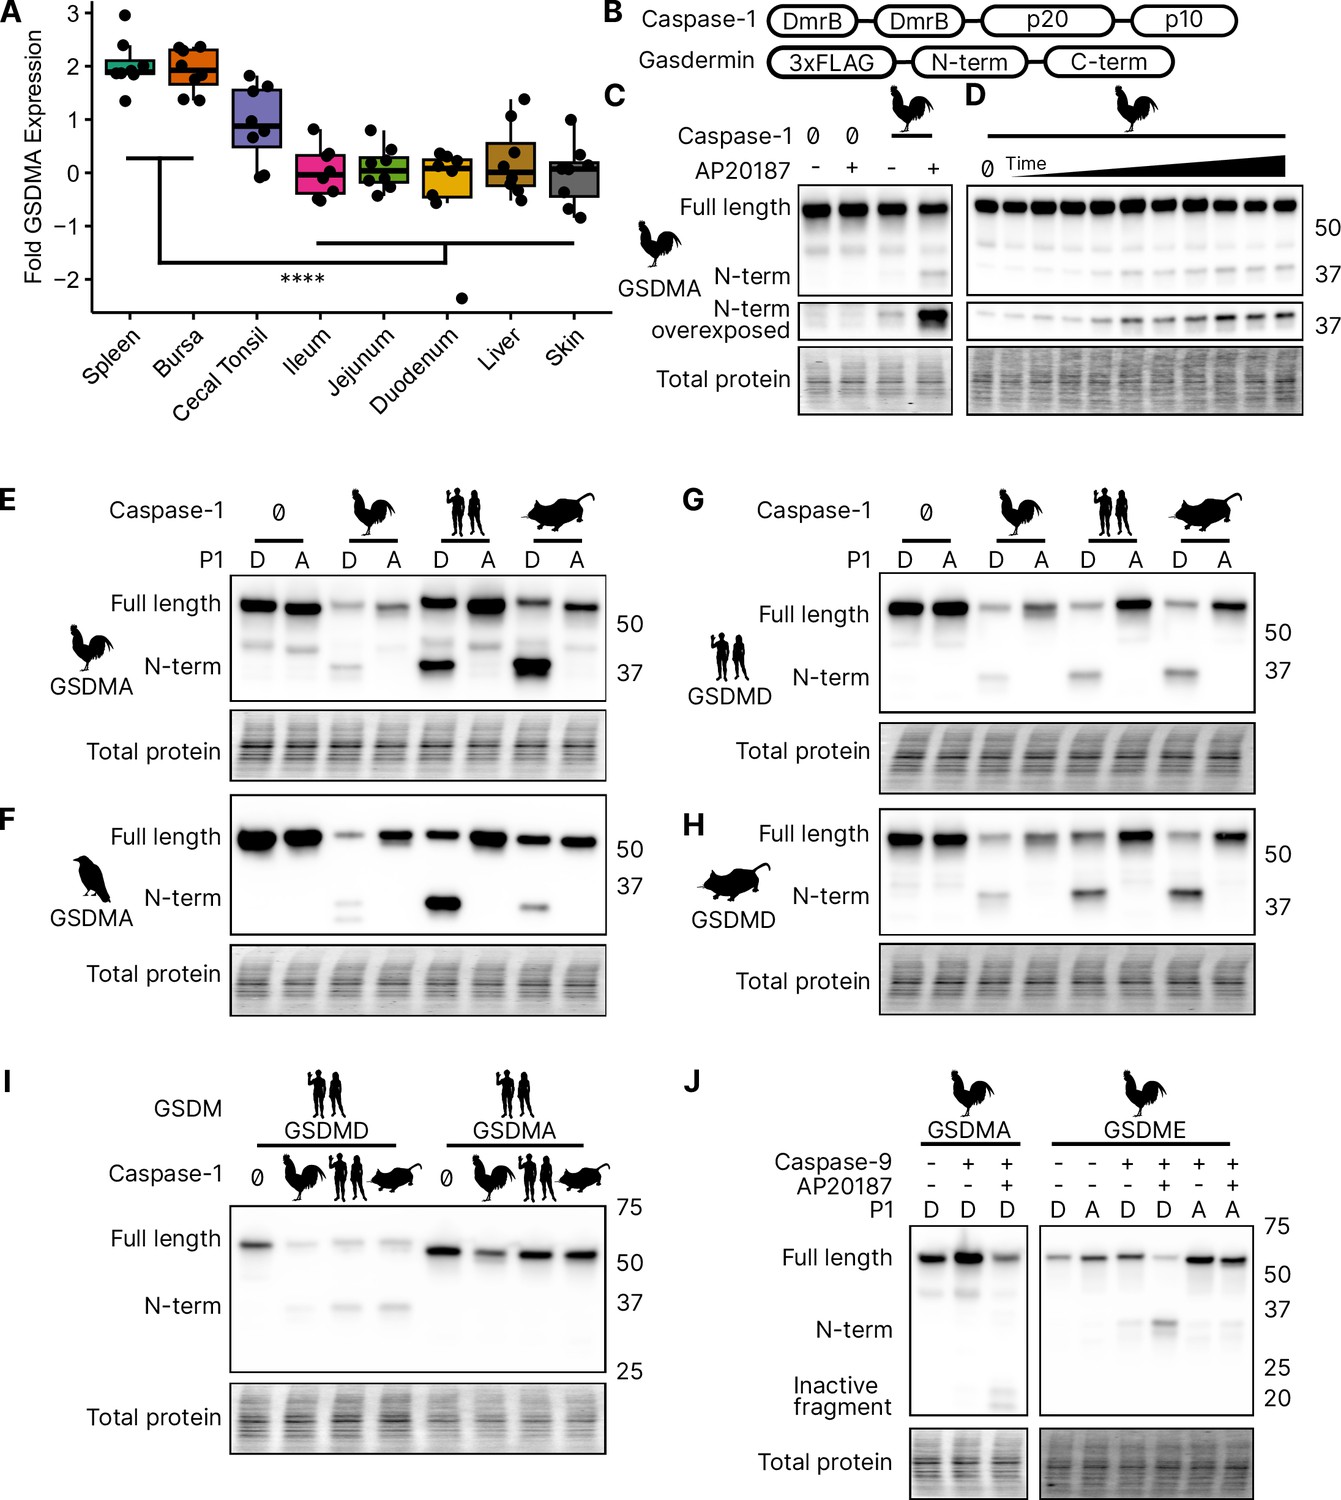
(A) Normalized relative GSDMA abundance by qRT-PCR using RNA derived from various Gallus gallus domesticus tissues. The cecal tonsils are a lymphoid aggregate tissue found in the chicken gastrointestinal tract, akin to Peyer’s patches in mammals. ****, p < 0.0001 by two-way analysis of variance (ANOVA) with Tukey’s multiple comparisons correction. Experiment was performed with technical triplicate with six biological samples. (B) Diagram of constructs used in this study. Note that CARD domain of caspase-1 is not present. (C) FLAG blot of HEK293T/17 lysates after co-transfection of chicken GSDMA and caspase-1 after addition of dimethyl sulfoxide (DMSO) or AP20187 dimerizer. (D) FLAG blot of time course of dimerizer addition. Samples were harvested at 0, 0.25, 0.5, 0.75, 1, 1.5, 2, 2.5, 3, 4.5, and 6 hr after addition of AP20187 dimerizer. (E–H) Caspase-1 from chicken, human, and mouse cleave bird GSMDA and mammal GSDMD. FLAG blot of HEK293T/17 lysates after co-transfection with indicated caspase-1 and GSDM constructs. P1 refers to the fourth reside of the tetrapeptide sequence, which is cleaved by caspase-1. P1 mutants are chicken D244A, crow D243A, human D275A, and mouse D276A. (I) FLAG blot of HEK293T/17 lysates after co-transfection with indicated gasdermin and caspase-1. Caspase-1 from chicken, human, and mouse cleave human GSDMD but not human GSMDA. (J) FLAG blot of HEK293T/17 lysates after co-transfection with indicated gasdermin and caspase-9. P1 mutant of chicken GSDME is 270DAVD273 to 270DAVA273. Blots were performed in biological triplicate.
-
Figure 3—source data 1
Quantitative PCR data used to generate plot in Figure 3A.
- https://cdn.elifesciences.org/articles/92362/elife-92362-fig3-data1-v1.xlsx
-
Figure 3—source data 2
Original file for the western blot analysis in Figure 1C (anti-FLAG).
- https://cdn.elifesciences.org/articles/92362/elife-92362-fig3-data2-v1.zip
-
Figure 3—source data 3
PDF containing Figure 1C and original scans of the relevant western blot analysis (anti-FLAG) with highlighted bands and sample labels.
- https://cdn.elifesciences.org/articles/92362/elife-92362-fig3-data3-v1.pdf
-
Figure 3—source data 4
Original file for the western blot analysis in Figure 1D (anti-FLAG).
- https://cdn.elifesciences.org/articles/92362/elife-92362-fig3-data4-v1.zip
-
Figure 3—source data 5
PDF containing Figure 1D and original scans of the relevant western blot analysis (anti-FLAG) with highlighted bands and sample labels.
- https://cdn.elifesciences.org/articles/92362/elife-92362-fig3-data5-v1.pdf
-
Figure 3—source data 6
Original file for the western blot analysis in Figure 1E (anti-FLAG).
- https://cdn.elifesciences.org/articles/92362/elife-92362-fig3-data6-v1.zip
-
Figure 3—source data 7
PDF containing Figure 1E and original scans of the relevant western blot analysis (anti-FLAG) with highlighted bands and sample labels.
- https://cdn.elifesciences.org/articles/92362/elife-92362-fig3-data7-v1.pdf
-
Figure 3—source data 8
Original file for the western blot analysis in Figure 1F (anti-FLAG).
- https://cdn.elifesciences.org/articles/92362/elife-92362-fig3-data8-v1.zip
-
Figure 3—source data 9
PDF containing Figure 1F and original scans of the relevant western blot analysis (anti-FLAG) with highlighted bands and sample labels.
- https://cdn.elifesciences.org/articles/92362/elife-92362-fig3-data9-v1.pdf
-
Figure 3—source data 10
Original file for the western blot analysis in Figure 1G (anti-FLAG).
- https://cdn.elifesciences.org/articles/92362/elife-92362-fig3-data10-v1.zip
-
Figure 3—source data 11
PDF containing Figure 1G and original scans of the relevant western blot analysis (anti-FLAG) with highlighted bands and sample labels.
- https://cdn.elifesciences.org/articles/92362/elife-92362-fig3-data11-v1.pdf
-
Figure 3—source data 12
Original file for the western blot analysis in Figure 1H (anti-FLAG).
- https://cdn.elifesciences.org/articles/92362/elife-92362-fig3-data12-v1.zip
-
Figure 3—source data 13
PDF containing Figure 1H and original scans of the relevant western blot analysis (anti-FLAG) with highlighted bands and sample labels.
- https://cdn.elifesciences.org/articles/92362/elife-92362-fig3-data13-v1.pdf
-
Figure 3—source data 14
Original file for the western blot analysis in Figure 1I (anti-FLAG).
- https://cdn.elifesciences.org/articles/92362/elife-92362-fig3-data14-v1.zip
-
Figure 3—source data 15
PDF containing Figure 1I and original scans of the relevant western blot analysis (anti-FLAG) with highlighted bands and sample labels.
- https://cdn.elifesciences.org/articles/92362/elife-92362-fig3-data15-v1.pdf
-
Figure 3—source data 16
Original file for the western blot analysis in Figure 1J (GSDMA, anti-FLAG).
- https://cdn.elifesciences.org/articles/92362/elife-92362-fig3-data16-v1.zip
-
Figure 3—source data 17
PDF containing Figure 1J and original scans of the relevant western blot analysis (GSDMA, anti-FLAG) with highlighted bands and sample labels.
- https://cdn.elifesciences.org/articles/92362/elife-92362-fig3-data17-v1.pdf
-
Figure 3—source data 18
Original file for the western blot analysis in Figure 1J (GSDME, anti-FLAG).
- https://cdn.elifesciences.org/articles/92362/elife-92362-fig3-data18-v1.zip
-
Figure 3—source data 19
PDF containing Figure 1J and original scans of the relevant western blot analysis (GSDME, anti-FLAG) with highlighted bands and sample labels.
- https://cdn.elifesciences.org/articles/92362/elife-92362-fig3-data19-v1.pdf
Figure 3—figure supplement 1
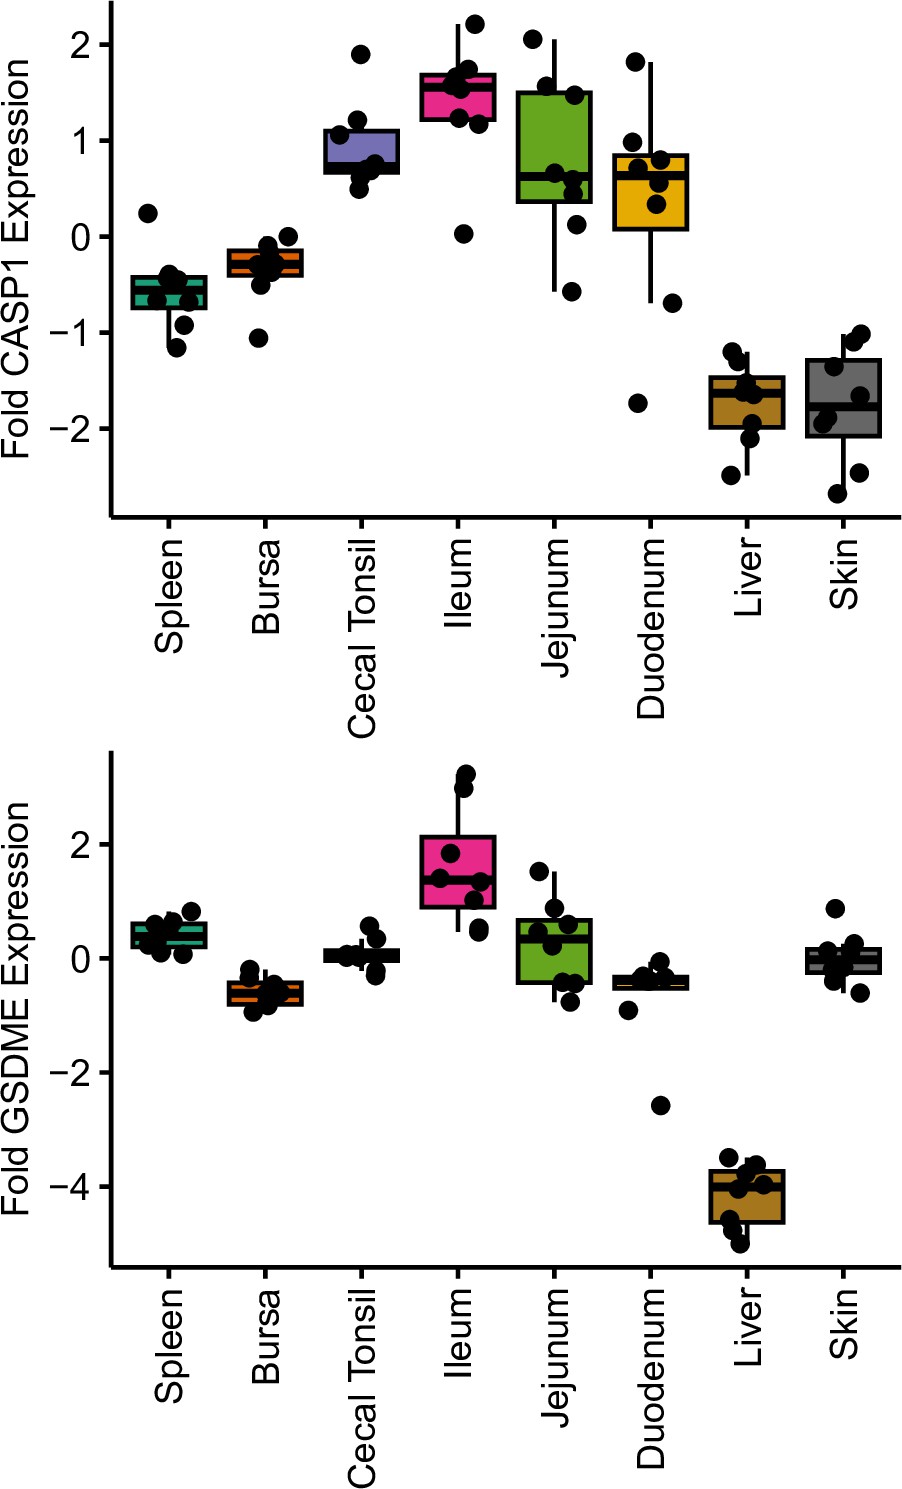
The same tissues as in Figure 3 were assayed for GSDME and CASP1 alongside GSDMA.
Data derived from six biological replicates performed in technical triplicate.
-
Figure 3—figure supplement 1—source data 1
Quantitative PCR data.
Same file as Figure 3—source data 1.
- https://cdn.elifesciences.org/articles/92362/elife-92362-fig3-figsupp1-data1-v1.xlsx
Figure 3—figure supplement 2
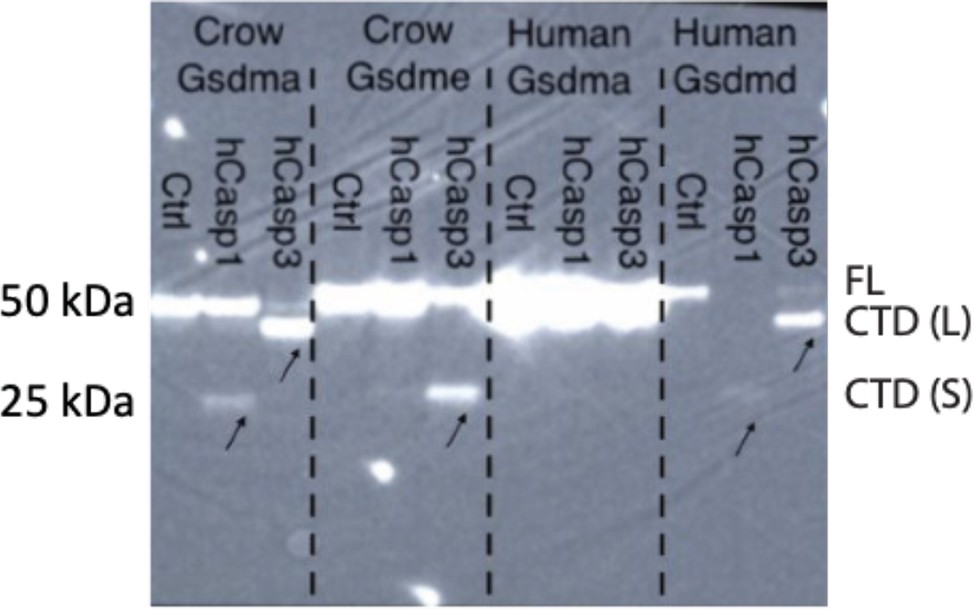
Incubation of 293T/17 lysates transfected with C-terminally tagged crow GSDMA, crow GSDME, human GSDMA, or human GSDMD then were incubated with human CASP1 or CASP3.
Image represents blot from one biological replicate.
-
Figure 3—figure supplement 2—source data 1
Original file for the western blot analysis in Figure 3—figure supplement 2 (anti-FLAG).
- https://cdn.elifesciences.org/articles/92362/elife-92362-fig3-figsupp2-data1-v1.zip
-
Figure 3—figure supplement 2—source data 2
PDF containing Figure 3—figure supplement 2 and original scans ofthe relevant western blot analysis (anti-FLAG) with highlighted bands and sample labels.
- https://cdn.elifesciences.org/articles/92362/elife-92362-fig3-figsupp2-data2-v1.pdf
Figure 4
Cleavage of chicken GSDMA leads to cell lysis.
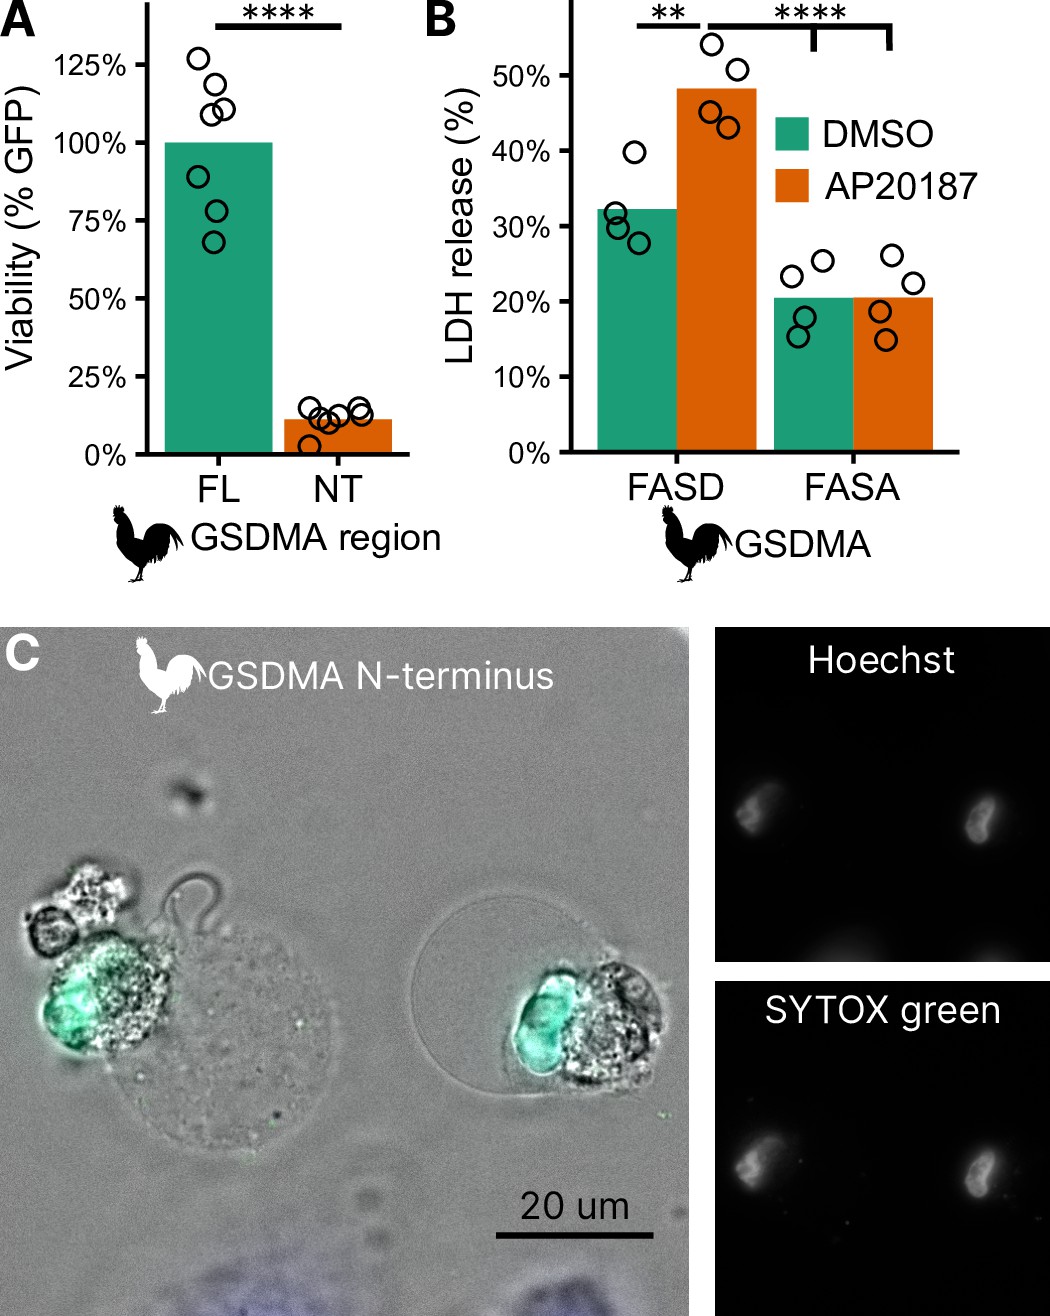
(A) Measurement of green fluorescent protein (GFP) fluorescence in HEK293T/17 cells co-transfected with GFP and either full-length (FL) chicken GSDMA or its N-terminal (NT) pore-forming domain after 48 hr. Each point represents a separate transfection experiment performed in technical quadruplicate. ****, p < 0.0001 by Student’s t-test. (B) Cell lysis measured by lactate dehydrogenase (LDH) release in HEK293T/17 cells co-transfected with chicken caspase-1 and either WT or D244A chicken GSDMA. Gasdermin constructs in this study do not encode the 3xFLAG domain. Each point represents a separate transfection experiment performed in technical quadruplicate. **, p < 0.01; ****, p < 0.0001 by two-way analysis of variance (ANOVA) with Tukey’s multiple comparisons correction. (C) Images of HeLa cells after transfection with the N-terminal domain of chicken GSDMA. Transfected cells display classic pyroptotic ballooning. SYTOX green staining of the nucleus indicates permeabilization of cell membranes.
-
Figure 4—source data 1
GFP fluorescence data.
- https://cdn.elifesciences.org/articles/92362/elife-92362-fig4-data1-v1.zip
-
Figure 4—source data 2
LDH release data.
- https://cdn.elifesciences.org/articles/92362/elife-92362-fig4-data2-v1.zip
Figure 5
Chicken GSDMA requires a compatible tetrapeptide for activation.
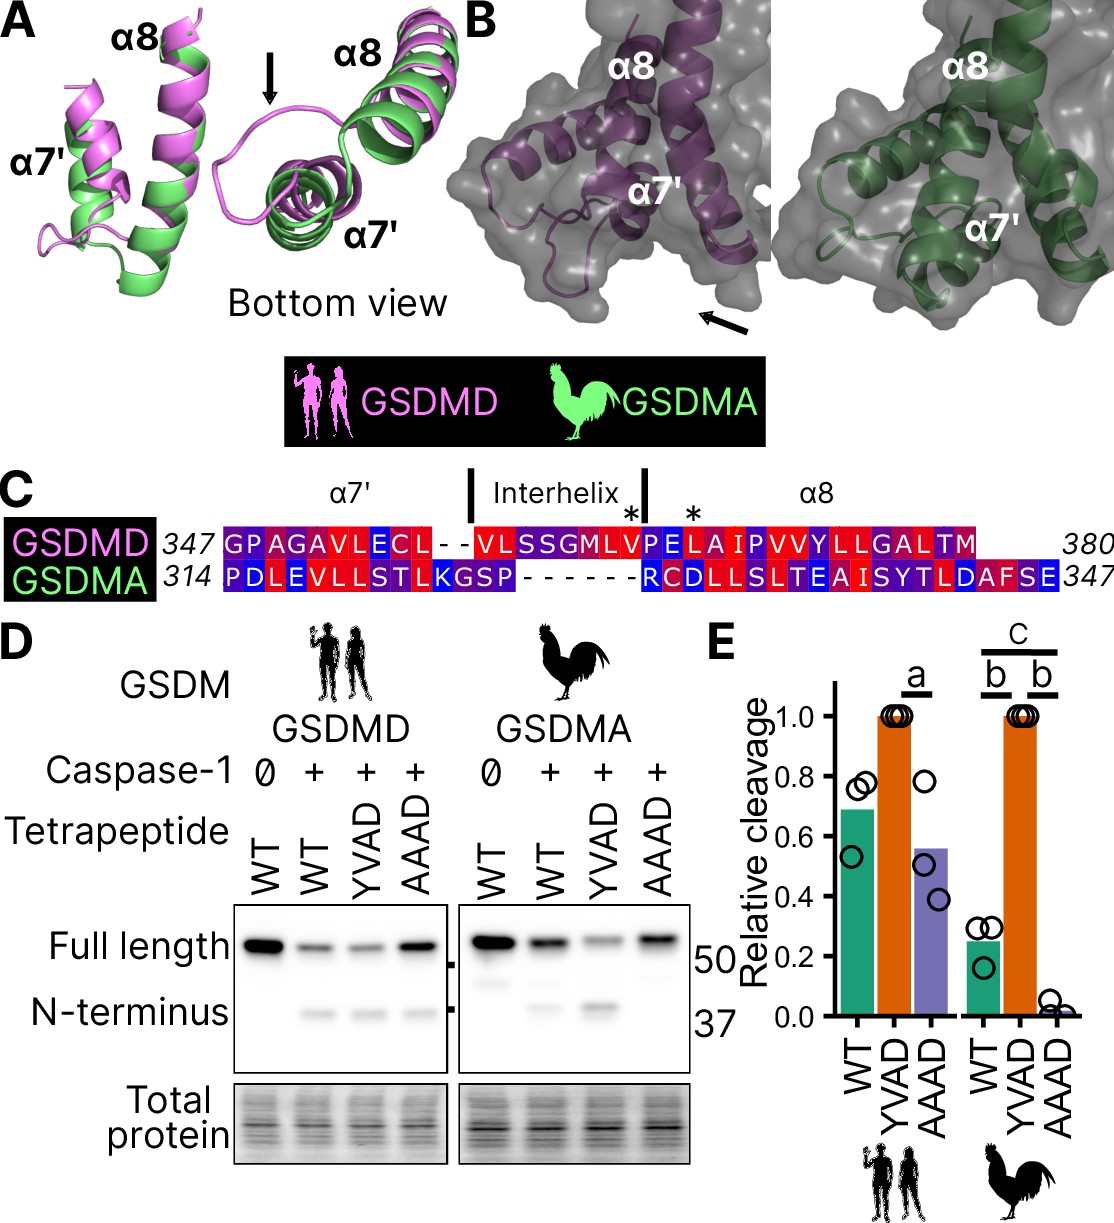
(A) AlphaFold predictions of the structure of α7′ and α8 helices of human GSDMD and chicken GSMDA. α8 helices were aligned in Pymol. The human interhelix loop is indicated by the arrow. (B) Gasdermin C-terminus AlphaFold predictions visualized with surface projection. Structures are aligned at the α8 helix. The arrow indicates the human interhelix loop and the space where human caspase-1 interacts with the C-terminal domain of human GSDMD PDB: 6KN0 (Wang et al., 2020b). (C) Alignment of α7′-interhelix-α8 helix regions of human GSDMD (residues 347–380) and chicken GSDMA (residues 314–347). Residues colored with the Kyte and Doolittle scale with red indicating hydrophobic and blue indicating hydrophilic. ‘*’ indicates residues determined to be critical for the hydrophobic interaction between human GSDMD and caspase-1. (D) FLAG blot of HEK293T/17 cell lysates after co-transfection with either chicken or human caspase-1 and their cognate GSDM with the tetrapeptide as WT, YVAD, or AAAD. (E) Quantification of the intensity of the N-terminal band as a ratio of the N-terminal fragment over the full length, with the greatest ratio in a given experiment set to 100% efficiency. Each point is derived from a blot from a separate transfection. a, p < 0.05; b, p < 0.0001; c, p < 0.01 by one-way analysis of variance (ANOVA) with Tukey’s multiple comparisons correction.
-
Figure 5—source data 1
AlphaFold prediction files in .pdb format.
Gasdermins analyedz ed Table 1.
- https://cdn.elifesciences.org/articles/92362/elife-92362-fig5-data1-v1.zip
-
Figure 5—source data 2
Alignments used for visualizations.
- https://cdn.elifesciences.org/articles/92362/elife-92362-fig5-data2-v1.zip
-
Figure 5—source data 3
Western blot densitometric analysis data.
- https://cdn.elifesciences.org/articles/92362/elife-92362-fig5-data3-v1.zip
-
Figure 5—source data 4
Original file for the western blot analysis in Figure 5D (GSDMD, anti-FLAG).
- https://cdn.elifesciences.org/articles/92362/elife-92362-fig5-data4-v1.zip
-
Figure 5—source data 5
PDF containing Figure 5D and original scans of the relevant western blot analysis (GSDMD, anti-FLAG) with highlighted bands and sample labels.
- https://cdn.elifesciences.org/articles/92362/elife-92362-fig5-data5-v1.pdf
-
Figure 5—source data 6
Original file for the western blot analysis in Figure 5D (GSDMA, anti-FLAG).
- https://cdn.elifesciences.org/articles/92362/elife-92362-fig5-data6-v1.zip
-
Figure 5—source data 7
PDF containing Figure 5D and original scans of the relevant western blot analysis (GSDMA, anti-FLAG) with highlighted bands and sample labels.
- https://cdn.elifesciences.org/articles/92362/elife-92362-fig5-data7-v1.pdf
Figure 6 with 1 supplement
GSDMA from non-mammals are cleaved by caspase-1 and SpeB.
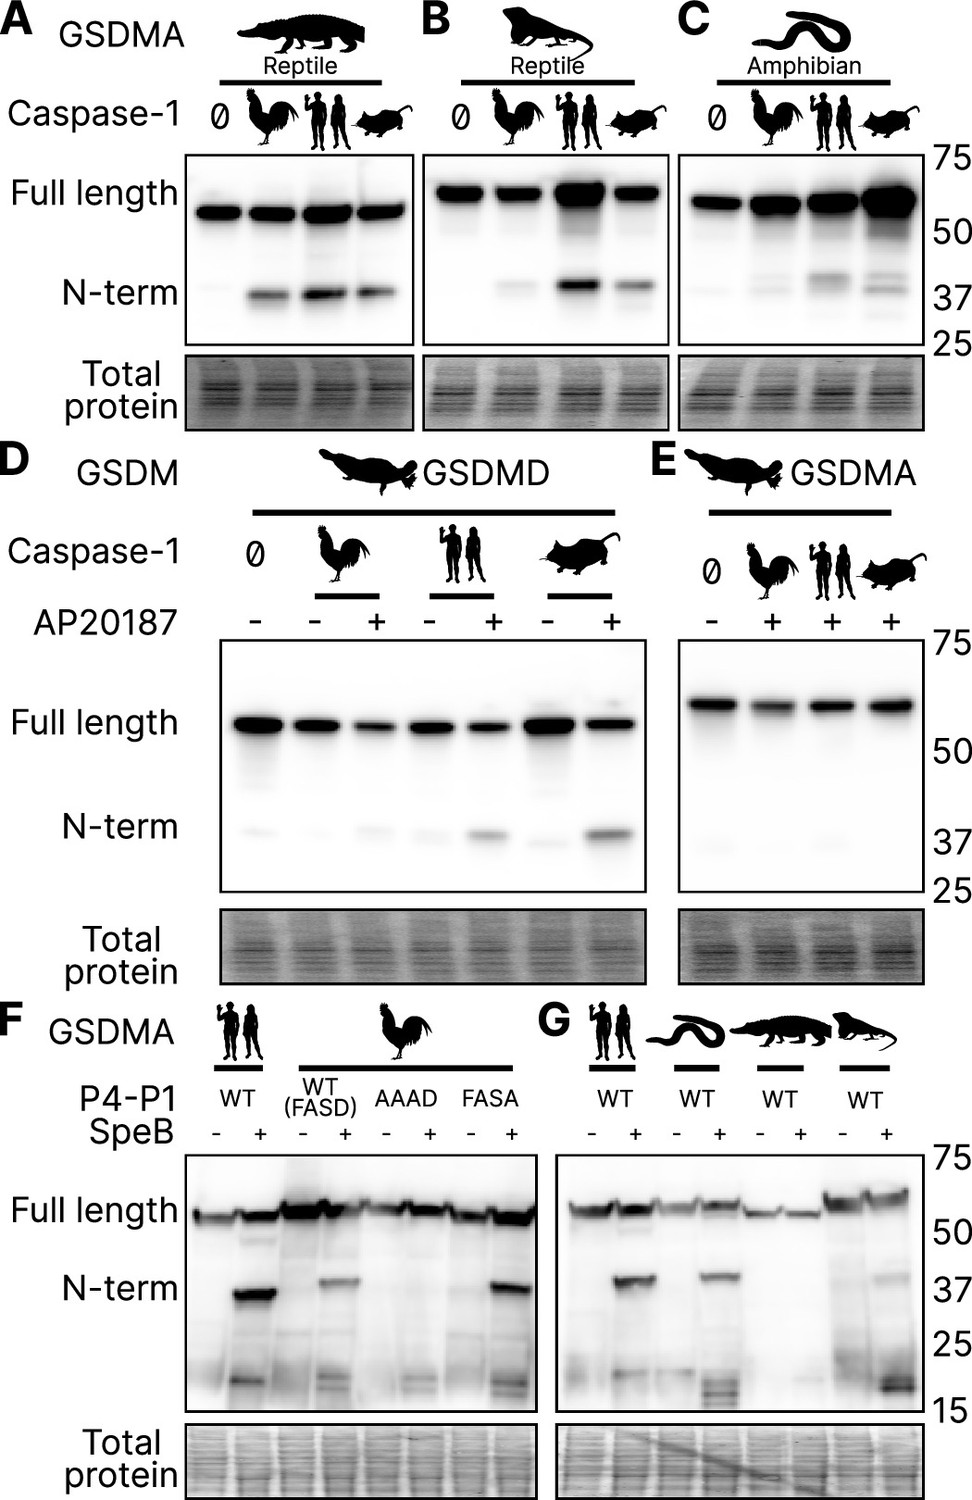
(A–C) FLAG blot of HEK293T/17 lysates after co-transfection of A. mississippiensis, A. carolinensis, or M. unicolor GSDMA and caspase-1 from chicken, human, and mouse. M. unicolor is an amphibian despite sharing morphological similarity to a snake. (D, E) FLAG blot of HEK293T/17 lysates after co-transfection of platypus GSDMD or GSDMA with caspase-1 from chicken, human and mouse. (F, G) FLAG blot of HEK293T/17 lysates after transfection with plasmids encoding the designated gasdermins then incubation with SpeB. Total protein captured by Ponceau staining for this blot. Blots are representative of two biological replicates.
-
Figure 6—source data 1
Original file for the western blot analysis in Figure 6A, B (anti-FLAG).
- https://cdn.elifesciences.org/articles/92362/elife-92362-fig6-data1-v1.zip
-
Figure 6—source data 2
PDF containing Figure 6A, B and original scans of the relevant western blot analysis (anti-FLAG) with highlighted bands and sample labels.
- https://cdn.elifesciences.org/articles/92362/elife-92362-fig6-data2-v1.pdf
-
Figure 6—source data 3
Original file for the western blot analysis in Figure 6C (anti-FLAG).
- https://cdn.elifesciences.org/articles/92362/elife-92362-fig6-data3-v1.zip
-
Figure 6—source data 4
PDF containing Figure 6C and original scans of the relevant western blot analysis (anti-FLAG) with highlighted bands and sample labels.
- https://cdn.elifesciences.org/articles/92362/elife-92362-fig6-data4-v1.pdf
-
Figure 6—source data 5
Original file for the western blot analysis in Figure 6D (anti-FLAG).
- https://cdn.elifesciences.org/articles/92362/elife-92362-fig6-data5-v1.zip
-
Figure 6—source data 6
PDF containing Figure 6D and original scans of the relevant western blot analysis (anti-FLAG) with highlighted bands and sample labels.
- https://cdn.elifesciences.org/articles/92362/elife-92362-fig6-data6-v1.pdf
-
Figure 6—source data 7
Original file for the western blot analysis in Figure 6E (anti-FLAG).
- https://cdn.elifesciences.org/articles/92362/elife-92362-fig6-data7-v1.zip
-
Figure 6—source data 8
PDF containing Figure 6E and original scans of the relevant western blot analysis (anti-FLAG) with highlighted bands and sample labels.
- https://cdn.elifesciences.org/articles/92362/elife-92362-fig6-data8-v1.pdf
-
Figure 6—source data 9
Original file for the western blot analysis in Figure 6F, G (anti-FLAG).
- https://cdn.elifesciences.org/articles/92362/elife-92362-fig6-data9-v1.zip
-
Figure 6—source data 10
PDF containing Figure 6F, G and original scans of the relevant western blot analysis (anti-FLAG) with highlighted bands and sample labels.
- https://cdn.elifesciences.org/articles/92362/elife-92362-fig6-data10-v1.pdf
Figure 6—figure supplement 1
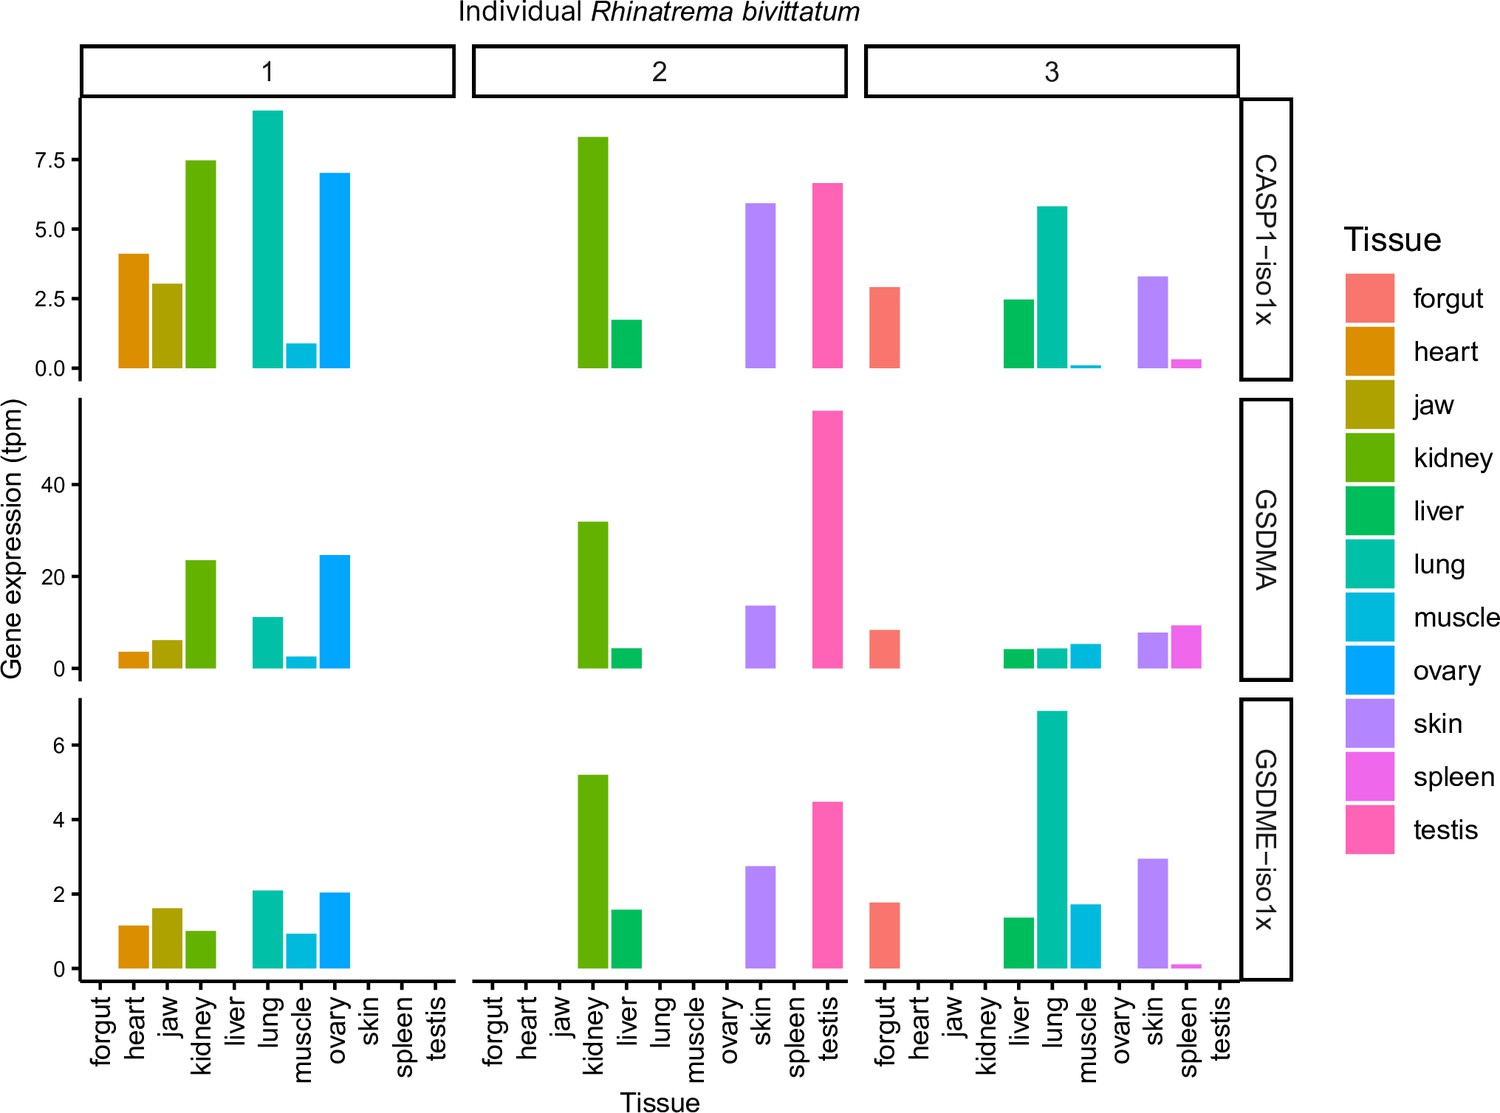
Amphibian expression of CASP1, GSDMA, and GSDME.
Not all amphibians had RNA extracted from the same organs. Note that kidney, when isolated, always has the highest expression of GSDMA of non-gonadal tissue.
Figure 7
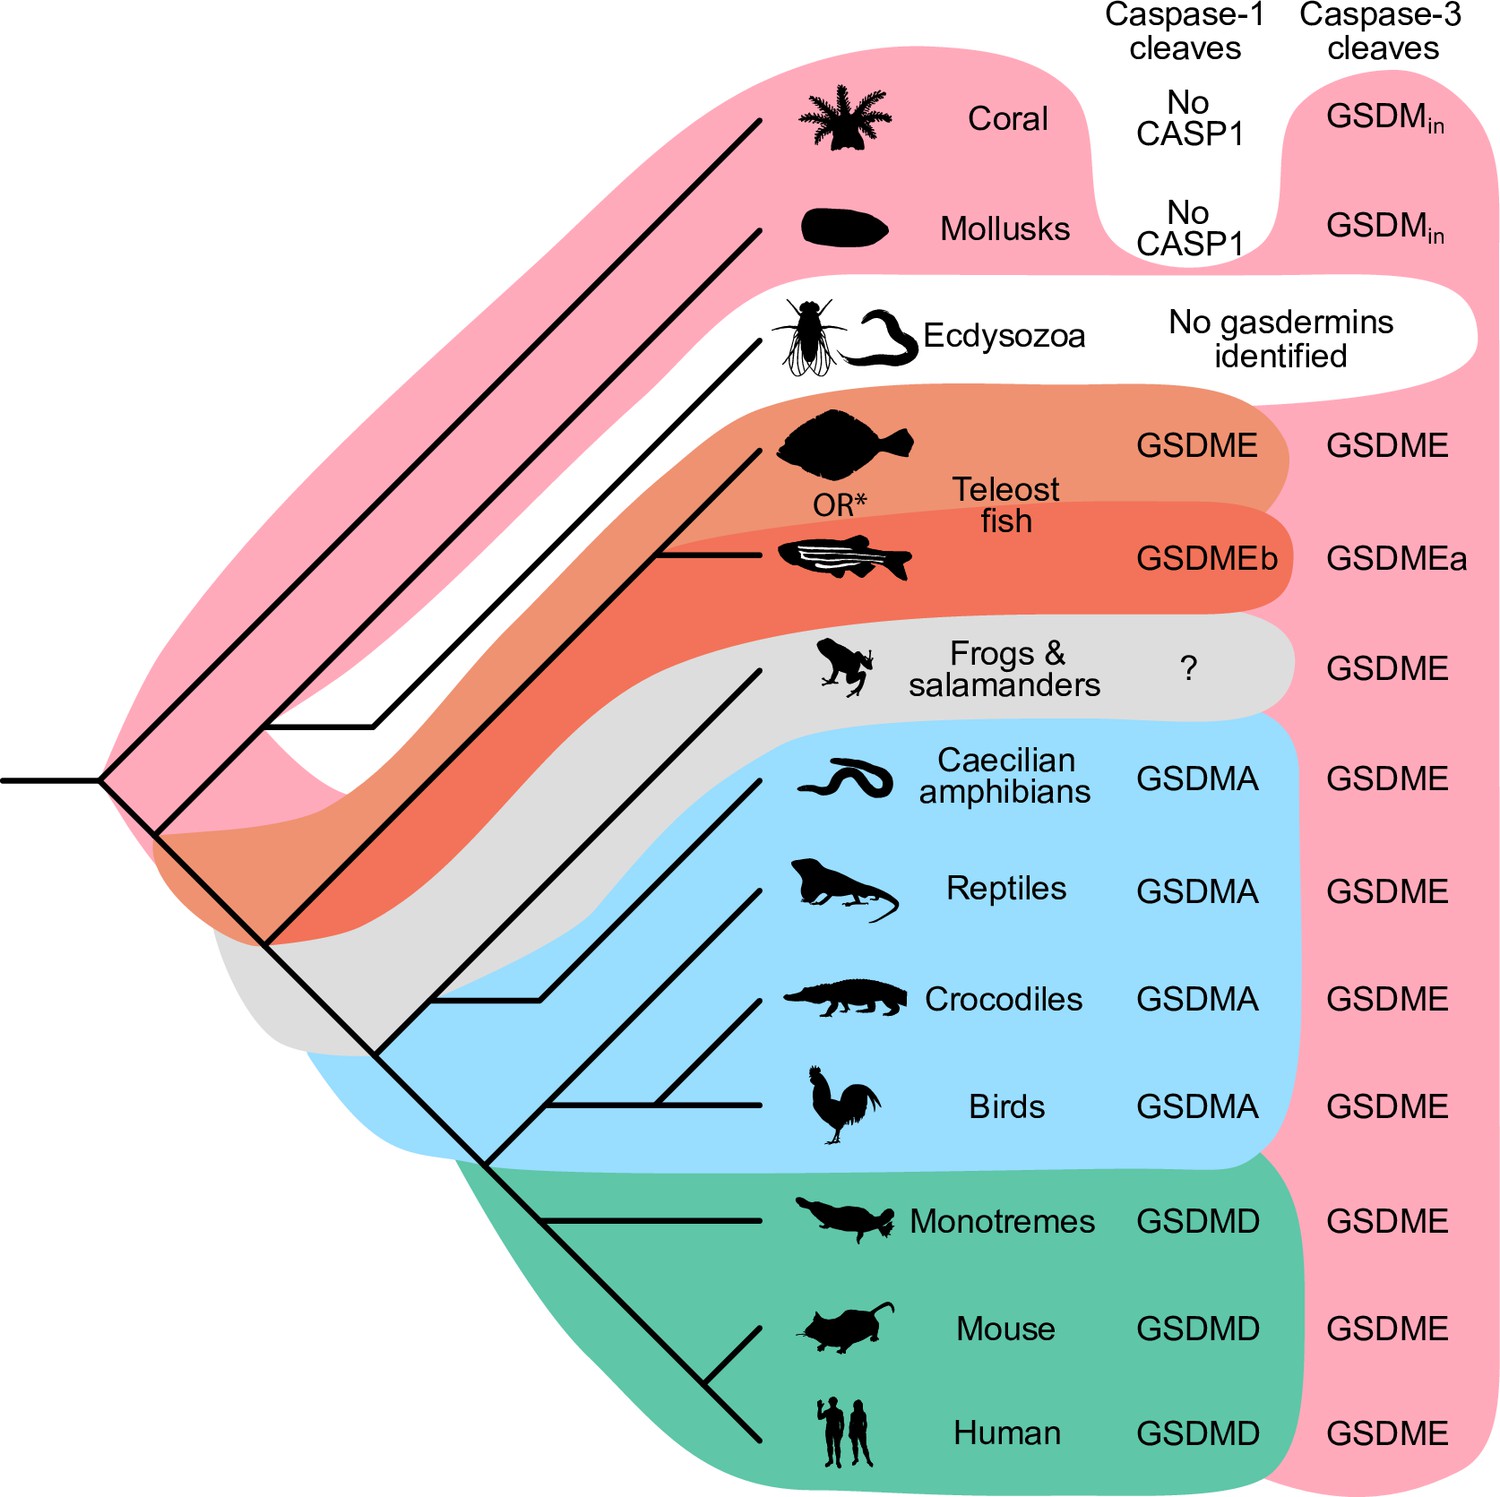
Caspase-1 targets different gasdermins throughout evolution.
Phylogenetic tree indicating which GSDM caspase-1 cleaves in various clades of life. Branch lengths are not to scale. Coral, mollusks, hydras, and other invertebrates do not encode caspase-1 and cleave GSDMin with caspase-3. Coral and mollusks are indicated in this diagram. We did not identify any gasdermins in 3030 genomes from Ecdysozoa, the clade of which D. melanogaster and C. elegans are members. *Some teleost fish cleave GSDME with both caspase-1 and -3, however, other teleost fish, like the zebrafish, cleave GSDMEb with caspase-1 and GSDMEa with caspase-3, gasdermins that arose after a whole genome duplication event in teleost fish. Frogs and salamanders do not encode an identifiable GSDMA, but their GSDME contains prototypical caspase-3 cleavage sites. In mammals, GSDMD is cleaved by caspase-1 and GSDME by caspase-3. In caecilian amphibians—which are morphologically similar to snakes—birds, and reptiles, GSDMA is cleaved by caspase-1. We and others have confirmed that GSDME in birds is cleaved by caspase-3 (Figure 3J, Figure 3—figure supplement 2), and amphibian and reptile GSDME encodes prototypical caspase-3 cleavage sites.
Tables
Table 1
Gasdermin sequences analyzed by AlphaFold.
| Species | GSDM | Accession |
|---|---|---|
| Gallus gallus | A | NP_001026532.1 |
| Homo sapiens | D | NP_001159709.1 |
| Ornithorhynchus anatinus | A | XP_039769487.1 |
| Ornithorhynchus anatinus | D | XP_028917767.1 |
| Anolis carolinensis | A | XP_008111551.1 |
| Alligator mississippiensis | A | XP_014451785.1 |
| Gekko japonicus | A | XP_015279010.1 |
Table 2
Two letter species abbreviations used in this study.
| Abbreviation | Full name | Common name |
|---|---|---|
| Hs | Homo sapiens | Human |
| Gg | Gallus gallus | Chicken |
| Am | Alligator mississippiensis | American alligator |
| Ac | Anolis carolinensis | Carolina anole |
| Mu | Microcaecilia unicolor | Tiny cayenne caecilian |
| Oa | Ornithorhynchus anatinus | Platypus |
| Mm | Mus musculus | Mouse |
Table 3
Selected primers used in this study.
| Primer | Sequence |
|---|---|
| GgA-F | CTCAGACCAAGACCACTTCAGGC |
| GgA-R | CTGGGAAGGAGGGACTCAACGC |
| GgE-F | CTCACCTCCTCATCAGTGCTATCT |
| GgE-R | TGAAGCGATGTAAGGCAAGCAAC |
| GgCasp1-F | CGAGTACCAGCGCATCAAGGA |
| GgCasp1-R | TGACTGTGGTCATCTCCTGGGAA |
| Gg18S-F | TGTGCCGCTAGAGGTGAAATT |
| Gg18S-R | TGGCAAATGCTTTCGCTTT |
Table 4
Plasmids used in this study.
| Plasmid ID | Source |
|---|---|
| pHom-Mem1 | Takara 635064 |
| pMSCV-F-del Casp9.IRES.GFP | Addgene 15567 |
| pDEST-CMV-polysite | Addgene 122843 |
| pcDNA3.1(+) | Thermo Fisher V790-20 |
| pEGFP-N1 | U55762.1 |
| pmCherry-N1 | Takara 632523 |
| 2xDmrB-Δ CARD-GgCASP1 | This study |
| 2xDmrB-Δ CARD-HsCASP1 | This study |
| 2xDmrB-Δ CARD-MmCASP1 | This study |
| 3xFLAG-N-GgGSDMA | This study |
| 3xFLAG-N-GgGSDMA-D244A | This study |
| 3xFLAG-N-GgGSDMA-AAAD | This study |
| NoTag-GgGSDMA | This study |
| NoTag-GgGSDMA-D244A | This study |
| 3xFLAG-N-GgGSDME | This study |
| 3xFLAG-N-GgGSDME-D275A | This study |
| 3xFLAG-N-HsGSDMA | This study |
| 3xFLAG-N-HsGSDMD | This study |
| 3xFLAG-N-HsGSDMD-D275A | This study |
| 3xFLAG-N-HsGSDMD-AAAD | This study |
| 3xFLAG-N-MmGSDMD | This study |
| 3xFLAG-N-MmGSDMD-D276A | This study |
| 3xFLAG-N-MuGSDMA | This study |
| 3xFLAG-N-AmGSDMA | This study |
| 3xFLAG-N-AcGSDMA | This study |
| 3xFLAG-N-OaGSDMA | This study |
| 3xFLAG-N-OaGSDMD | This study |
Table 5
Antibodies used for western blotting in this study.
| Antibody | Cat # | Manufacturer |
|---|---|---|
| M2 FLAG | F1804 | Sigma-Aldrich, Burlington, MA, USA |
| Goat-anti-mouse HRP | 115-035-062 | Jackson ImmunoResearch, West Grove, PA, USA |
Additional files
Download links
A two-part list of links to download the article, or parts of the article, in various formats.
Downloads (link to download the article as PDF)
Open citations (links to open the citations from this article in various online reference manager services)
Cite this article (links to download the citations from this article in formats compatible with various reference manager tools)
Caspase-1 activates gasdermin A in non-mammals
eLife 12:RP92362.
https://doi.org/10.7554/eLife.92362.4


