Dengue viremia kinetics and effects on platelet count and clinical outcomes: An analysis of 2340 patients from Vietnam
- University of Medicine and Pharmacy at Ho Chi Minh City, Viet Nam
- Oxford University Clinical Research Unit, Viet Nam
- Hospital for Tropical Diseases, Viet Nam
- Center for Global Health, Colorado School of Public Health, United States
- Heidelberg Institute of Global Health (HIGH), Heidelberg University Hospital, Germany
- Centre for Tropical Medicine and Global health, Nuffield Department of Clinical Medicine, University of Oxford, United Kingdom
- World Mosquito Program, Monash University, Australia
Figures
Figure 1
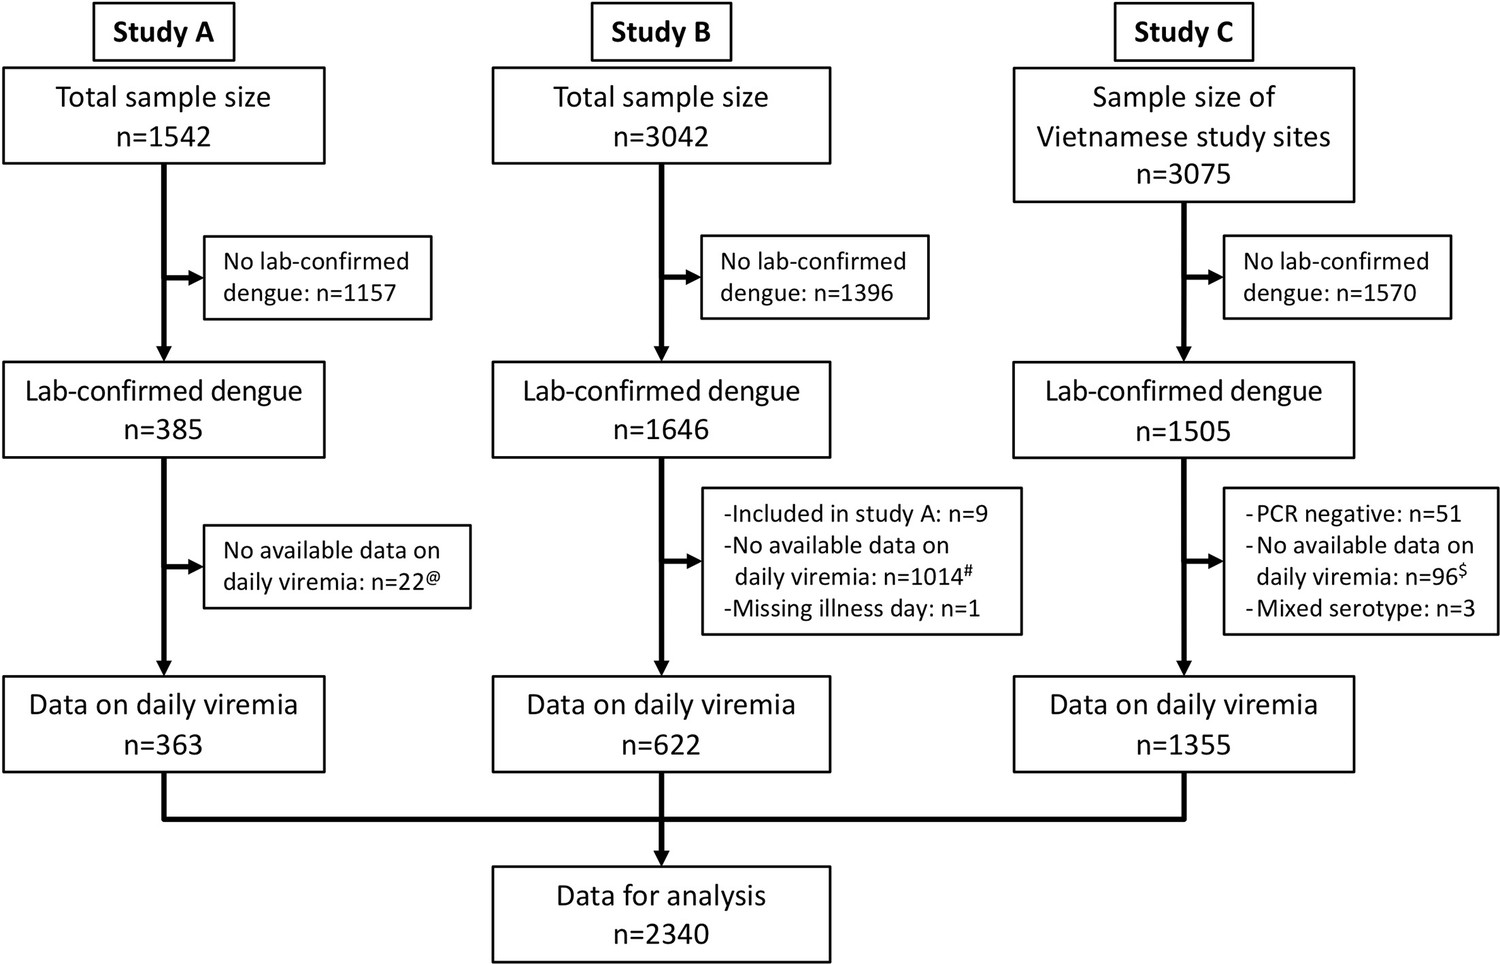
Flowchart illustrating the process of patient selection.
@Among 385 laboratory-confirmed dengue patients in study A, 31 individuals were later included in study B upon hospitalization. Of these, nine had viremia measurements available in both studies and were consequently analysed in study A. The remaining 22 lacked viremia data in study A but had measurements in study B, leading to their inclusion in study B in the analysis. #Although study B spanned from 2000 to 2009, daily viremia levels were only measured between 2006 and 2008. $In study C, one study site in Vietnam did not have daily viremia measurements. Overall, a random sample of 2340 from 3527 laboratory-confirmed dengue patients had data on viremia kinetics. PCR, polymerase chain reaction.
Figure 2
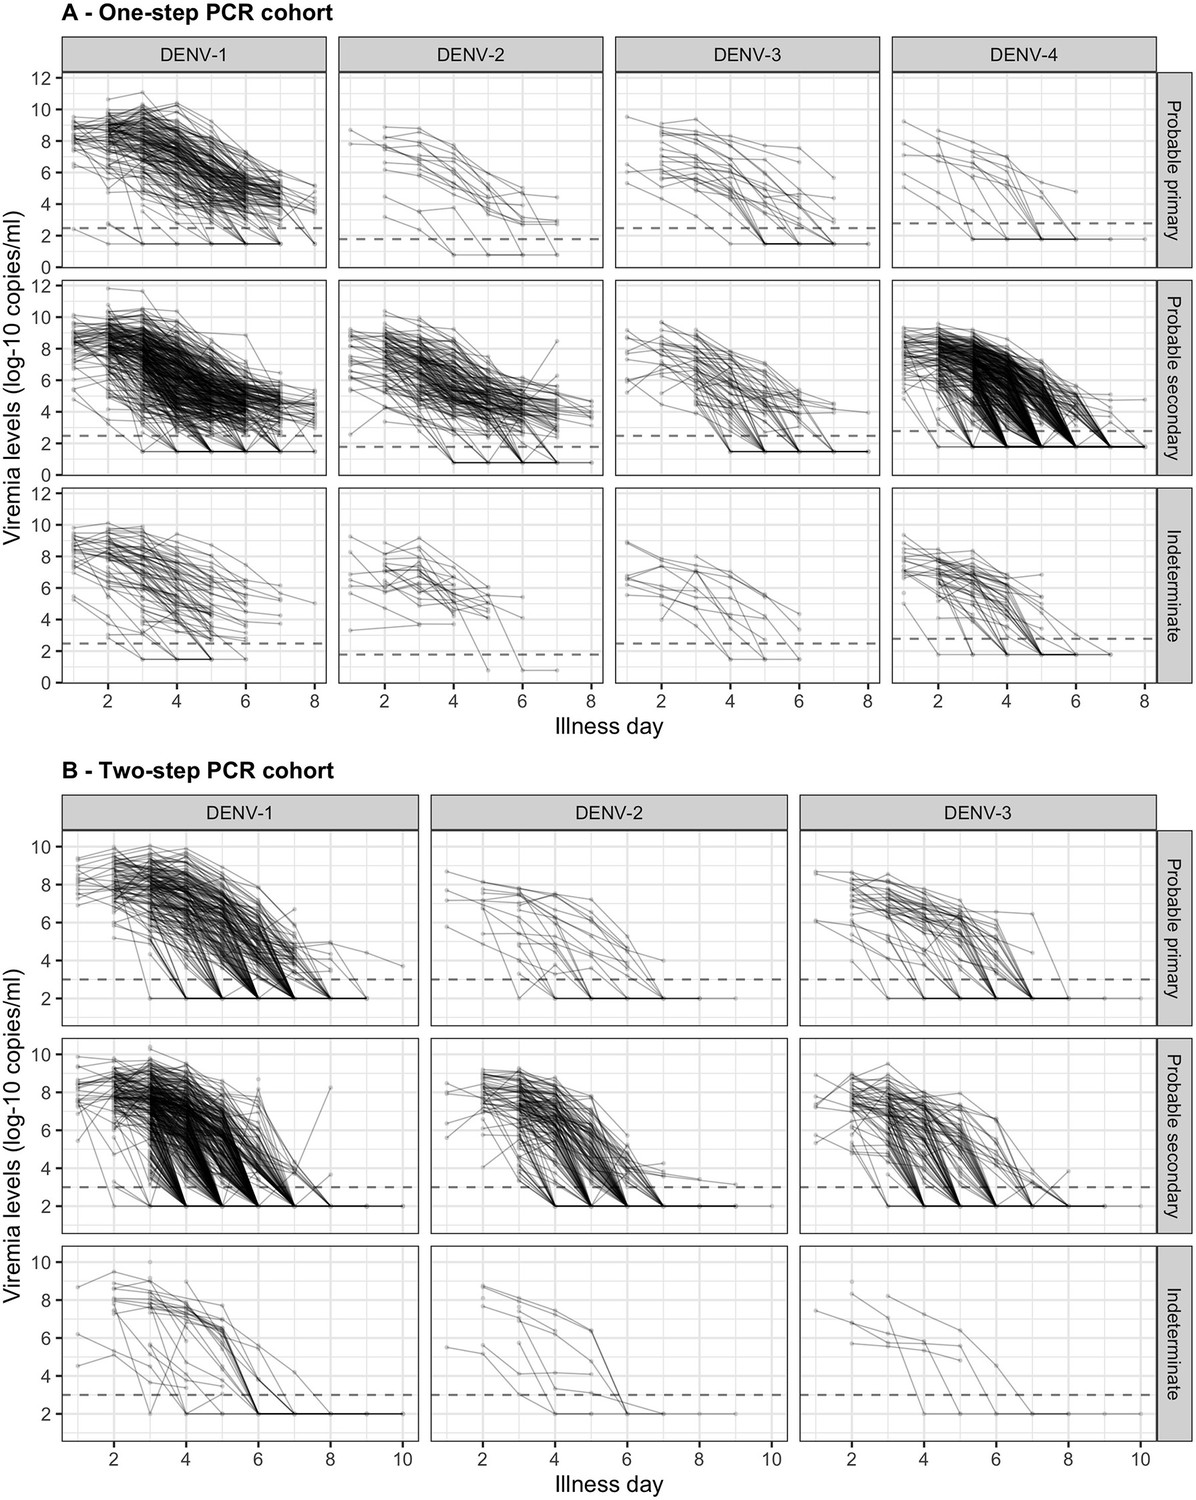
Individual trajectories of measured viremia levels for (A) the one-step PCR cohort and (B) the two-step PCR cohort.
The dots represent the measured viremia levels and are connected by lines for each individual patient. The dashed lines indicate the detection limits, which are 300 copies/ml for DENV-1 and DENV-3, 60 copies/ml for DENV-2, and 600 copies/ml for DENV-4 in the one-step PCR cohort, and 1000 copies/ml in the two-step PCR cohort. Fifty-seven measured values that are lower than 1000 copies/ml in the two-step PCR cohort are considered as below the detection limit. Values below the detection limit are visually represented as 1/10 of the corresponding detection limit (on the original scale). DENV, dengue virus; PCR, polymerase chain reaction.
Figure 3
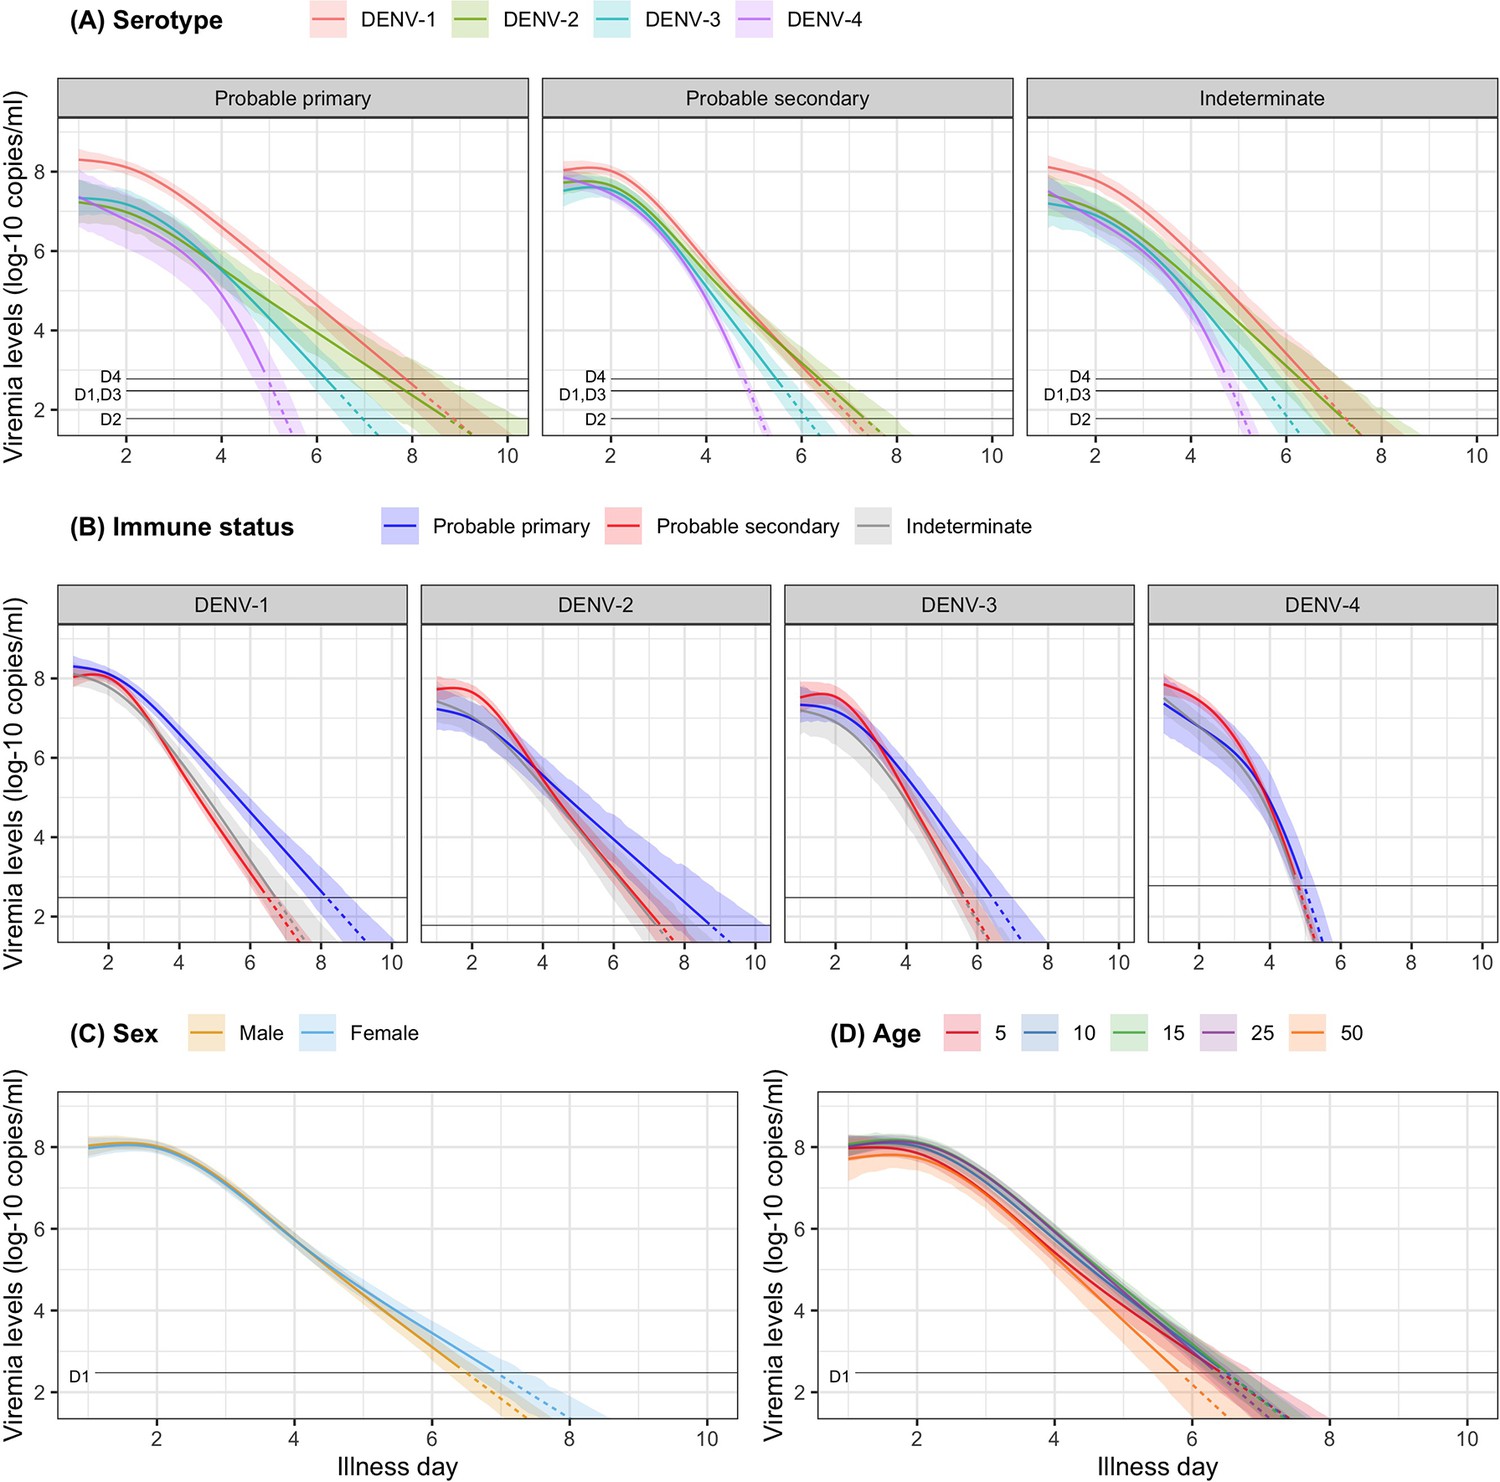
Fitted trends in mean viremia levels for (A) serotype, (B) immune status, (C) sex, and (D) age.
The colored lines represent the estimated mean viremia levels, and the colored shaded regions represent the corresponding 95% credible intervals. The horizontal lines represent the detection limits (D1, D2, D3, and D4 denote DENV-1, DENV-2, DENV-3, and DENV-4, respectively). Dashed lines indicate fitted viremia levels that are below the detection limit. Viremia levels are shown for age of 10 years, male sex, serotype DENV-1, probable secondary infection, and using the one-step PCR. DENV, dengue virus; PCR, polymerase chain reaction.
Figure 4
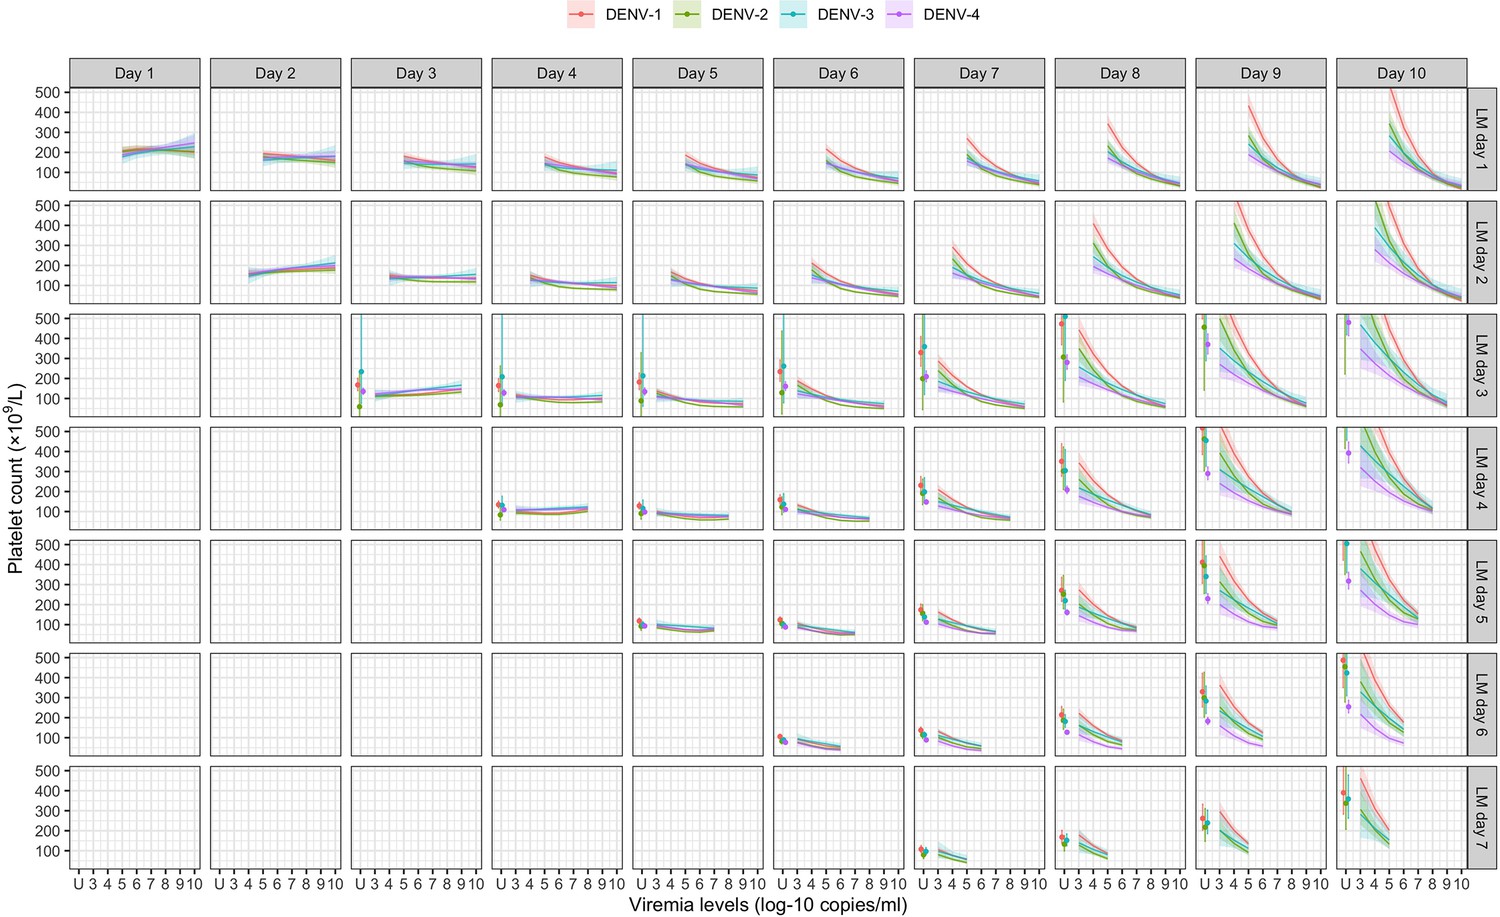
Fitted trends in mean platelet counts according to viremia levels – results from the supermodel.
The colored lines or dots represent the estimated mean platelet counts. The colored shaded regions and whiskers indicate the corresponding 95% confidence intervals. Each row represents the effect of viremia on a specific day to platelet count from that day to day 10. No fitted trends are made for DENV-4 in LM day 7 since viremia was undetectable in almost all DENV-4 cases from day 7 onwards. The mean platelet counts are shown for age of 10 years, male sex, probable secondary infection, and using the one-step PCR. DENV, dengue virus; LM, landmark; PCR, polymerase chain reaction; U, under the limit of detection.
Figure 5
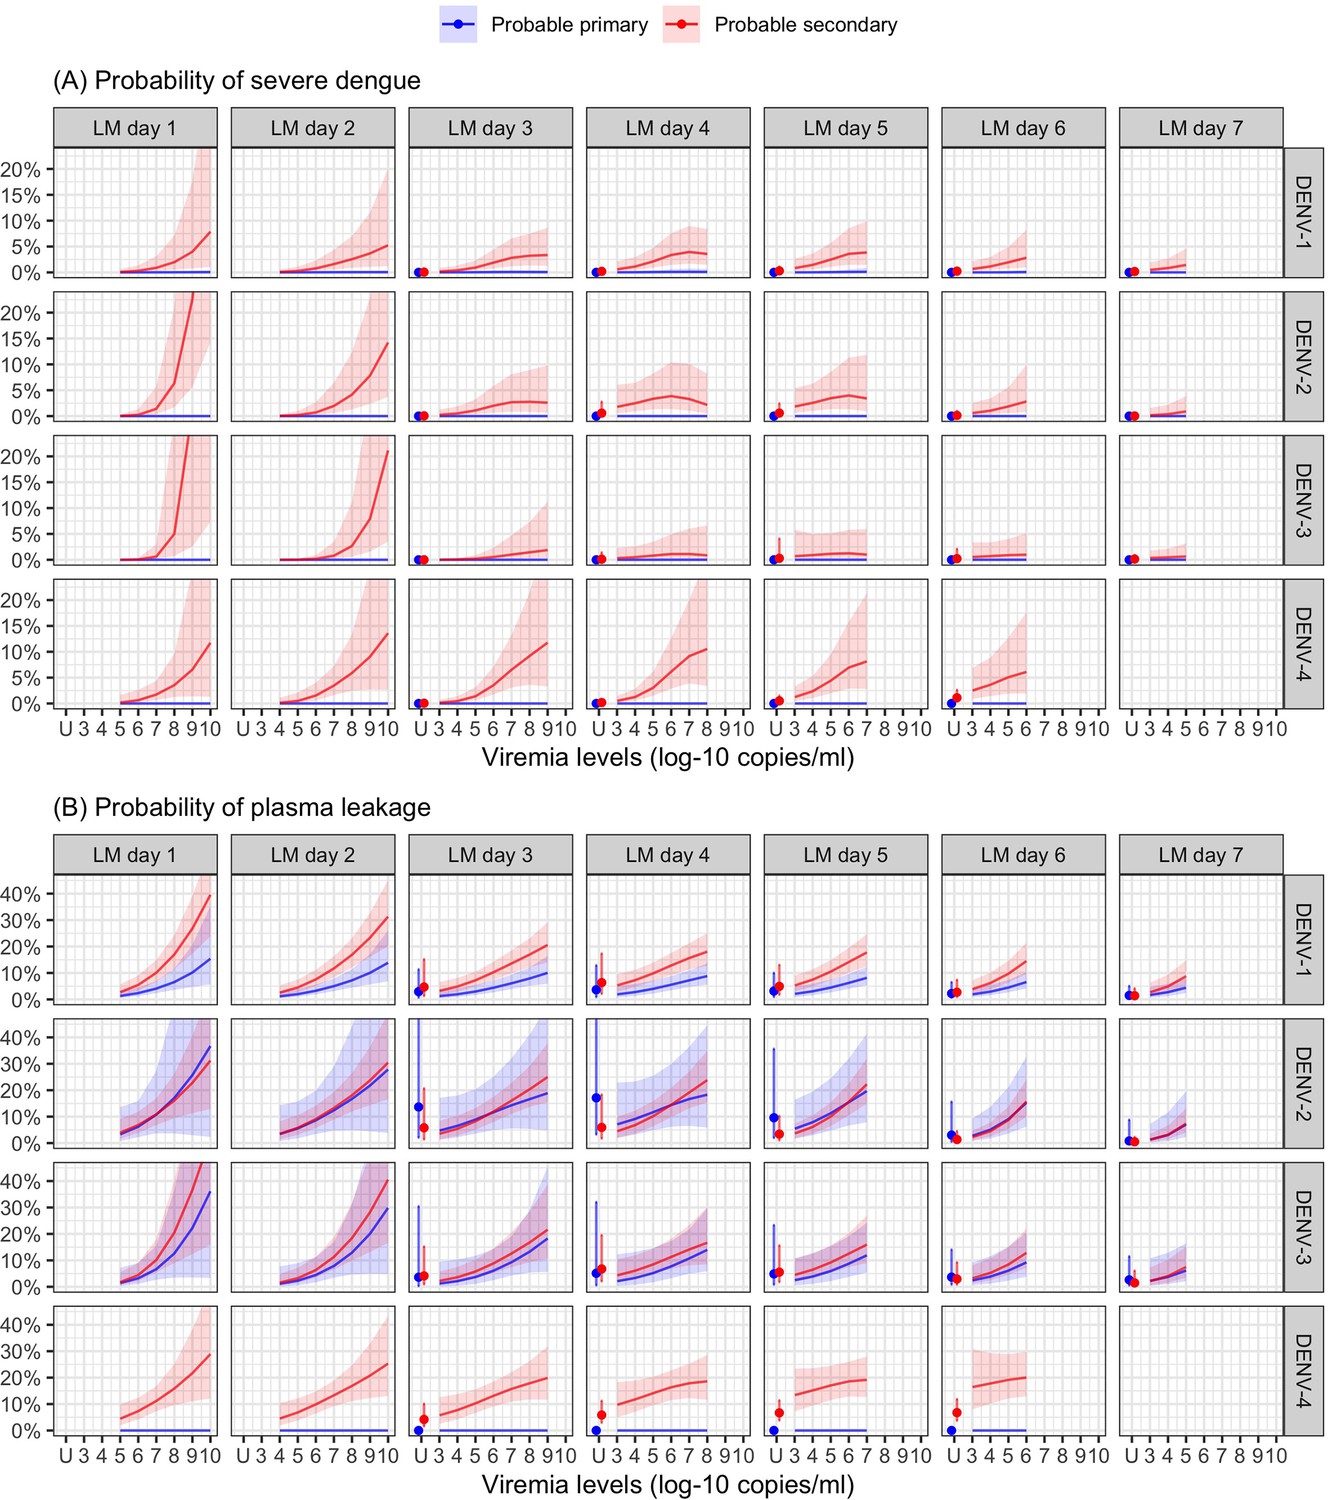
Probability of occurrence of (A) severe dengue and (B) plasma leakage, according to viremia levels – results from the supermodel.
The colored lines or dots represent the probability of the endpoints. The colored shaded regions and whiskers indicate the corresponding 95% confidence intervals. Each column represents the effect of viremia on a specific day. No fitted trends are made for DENV-4 in LM day 7 since viremia was undetectable in almost all DENV-4 cases from day 7 onwards. Note that due to the limited number of severe dengue in primary infections (only 1 case in DENV-1) and plasma leakage in primary DENV-4 (see Appendix 4—table 1), the estimated probability of having these outcomes is nearly zero across all viremia levels within these subgroups. The probabilities are shown for age of 10 years, male sex, probable secondary infection, and from Study C. DENV, dengue virus, LM, landmark; PCR, polymerase chain reaction; U, under the limit of detection.
Figure 6
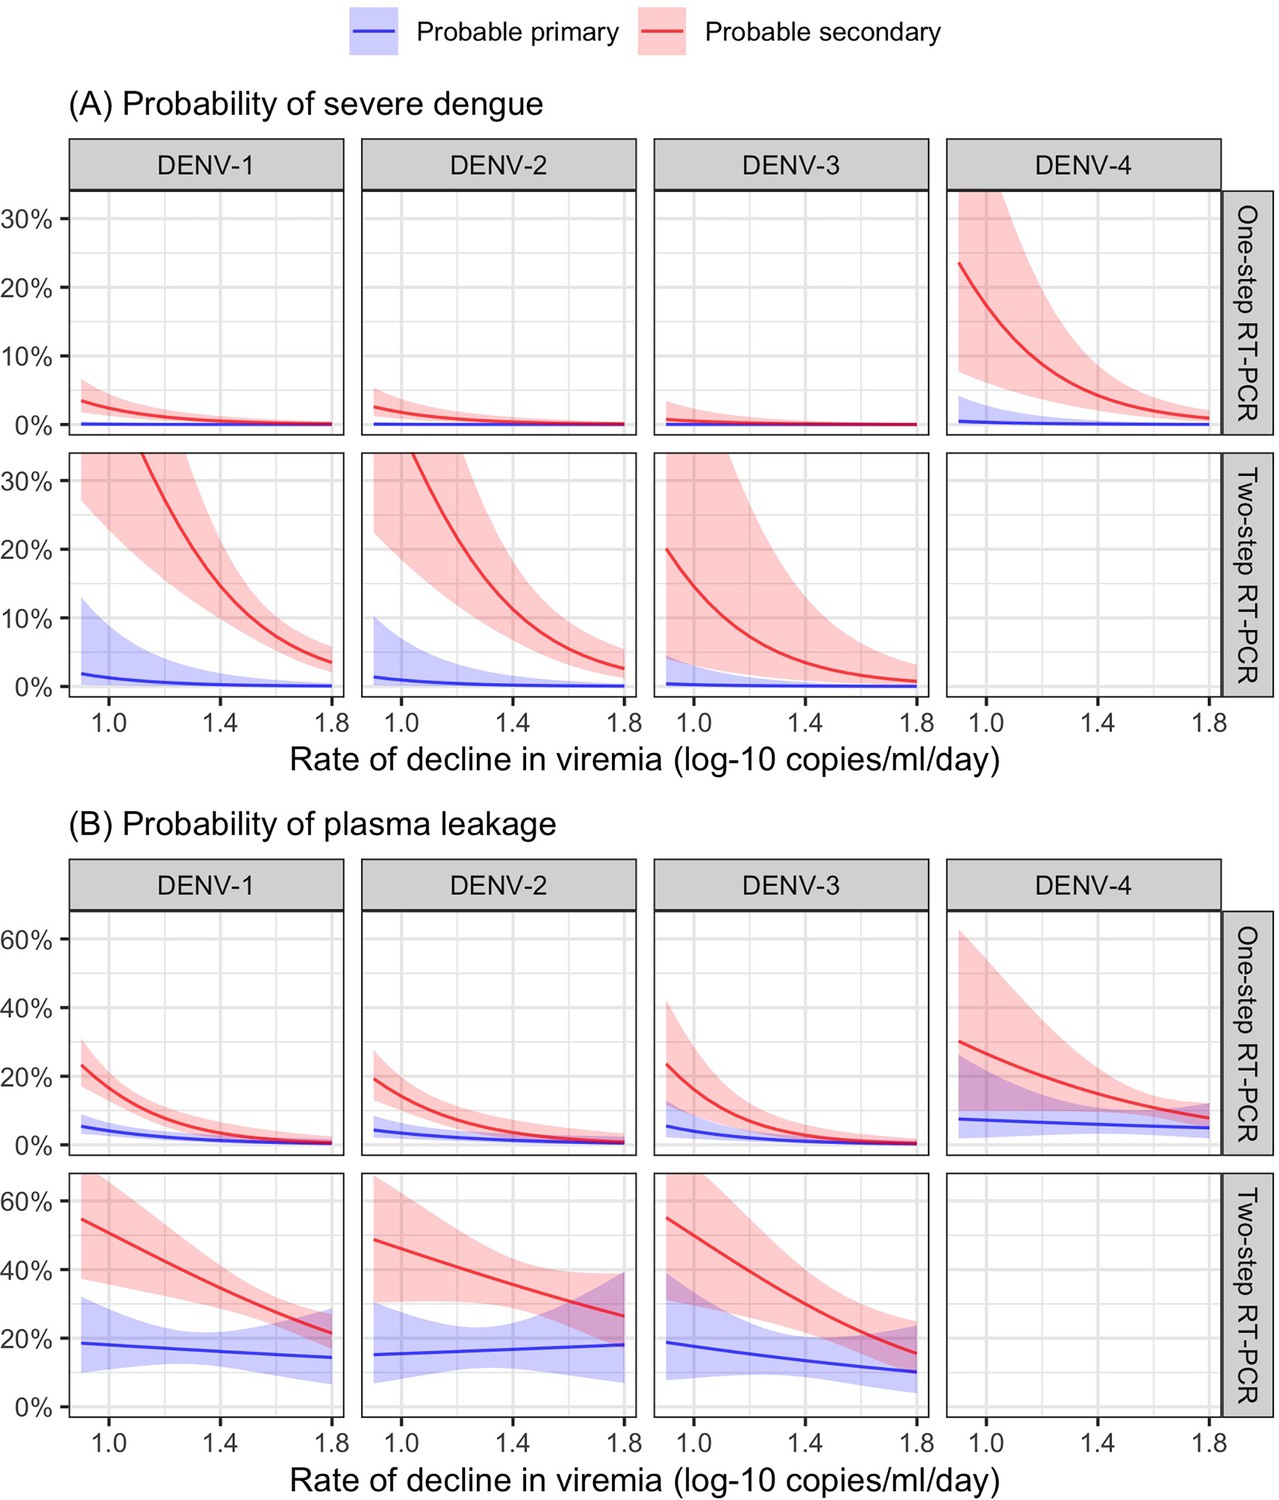
Probability of occurrence of (A) severe dengue and (B) plasma leakage, according to the rate of decline in viremia.
The colored lines represent the probability of the endpoints. The colored shaded regions indicate the corresponding 95% confidence intervals.
Appendix 3—figure 1
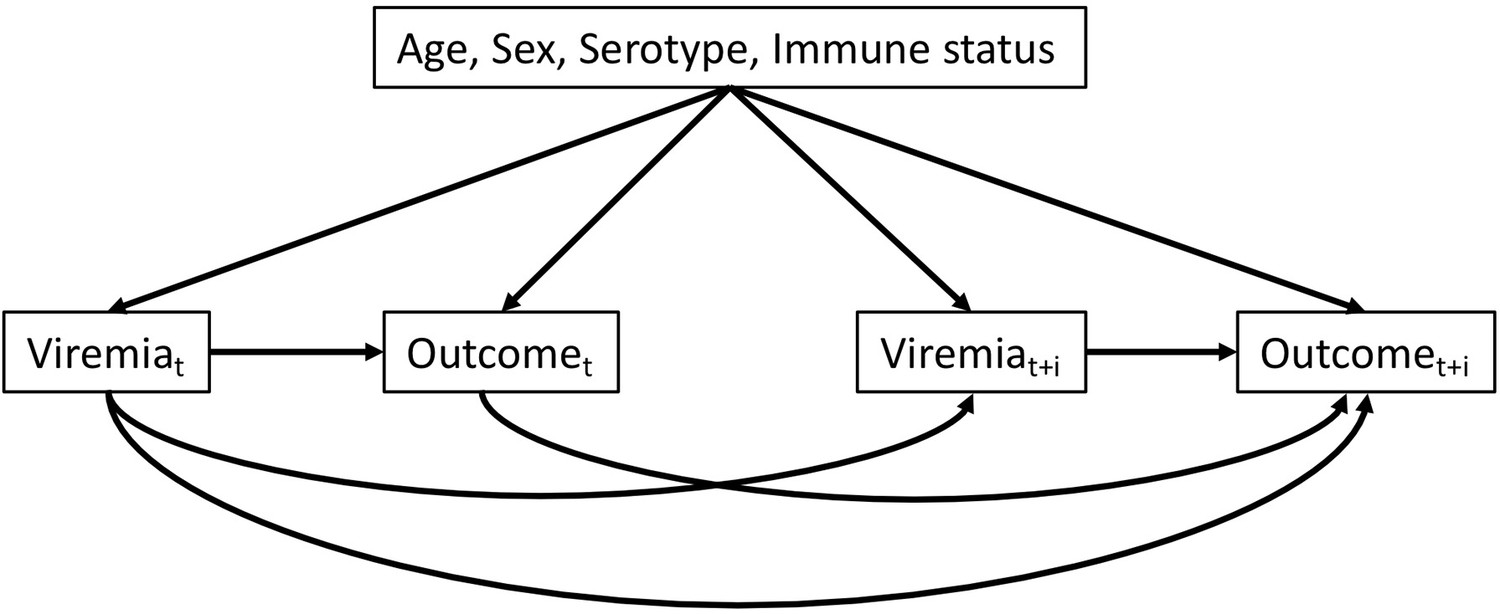
Directed acyclic graph illustrating the presumed causal relationships among variables.
t: illness day t (from days 1 to 7). t + i: after day t (i ≥ 1). Outcome can be platelet count or clinical outcomes (severe dengue or plasma leakage)
Appendix 3—figure 2
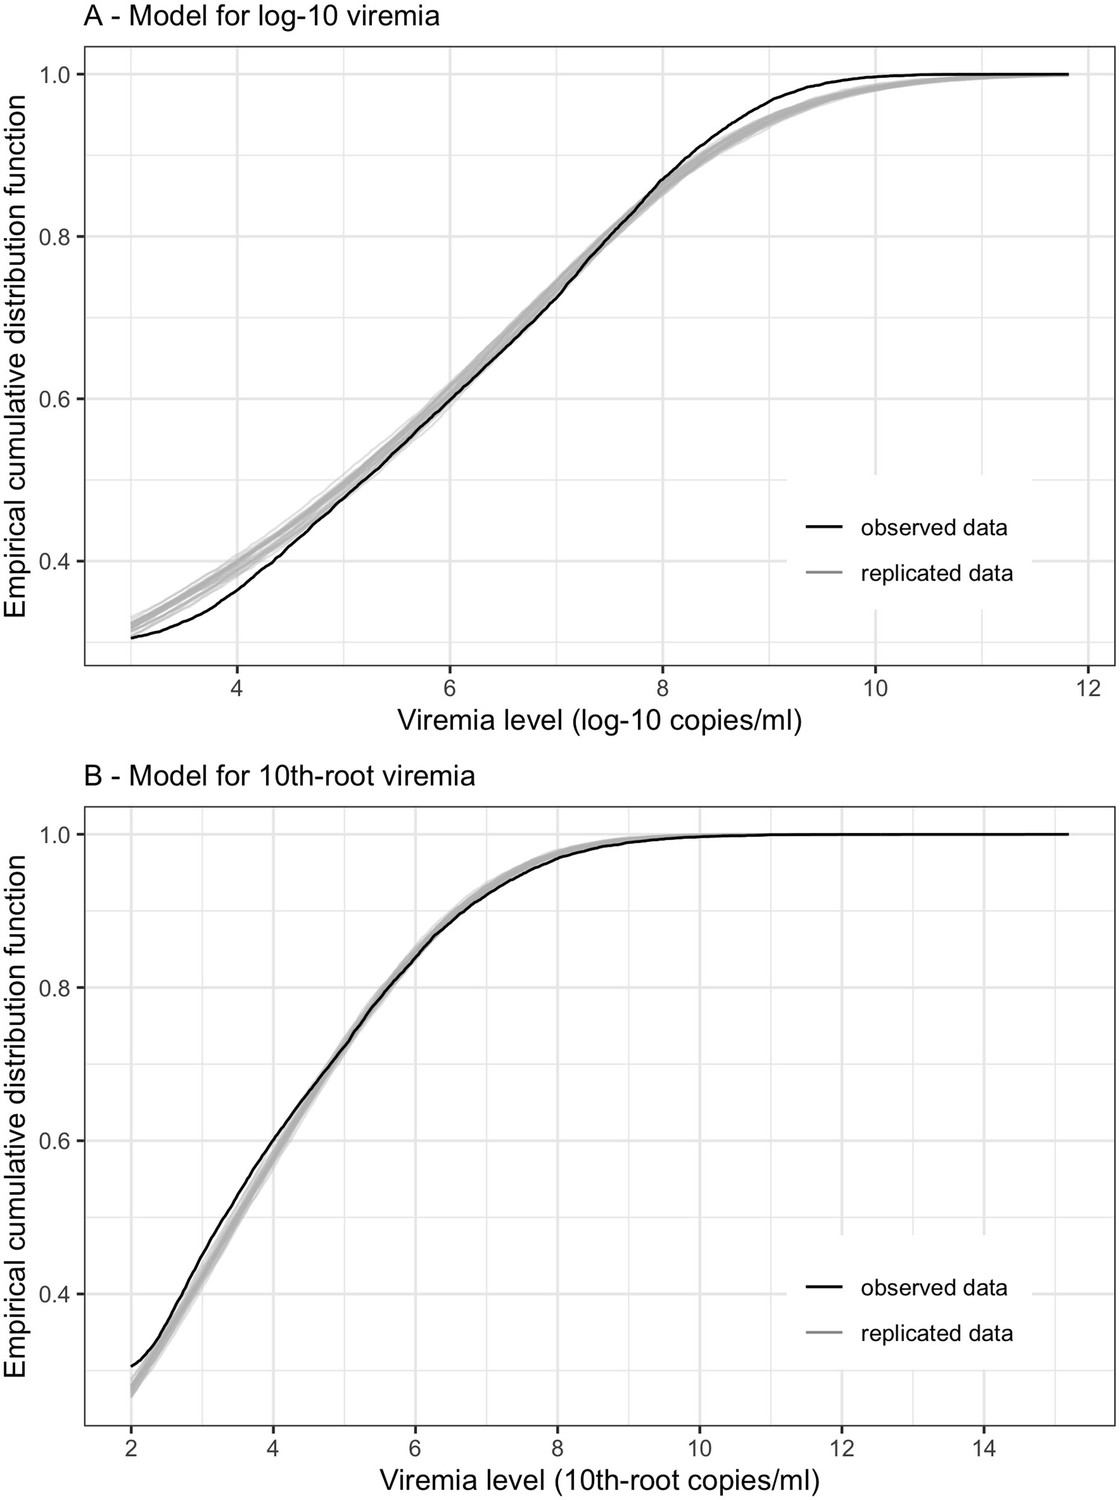
Empirical distribution estimation obtained from viremia kinetics model for (A) log-10 viremia and (B) 10th-root viremia.
The figures show the empirical cumulative distribution function of the observed viremia levels (represented by the black curve), along with the empirical cumulative distribution function derived from 100 simulated sets of viremia levels generated by the model (represented by the gray curves). The plots are started from 1000 copies/ml (on the original scale). The close resemblance between the observed and simulated distributions in both models based on log-10 and 10th-root transformations of viremia levels suggests that the models provide a relatively good fit to the data.
Appendix 3—figure 3
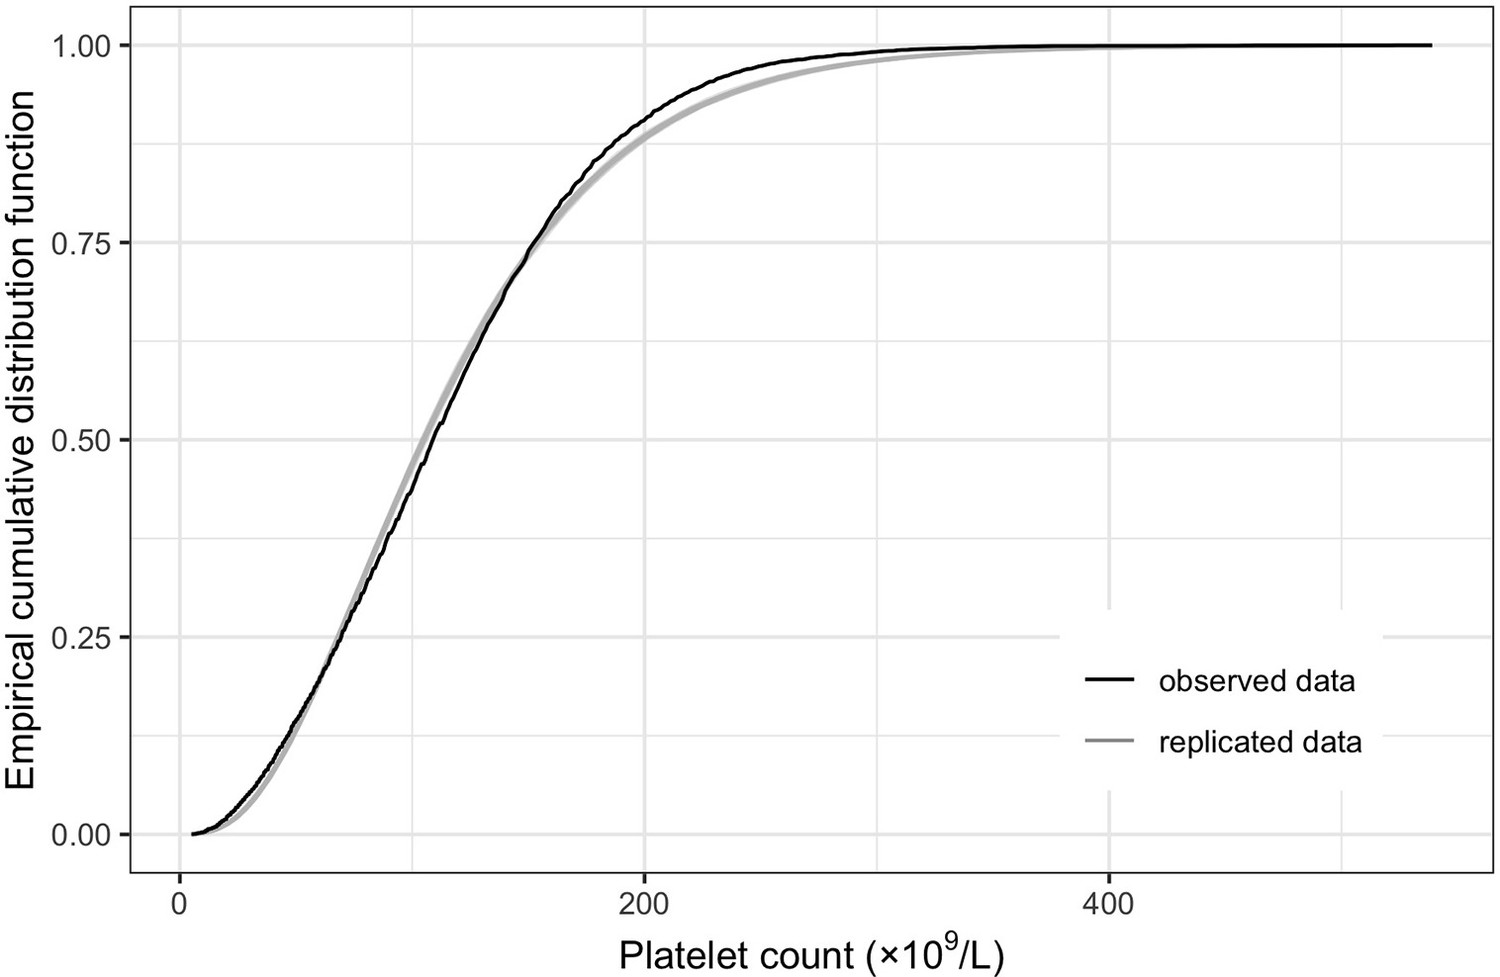
Empirical distribution estimation obtained from platelet count model.
The figure shows the empirical cumulative distribution function of the observed platelet counts (represented by the black curve), along with the empirical cumulative distribution function derived from 100 simulated data points generated by the model (represented by the gray curves). The close resemblance between the observed and simulated distributions suggests that the model provides a relatively good fit to the data.
Appendix 4—figure 1
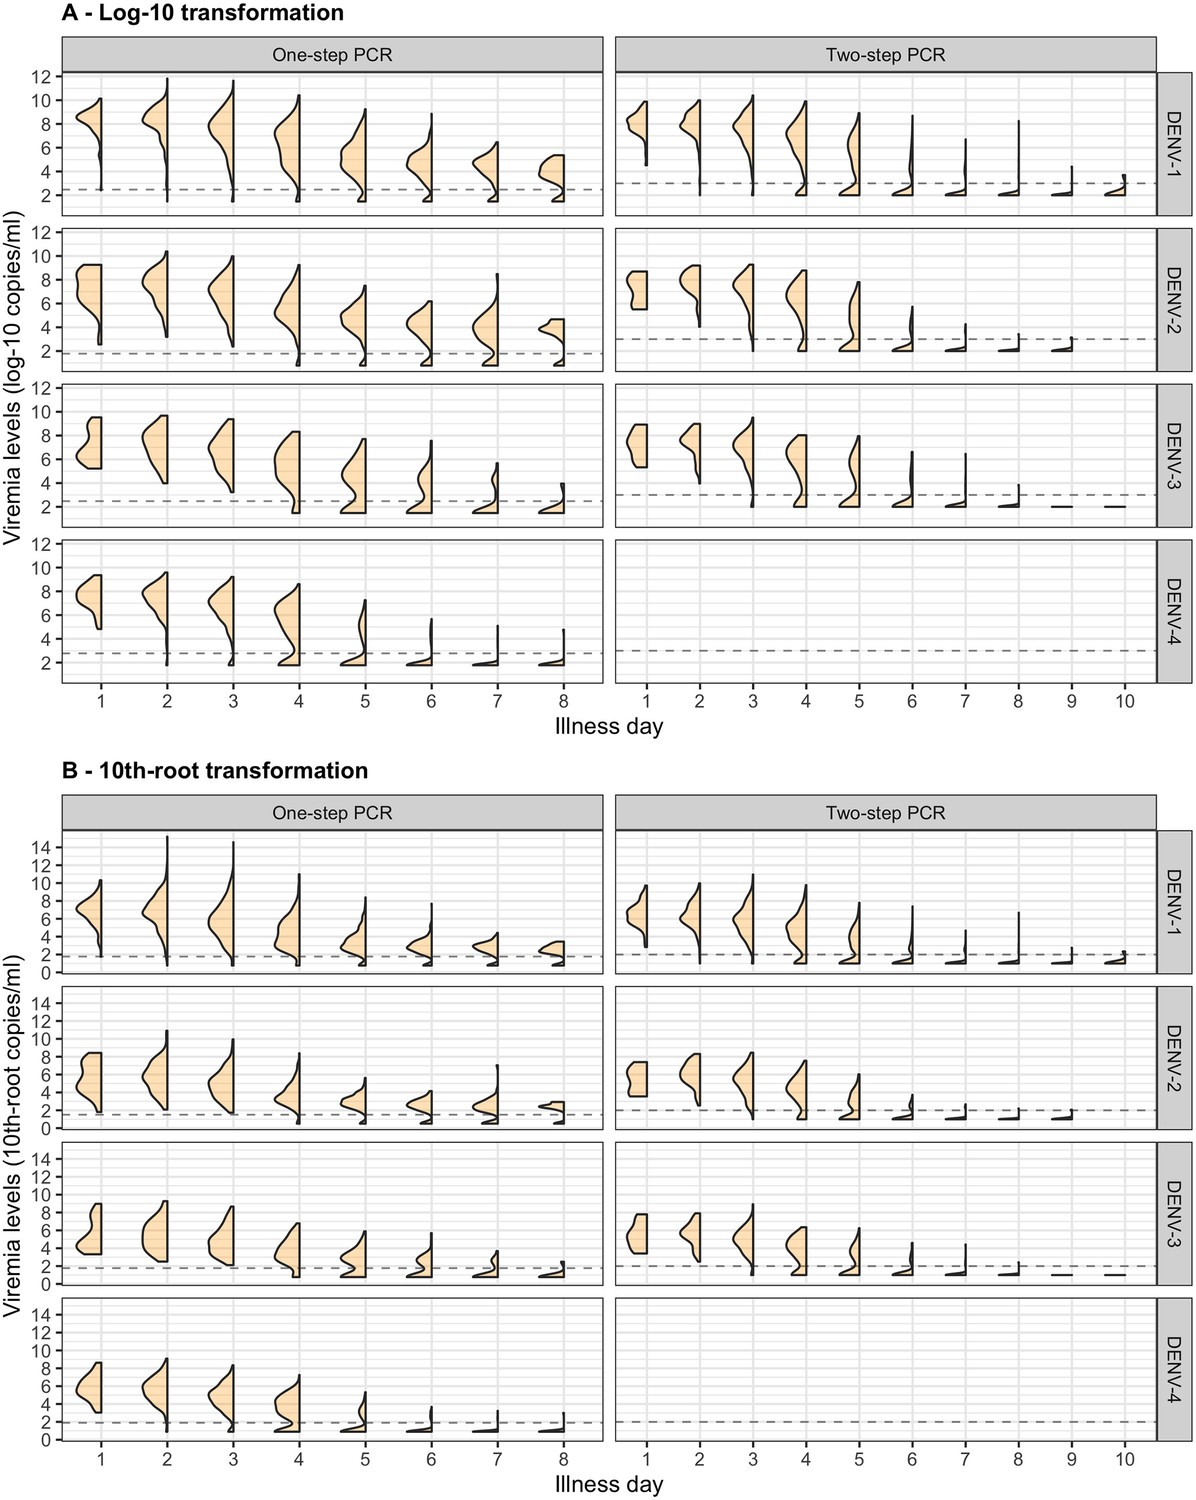
Distribution of (A) log-10 and (B) 10th-root viremia levels by illness day.
Values below the detection limit are set as 1/2 of the detection limit in each corresponding transformation scale.
Appendix 4—figure 2
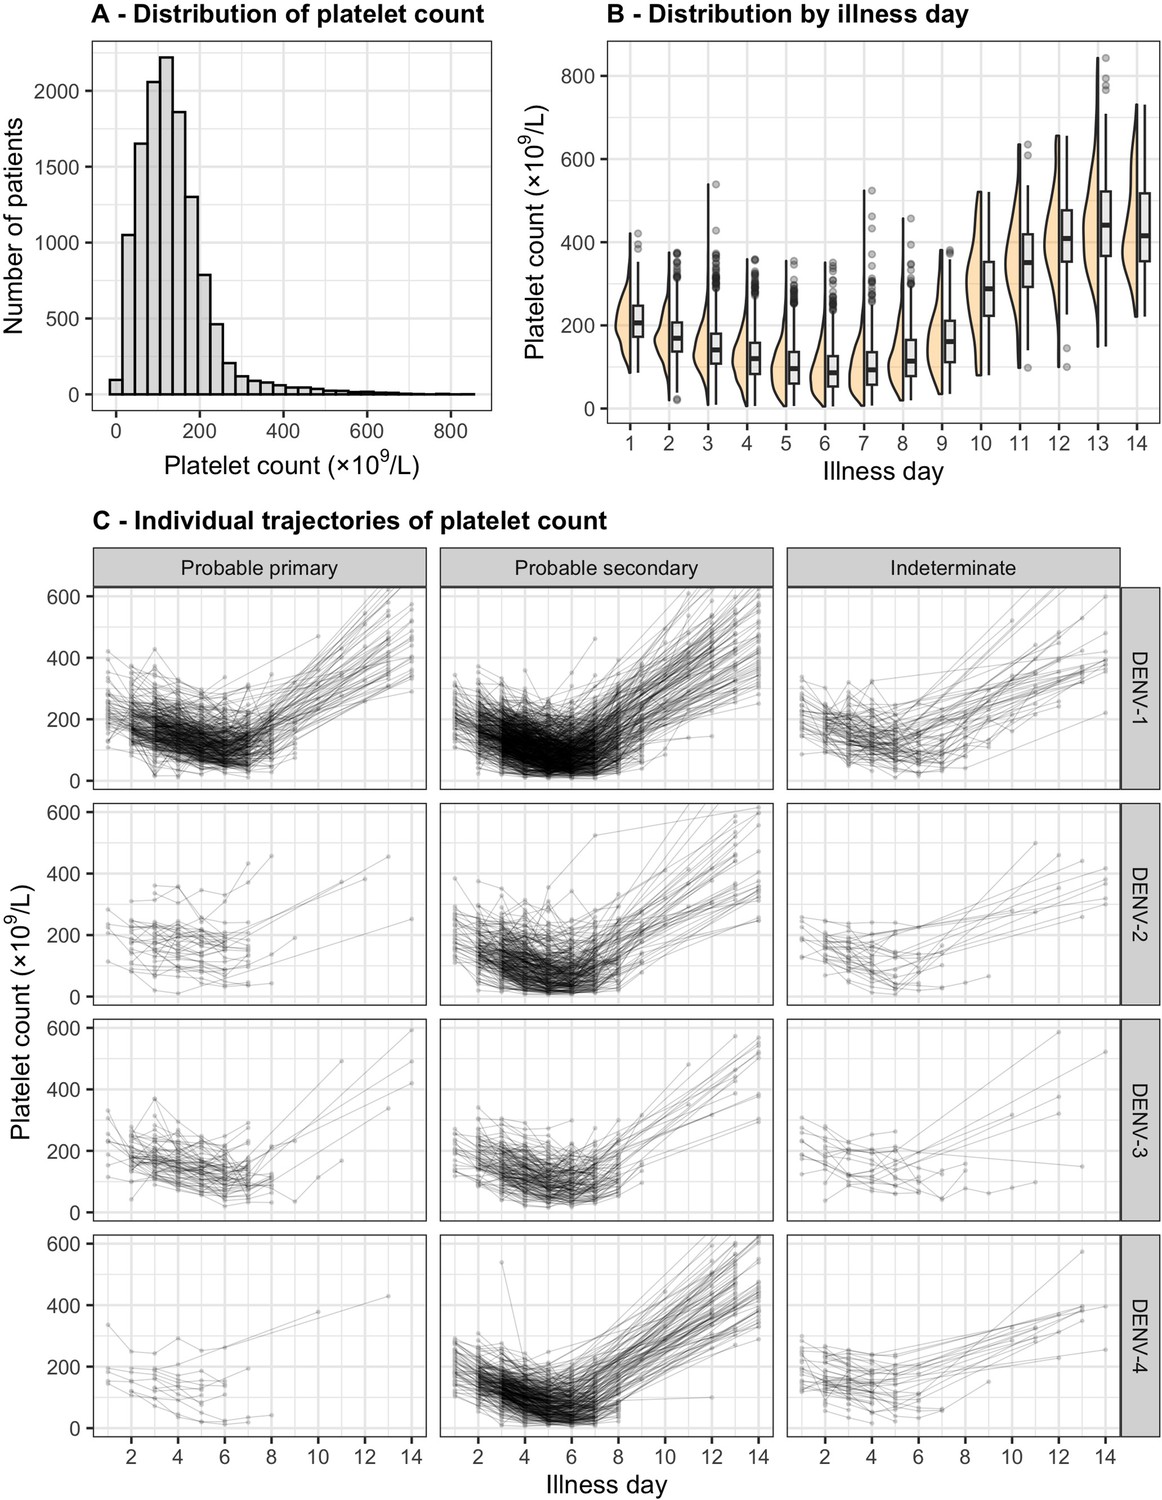
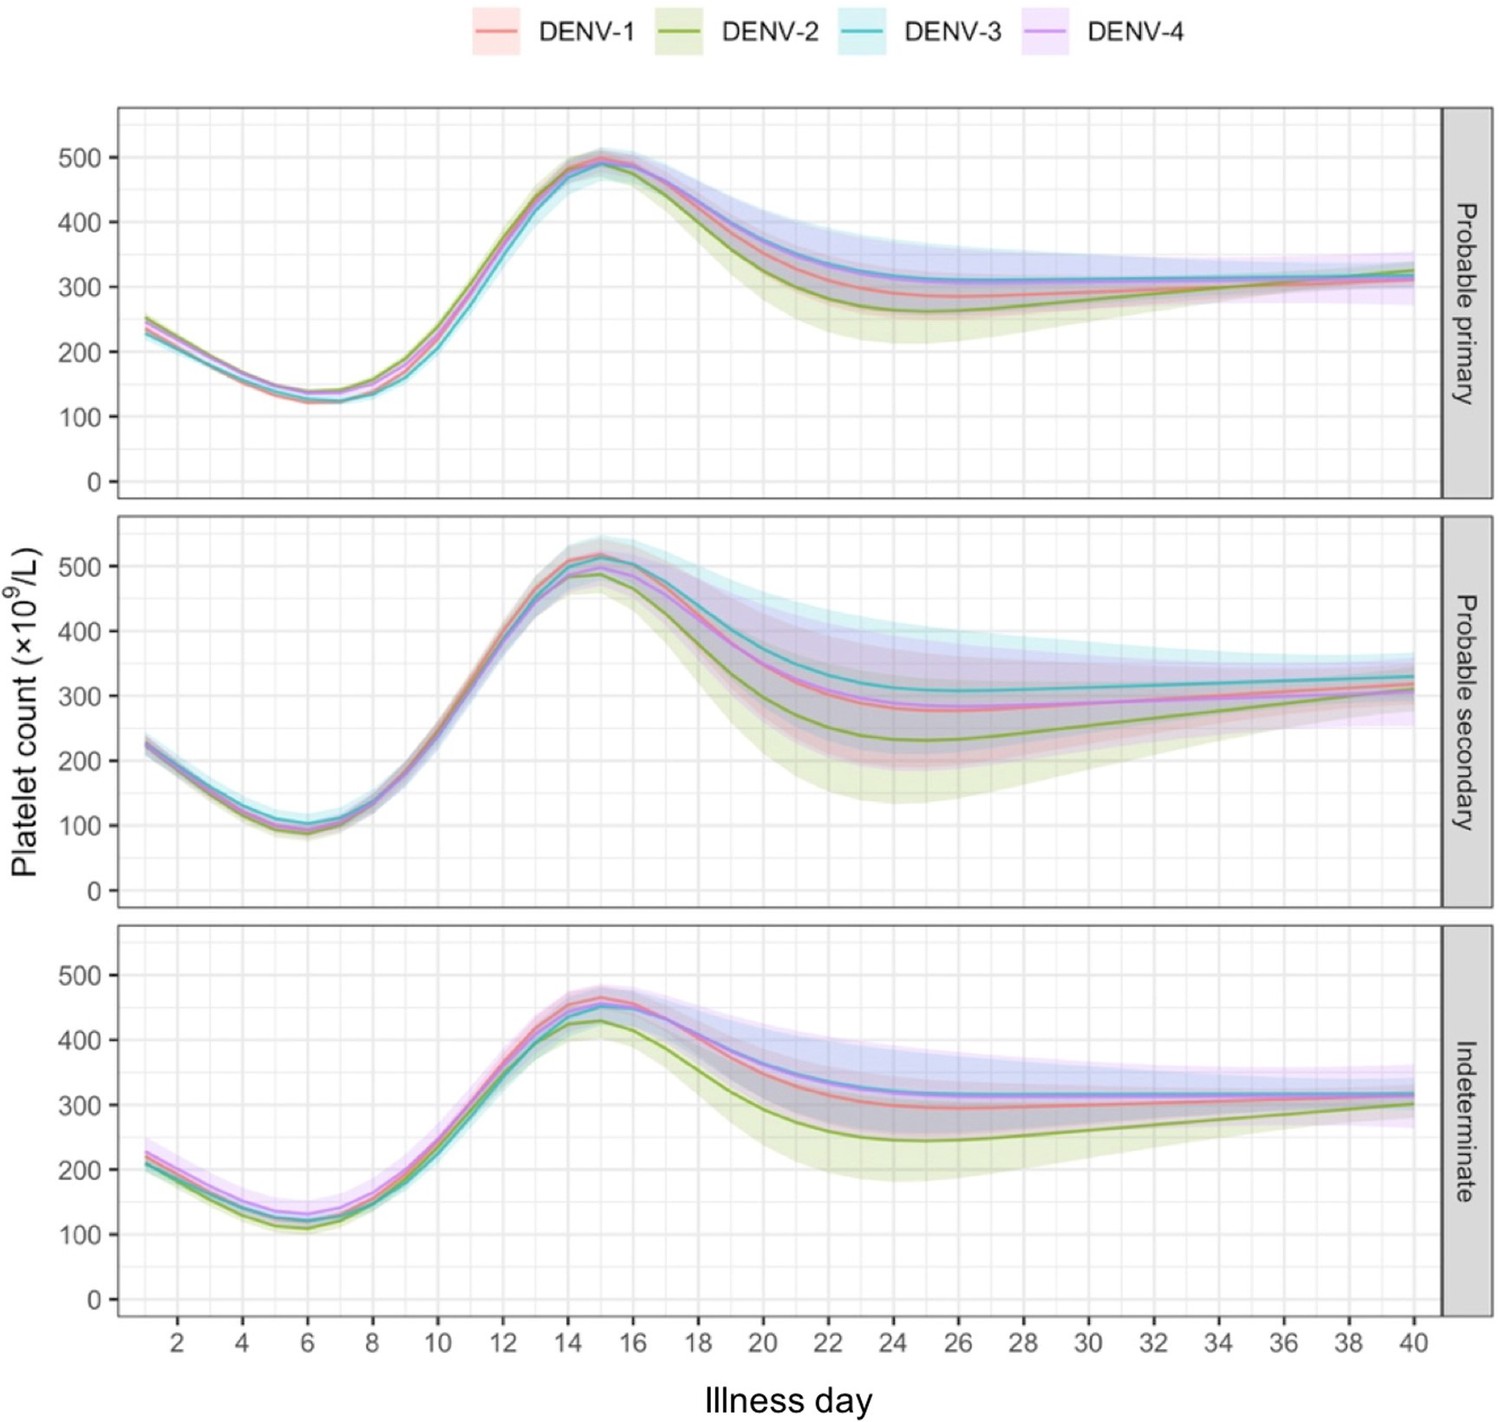
Distribution and individual trajectory of platelet count.
The distribution of platelet count is shown with all measurements (A) and by illness day (B). In (B), the line inside each box represents the median, the upper and lower margins of each box indicate the interquartile range (25th; 75th percentile), and the violin curves illustrate the distribution of platelet count. Individual trajectories of platelet count are shown in (C): the dots represent the measured platelet counts and are connected by lines for each individual patient. The summary is restricted up to illness day 14. DENV, dengue virus.
Appendix 4—figure 3
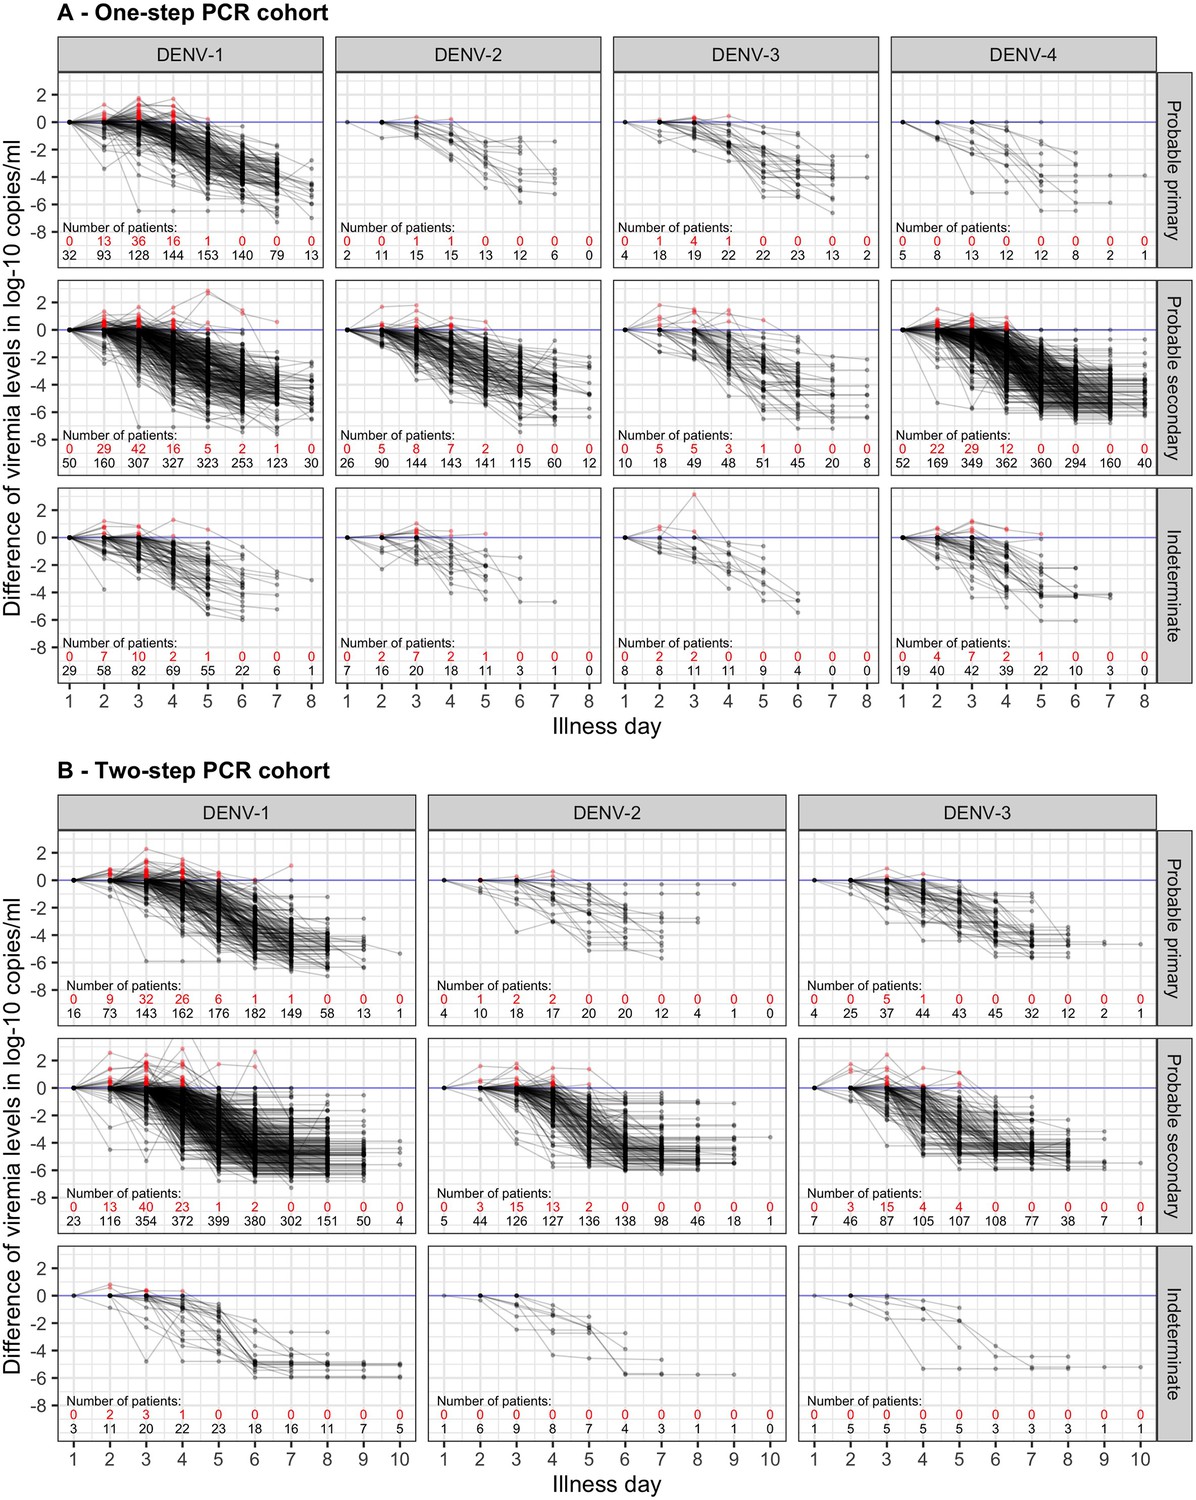
Difference in log-10 viremia from first measurement for (A) the one-step PCR cohort and (B) the two-step PCR cohort.
The red dots represent values that are higher than the first value. The red and black numbers indicate the number of measurements that are higher and lower than the first value, respectively. The upper limit of the y-axis is set at 2.5 to provide a clearer visualization. Values below the detection limit are set as the corresponding detection limit to calculate the differences. DENV, dengue virus; PCR, polymerase chain reaction.
Appendix 5—figure 1
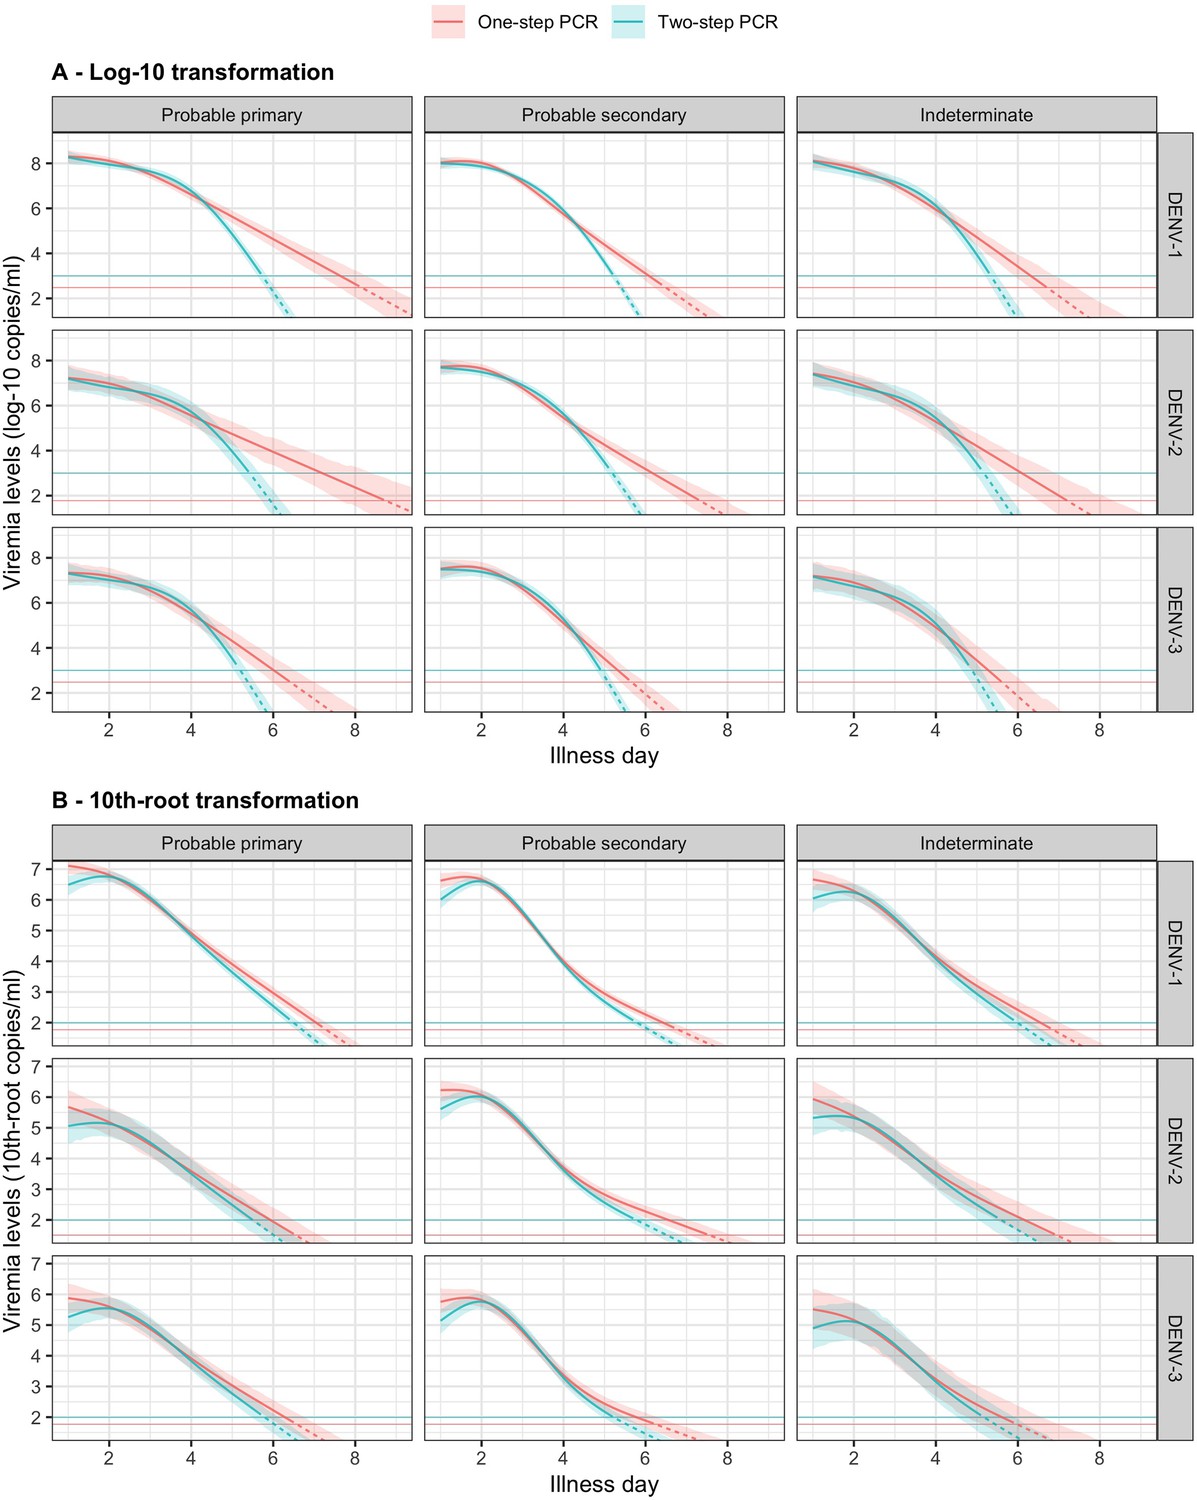
Compare fitted trends in mean viremia levels between one- and two-step PCR methods based on (A) log-10 and (B) 10th-root transformations.
The estimated mean viremia levels are represented by colored lines. The 95% credible intervals are shown as colored shaded regions. The horizontal lines indicate the detection limits. Dashed lines indicate the estimated viremia levels below the detection limits. Viremia levels are shown for age of 10 years and male sex. DENV, dengue virus; PCR, polymerase chain reaction.
Appendix 5—figure 2
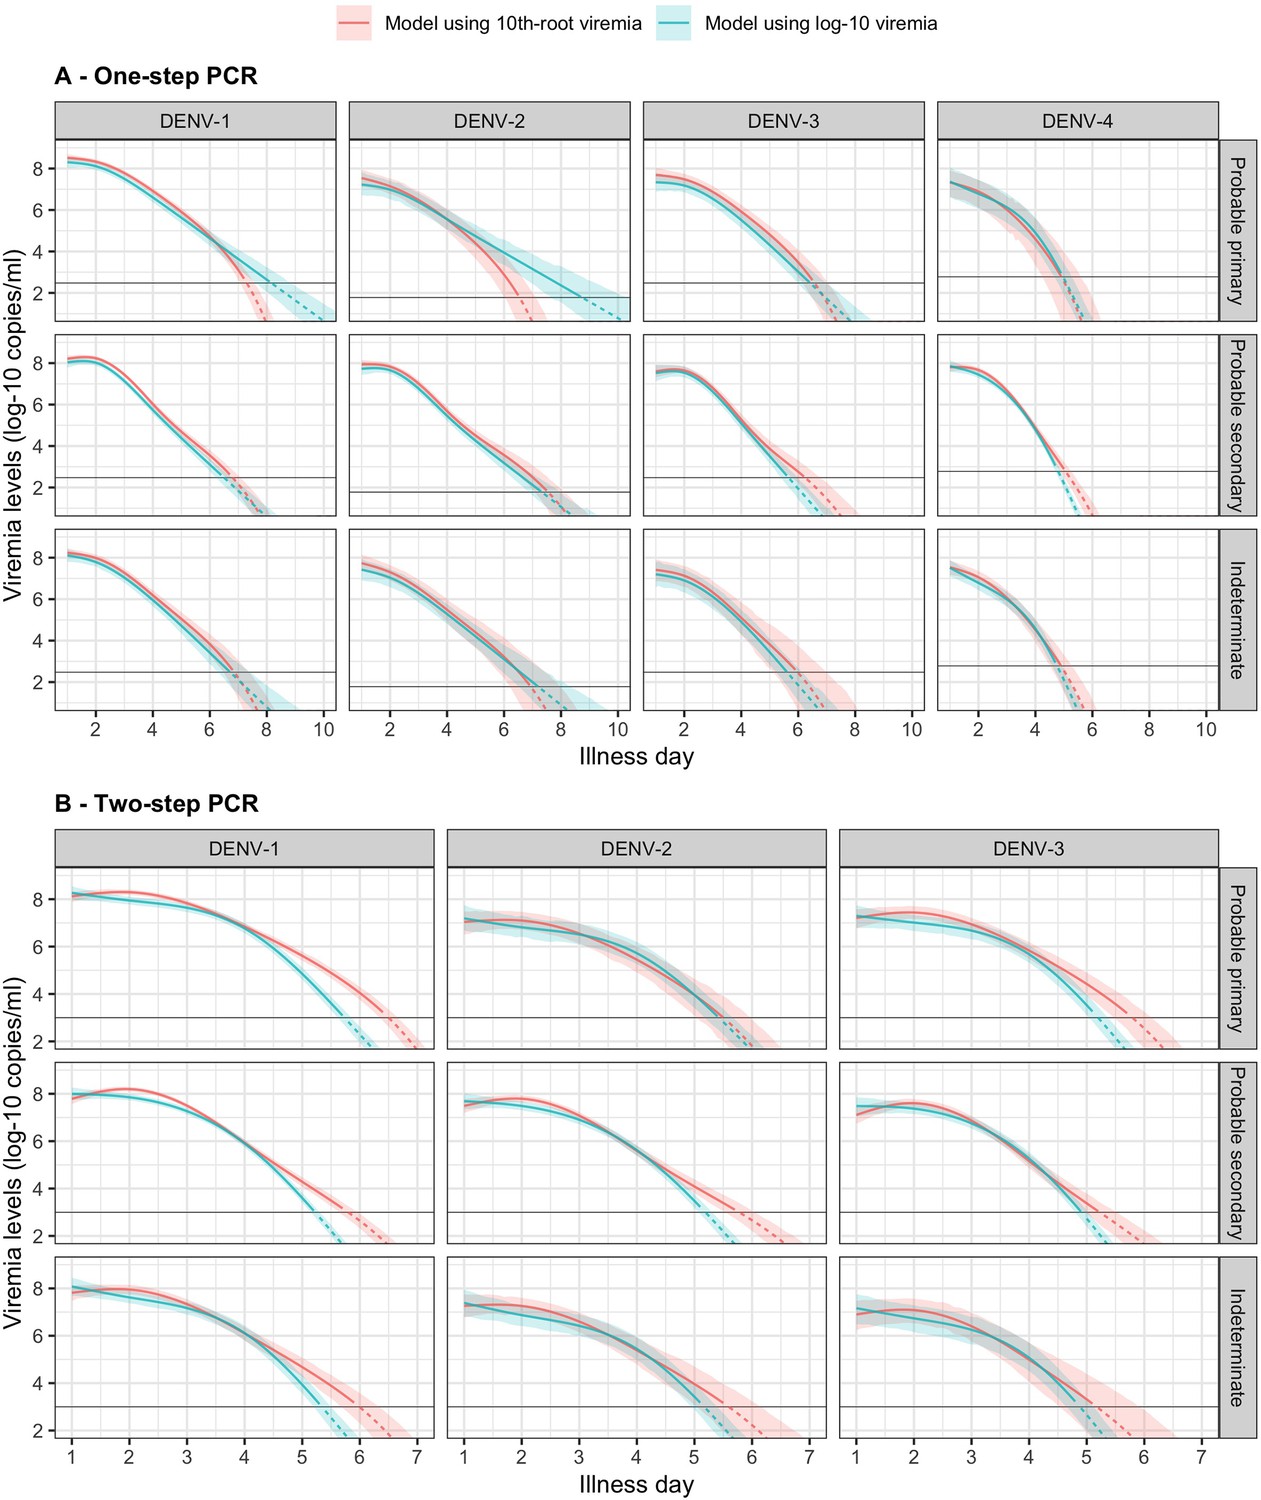
Fitted trends in mean viremia levels by models based on 10th-root and log-10 viremia transformations for (A) one-step and (B) two-step PCR methods.
The estimated mean viremia levels are represented by colored lines. The 95% confidence intervals are shown as colored shaded regions. The horizontal lines indicate the detection limits. Dashed lines indicate the estimated viremia levels below the detection limits. Predicted mean viremia levels from 10th-root transformation are transformed to the log-10 scale. The viremia levels are shown for an age of 10 years and male sex.
Appendix 6—figure 1
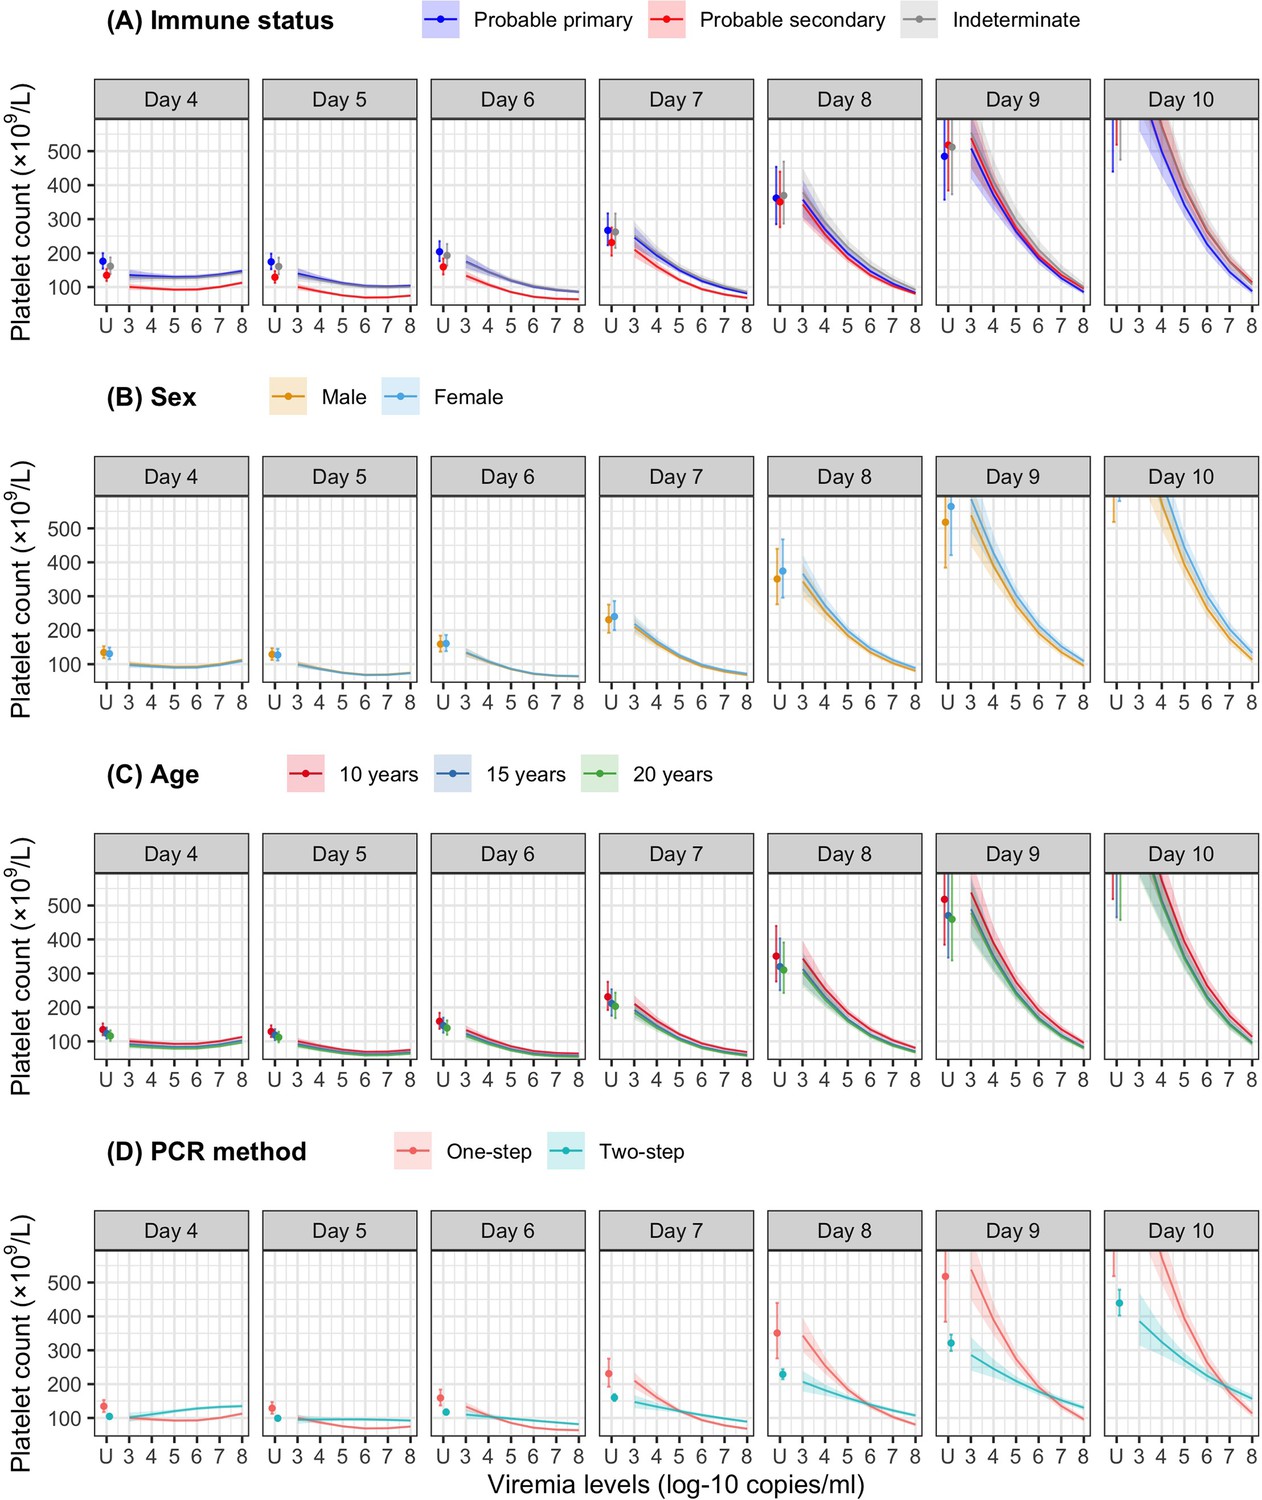
Fitted trends in mean platelet counts according to viremia levels by subgroups of the covariates (A) immune status, (B) sex, (C) age, and (D) PCR method – results from the supermodel.
The colored lines or dots represent the estimated mean platelet counts. The colored shaded regions and whiskers indicate the corresponding 95% confidence intervals. The figures show the effect of viremia on day 4 to platelet count from days 4 to 10. The mean platelet counts are shown for age of 10 years, male sex, serotype DENV-1, probable secondary infection, and using the one-step PCR. DENV, dengue virus; LM, landmark; PCR, polymerase chain reaction; U, under the limit of detection.
Appendix 7—figure 1
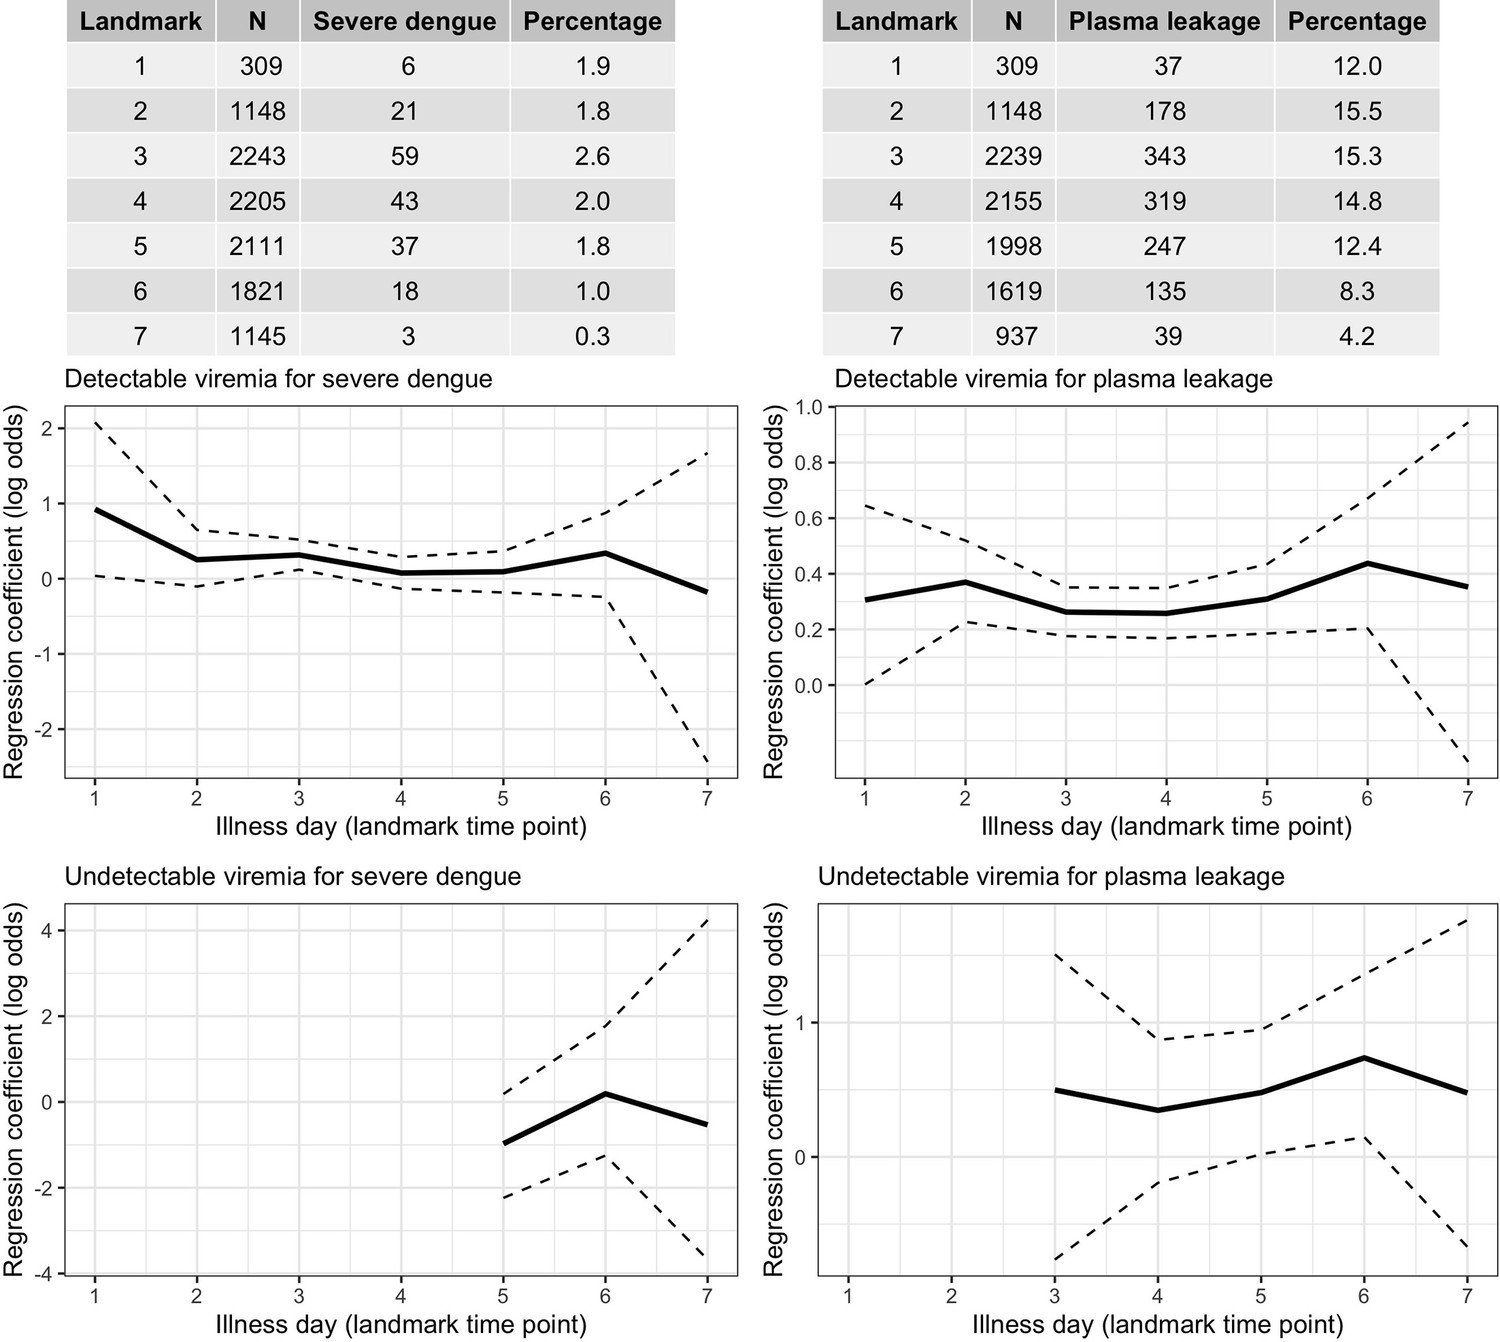
Frequency of the outcomes and regression coefficients for individuals observed on each landmark day that did not have the outcome yet.
Relationship between viremia and outcome. A logistic regression model with covariates viremia level (with linear trend) and the binary variable describing whether the viremia value was undetectable is fitted per landmark time point. Solid lines are the regression coefficients and dashed lines are the 95% confidence intervals.
Appendix 7—figure 2
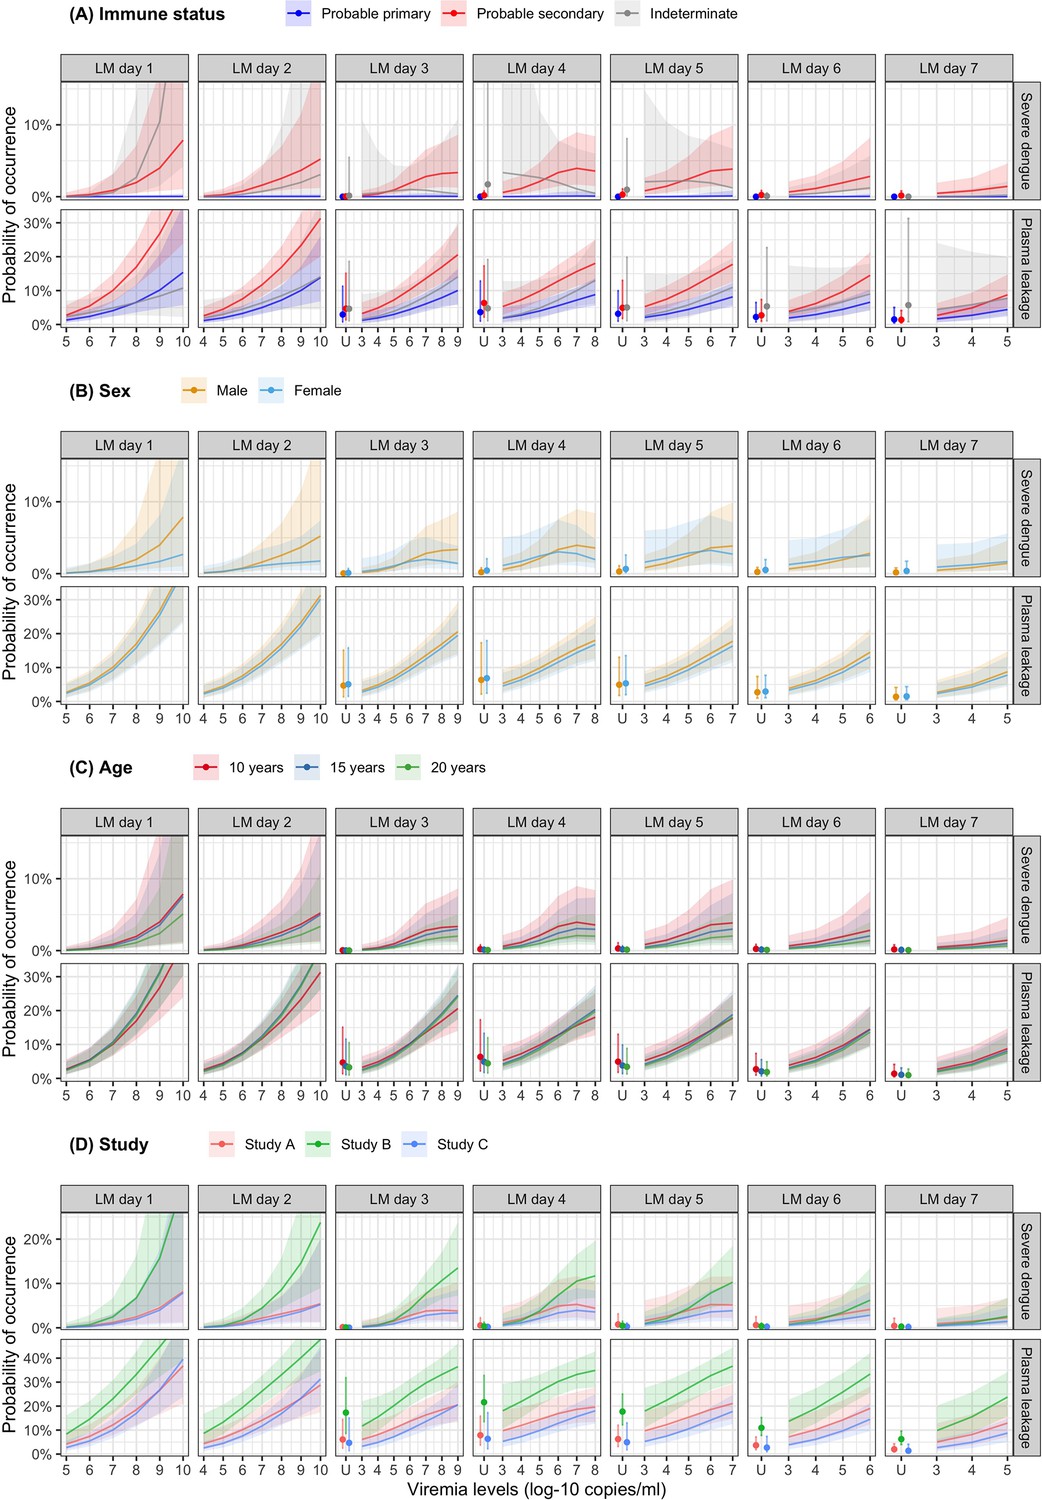
Probability of occurrence of the two clinical endpoints according to viremia levels by subgroups of the covariates (A) immune status, (B) sex, (C) age, and (D) study – results from the supermodel.
The colored lines or dots represent the probability of the endpoints. The colored shaded regions and whiskers indicate the corresponding 95% confidence intervals. Each column represents the effect of viremia on a specific day. Note that the probability of severe dengue in the probable primary group is almost 0% because there was only one case with severe dengue in this group. The probabilities are shown for age of 10 years, male sex, serotype DENV-1, probable secondary infection, and from study C. LM, landmark; U, under the limit of detection.
Appendix 7—figure 3
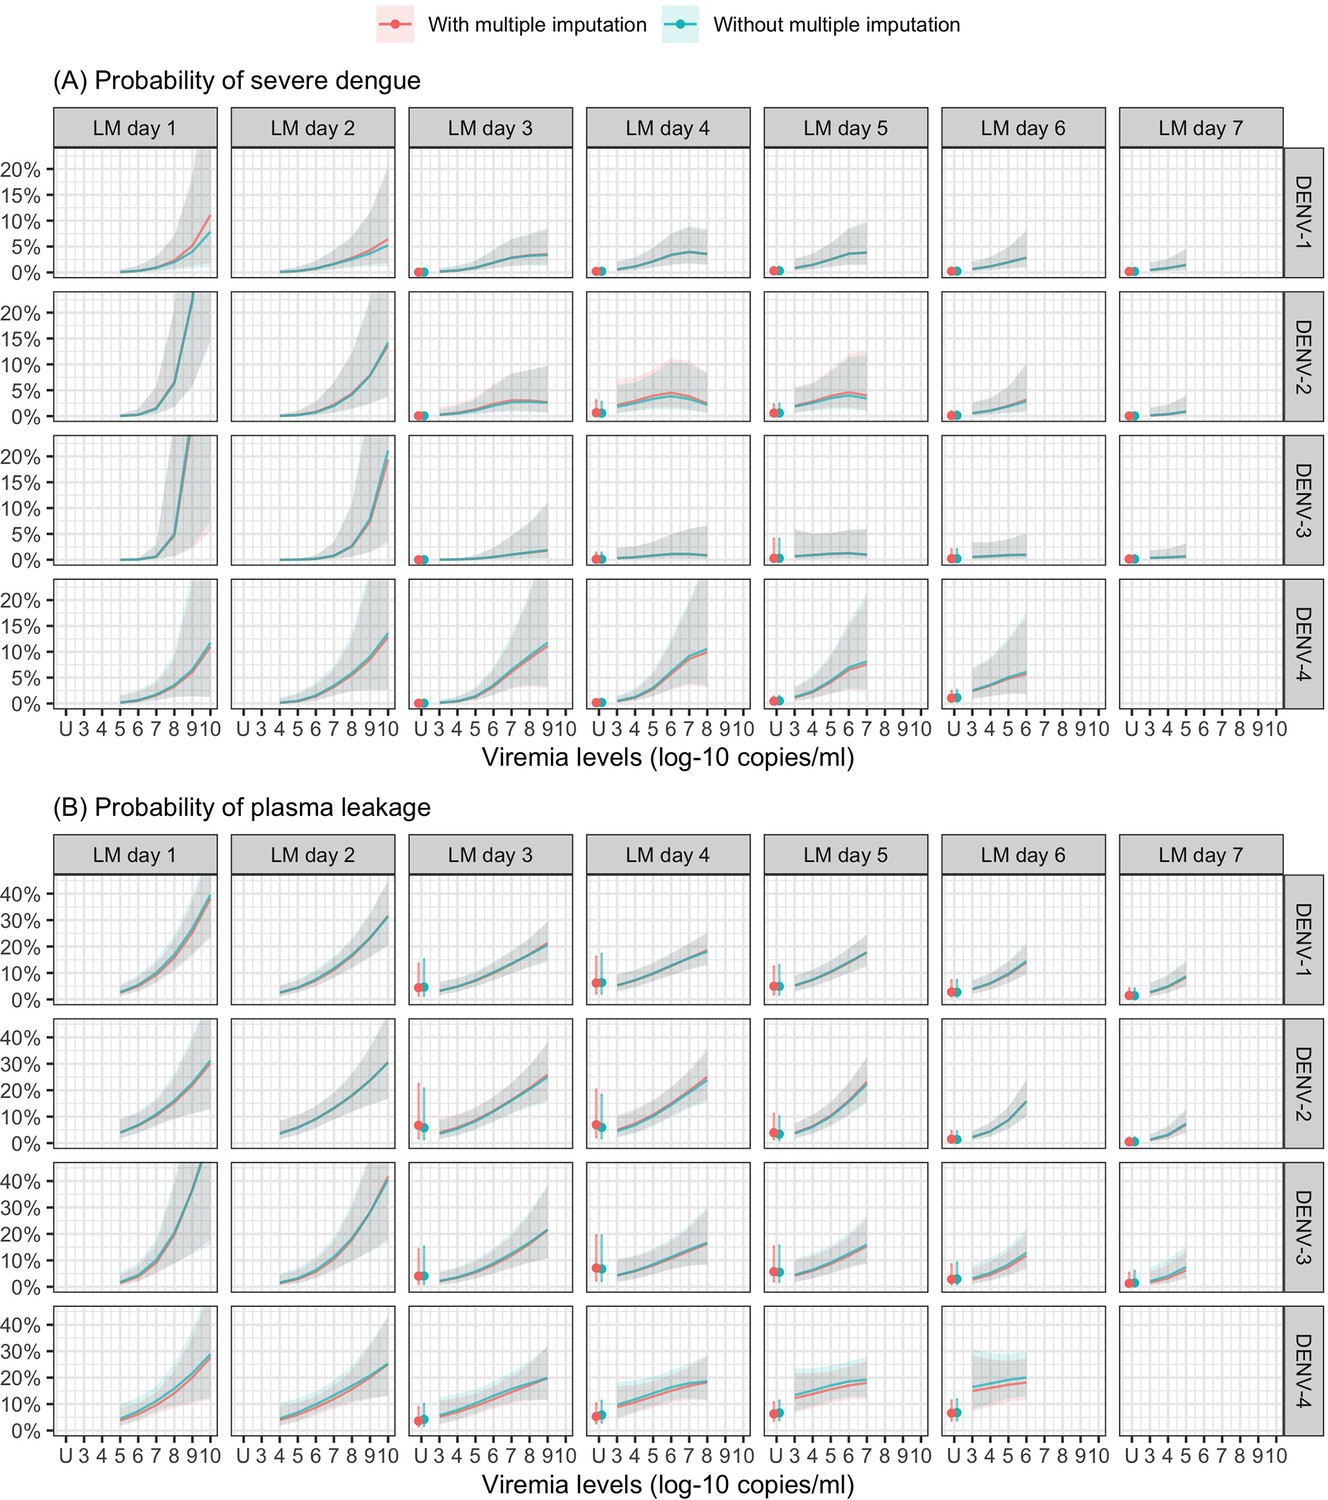
Probability of occurrence of (A) severe dengue and (B) plasma leakage according to viremia levels – compare results from the supermodels with and without multiple imputation.
The colored lines or dots represent the probability of the endpoints. The colored shaded regions and whiskers indicate the corresponding 95% confidence intervals. Each column represents the effect of viremia on a specific day. No fitted trends are made for DENV-4 in LM day 7 since viremia was undetectable in almost all DENV-4 cases from day 7 onwards. The probabilities are shown for age of 10 years, male sex, probable secondary infection, and from study C. DENV, dengue virus; LM, landmark; PCR, polymerase chain reaction; U, under the limit of detection.
Appendix 7—figure 4
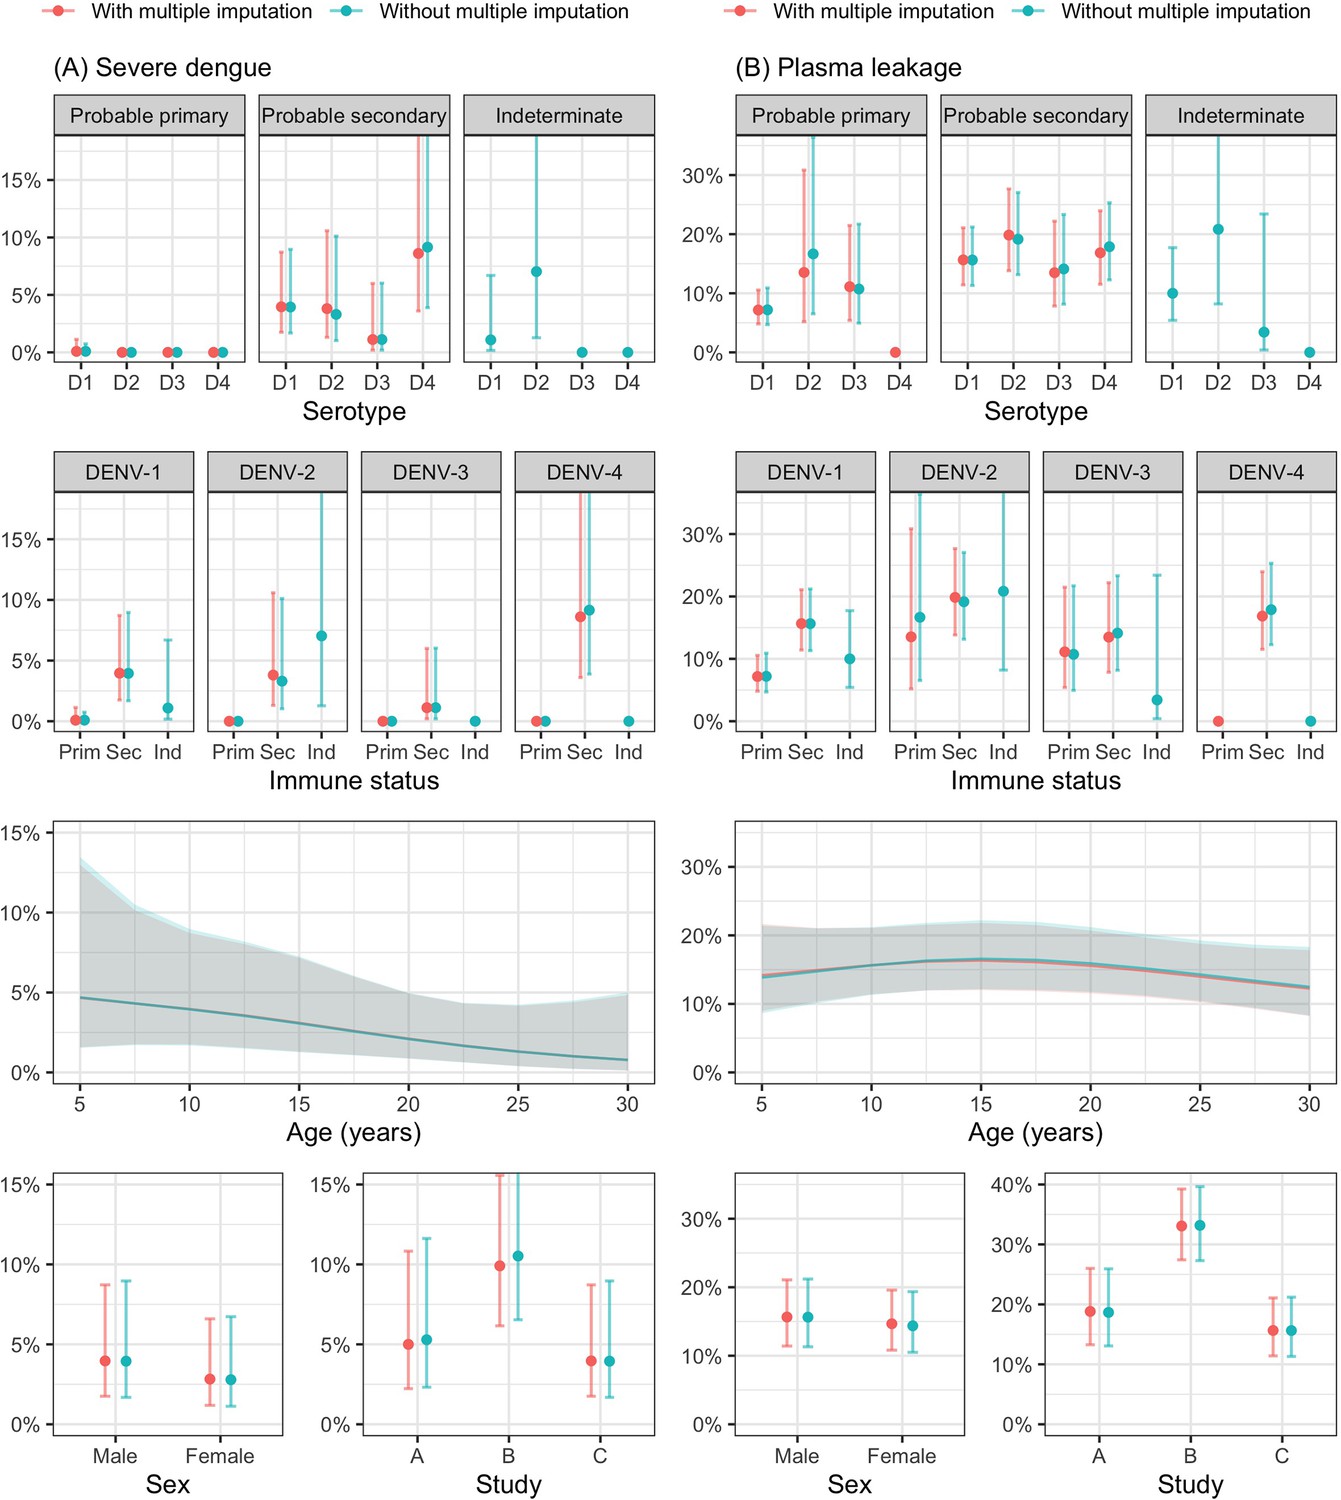
Probability of occurrence of (A) severe dengue and (B) plasma leakage according to the covariates – results from the supermodel.
The lines and dots represent the probability of the endpoints. The shaded regions and whiskers indicate the corresponding 95% confidence intervals. Note that the probability of severe dengue in the probable primary group is almost 0% because there was only one case with severe dengue in this group. The probabilities are shown for age of 10 years, male sex, serotype DENV-1, probable secondary infection, viremia level of 7 log-10 copies/ml, landmark illness day 4, and from study C. D1, D2, D3, and D4 are DENV-1, DENV-2, DENV-3, and DENV-4, respectively; Prim, probable primary infection; Sec, probable secondary infection; Ind., indeterminate immune status.
Author response image 1
Tables
Table 1
Baseline characteristics and clinical outcomes.
| N* | All patients (N = 2340) | Study A (N = 363) | Study B (N = 622) | Study C (N = 1355) | |
|---|---|---|---|---|---|
| Age, years | 2340 | 13 (10; 18) | 12 (9; 14) | 12 (10; 13) | 16 (10; 25) |
| Sex male | 2340 | 1403 (60) | 195 (54) | 412 (66) | 796 (59) |
| Illness day at enrolment | 2340 | ||||
| 1 | 310 (13) | 59 (16) | 7 (1) | 244 (18) | |
| 2 | 848 (36) | 150 (41) | 155 (25) | 543 (40) | |
| 3 | 1137 (49) | 114 (31) | 455 (73) | 568 (42) | |
| 4 | 45 (2) | 40 (11) | 5 (1) | 0 (0) | |
| Serotype | 2340 | ||||
| DENV-1 | 1264 (54) | 233 (64) | 410 (66) | 621 (46) | |
| DENV-2 | 373 (16) | 48 (13) | 130 (21) | 195 (14) | |
| DENV-3 | 252 (11) | 80 (22) | 82 (13) | 90 (7) | |
| DENV-4 | 451 (19) | 2 (1) | 0 (0) | 449 (33) | |
| Immune status | 2340 | ||||
| Probable primary | 474 (20) | 134 (37) | 124 (20) | 216 (16) | |
| Probable secondary | 1619 (69) | 219 (60) | 464 (75) | 936 (69) | |
| Indeterminate | 247 (11) | 10 (3) | 34 (5) | 203 (15) | |
| Plasma leakage | 2288 | 353 (15) | 43 (13) | 177 (29) | 133 (10) |
| Missing | 52 | 39 | 13 | 0 | |
| Illness day of plasma leakage | 327 | ||||
| 3 | 2 (1) | 0 (0) | 0 (0) | 2 (2) | |
| 4 | 71 (22) | 12 (30) | 35 (23) | 24 (18) | |
| 5 | 107 (33) | 12 (30) | 50 (32) | 45 (34) | |
| 6 | 105 (32) | 12 (30) | 49 (32) | 44 (33) | |
| 7 | 42 (13) | 4 (10) | 20 (13) | 18 (14) | |
| Missing | 26 | 3 | 23 | 0 | |
| Severe dengue | 2340 | 65 (3) | 6 (2) | 40 (6) | 19 (1) |
| Illness day of severe dengue | 65 | ||||
| 3 | 2 (3) | 0 (0) | 2 (5) | 0 (0) | |
| 4 | 13 (20) | 0 (0) | 12 (30) | 1 (5) | |
| 5 | 24 (37) | 2 (33) | 16 (40) | 6 (32) | |
| 6 | 20 (31) | 4 (67) | 7 (18) | 9 (47) | |
| 7 | 6 (9) | 0 (0) | 3 (8) | 3 (16) |
-
Summary statistics are number of patients (%) or median (25th; 75th percentiles).
-
DENV: dengue virus.
-
*
N represents the number of patients with available data (i.e., without missing data).
Appendix 3—table 1
Comparison of the models in Analysis #2a.
| Model | Degrees of freedom | Log-likelihood | AIC | BIC |
|---|---|---|---|---|
| Viremia on the same day | 55 | −502.0 | 1114.1 | 1384.3 |
| Viremia 1 day earlier | 55 | −488.2 | 1086.3 | 1356.6 |
| Viremia 2 days earlier | 55 | −479.0 | 1068.0 | 1338.3 |
| Viremia 3 days earlier | 55 | −452.4 | 1014.9 | 1285.1 |
| Viremia 4 days earlier | 55 | −469.6 | 1049.3 | 1319.5 |
| Viremia 5 days earlier* | 54 | −478.4 | 1064.8 | 1330.1 |
-
*
The model for viremia 5 days earlier had fewer degrees of freedom due to the absence of a binary variable indicating detectable or undetectable viremia values (as all patients had detectable viremia values 5 days earlier).
Appendix 3—table 2
Comparison of the models in Analysis #2b.
| Model | Day 2 | Day 3 | Day 4 | Day 5 | Day 6 | Day 7 | Day 8 |
|---|---|---|---|---|---|---|---|
| Same day | 2.0 (24) | –58.7 (145) | –95.9 (220) | –99.7 (227) | –84.9 (198) | –252.6 (533) | –210.5 (449) |
| 1 day earlier | 0.9 (24) | –53.1 (134) | –95.2 (218) | –98.0 (224) | –80.1 (188) | –243.4 (515) | –208.7 (443) |
| 2 days earlier | –56.0 (138) | –88.8 (206) | –94.0 (216) | –80.9 (190) | –232.8 (494) | –205.2 (438) | |
| 3 days earlier | –91.8 (210) | –89.8 (208) | –76.2 (180) | –229.3 (487) | –189.6 (407) | ||
| 4 days earlier | –92.9 (212) | –78.7 (185) | –241.3 (511) | –189.6 (407) | |||
| 5 days earlier | –83.0 (192) | –245.4 (517) | –196.5 (419) |
-
Statistics are log-likelihood (AIC). The highest log-likelihood values (along with the lowest AIC) per column are highlighted in bold. Note that all analyses per each column use the same sample size.
Appendix 4—table 1
Distribution of clinical outcomes by serotype and immune status.
| Severe dengue* | Plasma leakage* | ||||||
|---|---|---|---|---|---|---|---|
| N†† | No(n = 2275) | Yes(n = 65) | No(n = 1935) | Yes(n = 353) | Indeterminate(n = 52) | ||
| DENV-1 | 1264 | 1224 (96.8) | 40 (3.2) | 1028 (81.3) | 200 (15.8) | 36 (2.8) | |
| Probable primary | 356 (28.2) | 355 (99.7) | 1 (0.3) | 307 (86.2) | 35 (9.8) | 14 (3.9) | |
| Probable secondary | 774 (61.2) | 737 (95.2) | 37 (4.8) | 603 (77.9) | 151 (19.5) | 20 (2.6) | |
| Indeterminate | 134 (10.6) | 132 (98.5) | 2 (1.5) | 118 (88.1) | 14 (10.4) | 2 (1.5) | |
| DENV-2 | 373 | 358 (96.0) | 15 (4.0) | 292 (78.3) | 75 (20.1) | 6 (1.6) | |
| Probable primary | 37 (9.9) | 37 (100.0) | 0 (0.0) | 29 (78.4) | 7 (18.9) | 1 (2.7) | |
| Probable secondary | 299 (80.2) | 286 (95.7) | 13 (4.3) | 232 (77.6) | 63 (21.1) | 4 (1.3) | |
| Indeterminate | 37 (9.9) | 35 (94.6) | 2 (5.4) | 31 (83.8) | 5 (13.5) | 1 (2.7) | |
| DENV-3 | 252 | 250 (99.2) | 2 (0.8) | 208 (82.5) | 34 (13.5) | 10 (4.0) | |
| Probable primary | 68 (27.0) | 68 (100.0) | 0 (0.0) | 58 (85.3) | 8 (11.8) | 2 (2.9) | |
| Probable secondary | 165 (65.5) | 163 (98.8) | 2 (1.2) | 132 (80.0) | 25 (15.2) | 8 (4.8) | |
| Indeterminate | 19 (7.5) | 19 (100.0) | 0 (0.0) | 18 (94.7) | 1 (5.3) | 0 (0.0) | |
| DENV-4 | 451 | 443 (98.2) | 8 (1.8) | 407 (90.2) | 44 (9.8) | 0 (0.0) | |
| Probable primary | 13 (2.9) | 13 (100.0) | 0 (0.0) | 13 (100.0) | 0 (0.0) | 0 (0.0) | |
| Probable secondary | 381 (84.5) | 373 (97.9) | 8 (2.1) | 337 (88.5) | 44 (11.5) | 0 (0.0) | |
| Indeterminate | 57 (12.6) | 57 (100.0) | 0 (0.0) | 57 (100.0) | 0 (0.0) | 0 (0.0) | |
-
Summary statistics are n (%).
-
DENV: dengue virus.
-
*
The percentages are computed by the total sample size per row.
-
†
The percentages of immune status are computed by the total sample size within each DENV serotype.
Appendix 5—table 1
p values of parameters in the models of viremia.
| Parameter | p value |
|---|---|
| Age (overall effect) | <0.0001 |
| - All interactions of Age | 0.0015 |
| - Nonlinear effect of Age | <0.0001 |
| Sex (overall effect) | 0.0008 |
| - All interactions of Sex | 0.0011 |
| Serotype (overall effect) | <0.0001 |
| - All interactions of Serotype | <0.0001 |
| Immune status (overall effect) | <0.0001 |
| - All interactions of Immune status | <0.0001 |
| PCR method (overall effect) | <0.0001 |
| - All interactions of PCR method | <0.0001 |
| Day (overall effect) | <0.0001 |
| - All interactions of Day | <0.0001 |
| - Nonlinear effect of Day | <0.0001 |
| Serotype * Immune status | 0.0066 |
| Age * Day | 0.0015 |
| Sex * Day | 0.0011 |
| Serotype * Day | <0.0001 |
| Immune status * Day | <0.0001 |
| PCR * Day | <0.0001 |
-
p values are calculated using the Wald test from the R package ‘aod’. This test computes the Wald chi-squared test for 1 or more coefficients given their variance–covariance matrix from the model.
-
A * B is the interaction between A and B.
-
PCR: polymerase chain reaction.
Appendix 6—table 1
p values of parameters in the supermodel for platelet count.
| Parameter | p value | Parameter | p value |
|---|---|---|---|
| Age (overall effect) | <0.0001 | Age * Day | <0.0001 |
| - All interactions of Age | <0.0001 | Sex * Day | <0.0001 |
| - Nonlinear effect of Age | <0.0001 | Serotype * Day | <0.0001 |
| Sex (overall effect) | <0.0001 | Immune status * Day | <0.0001 |
| - All interactions of Sex | <0.0001 | PCR * Day | <0.0001 |
| Serotype (overall effect) | <0.0001 | Landmark * Day | <0.0001 |
| - All interactions of Serotype | <0.0001 | Viremia * Day | <0.0001 |
| Immune status (overall effect) | <0.0001 | Viremia * Serotype | <0.0001 |
| - All interactions of Immune status | <0.0001 | Viremia * Immune status | 0.0017 |
| PCR method (overall effect) | <0.0001 | Viremia * PCR | <0.0001 |
| - All interactions of PCR method | <0.0001 | Viremia * Landmark | <0.0001 |
| Day (overall effect) | <0.0001 | Serotype * Landmark | 0.0403 |
| - All interactions of Day | <0.0001 | PCR * Landmark | <0.0001 |
| - Nonlinear effect of Day | <0.0001 | Serotype * PCR | <0.0001 |
| Landmark (overall effect) | <0.0001 | Serotype * Immune status | <0.0001 |
| - All interactions of Landmark | <0.0001 | Viremia * Serotype * PCR | 0.2465 |
| - Nonlinear effect of Landmark | <0.0001 | Viremia * Serotype * Day | <0.0001 |
| Viremia (overall effect) | <0.0001 | Viremia * PCR * Day | <0.0001 |
| - All interactions of Viremia | <0.0001 | Viremia * Serotype * Landmark | 0.2601 |
| - Nonlinear effect of Viremia | <0.0001 | Viremia * PCR * Landmark | 0.0846 |
| - Undetectable Viremia | 0.1632 | Viremia * Serotype * Immune status | 0.0589 |
| Serotype * PCR * Day | <0.0001 | ||
| Serotype * PCR * Landmark | 0.1347 | ||
| Viremia * Serotype * PCR * Day | 0.4683 | ||
| Viremia * Serotype * PCR * Landmark | 0.3646 |
-
p values are calculated using the Wald test from the R package ‘aod’. This test computes the Wald chi-squared test for 1 or more coefficients given their variance–covariance matrix from the model. Note that the overall effect of viremia includes the binary variable describing detectable or undetectable viremia, and the term ‘Viremia’ in all interactions also consists of that binary variable.
-
A * B is the interaction between A and B.
-
PCR: polymerase chain reaction.
Appendix 7—table 1
Estimates from models of viremia and clinical outcomes.
| Severe dengue | Plasma leakage | |||
|---|---|---|---|---|
| OR (95% CI) | p | OR (95% CI) | p | |
| Viremia level (log-10 copies/ml)* | <0.001 | <0.001 | ||
| - 7 vs 6 (on day 1) | 2.98 (1.46; 6.10) | 1.94 (1.50; 2.51) | ||
| - 8 vs 7 (on day 1) | 2.27 (1.20; 4.31) | 1.83 (1.44; 2.32) | ||
| - 7 vs 6 (on day 2) | 2.10 (1.32; 3.36) | 1.62 (1.36; 1.94) | ||
| - 8 vs 7 (on day 2) | 1.60 (1.05; 2.44) | 1.53 (1.29; 1.82) | ||
| - 7 vs 6 (on day 3) | 1.51 (1.13; 2.00) | 1.38 (1.20; 1.57) | ||
| - 8 vs 7 (on day 3) | 1.15 (0.84; 1.57) | 1.30 (1.11; 1.52) | ||
| - 7 vs 6 (on day 4) | 1.18 (0.91; 1.54) | 1.26 (1.10; 1.45) | ||
| - 8 vs 7 (on day 4) | 0.90 (0.61; 1.32) | 1.19 (0.98; 1.44) | ||
| - 7 vs 6 (on day 5) | 1.08 (0.75; 1.54) | 1.31 (1.10; 1.57) | ||
| - 8 vs 7 (on day 5) | 0.82 (0.49; 1.37) | 1.24 (0.96; 1.59) | ||
| Undetectable viremia (Yes vs 3 log-10 copies/ml) | 0.48 (0.20; 1.16) | 0.102 | 1.84 (0.51; 6.65) | 0.247 |
| Age (years)* | 0.182 | 0.105 | ||
| - 15 vs 10 | 0.77 (0.50; 1.18) | 1.07 (0.88; 1.31) | ||
| - 20 vs 15 | 0.67 (0.44; 1.04) | 0.95 (0.85; 1.06) | ||
| Sex (Male vs Female) | 1.43 (0.79; 2.61) | 0.011 | 1.10 (0.84; 1.45) | 0.711 |
| Serotype | <0.001 | <0.001 | ||
| - DENV-1 | Ref | Ref | ||
| - DENV-2 | 0.95 (0.44; 2.07) | 1.22 (0.84; 1.77) | ||
| - DENV-3 | 0.35 (0.08; 1.51) | 0.92 (0.54; 1.56) | ||
| - DENV-4 | 2.41 (0.83; 6.98) | 1.19 (0.76; 1.86) | ||
| Immune status | <0.001 | <0.001 | ||
| - Probable primary | 0.02 (0.00; 0.15) | 0.41 (0.27; 0.63) | ||
| - Probable secondary | Ref | Ref | ||
| - Indeterminate | 0.32 (0.04; 2.32) | 0.57 (0.30; 1.11) | ||
| Study | 0.010 | <0.001 | ||
| - Study C | Ref | Ref | ||
| - Study A | 1.36 (0.43; 4.28) | 1.24 (0.80; 1.93) | ||
| - Study B | 2.86 (1.21; 6.80) | 2.68 (1.92; 3.75) | ||
| Landmark (illness day)* | <0.001 | <0.001 | ||
| - 5 vs 3 | 1.38 (0.74; 2.57) | 1.37 (1.06; 1.78) | ||
| - 7 vs 5 | 0.58 (0.17; 2.05) | 1.34 (0.77; 2.35) | ||
| Interaction of viremia† | ||||
| - With age | 0.237 | 0.044 | ||
| - With sex | 0.004 | 0.590 | ||
| - With landmark (illness day) | <0.001 | <0.001 | ||
| - With study | 0.030 | 0.261 | ||
| - With serotype | <0.001 | <0.001 | ||
| - With immune status | <0.001 | 0.001 | ||
| - With serotype * immune status | <0.001 | 0.012 | ||
| - With serotype * landmark | <0.001 | <0.001 | ||
| - With immune status * landmark | <0.001 | 0.014 | ||
| - With serotype * immune status * landmark | <0.001 | 0.005 | ||
| Interaction of serotype and immune status | <0.001 | <0.001 | ||
| Nonlinear trend | ||||
| - Viremia level | 0.031 | 0.272 | ||
| - Age | 0.349 | 0.017 | ||
| - Landmark (illness day) | <0.001 | <0.001 | ||
-
* The model incorporates nonlinear effects of log-10 viremia level, age, and illness day on the endpoints. To facilitate the interpretation of the results, ORs and their corresponding 95% CIs are provided for two selected contrasts of viremia level, age, and landmark illness day.
-
† In the model for plasma leakage, the interactions of viremia include the binary variable describing detectable or undetectable viremia.
-
Given the complexity of the models involving multiple interactions, ORs and 95% CIs are estimated for specific values of the interacting variables: log-10 viremia of 7, age of 10years, male sex, landmark illness day of 3, serotype DENV-1, and probable secondary infection. CI, confidence interval; DENV, dengue virus; OR, odds ratio; Ref, reference.
Appendix 7—table 2
Estimates from models of the rate of decline in viremia and clinical outcomes.
| Severe dengue | Plasma leakage | |||
|---|---|---|---|---|
| OR (95% CI) | p | OR (95% CI) | p | |
| Rate of decline in viremia (per 0.5 log-10 copies/ml increase) | 0.14 (0.06; 0.33) | <0.001 | <0.001 | |
| - DENV-1 – probable primary | 0.23 (0.09; 0.56) | |||
| - DENV-1 – probable secondary | 0.12 (0.05; 0.28) | |||
| - DENV-2 – probable primary | 0.30 (0.11; 0.80) | |||
| - DENV-2 – probable secondary | 0.16 (0.06; 0.38) | |||
| - DENV-3 – probable primary | 0.18 (0.06; 0.54) | |||
| - DENV-3 – probable secondary | 0.09 (0.03; 0.27) | |||
| - DENV-4 – probable primary | 0.78 (0.24; 2.50) | |||
| - DENV-4 – probable secondary | 0.40 (0.16; 1.04) | |||
| Serotype | 0.001 | 0.006 | ||
| - DENV-1 | Ref | Ref | ||
| - DENV-2 | 0.74 (0.39; 1.39) | 1.04 (0.75; 1.45) | ||
| - DENV-3 | 0.21 (0.05; 0.88) | 0.81 (0.54; 1.22) | ||
| - DENV-4 | 8.59 (2.38; 31.03) | 4.84 (2.07; 11.32) | ||
| Immune status | <0.001 | <0.001 | ||
| - Probable primary | Ref | Ref | ||
| - Probable secondary | 63.23 (8.15; 490.31) | 2.77 (1.78; 4.33) | ||
| - Indeterminate | 16.29 (1.77; 150.25) | 1.39 (0.68; 2.82) | ||
| PCR method | <0.001 | <0.001 | ||
| - One-step | Ref | Ref | ||
| - Two-step | 33.32 (10.92; 101.66) | 14.62 (6.98; 30.60) | ||
| Interaction of rate of decline in viremia | ||||
| - With serotype | 0.182 | |||
| - With immune status | 0.017 | |||
| - With PCR | 0.006 | |||
-
The model for severe dengue does not include any interaction term.
-
In the model of plasma leakage, interactions between the rate of decline in viremia and serotype, immune status, and PCR are included. ORs and 95% CIs of the rate of decline in viremia are estimated for the one-step PCR in each subgroup of serotype and probable primary/secondary infection. ORs and 95% CIs of serotype, immune status, and PCR are estimated for the rate of decline in viremia of 1.4 log-10 copies/ml.
-
CI, confidence interval; DENV, dengue virus; OR, odds ratio; PCR, polymerase chain reaction; Ref, reference.
Additional files
Download links
A two-part list of links to download the article, or parts of the article, in various formats.
Downloads (link to download the article as PDF)
Open citations (links to open the citations from this article in various online reference manager services)
Cite this article (links to download the citations from this article in formats compatible with various reference manager tools)
Dengue viremia kinetics and effects on platelet count and clinical outcomes: An analysis of 2340 patients from Vietnam
eLife 13:RP92606.
https://doi.org/10.7554/eLife.92606.3


