Akkermansia muciniphila identified as key strain to alleviate gut barrier injury through Wnt signaling pathway
- Key Laboratory of Animal Nutrition and Feed Science in East China, Ministry of Agriculture, College of Animal Sciences, Zhejiang University, China
- Hainan Institute of Zhejiang University, Yongyou Industry Park, Yazhou Bay Sci-Tech City, China
Figures
Figure 1
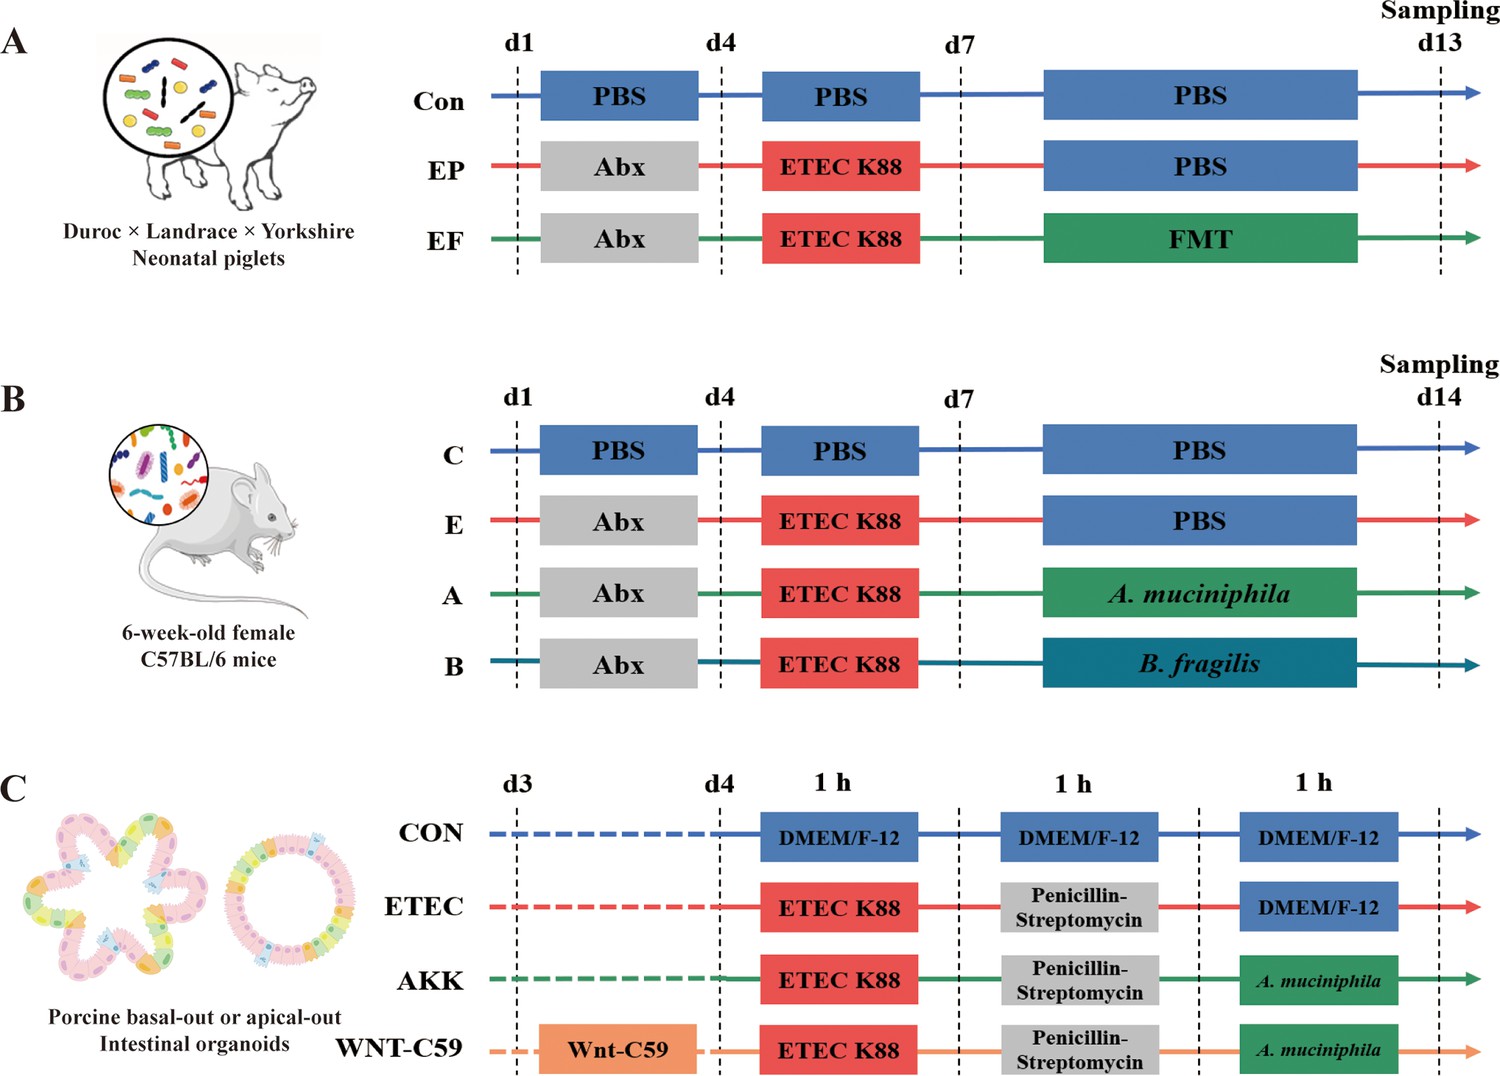
Experimental designs of the present study.
(A) Schematic diagram of the fecal microbiota transplantation (FMT) administered to the antibiotic-induced microbiome-disordered (AIMD) piglets infected with Enterotoxigenic Escherichia coli (ETEC) K88. (B) Schematic diagram of the alleviatory effects of A. muciniphila and B. fragilis on ETEC K88 infection in mice. (C) Schematic diagram of the alleviatory effects of A. muciniphila on ETEC K88 infection in porcine basal-out and apical-out intestinal organoids.
Figure 2
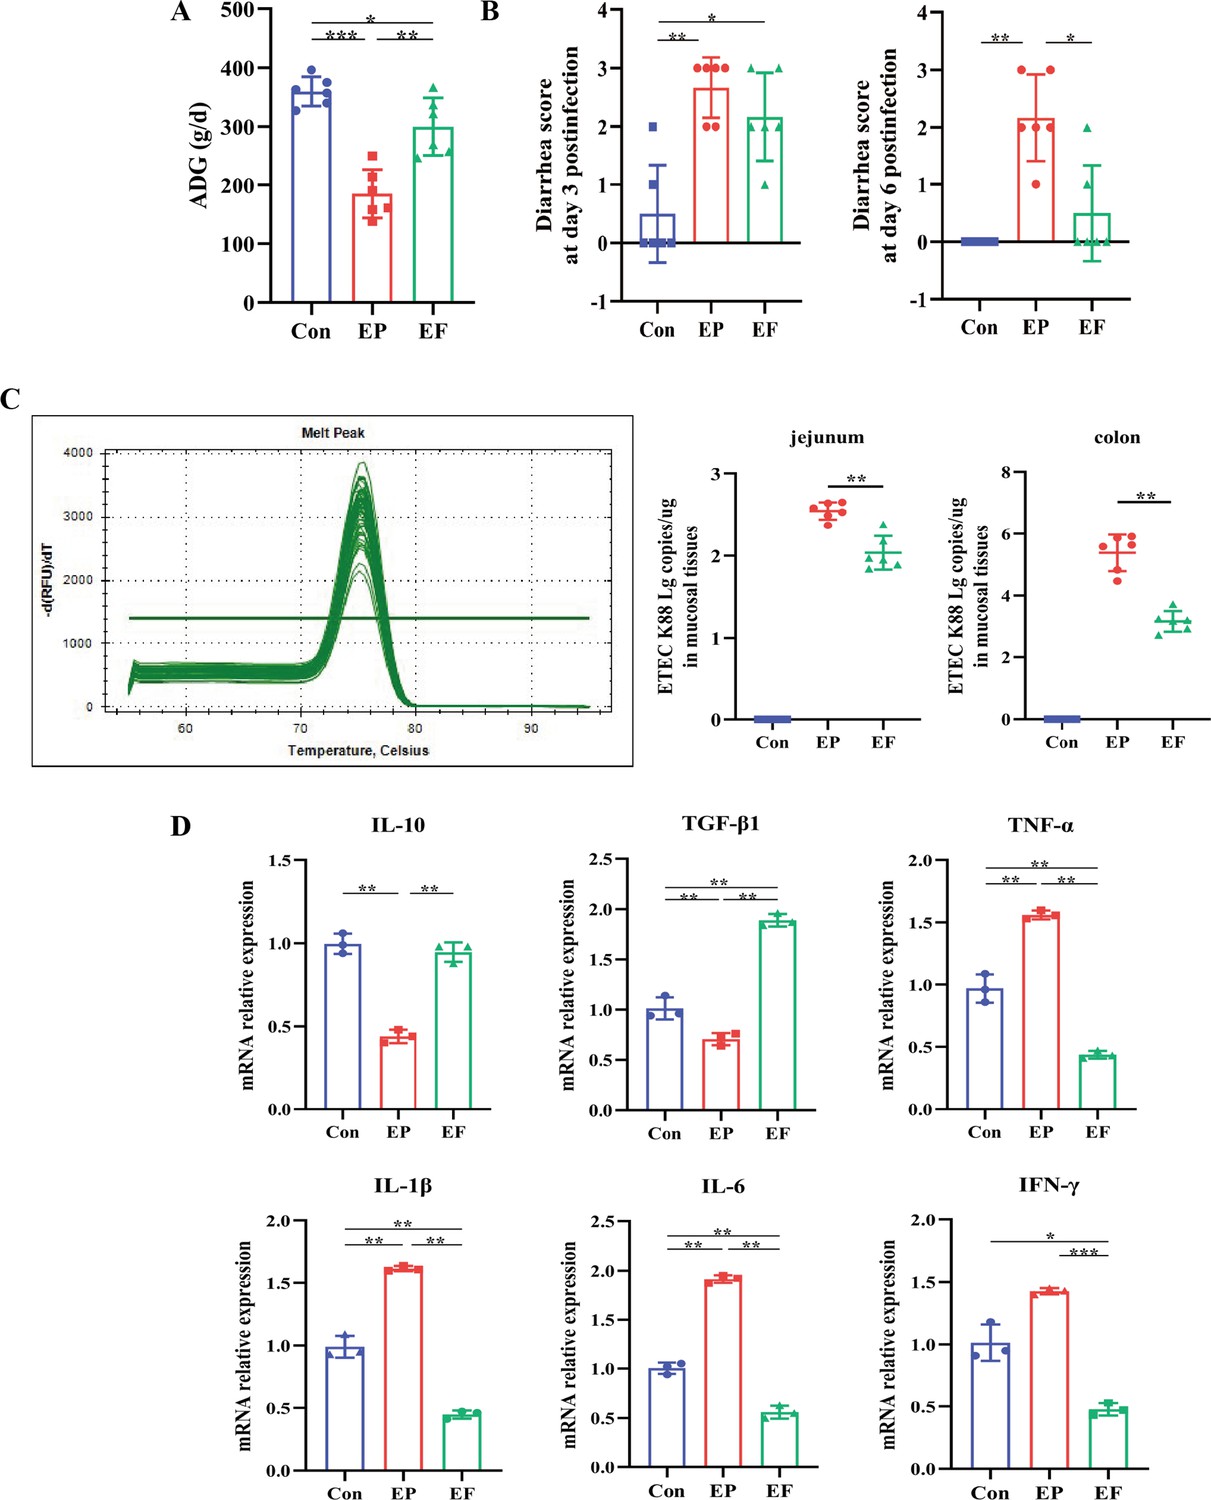
Fecal microbiota transplantation (FMT) improved the growth performance and inflammatory response of AIMD piglets infected with Enterotoxigenic Escherichia coli (ETEC) K88.
(A) Average daily weight gain (ADG) in the Con, EP, and EF groups. (B) Diarrhea score at days 3 and 6 post-infection. (C) The colonization of ETEC K88 in the jejunum and colon. The melting curve demonstrated that only the ETEC K88 could be amplified by the primers we used. (D) The relative mRNA expression of cytokines in the jejunum. Con: control group, EP: ETEC K88 +PBS group, EF: ETEC K88 +FMT group. Data are expressed as the mean ± SD. *p<0.05, **p<0.01, ***p<0.001.
Figure 3
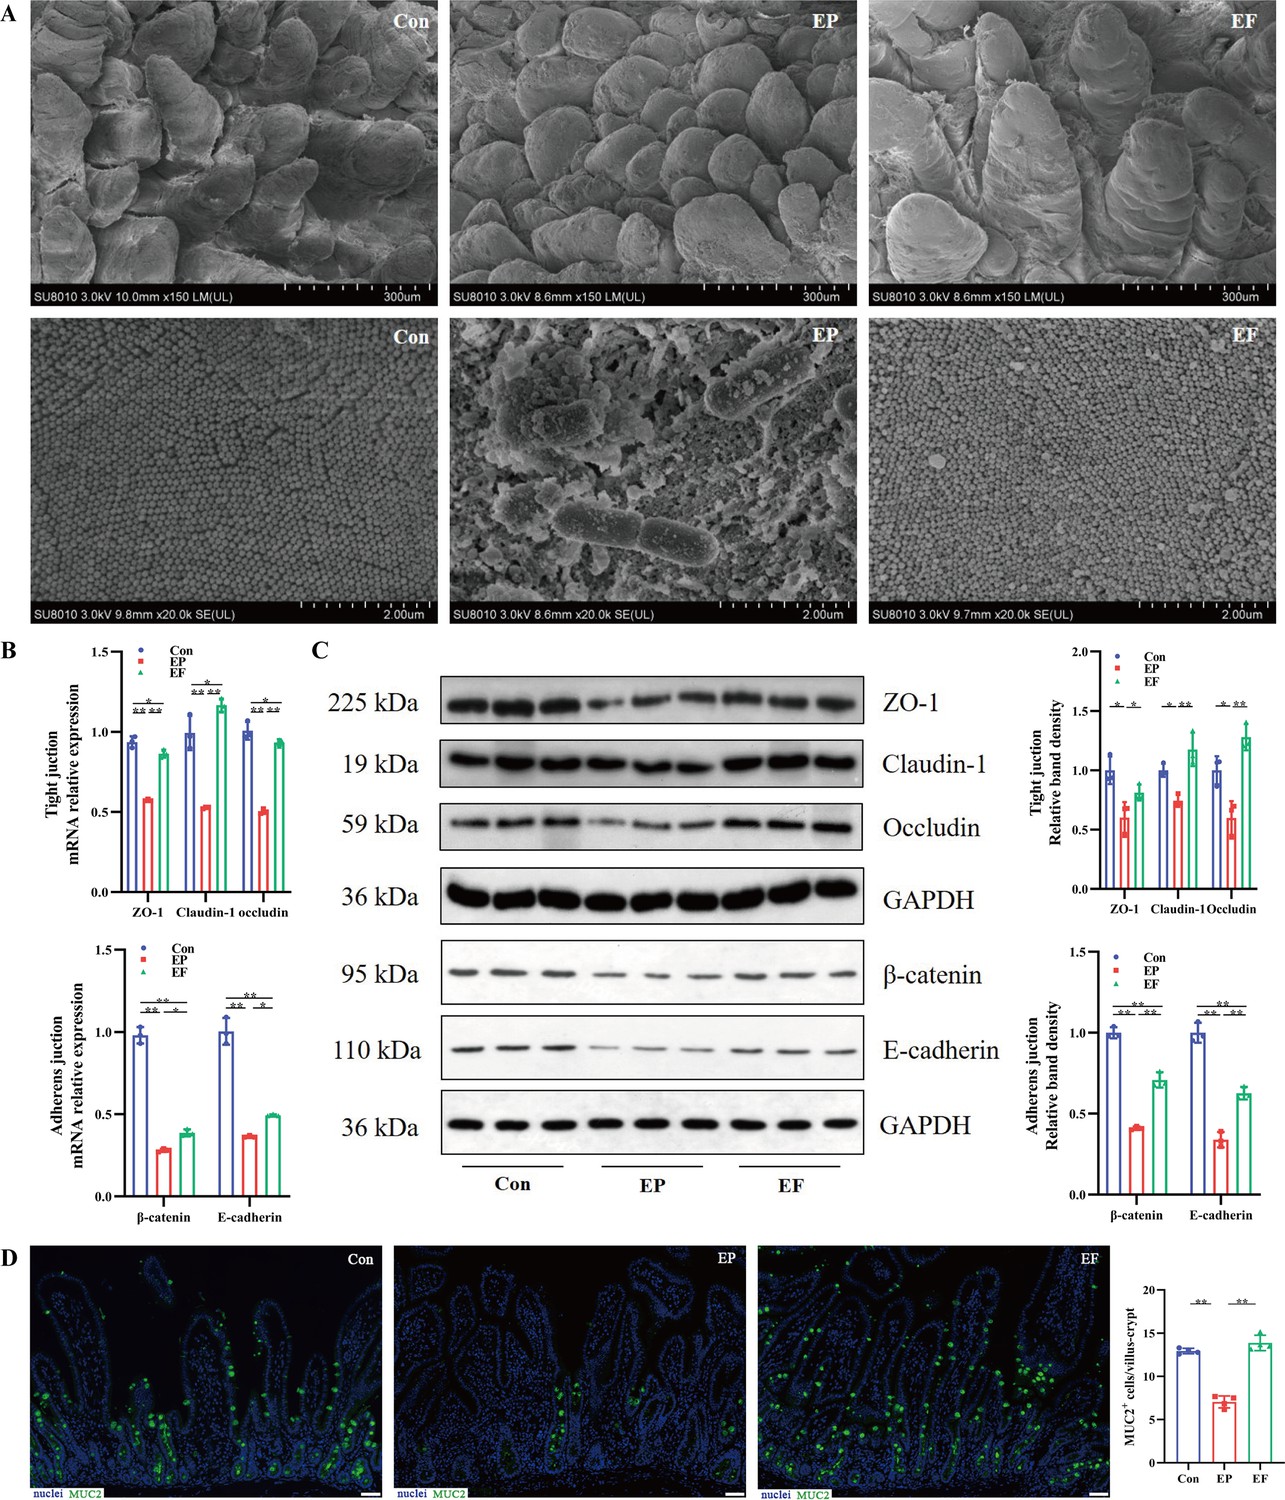
Fecal microbiota transplantation (FMT) improved the intestinal morphology and barrier function in antibiotic-induced microbiome-disordered (AIMD) piglets infected with Enterotoxigenic Escherichia coli (ETEC) K88.
(A) Scanning electron microscopy (SEM) images of villi (top) and microvilli (bottom) in the jejunum (scale bars = 300 or 2 μm). (B) The relative mRNA expression of tight junction proteins (ZO-1, claudin, and occludin) and adheren junctions (β-catenin and E-cadherin) in the jejunum. (C) The relative protein expression of tight junction proteins (ZO-1, claudi, and occludin) and adheren junction proteins (β-catenin and E-cadherin) in the jejunum. (D) Immunofluorescence images of Mucin 2 (MUC2, green) in the jejunum (scale bars = 50 μm). Con: control group, EP: ETEC K88 +PBS group, EF: ETEC K88 +FMT group. Data are expressed as the mean ± SD. *p<0.05, **p<0.01. Data shown are representative of at least two independent experiments.
-
Figure 3—source data 1
The image files of scanning electron microscope.
- https://cdn.elifesciences.org/articles/92906/elife-92906-fig3-data1-v1.zip
-
Figure 3—source data 2
The image files of Western blot.
- https://cdn.elifesciences.org/articles/92906/elife-92906-fig3-data2-v1.zip
-
Figure 3—source data 3
The image files of immunofluorescence (MUC2).
- https://cdn.elifesciences.org/articles/92906/elife-92906-fig3-data3-v1.zip
Figure 4 with 1 supplement
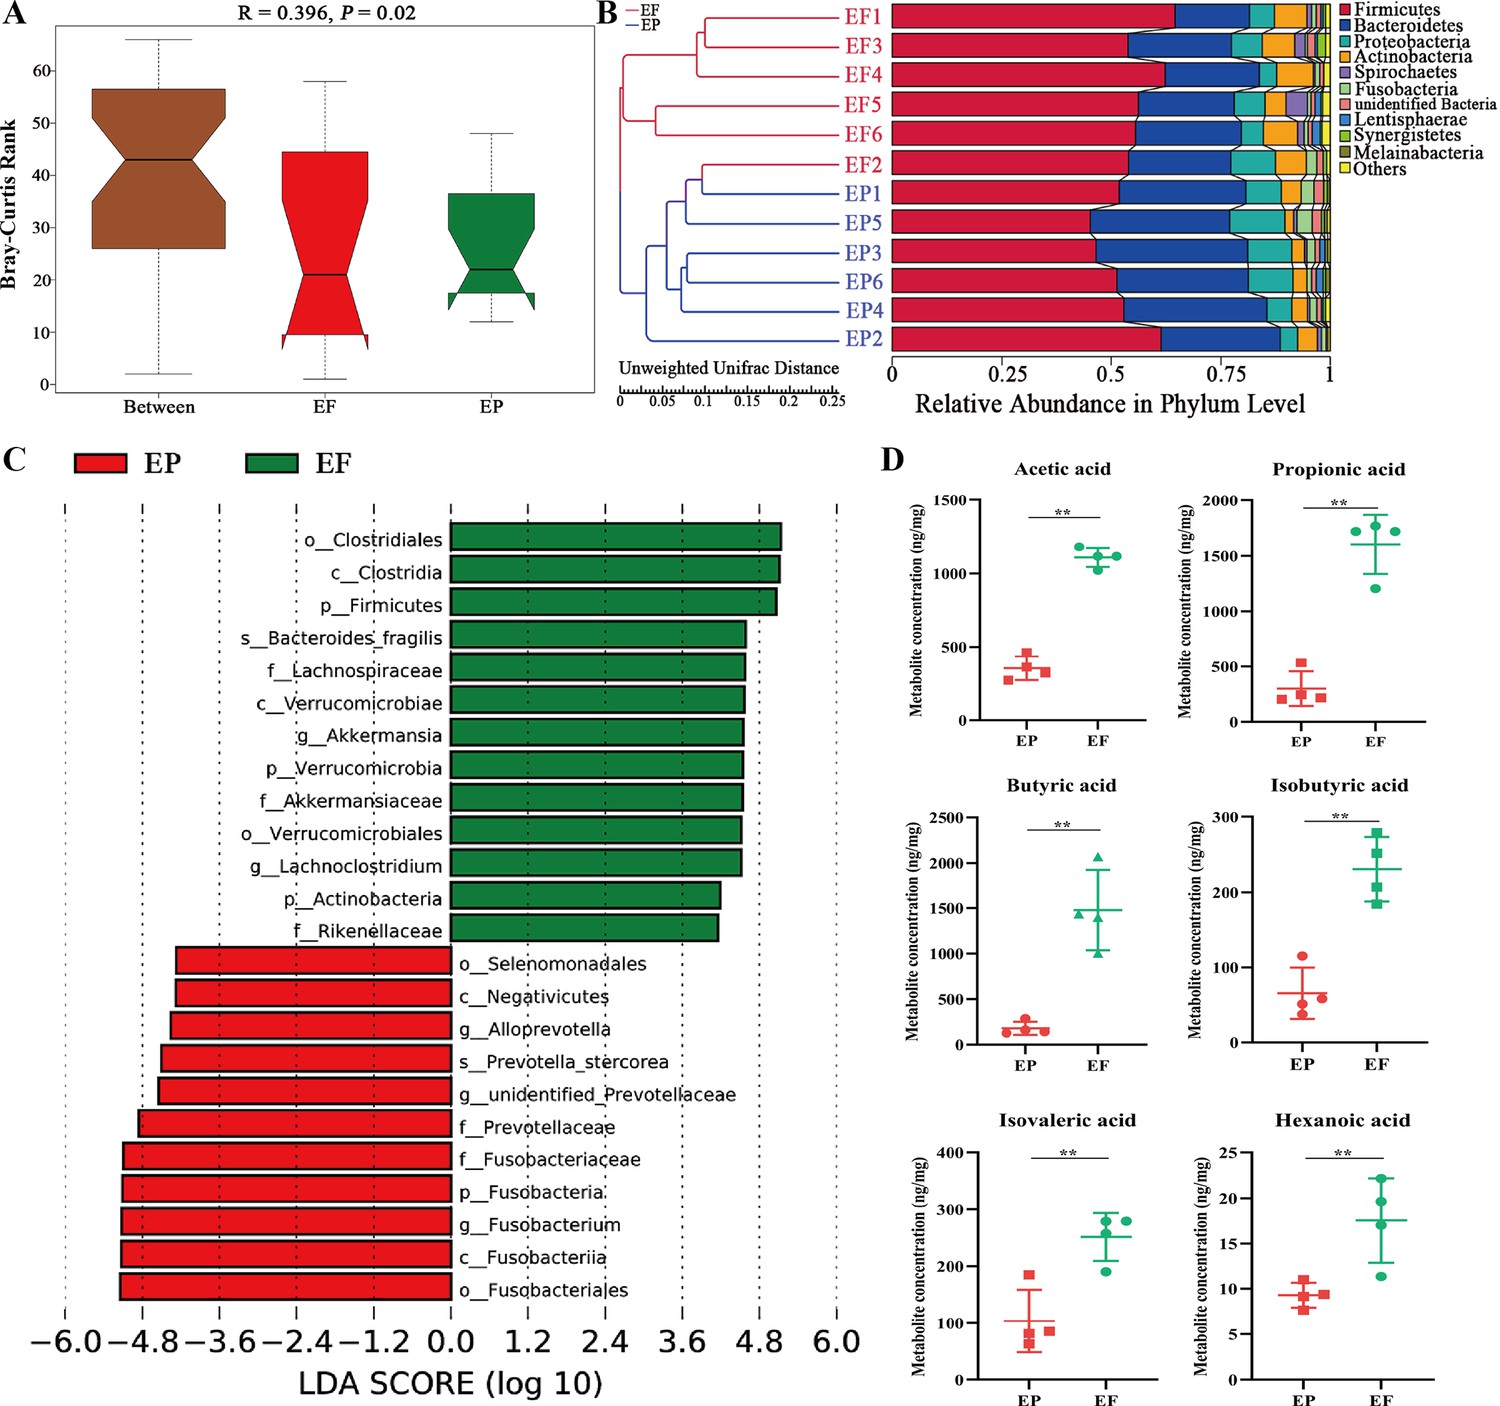
Fecal microbiota transplantation (FMT) changed the composition of gut microbiota and the concentration of short-chain fatty acid (SCFAs) in antibiotic-induced microbiome-disordered (AIMD) piglets infected with Enterotoxigenic Escherichia coli (ETEC) K88.
(A) Anosim analysis. (B) UPGMA clustering analysis based on Unweighted unifrac distance. (C) Linear effect size (LEfSe) analysis with linear discriminant analysis (LDA) score >4. (D) Quantification of short-chain fatty acid (SCFA) metabolites (acetic acid, propionic acid, butyric acid, isobutyric acid, isovaleric acid, and hexanoic acid). EP: ETEC K88 +PBS group, EF: ETEC K88 +FMT group. Data are expressed as the mean ± SD. *p<0.05, **p<0.01. Data shown are representative of at least two independent experiments.
Figure 4—figure supplement 1
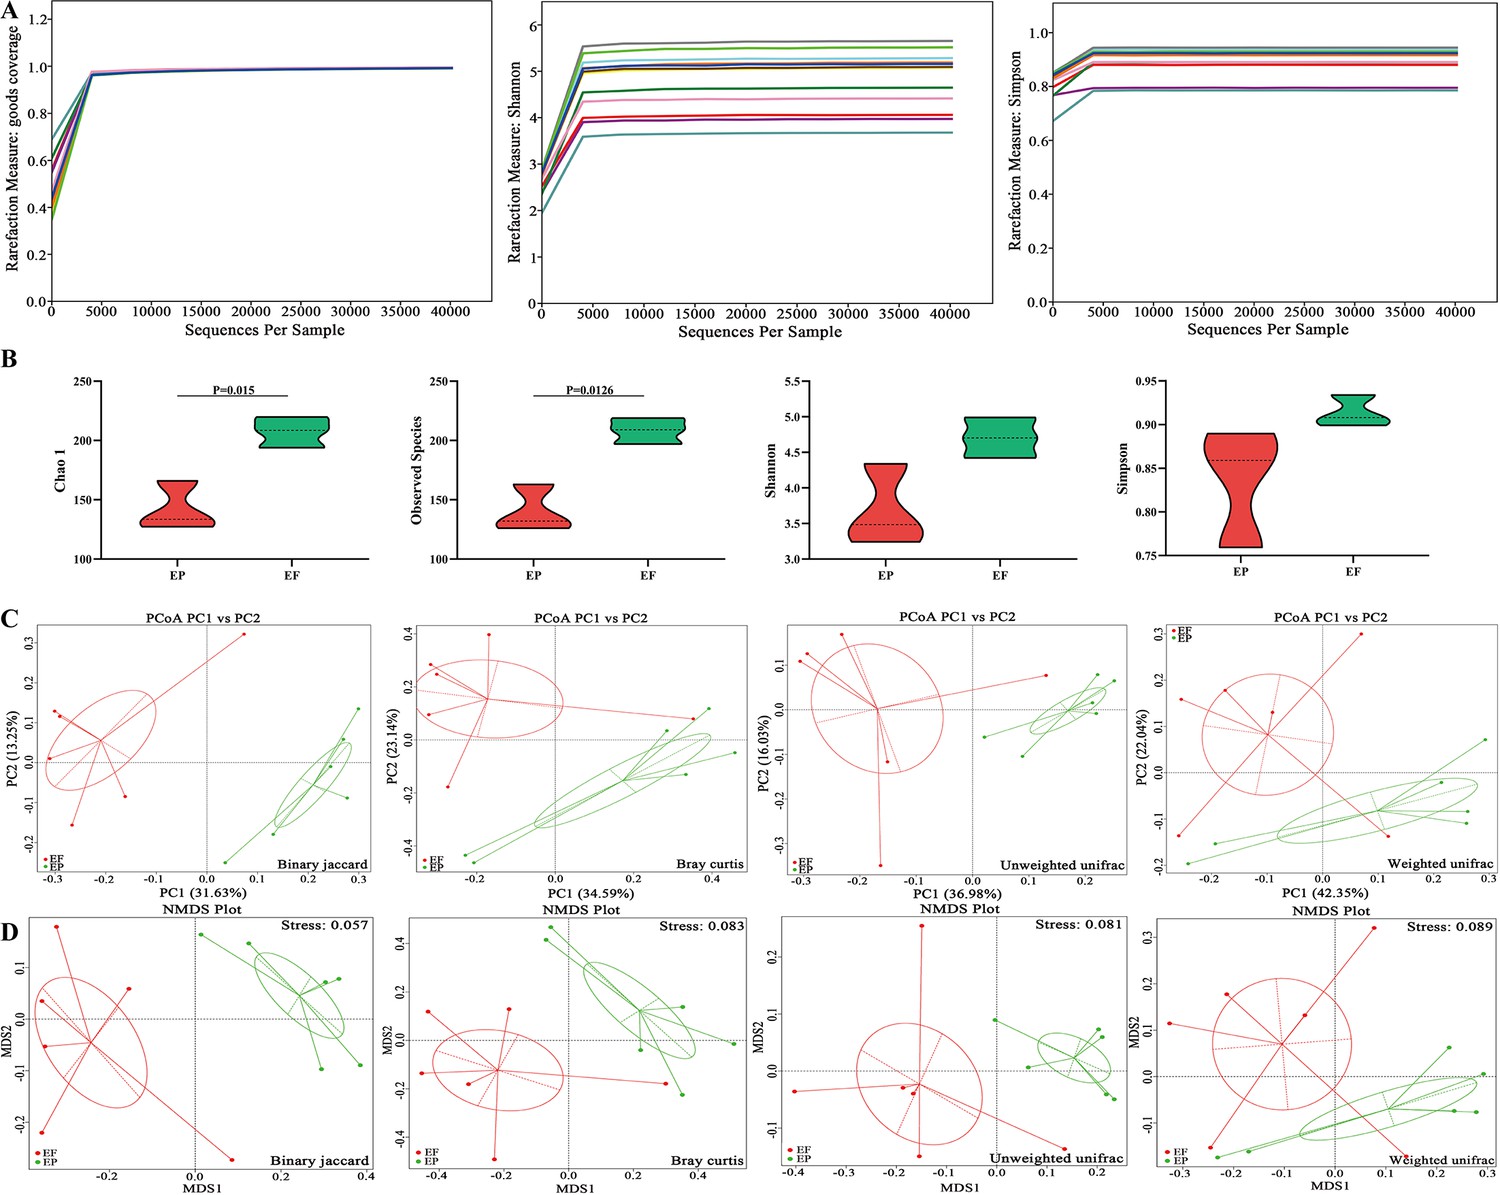
Fecal microbiota transplantation (FMT) altered the structure of gut microbiota in antibiotic-induced microbiome-disordered (AIMD) piglets infected with Enterotoxigenic Escherichia coli (ETEC) K88.
(A) Rarefaction curves based on goods coverage, Shannon and Simpson index. (B) Alpha diversity indexes (Chao 1, Observed spices, Shannon, and Simpson). (C) Principal coordinate analysis (PCoA) based on Binary jaccard, Bray curtis, Unweighted unifrac, and Weighted unifrac. (D) Non-metric multidimensional scaling (NMDS) analysis based on Binary jaccard, Bray curtis, Unweighted unifrac and Weighted unifrac. EP: ETEC K88 +PBS group, EF: ETEC K88 +FMT group.
Figure 5 with 1 supplement

A. muciniphila and B. fragilis improved the intestinal morphology of mice infected with Enterotoxigenic Escherichia coli (ETEC) K88.
(A) Hematoxylin-eosin (H&E)-stained images of jejunum (scale bars = 50 μm) and the histograms of villus height, crypt depth, and the ratio of villus height to crypt depth. (B) Transmission electron microscopy (TEM) images of jejunum and colon (scale bars = 0.5 μm). (C) Immunofluorescence images of Mucin 2 (MUC2, green) in the jejunum and colon (scale bars = 50 μm). (C: control group, E: ETEC K88 +PBS group, A: ETEC K88 +A). muciniphila group, B: ETEC K88 +B. fragilis group. Data are expressed as the mean ± SD. *p<0.05, **p<0.01, ***p<0.001. Data shown are representative of at least two independent experiments.
-
Figure 5—source data 1
The image files of hematoxylin-eosin (H&E) staining.
- https://cdn.elifesciences.org/articles/92906/elife-92906-fig5-data1-v1.zip
-
Figure 5—source data 2
The image files of transmission electron microscope.
- https://cdn.elifesciences.org/articles/92906/elife-92906-fig5-data2-v1.zip
-
Figure 5—source data 3
The image files of immunofluorescence (MUC2).
- https://cdn.elifesciences.org/articles/92906/elife-92906-fig5-data3-v1.zip
Figure 5—figure supplement 1

A. muciniphila and B. fragilis improved the weight and intestinal permeability of mice infected with Enterotoxigenic Escherichia coli (ETEC) K88.
(A) The body weight of mice. n=6. (B) The Escherichia coli (E. coli) translocation in tissues and organs of mice. (C) The concentrations of serum 4 kDa fluorescein isothiocyanate-dextran (FD4) in C, E, A, and B groups. (C: control group, E: ETEC K88 +PBS group, A: ETEC K88 +A). muciniphila group, B: ETEC K88 +B. fragilis group. Data are expressed as the mean ± SD. *p<0.05, **p<0.01, ***p<0.001.
Figure 6
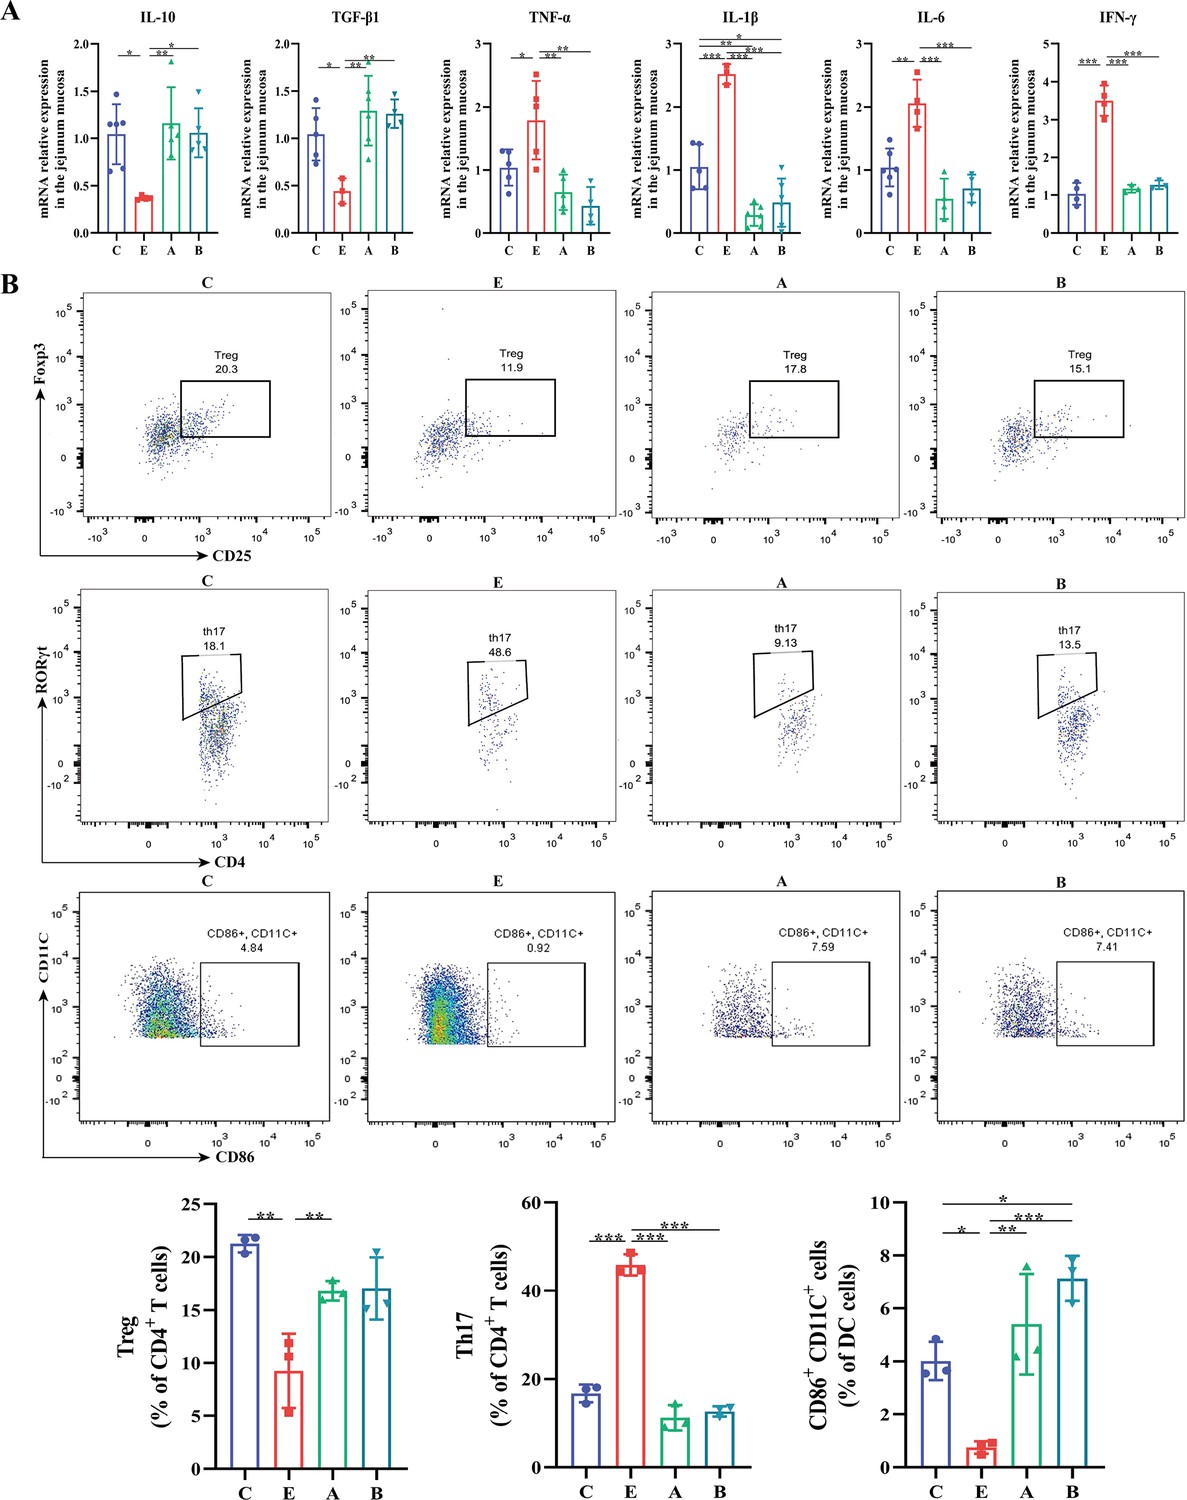
A. muciniphila and B. fragilis regulated the expression of inflammatory cytokines and the balance of Treg and Th17 cells in mice infected with Enterotoxigenic Escherichia coli (ETEC) K88.
(A) The relative mRNA expression of cytokines in the jejunum. (B) Flow cytometric dot plots and proportions of Treg (CD25+Foxp3+), Th17 (CD4+RORγt+) and mature dendritic cells (CD86+CD11C+) in jejunal lamina propria. (C: control group, E: ETEC K88 +PBS group, A: ETEC K88 +A). muciniphila group, B: ETEC K88 +B. fragilis group. Data are expressed as the mean ± SD. *p<0.05, **p<0.01, ***p<0.001. Data shown are representative of at least two independent experiments.
Figure 7
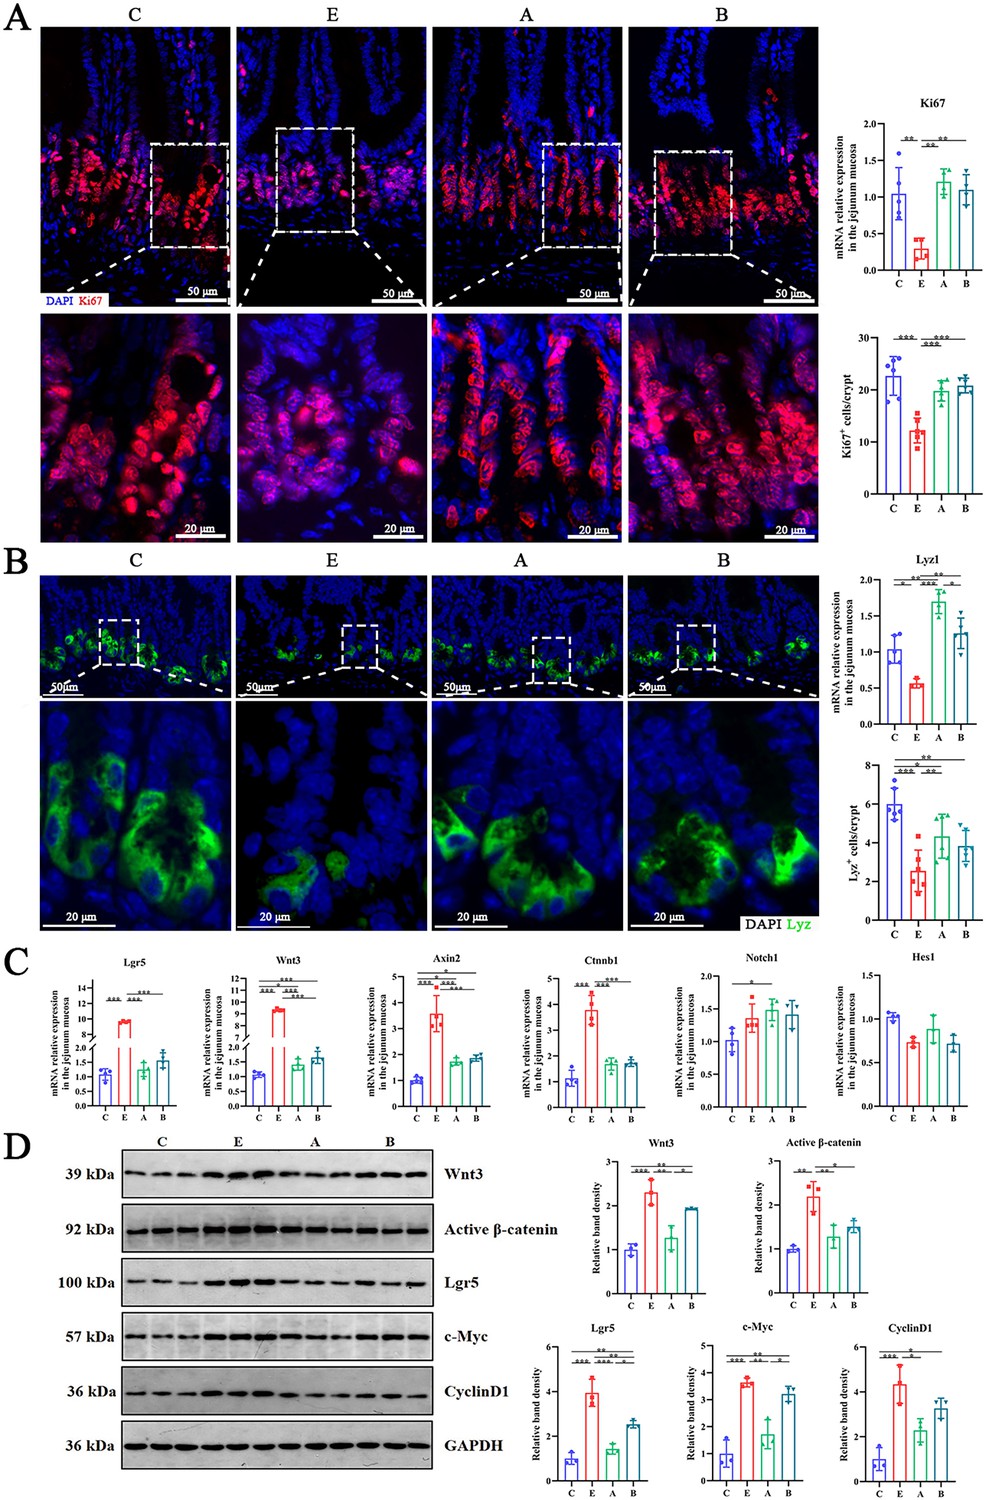
A. muciniphila and B. fragilis enhanced the number of Ki67 cells and Lyz Paneth cells in jejunal crypt of mice infected with Enterotoxigenic Escherichia coli (ETEC) K88 by moderately activating the Wnt/β-catenin pathway.
(A) The mRNA expression and immunofluorescence staining images of intestinal epithelial cell proliferation marker Ki67 (red). (B) The mRNA expression and immunofluorescence staining images of Paneth marker Lyz (green). (C) The relative mRNA expression of Lgr5, Wnt3, Notch1 and other genes in jejunum mucosa. (D) The relative protein expression of Wnt/β-catenin pathway and its target genes in jejunum mucosa. (C: control group, E: ETEC K88 +PBS group, A: ETEC K88 +A). muciniphila group, B: ETEC K88 +B. fragilis group. Data are expressed as the mean ± SD. *p<0.05, **p<0.01, ***p<0.001. Data shown are representative of at least two independent experiments.
-
Figure 7—source data 1
The image files of immunofluorescence (KI67 and LYZ).
- https://cdn.elifesciences.org/articles/92906/elife-92906-fig7-data1-v1.zip
-
Figure 7—source data 2
The image files of Western blot.
- https://cdn.elifesciences.org/articles/92906/elife-92906-fig7-data2-v1.zip
Figure 8
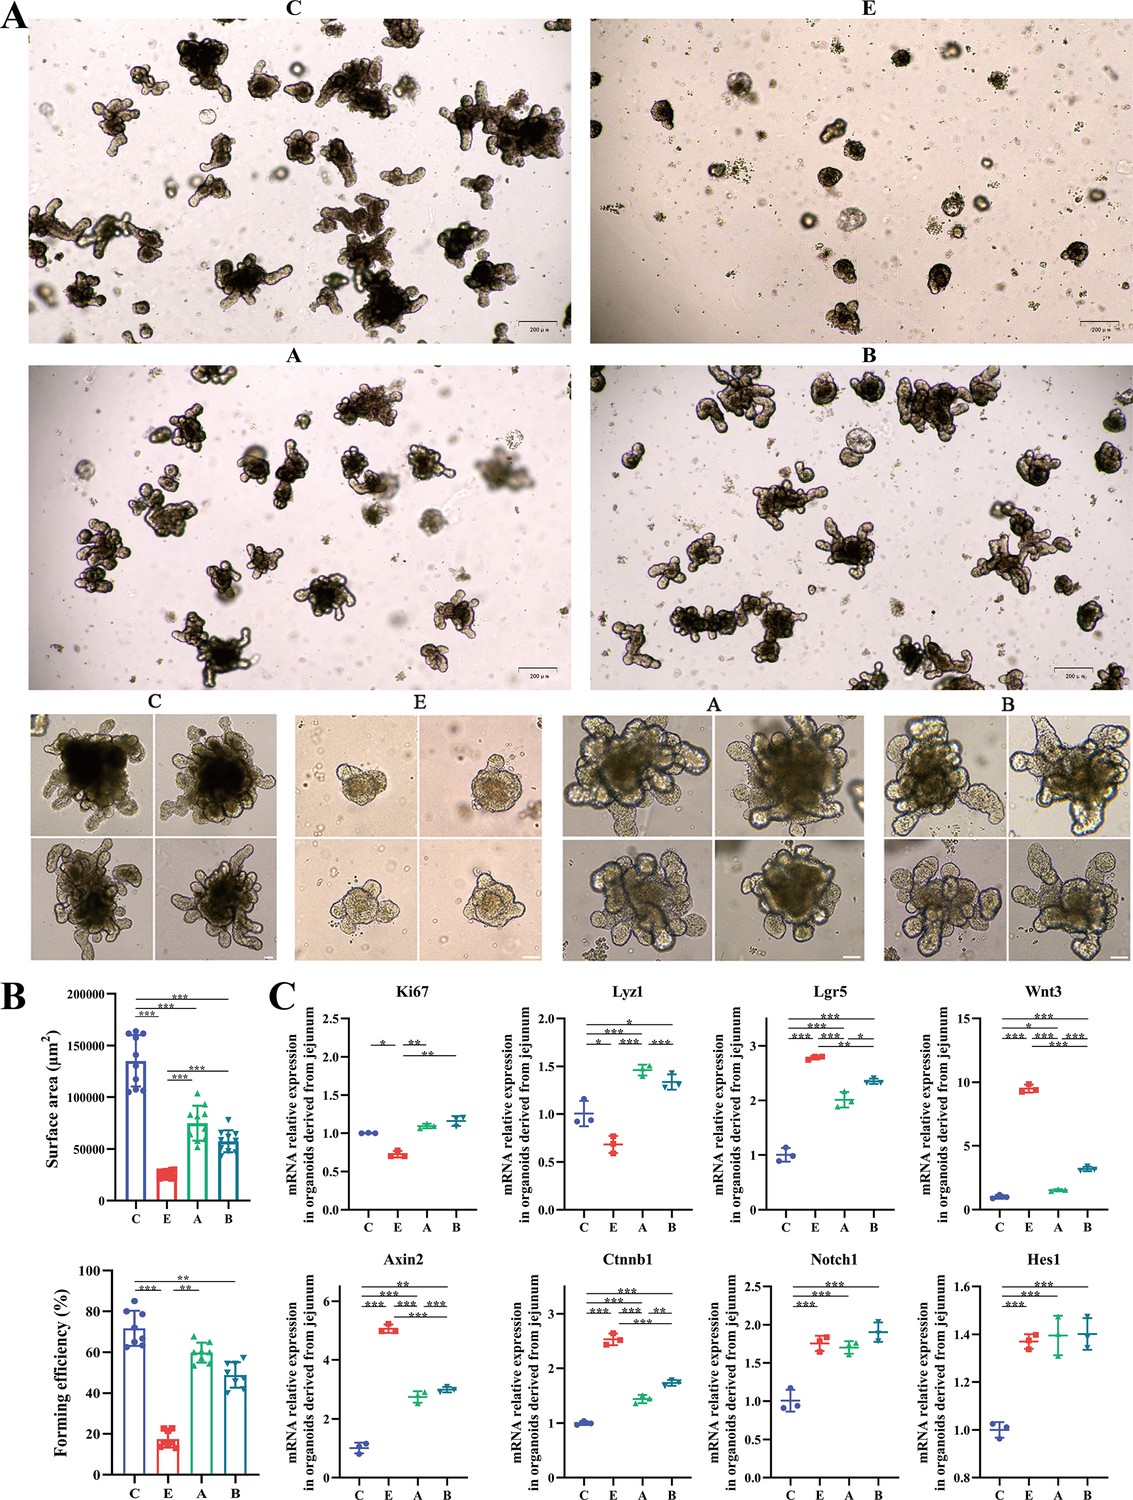
A. muciniphila and B. fragilis promoted the activity of Lgr5+ intestinal stem cells as proved by the growth of intestinal organoids.
(A) Morphology of ex vivo culture of crypts isolated from the jejunum of mice in the C, E, A, and B groups (Day 5; 4x, scale bars = 200 μm; 20x, scale bars = 50 μm). (B) The surface area and forming efficiency of intestinal organoids. (C) The relative mRNA expression of genes related to the proliferation and differentiation of the intestinal organoids. (C: control group, E: ETEC K88 +PBS group, A: ETEC K88 +A). muciniphila group, B: ETEC K88 +B. fragilis group. Data are expressed as the mean ± SD. *p<0.05, **p<0.01, ***p<0.001. Data shown are representative of at least two independent experiments.
Figure 9
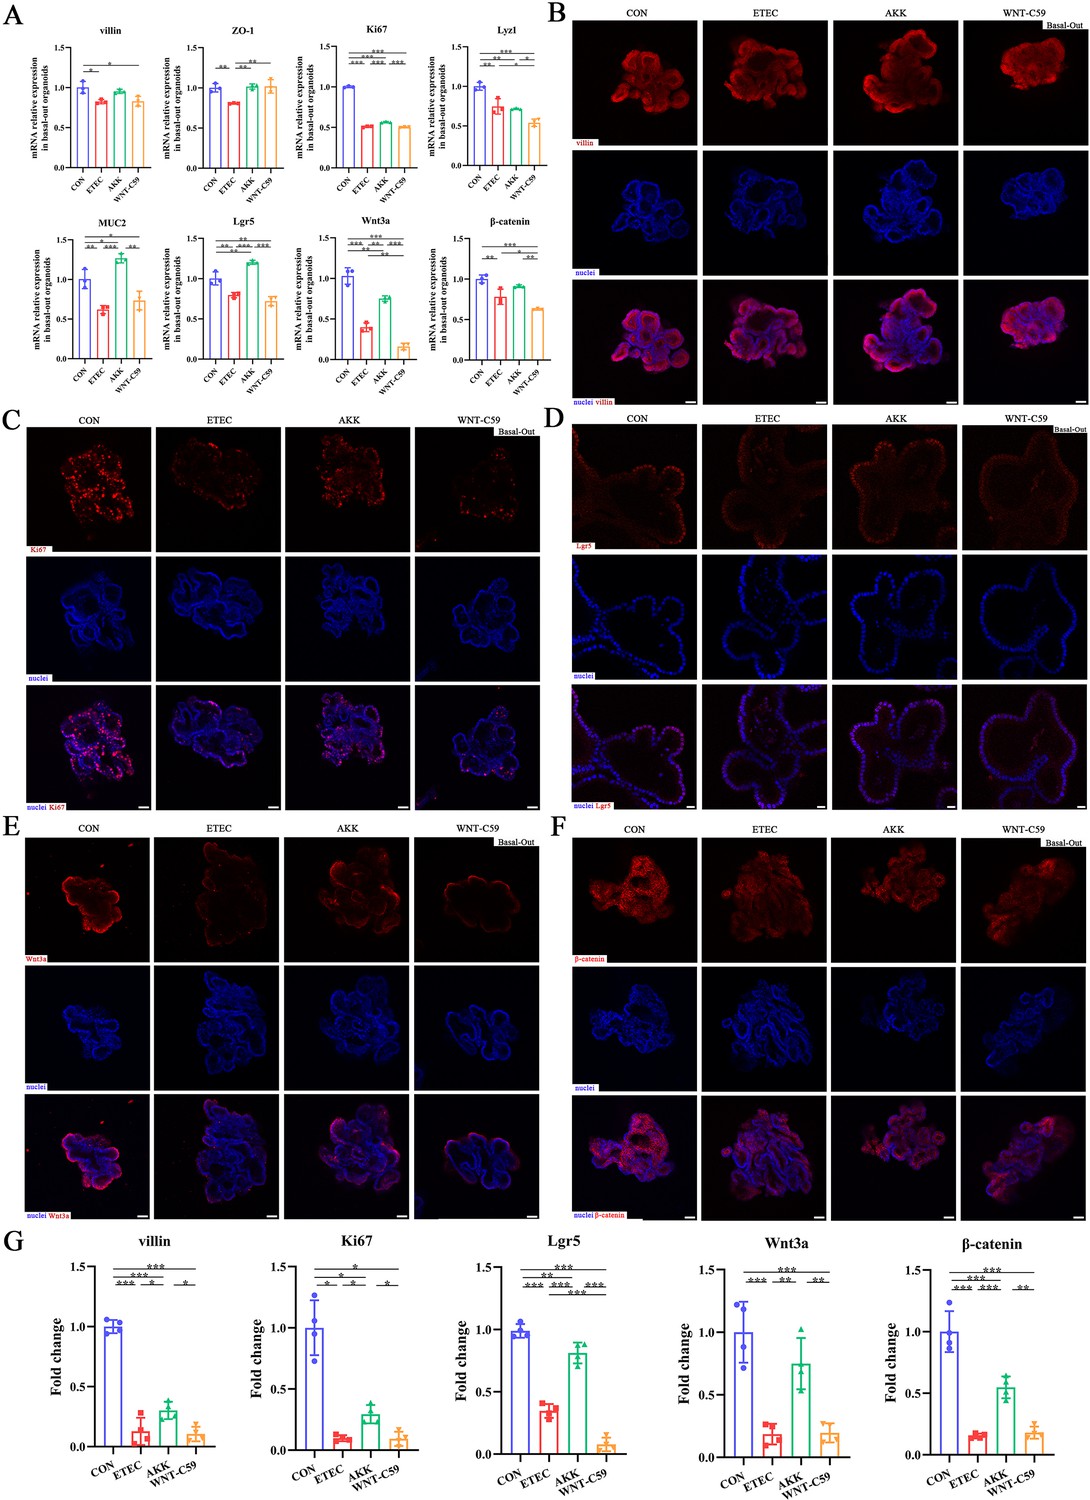
A. muciniphila protected the Lgr5+ intestinal stem cell and activated the Wnt/β-catenin signaling pathway of the Enterotoxigenic Escherichia coli (ETEC) K88-induced basal-out intestinal organoids.
(A) The relative mRNA expression of villin, ZO-1, Ki67, Lyz1, MUC2, Lgr5, Wnt3a and β-catenin genes. (B)-(F) Immunofluorescence images of villin (scale bars = 50 μm), Ki67 (scale bars = 50 μm), Lgr5 (scale bars = 20 μm), Wnt3a (scale bars = 50 μm), and β-catenin (scale bars = 50 μm). (G) Fold change of the mean fluorescence intensity. CON: control group, ETEC: ETEC K88 +DMEM/F-12 group, AKK: ETEC K88 +A. muciniphila group, WNT-C59: Wnt-C59 +ETEC K88+A. muciniphila group. Data are expressed as the mean ± SD. *p<0.05, **p<0.01, ***p<0.001. Data shown are representative of at least two independent experiments.
-
Figure 9—source data 1
The image files of immunofluorescence.
- https://cdn.elifesciences.org/articles/92906/elife-92906-fig9-data1-v1.zip
Figure 10 with 1 supplement
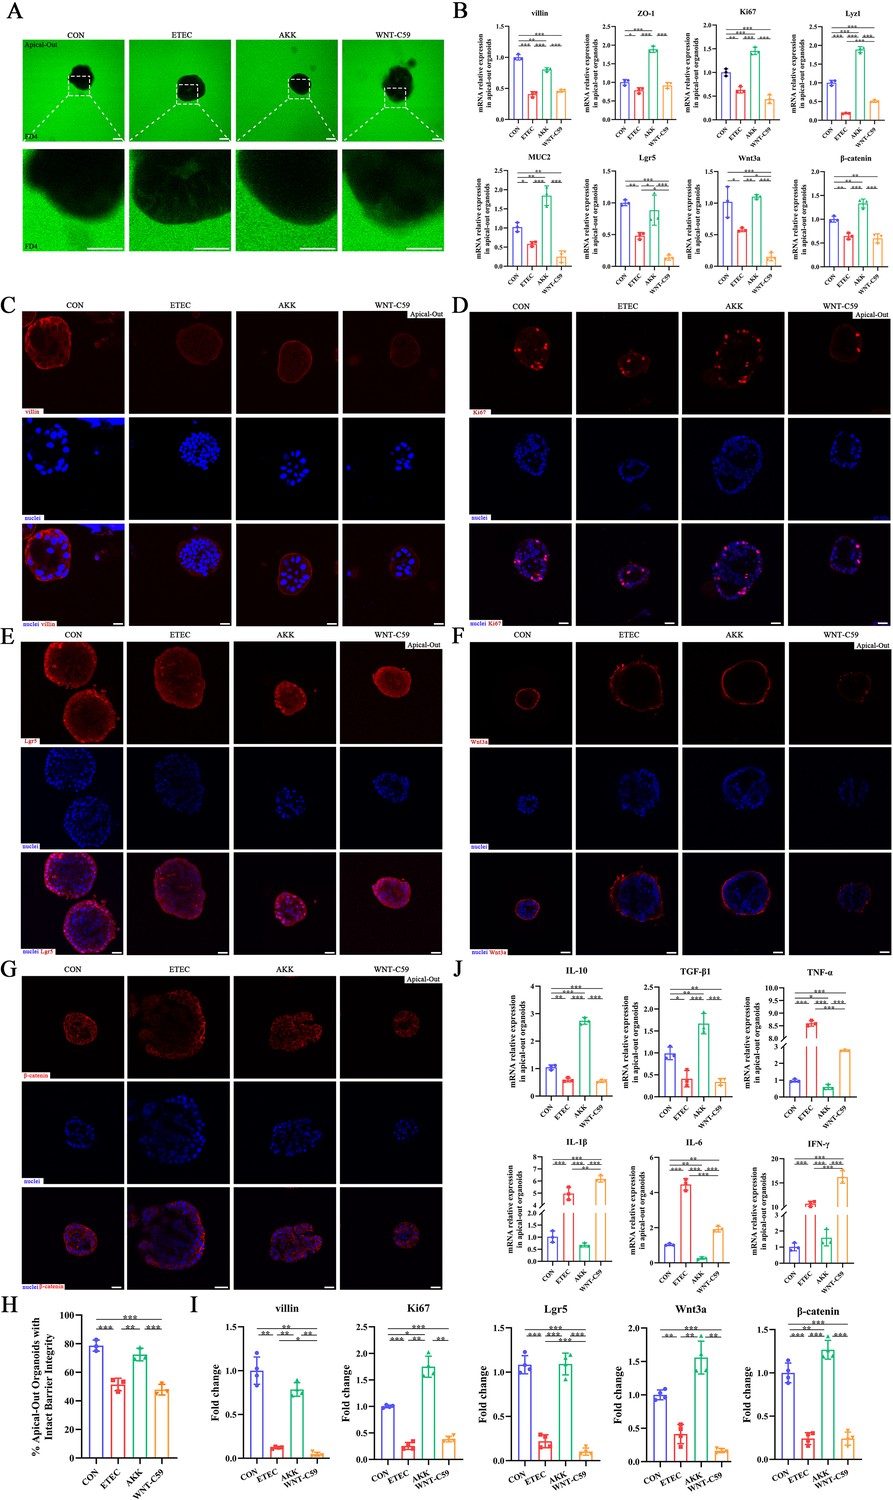
A. muciniphila alleviated the intestinal epithelial injury of the Enterotoxigenic Escherichia coli (ETEC) K88-induced apical-out intestinal organoids.
(A) Confocal microscope visualization of the apical-out intestinal organoids incubated in FD4 solution (scale bars = 50 μm). (B) The relative mRNA expression of villin, ZO-1, Ki67, Lyz1, MUC2, Lgr5, Wnt3a and β-catenin genes. (C)-(G) Immunofluorescence images of villin, Ki67, Lgr5, Wnt3a, and β-catenin (scale bars = 20 μm). (H) Quantification of the apical-out intestinal organoids incubated in FD4 solution that have intact barrier integrity. (I) Fold change of the mean fluorescence intensity. (J) The relative mRNA expression of cytokines in the apical-out intestinal organoids. CON: control group, ETEC: ETEC K88 +DMEM/F-12 group, AKK: ETEC K88 +A. muciniphila group, WNT-C59: Wnt-C59 +ETEC K88+A. muciniphila group. Data are expressed as the mean ± SD. *p<0.05, **p<0.01, ***p<0.001. Data shown are representative of at least two independent experiments.
-
Figure 10—source data 1
The image files of FD4.
- https://cdn.elifesciences.org/articles/92906/elife-92906-fig10-data1-v1.zip
-
Figure 10—source data 2
The image files of immunofluorescence.
- https://cdn.elifesciences.org/articles/92906/elife-92906-fig10-data2-v1.zip
Figure 10—figure supplement 1
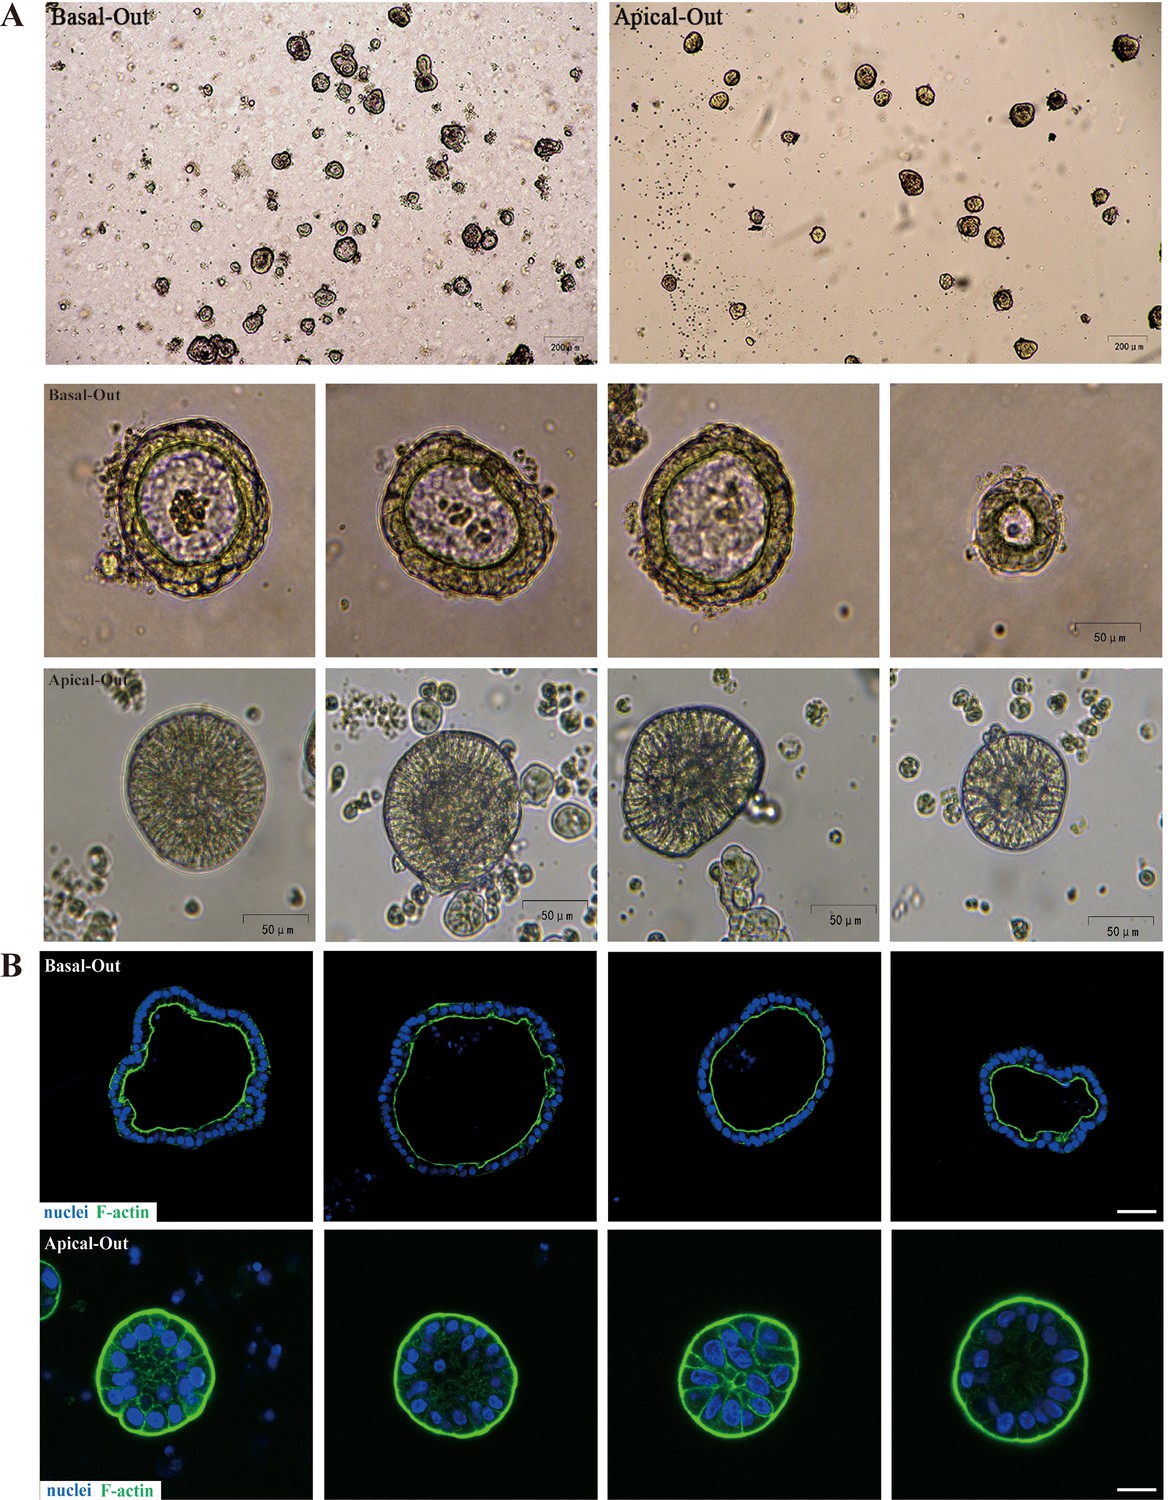
The construction of polar reversal intestinal organoids.
(A) Light microscope visualization of basal-out and apical-out organoids (4x, 20x). (B) Immunofluorescence images of F-actin in basal-out and apical-out intestinal organoids (scale bars = 20 μm).
Additional files
-
Supplementary file 1
Supplementary tables (1 a–1d) described throughout main text.
- https://cdn.elifesciences.org/articles/92906/elife-92906-supp1-v1.docx
Download links
A two-part list of links to download the article, or parts of the article, in various formats.
Downloads (link to download the article as PDF)
Open citations (links to open the citations from this article in various online reference manager services)
Cite this article (links to download the citations from this article in formats compatible with various reference manager tools)
Akkermansia muciniphila identified as key strain to alleviate gut barrier injury through Wnt signaling pathway
eLife 12:RP92906.
https://doi.org/10.7554/eLife.92906.5


